Embed Size (px)
Citation preview
Pathogen, indicator, & antibiotic resistant bacteria influenced by waste
residual land application
J. P. Brooks, M. R. McLaughlin, J.R. Read, & A. AdeliUSDA-ARS, Mississippi State, MS
Genetics and Precision Agriculture Unit
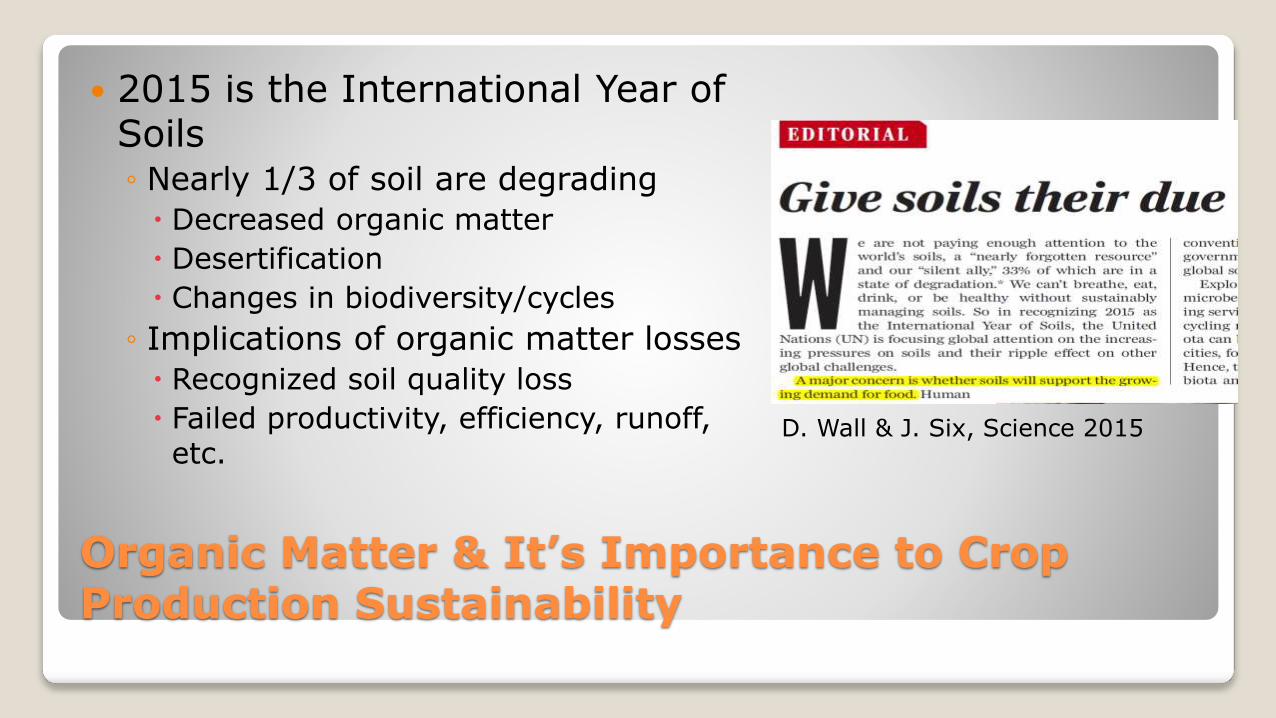
Organic Matter & It’s Importance to Crop Production Sustainability
2015 is the International Year of Soils◦ Nearly 1/3 of soil are degrading
Decreased organic matter
Desertification
Changes in biodiversity/cycles
◦ Implications of organic matter losses
Recognized soil quality loss
Failed productivity, efficiency, runoff, etc.
D. Wall & J. Six, Science 2015
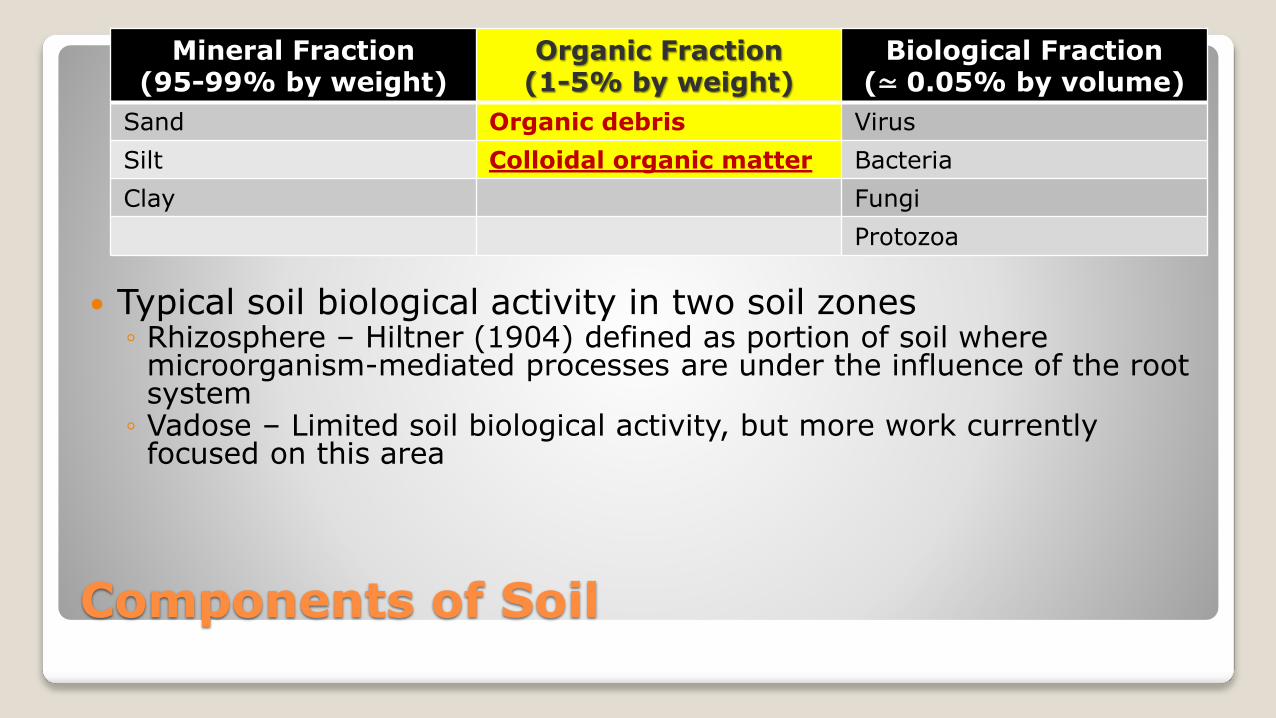
Components of Soil
Typical soil biological activity in two soil zones◦ Rhizosphere – Hiltner (1904) defined as portion of soil where
microorganism-mediated processes are under the influence of the root system
◦ Vadose – Limited soil biological activity, but more work currently focused on this area
Mineral Fraction(95-99% by weight)
Organic Fraction(1-5% by weight)
Biological Fraction(≃ 0.05% by volume)
Sand Organic debris Virus
Silt Colloidal organic matter Bacteria
Clay Fungi
Protozoa

Soil Biology – The Master of the Universe
Soil biology controls all aspects of soil health…◦ All aspects of plant health…
◦ All aspects of animal health…
◦ All aspects of human health…
Sources: Texas A&M, Plantdesigns.com, earthobservatory.nasa.gov
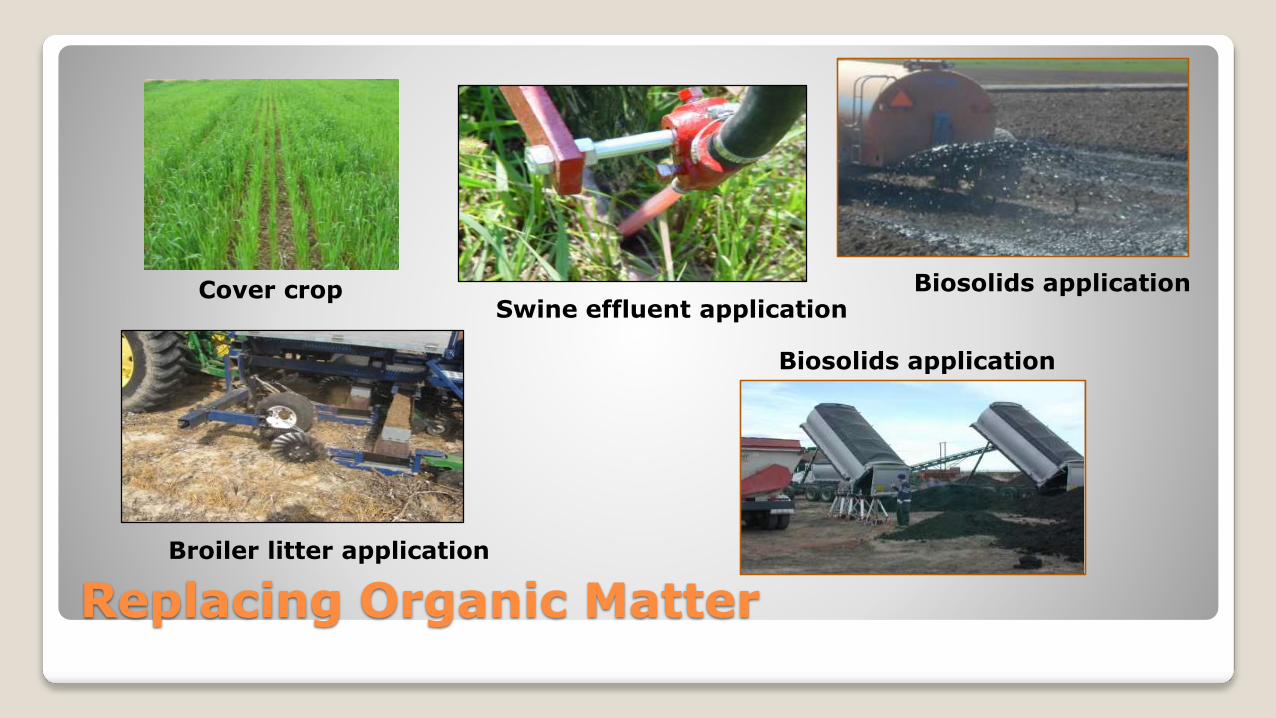
Replacing Organic Matter
Broiler litter application
Biosolids application
Swine effluent applicationBiosolids applicationCover crop
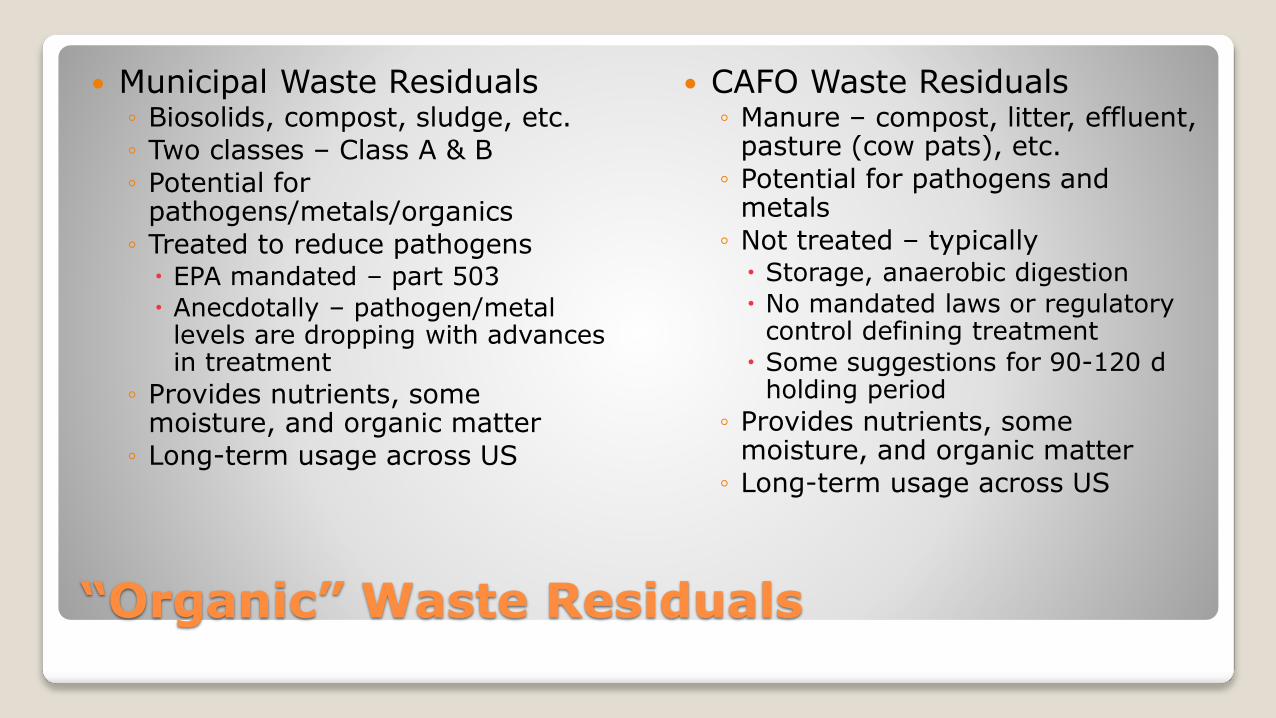
“Organic” Waste Residuals
Municipal Waste Residuals◦ Biosolids, compost, sludge, etc.
◦ Two classes – Class A & B
◦ Potential for pathogens/metals/organics
◦ Treated to reduce pathogens EPA mandated – part 503
Anecdotally – pathogen/metal levels are dropping with advances in treatment
◦ Provides nutrients, some moisture, and organic matter
◦ Long-term usage across US
CAFO Waste Residuals◦ Manure – compost, litter, effluent,
pasture (cow pats), etc.
◦ Potential for pathogens and metals
◦ Not treated – typically Storage, anaerobic digestion
No mandated laws or regulatory control defining treatment
Some suggestions for 90-120 d holding period
◦ Provides nutrients, some moisture, and organic matter
◦ Long-term usage across US
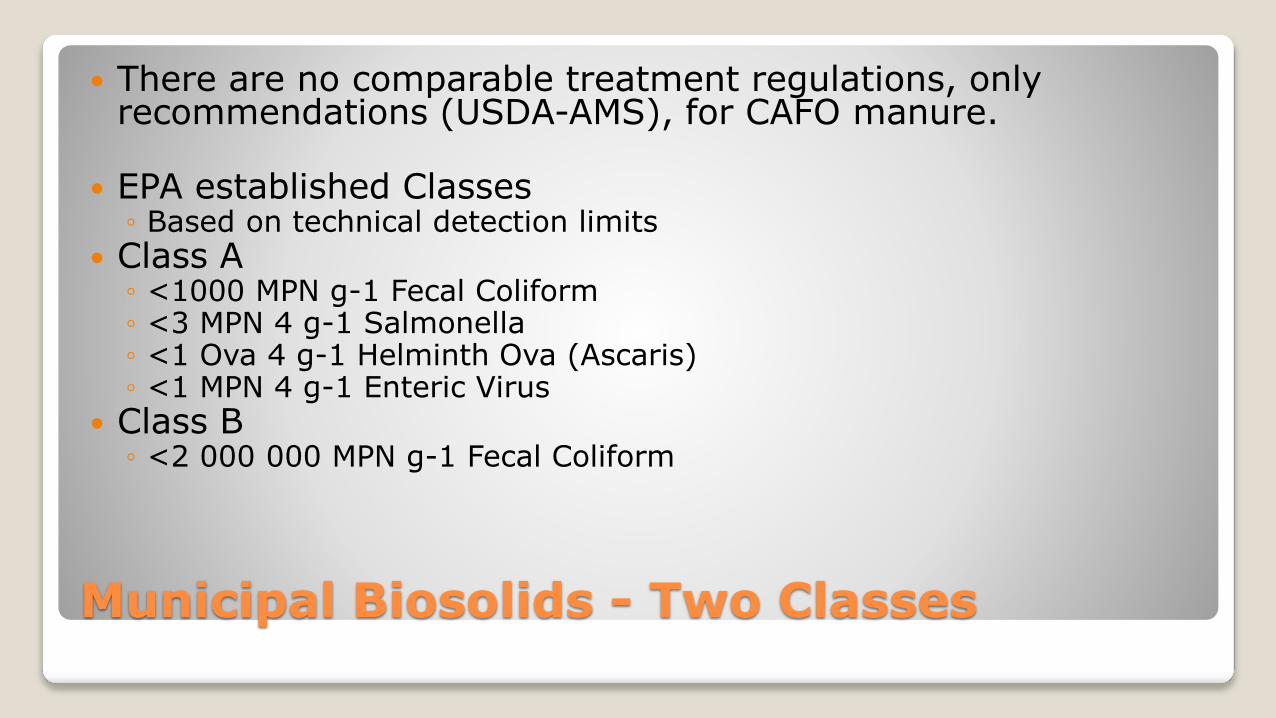
Municipal Biosolids - Two Classes
There are no comparable treatment regulations, only recommendations (USDA-AMS), for CAFO manure.
EPA established Classes◦ Based on technical detection limits
Class A◦ <1000 MPN g-1 Fecal Coliform◦ <3 MPN 4 g-1 Salmonella◦ <1 Ova 4 g-1 Helminth Ova (Ascaris)◦ <1 MPN 4 g-1 Enteric Virus
Class B◦ <2 000 000 MPN g-1 Fecal Coliform
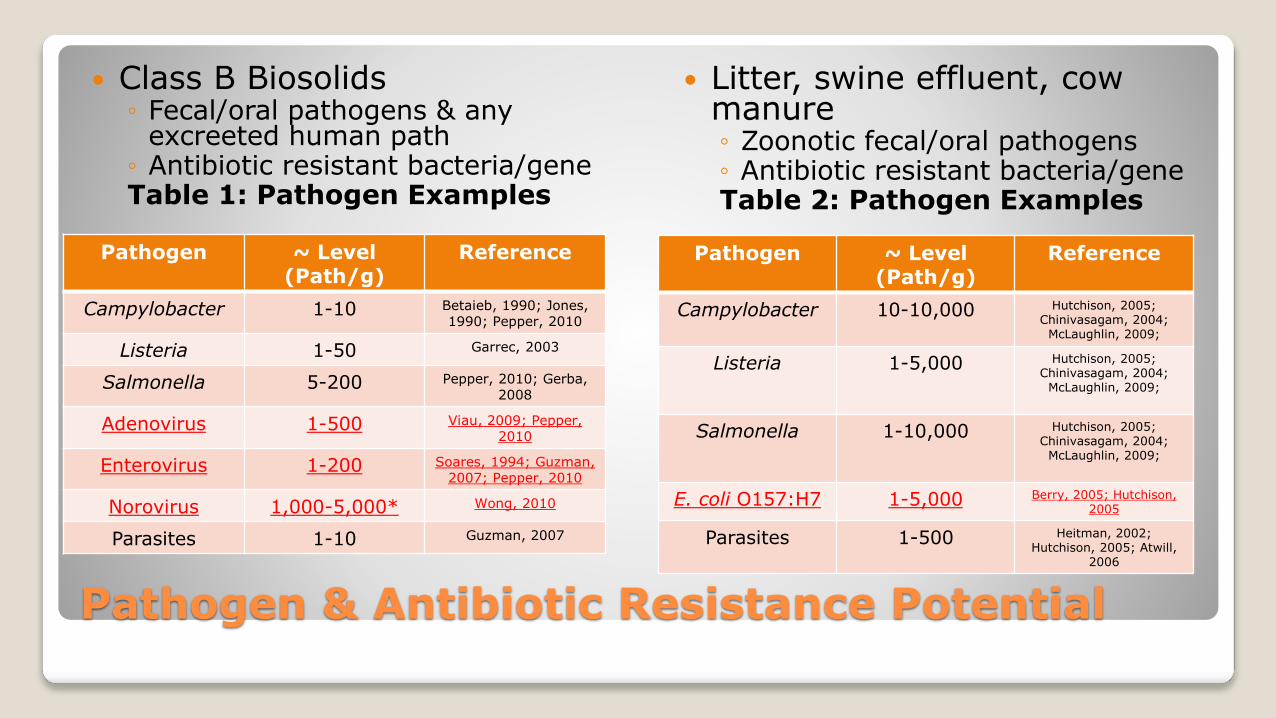
Pathogen & Antibiotic Resistance Potential
Class B Biosolids◦ Fecal/oral pathogens & any
excreeted human path◦ Antibiotic resistant bacteria/geneTable 1: Pathogen Examples
Litter, swine effluent, cow manure◦ Zoonotic fecal/oral pathogens◦ Antibiotic resistant bacteria/geneTable 2: Pathogen Examples
Pathogen ~ Level (Path/g)
Reference
Campylobacter 1-10 Betaieb, 1990; Jones, 1990; Pepper, 2010
Listeria 1-50 Garrec, 2003
Salmonella 5-200 Pepper, 2010; Gerba, 2008
Adenovirus 1-500 Viau, 2009; Pepper, 2010
Enterovirus 1-200 Soares, 1994; Guzman, 2007; Pepper, 2010
Norovirus 1,000-5,000* Wong, 2010
Parasites 1-10 Guzman, 2007
Pathogen ~ Level (Path/g)
Reference
Campylobacter 10-10,000 Hutchison, 2005; Chinivasagam, 2004;
McLaughlin, 2009;
Listeria 1-5,000 Hutchison, 2005; Chinivasagam, 2004;
McLaughlin, 2009;
Salmonella 1-10,000 Hutchison, 2005; Chinivasagam, 2004;
McLaughlin, 2009;
E. coli O157:H7 1-5,000 Berry, 2005; Hutchison, 2005
Parasites 1-500 Heitman, 2002;Hutchison, 2005; Atwill,
2006
Need for the Study
Current research lacks true comparisons between manures & between manures/biosolids, no comparisons of risk
◦ No comparisons from a pathogen standpoint or ecological/agronomic
◦ Research by Brooks, Pepper, Viau, Peccia, Gerba, Sorber, Hutchison, McLaughlin, etc. have focused on one waste
◦ Purpose of this study, to facilitate a comparison at field and bench scales Multiple year, multiple studies at bench and small plot scale Focus – Pathogens, Indicators, Antibiotic Resistance, Ecology, Plant,
Nutrients
Approach
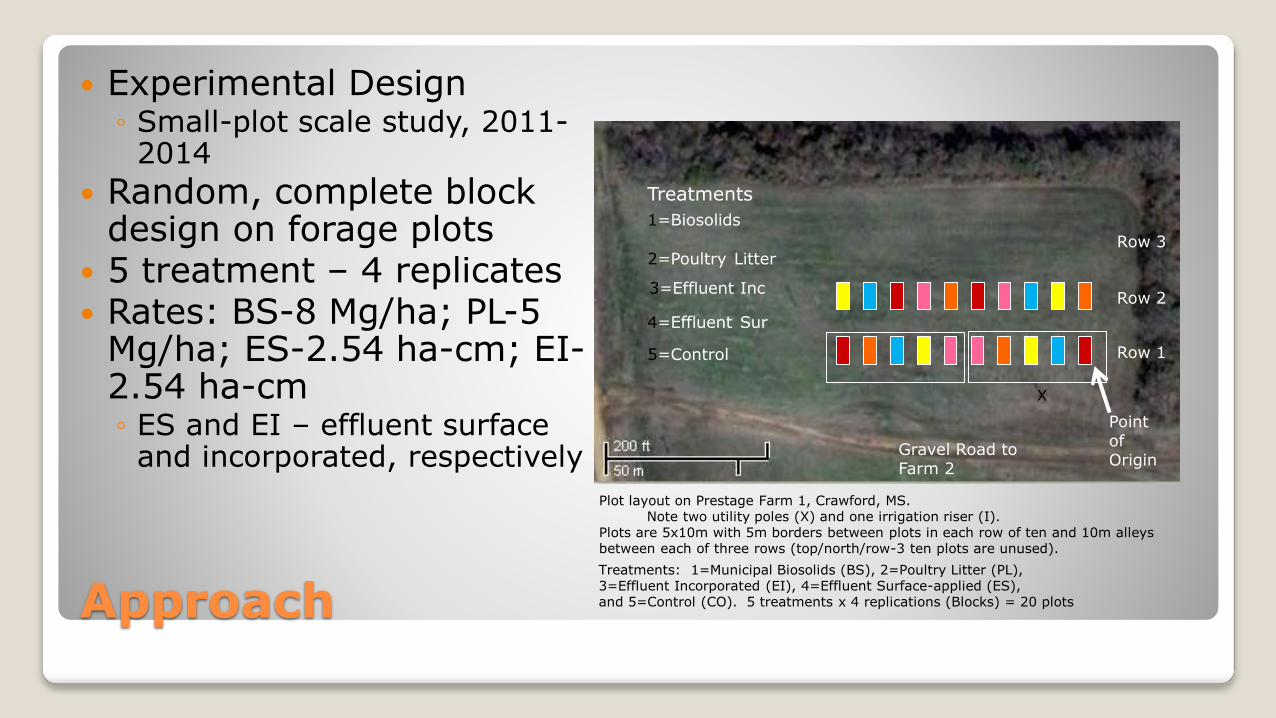
Experimental Design◦ Small-plot scale study, 2011-
2014
Random, complete block design on forage plots
5 treatment – 4 replicates Rates: BS-8 Mg/ha; PL-5
Mg/ha; ES-2.54 ha-cm; EI-2.54 ha-cm◦ ES and EI – effluent surface
and incorporated, respectively
Plot layout on Prestage Farm 1, Crawford, MS. Note two utility poles (X) and one irrigation riser (I).
Plots are 5x10m with 5m borders between plots in each row of ten and 10m alleys between each of three rows (top/north/row-3 ten plots are unused).
Treatments: 1=Municipal Biosolids (BS), 2=Poultry Litter (PL), 3=Effluent Incorporated (EI), 4=Effluent Surface-applied (ES), and 5=Control (CO). 5 treatments x 4 replications (Blocks) = 20 plots
X
1=Biosolids
2=Poultry Litter
3=Effluent Inc
4=Effluent Sur
5=Control
Treatments
Row 3
Point of Origin
Row 2
Row 1
Gravel Road to Farm 2
Approach
Microbial Assays◦ 5 random soil cores (0-10 cm) were collected & homogenized
Targeted samples to locations where residuals were located
◦ Moisture content and 10 g aliquot, stomaching/95 ml saline, serial 10 fold dilutions, ~10 g frozen
◦ Heterotrophic plate count (HPC), Gram + (GPB), Gram – (GNB), Clostridium perfringens (Cp)
◦ E. coli, Listeria, Salmonella, & Campylobacter - Presence absence in 10 g soil/95 ml enrichment medium
Approach
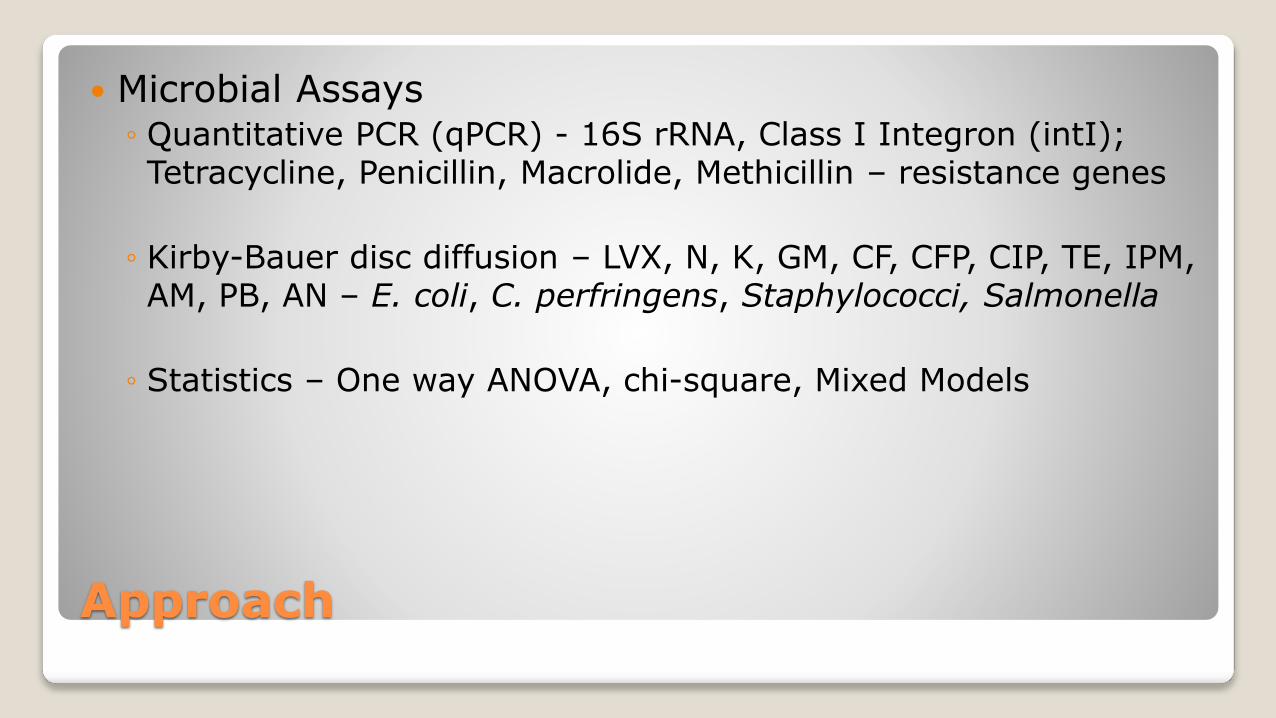
Microbial Assays◦ Quantitative PCR (qPCR) - 16S rRNA, Class I Integron (intI); Tetracycline, Penicillin, Macrolide, Methicillin – resistance genes
◦ Kirby-Bauer disc diffusion – LVX, N, K, GM, CF, CFP, CIP, TE, IPM, AM, PB, AN – E. coli, C. perfringens, Staphylococci, Salmonella
◦ Statistics – One way ANOVA, chi-square, Mixed Models
Results
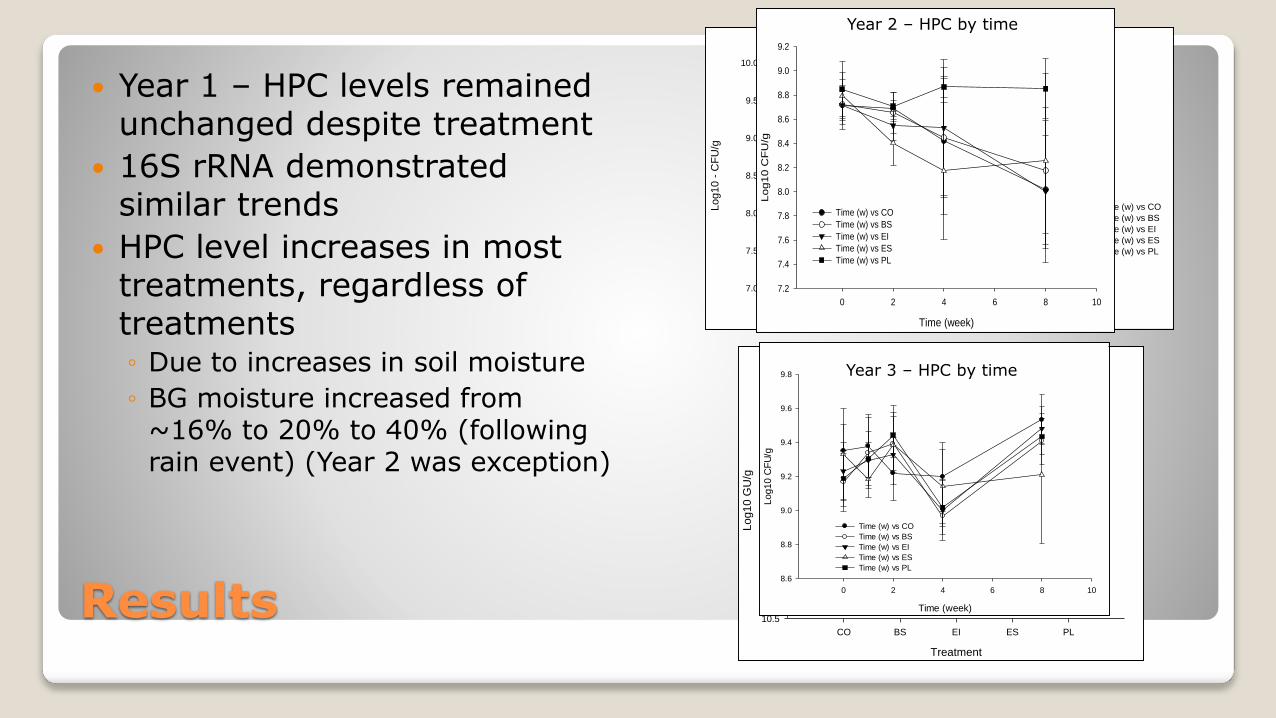
Year 1 – HPC levels remained unchanged despite treatment
16S rRNA demonstrated similar trends
HPC level increases in most treatments, regardless of treatments◦ Due to increases in soil moisture
◦ BG moisture increased from ~16% to 20% to 40% (following rain event) (Year 2 was exception)
Time (week)
-4 -2 0 2 4 6 8 10 12 14 16
Lo
g10
- C
FU
/g
7.0
7.5
8.0
8.5
9.0
9.5
10.0
Time (w) vs CO
Time (w) vs BS
Time (w) vs EI
Time (w) vs ES
Time (w) vs PL
Year 1 – HPC by time
Treatment
CO BS EI ES PL
Lo
g10
GU
/g
10.5
11.0
11.5
12.0
12.5
13.0
13.5 Year 1 – 16S rRNA
Time (week)
0 2 4 6 8 10
Lo
g10
CF
U/g
7.2
7.4
7.6
7.8
8.0
8.2
8.4
8.6
8.8
9.0
9.2
Time (w) vs CO
Time (w) vs BS
Time (w) vs EI
Time (w) vs ES
Time (w) vs PL
Year 2 – HPC by time
Time (week)
0 2 4 6 8 10
Log10 C
FU
/g
8.6
8.8
9.0
9.2
9.4
9.6
9.8
Time (w) vs CO
Time (w) vs BS
Time (w) vs EI
Time (w) vs ES
Time (w) vs PL
Year 3 – HPC by time
Time (week)
-4 -2 0 2 4 6 8 10 12 14 16
Log10 C
FU
/g
3.5
4.0
4.5
5.0
5.5
6.0
6.5
7.0
7.5
Col 16 vs Col 18
Col 16 vs Col 17
Col 16 vs Col 19
Col 16 vs Col 20
Col 16 vs Col 21
Results
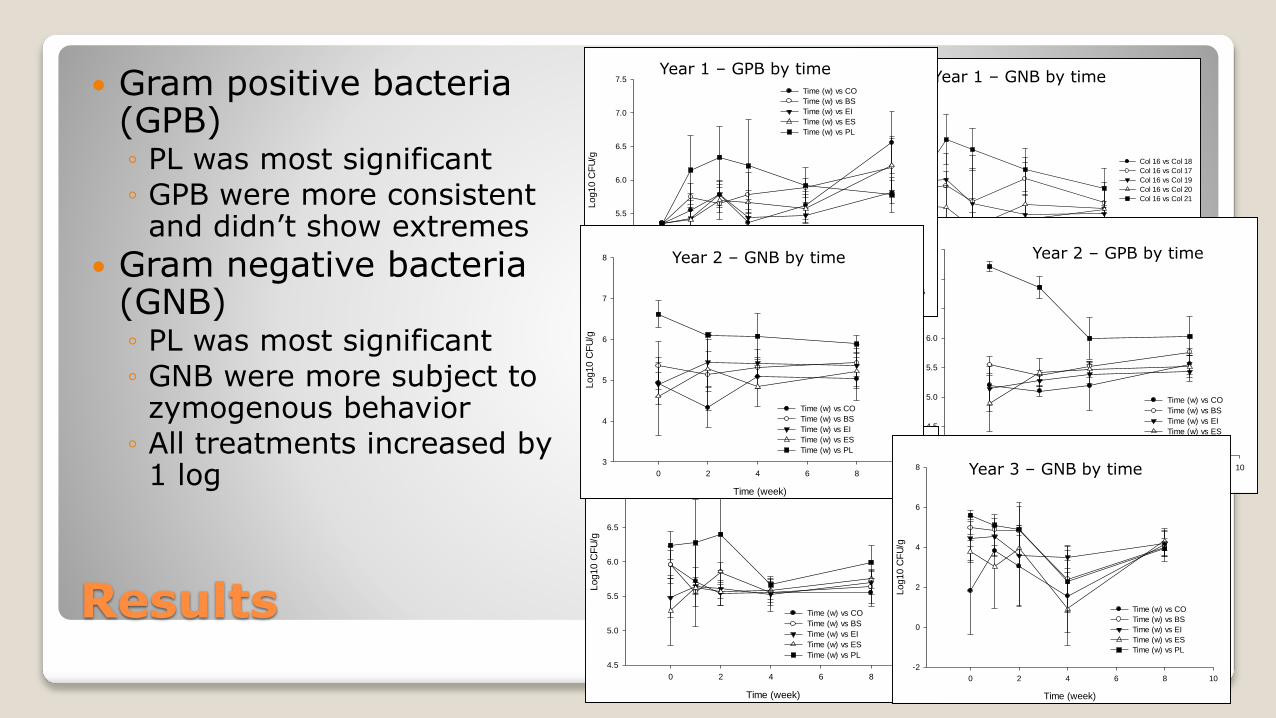
Gram positive bacteria (GPB)◦ PL was most significant
◦ GPB were more consistent and didn’t show extremes
Gram negative bacteria (GNB)◦ PL was most significant
◦ GNB were more subject to zymogenous behavior
◦ All treatments increased by 1 log
Year 1 – GNB by time
Year 2 – GNB by time Time (week)
0 2 4 6 8 10
Log10 C
FU
/g
4.0
4.5
5.0
5.5
6.0
6.5
7.0
7.5
Time (w) vs CO
Time (w) vs BS
Time (w) vs EI
Time (w) vs ES
Time (w) vs PL
Year 2 – GPB by time
Time (week)
-4 -2 0 2 4 6 8 10 12 14 16
Log10 C
FU
/g
4.5
5.0
5.5
6.0
6.5
7.0
7.5
Time (w) vs CO
Time (w) vs BS
Time (w) vs EI
Time (w) vs ES
Time (w) vs PL
Year 1 – GPB by time
Time (week)
0 2 4 6 8 10
Log10 C
FU
/g
4.5
5.0
5.5
6.0
6.5
7.0
7.5
Time (w) vs CO
Time (w) vs BS
Time (w) vs EI
Time (w) vs ES
Time (w) vs PL
Year 3 – GPB by time
Time (week)
0 2 4 6 8 10
Log10 C
FU
/g
3
4
5
6
7
8
Time (w) vs CO
Time (w) vs BS
Time (w) vs EI
Time (w) vs ES
Time (w) vs PL
Year 2 – GNB by time
Time (week)
0 2 4 6 8 10
Log10 C
FU
/g
-2
0
2
4
6
8
Time (w) vs CO
Time (w) vs BS
Time (w) vs EI
Time (w) vs ES
Time (w) vs PL
Year 3 – GNB by time
Results
Time (week)
-4 -2 0 2 4 6 8 10 12 14 16
Log10 C
FU
/g
-1
0
1
2
3
4
5
Time (w) vs CO
Time (w) vs BS
Time (w) vs EI
Time (w) vs ES
Time (w) vs PL
Year 1 – Cp by time
Time (week)
0 2 4 6 8 10
Log10 C
FU
/g
-1
0
1
2
3
4
5Time (w) vs CO
Time (w) vs BS
Time (w) vs EI
Time (w) vs ES
Time (w) vs PL
Year 2 – Cp by time
Time (week)
0 2 4 6 8 10
Log10 C
FU
/g
0
1
2
3
4
5 Time (w) vs CO
Time (w) vs BS
Time (w) vs EI
Time (w) vs ES
Time (w) vs PL
Year 3 – Cp by time
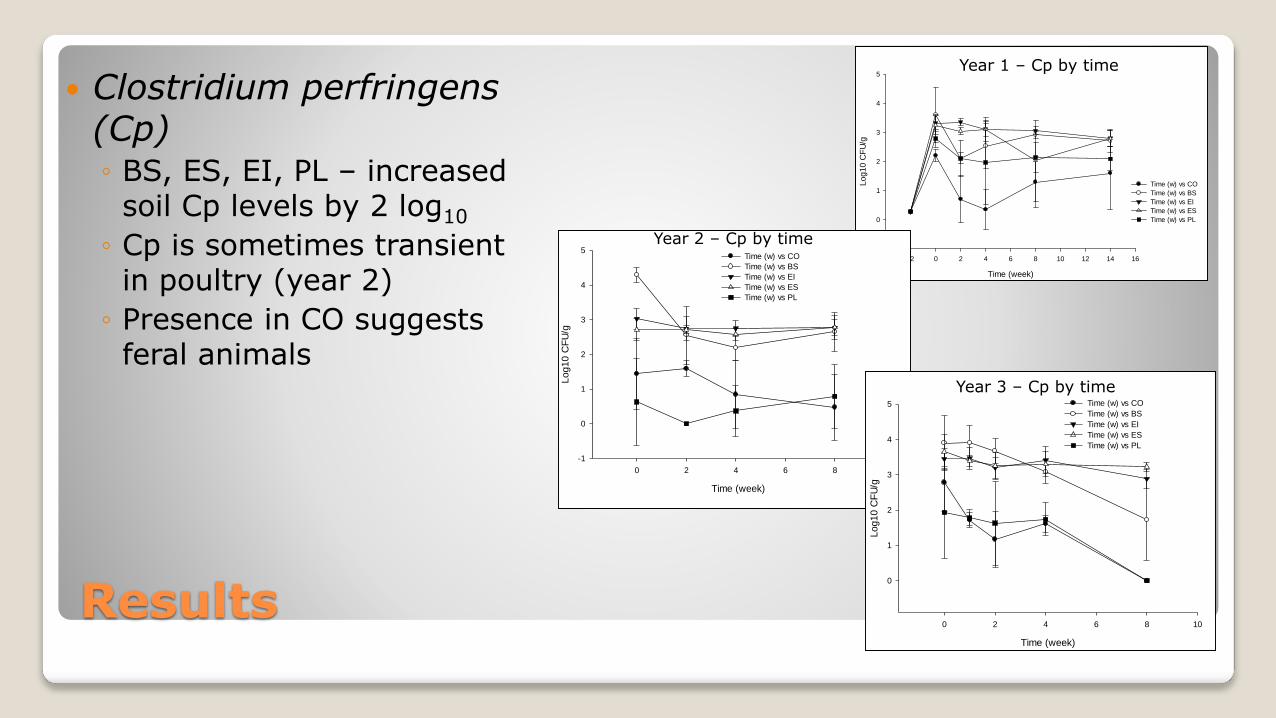
Clostridium perfringens(Cp)◦ BS, ES, EI, PL – increased
soil Cp levels by 2 log10
◦ Cp is sometimes transient in poultry (year 2)
◦ Presence in CO suggests feral animals
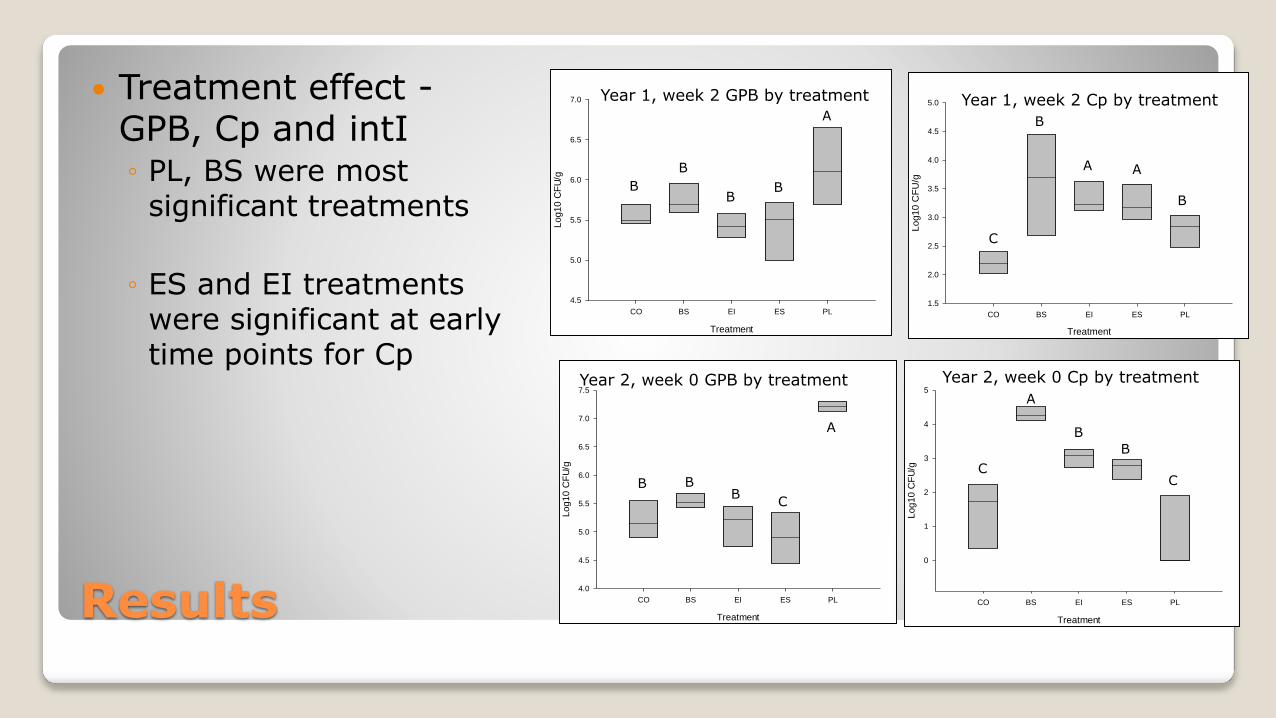
Results
Treatment effect -GPB, Cp and intI◦ PL, BS were most
significant treatments
◦ ES and EI treatments were significant at early time points for Cp
Treatment
CO BS EI ES PL
Log10 C
FU
/g
4.5
5.0
5.5
6.0
6.5
7.0 Year 1, week 2 GPB by treatment
A
BB
B
B
Treatment
CO BS EI ES PL
Lo
g10
CF
U/g
1.5
2.0
2.5
3.0
3.5
4.0
4.5
5.0 Year 1, week 2 Cp by treatment
C
B
A A
B
Treatment
CO BS EI ES PL
Log10 C
FU
/g
4.0
4.5
5.0
5.5
6.0
6.5
7.0
7.5Year 2, week 0 GPB by treatment
B BB
A
C
Treatment
CO BS EI ES PL
Log10 C
FU
/g
0
1
2
3
4
5
Year 2, week 0 Cp by treatment
A
B
CC
B
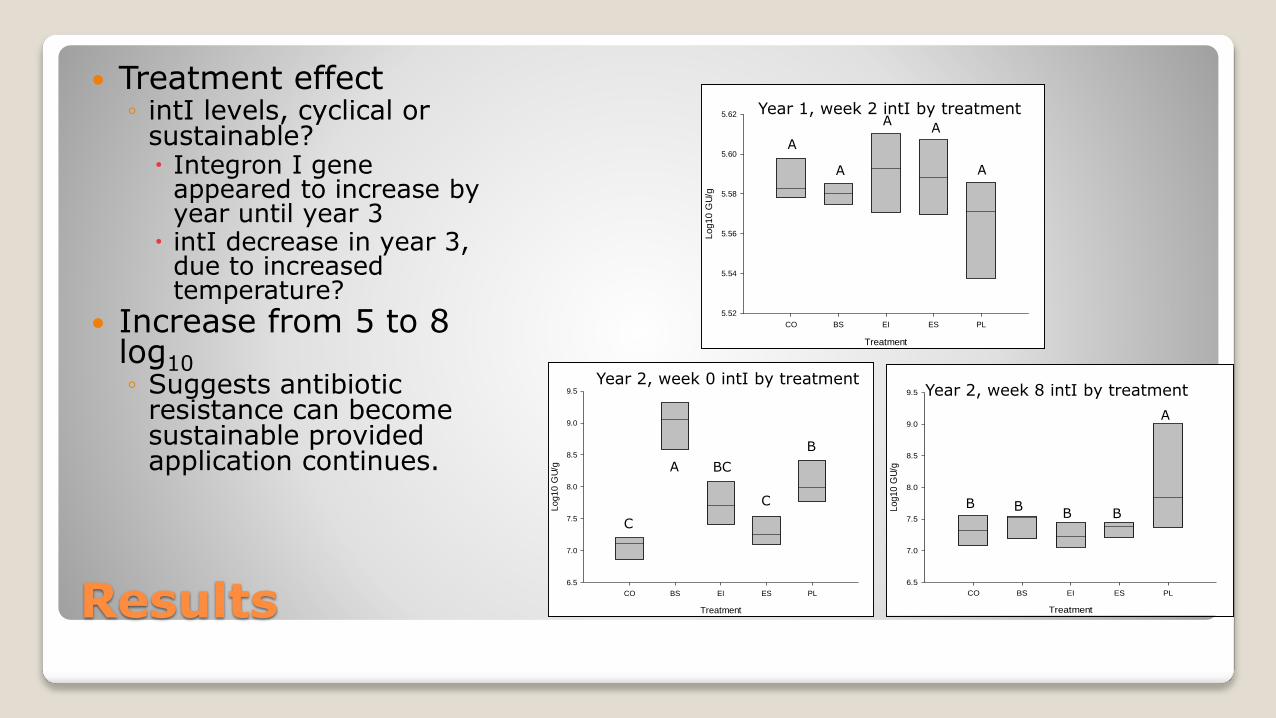
Results
Treatment effect◦ intI levels, cyclical or
sustainable? Integron I gene
appeared to increase by year until year 3
intI decrease in year 3, due to increased temperature?
Increase from 5 to 8 log10◦ Suggests antibiotic
resistance can become sustainable provided application continues.
Treatment
CO BS EI ES PL
Log10 G
U/g
5.52
5.54
5.56
5.58
5.60
5.62 Year 1, week 2 intI by treatment
A
A
AA
A
Treatment
CO BS EI ES PL
Log10 G
U/g
6.5
7.0
7.5
8.0
8.5
9.0
9.5 Year 2, week 8 intI by treatment
BBB
B
A
Treatment
CO BS EI ES PL
Log10 G
U/g
6.5
7.0
7.5
8.0
8.5
9.0
9.5
Year 2, week 0 intI by treatment
C
BCA
B
C
Results
Overall, true pathogen levels were low for all wastes.
E. coli isolates were dependent on residual waste type
◦ All 3 years – more frequently present in BS, EI, and ES applied plots.
◦ Influence of feral animals was also likely as CO samples were also positive
Salmonella isolates were only dependent on waste in yr 3.
◦ BS applied plots were more likely positive
No Campylobacter spp. detected in soil, wastes were positive, but numbers were below 100/g.
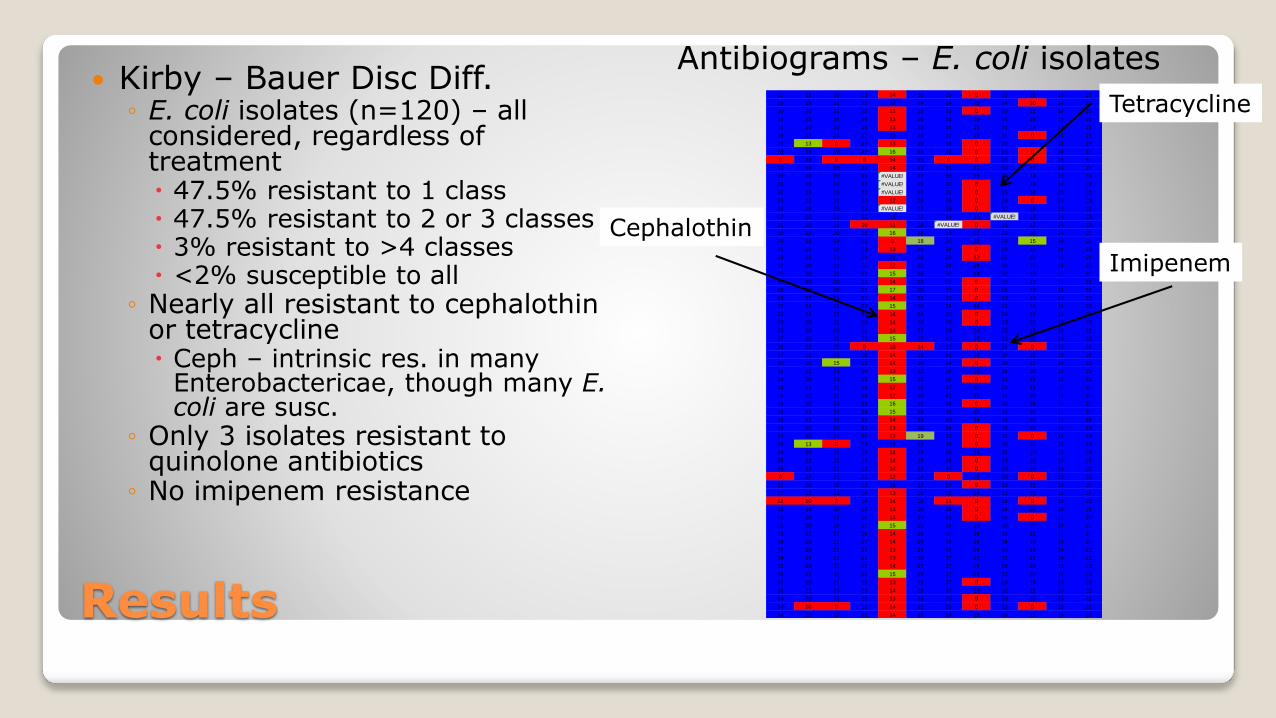
Results
Kirby – Bauer Disc Diff.◦ E. coli isolates (n=120) – all
considered, regardless of treatment 47.5% resistant to 1 class 47.5% resistant to 2 or 3 classes 3% resistant to >4 classes <2% susceptible to all
◦ Nearly all resistant to cephalothinor tetracycline Ceph – intrinsic res. in many
Enterobactericae, though many E. coli are susc.
◦ Only 3 isolates resistant to quinolone antibiotics
◦ No imipenem resistance
Antibiograms – E. coli isolates31 19 19 23 14 30 35 0 32 18 14 22
26 19 21 22 20 24 28 23 24 10 14 22
30 20 21 22 12 28 33 0 29 21 14 22
35 23 24 24 13 26 38 23 36 24 15 25
31 20 20 23 13 28 34 21 31 18 13 21
28 21 21 22 20 25 22 23 25 0 14 21
32 13 0 22 13 28 33 0 28 18 14 23
28 19 19 22 16 26 31 0 23 0 14 22
0 20 9 0 14 25 0 0 28 0 15 18
31 19 18 21 14 27 31 21 30 17 14 20
30 20 20 21 #VALUE! 27 33 22 29 19 13 21
28 19 20 22 #VALUE! 26 30 0 25 19 14 22
32 19 20 22 #VALUE! 27 32 0 31 18 20 22
33 22 21 22 12 26 36 0 28 0 15 23
34 19 20 21 #VALUE! 27 35 0 30 19 13 22
27 20 21 22 18 24 28 21 #VALUE! 18 14 23
31 20 21 10 11 28 #VALUE! 0 31 17 14 23
30 18 20 22 16 28 33 22 29 20 14 22
29 19 19 21 0 18 30 26 28 15 14 22
31 21 22 24 13 29 34 0 29 18 14 23
29 23 21 21 21 29 29 12 28 22 15 21
32 20 21 23 12 22 34 24 30 19 14 23
32 20 21 22 15 28 32 24 32 19 15 22
31 20 20 21 14 28 25 0 32 19 15 21
28 20 20 21 17 28 33 0 28 19 14 21
33 22 21 22 14 29 33 0 33 19 15 22
32 19 21 22 15 30 34 24 31 19 14 22
32 19 22 22 14 28 35 0 29 21 15 22
33 20 21 20 14 30 35 0 33 20 14 22
33 20 20 21 14 27 36 22 25 18 14 21
37 20 21 21 15 27 40 23 31 20 14 22
36 22 20 0 10 14 37 0 34 0 15 24
37 21 21 25 14 29 41 26 36 22 15 25
30 20 15 23 14 30 34 0 35 22 16 22
32 22 23 24 13 32 36 25 34 20 15 23
34 20 23 23 15 32 36 0 31 21 15 23
34 21 21 23 12 31 37 22 29 21 15 22
36 22 22 24 12 30 41 23 32 20 16 23
36 20 23 23 16 31 38 0 30 24 16 23
33 22 23 24 15 29 39 25 33 20 15 23
33 21 22 22 14 29 40 24 33 20 15 24
32 20 20 22 13 30 34 0 33 20 15 23
33 20 21 22 12 19 33 0 32 0 14 23
39 13 0 23 19 29 39 0 30 20 15 23
34 20 22 23 14 33 36 24 32 19 15 23
35 22 22 24 14 29 38 0 33 20 14 25
36 19 21 22 14 29 37 0 35 20 16 22
0 19 21 21 12 24 0 25 35 0 15 22
32 20 20 22 18 32 36 0 33 21 16 22
27 22 23 24 13 29 35 24 33 19 16 24
12 10 0 24 14 28 11 0 34 0 16 23
33 19 20 23 13 30 34 0 34 20 14 21
35 20 22 16 13 25 41 0 35 0 16 23
35 20 20 22 15 26 38 22 30 19 14 20
33 22 22 24 14 28 35 24 33 21 15 23
34 20 21 22 14 29 38 24 34 19 14 23
32 20 22 23 13 29 35 24 30 19 14 22
34 19 21 21 13 30 37 23 31 21 14 21
35 20 21 22 14 27 37 24 29 20 16 23
36 22 21 22 15 29 37 24 31 20 14 23
32 20 21 22 13 28 37 0 28 19 15 22
33 21 23 23 14 28 37 23 32 21 15 22
34 20 22 21 13 28 38 9 33 20 15 21
34 10 0 21 14 25 35 0 31 0 15 21
34 20 22 22 14 33 38 23 36 19 15 22
Cephalothin
Tetracycline
Imipenem
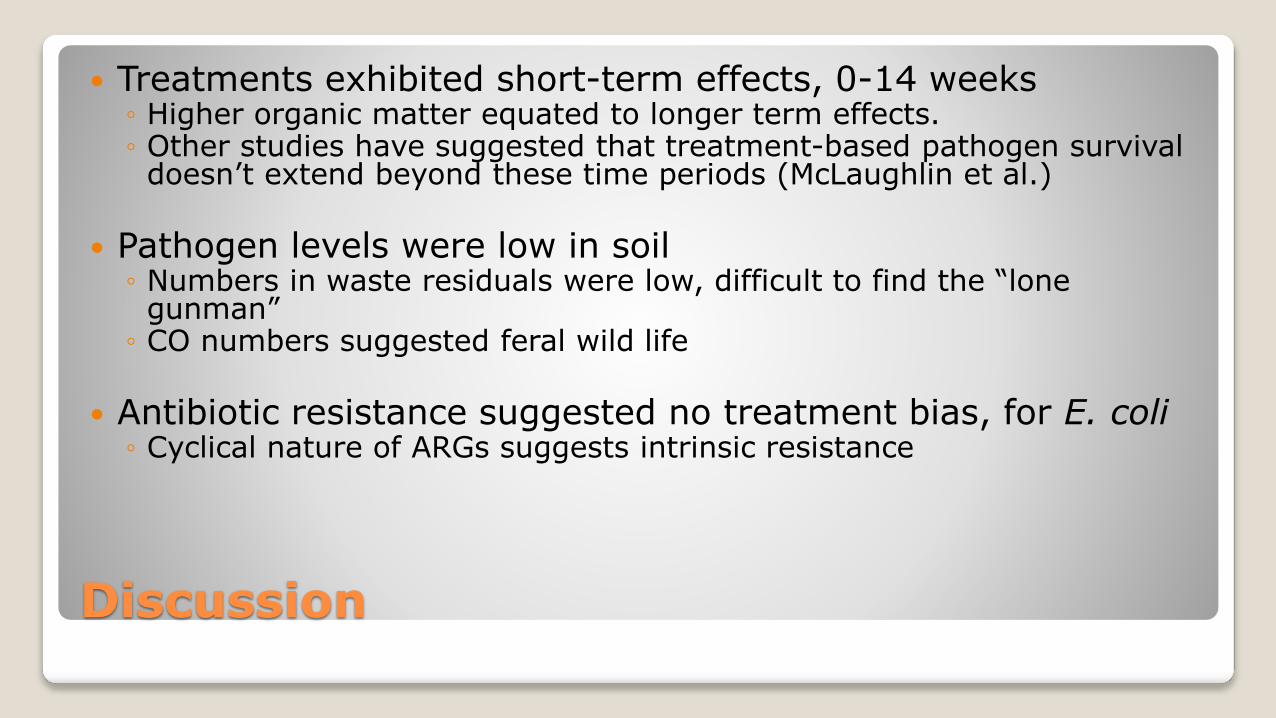
Discussion
Treatments exhibited short-term effects, 0-14 weeks◦ Higher organic matter equated to longer term effects.◦ Other studies have suggested that treatment-based pathogen survival
doesn’t extend beyond these time periods (McLaughlin et al.)
Pathogen levels were low in soil◦ Numbers in waste residuals were low, difficult to find the “lone
gunman”◦ CO numbers suggested feral wild life
Antibiotic resistance suggested no treatment bias, for E. coli◦ Cyclical nature of ARGs suggests intrinsic resistance
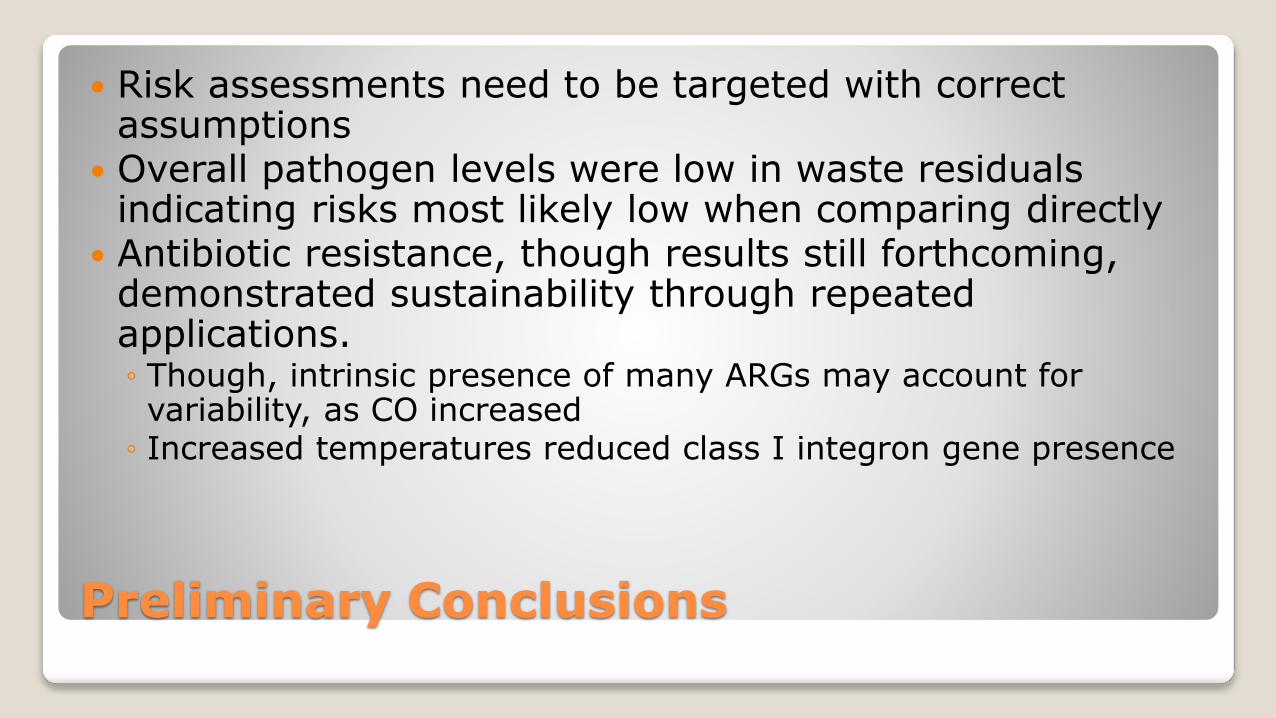
Preliminary Conclusions
Risk assessments need to be targeted with correct assumptions
Overall pathogen levels were low in waste residuals indicating risks most likely low when comparing directly
Antibiotic resistance, though results still forthcoming, demonstrated sustainability through repeated applications.◦ Though, intrinsic presence of many ARGs may account for variability, as CO increased
◦ Increased temperatures reduced class I integron gene presence

Questions & Contact Information
John P. Brooks◦ USDA-ARS – Mississippi State University
◦ 810 HWY 12 E., Mississippi State, MS 39762
◦ Email: [email protected]
◦ Phone: 662-320-7411
Mention of trade names, commercial products, or organizationsdoes not imply endorsement by the U.S. Government.
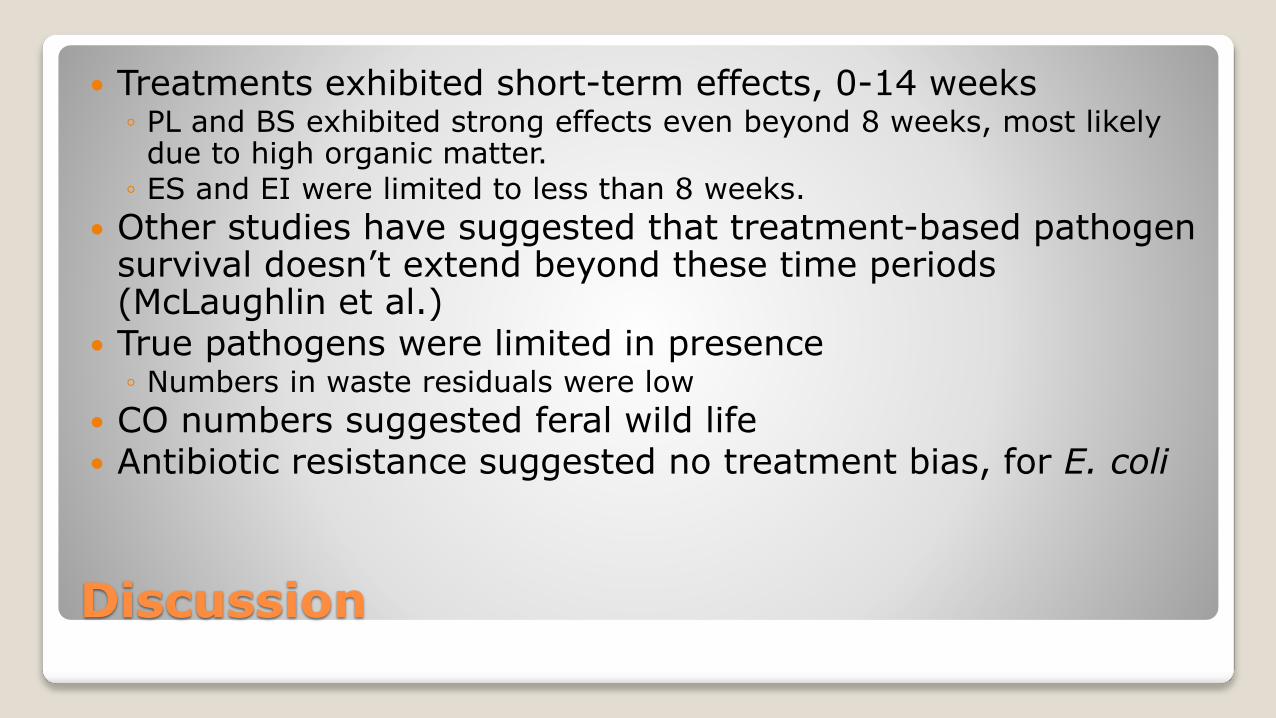
Discussion
Treatments exhibited short-term effects, 0-14 weeks◦ PL and BS exhibited strong effects even beyond 8 weeks, most likely
due to high organic matter.
◦ ES and EI were limited to less than 8 weeks.
Other studies have suggested that treatment-based pathogen survival doesn’t extend beyond these time periods (McLaughlin et al.)
True pathogens were limited in presence◦ Numbers in waste residuals were low
CO numbers suggested feral wild life Antibiotic resistance suggested no treatment bias, for E. coli