Embed Size (px)
Citation preview
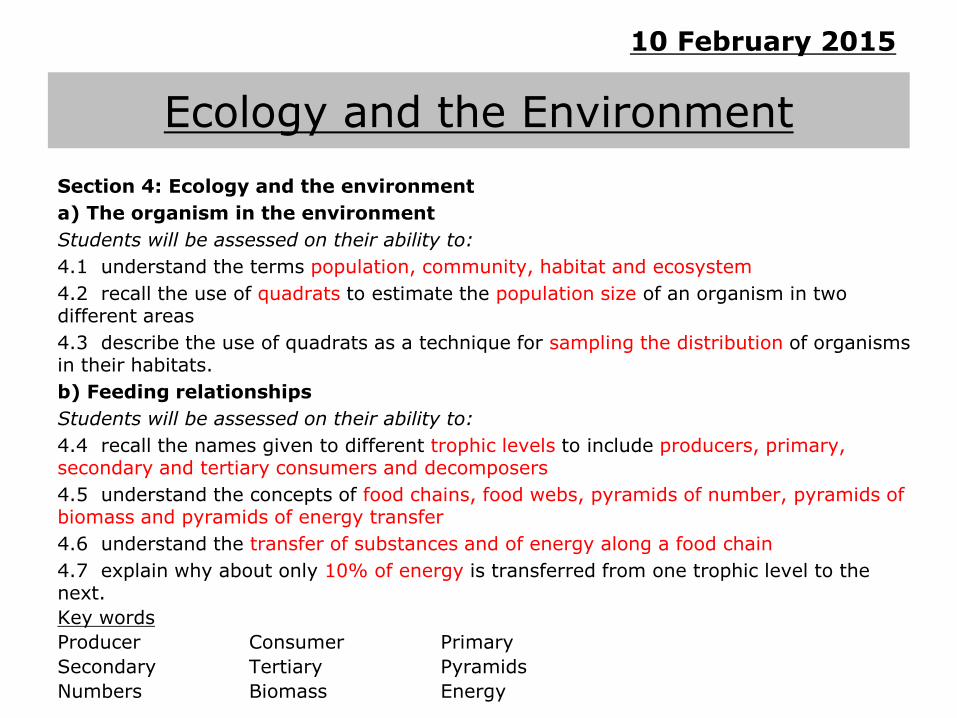
Ecology and the Environment
Section 4: Ecology and the environment
a) The organism in the environment
Students will be assessed on their ability to:
4.1 understand the terms population, community, habitat and ecosystem
4.2 recall the use of quadrats to estimate the population size of an organism in two different areas
4.3 describe the use of quadrats as a technique for sampling the distribution of organisms in their habitats.
b) Feeding relationships
Students will be assessed on their ability to:
4.4 recall the names given to different trophic levels to include producers, primary, secondary and tertiary consumers and decomposers
4.5 understand the concepts of food chains, food webs, pyramids of number, pyramids of biomass and pyramids of energy transfer
4.6 understand the transfer of substances and of energy along a food chain
4.7 explain why about only 10% of energy is transferred from one trophic level to the next.
Key words
Producer Consumer Primary
Secondary Tertiary Pyramids
Numbers Biomass Energy
10 February 2015
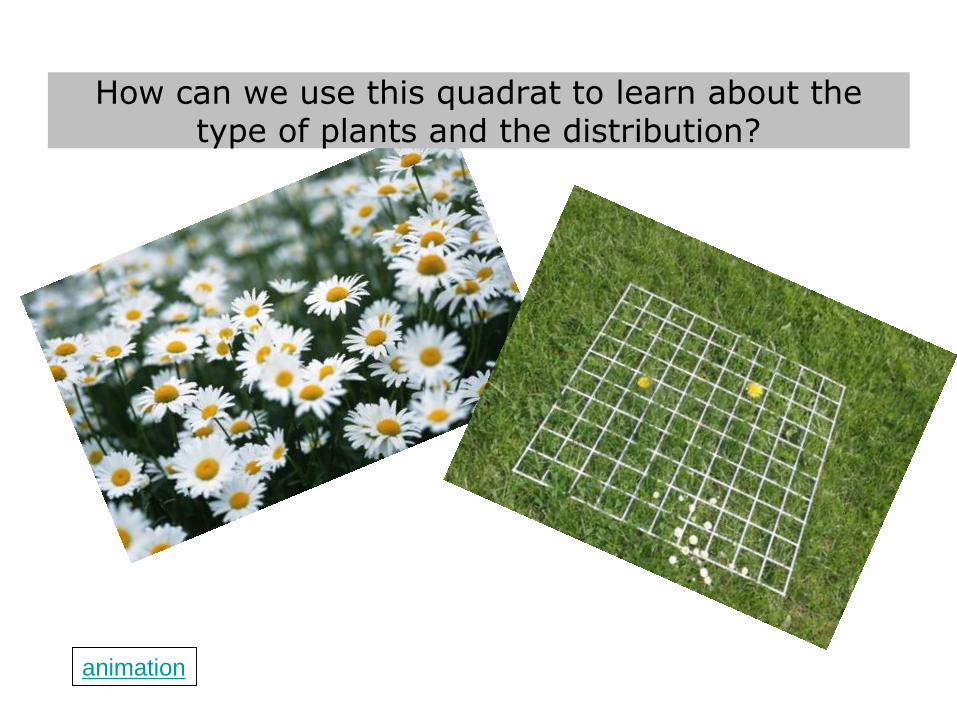
How can we use this quadrat to learn about the type of plants and the distribution?
animation

Food chains
• http://www.youtube.com/watch?v=TE6wqG4nb3
M
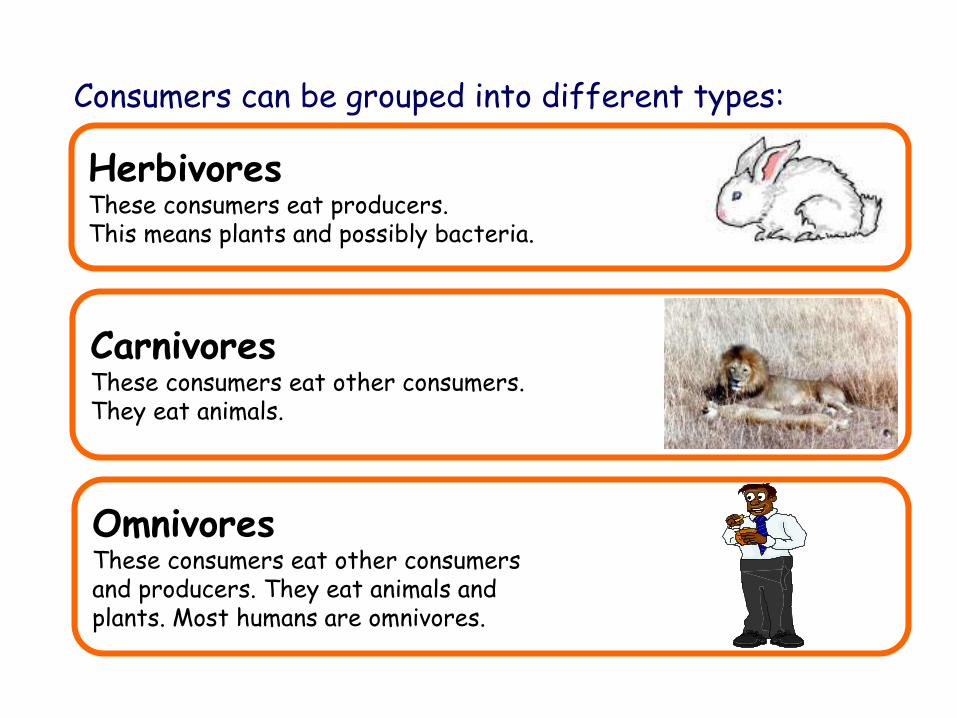
Consumers can be grouped into different types:
CarnivoresThese consumers eat other consumers. They eat animals.
Herbivores These consumers eat producers. This means plants and possibly bacteria.
OmnivoresThese consumers eat other consumers and producers. They eat animals and plants. Most humans are omnivores.
Feeding types
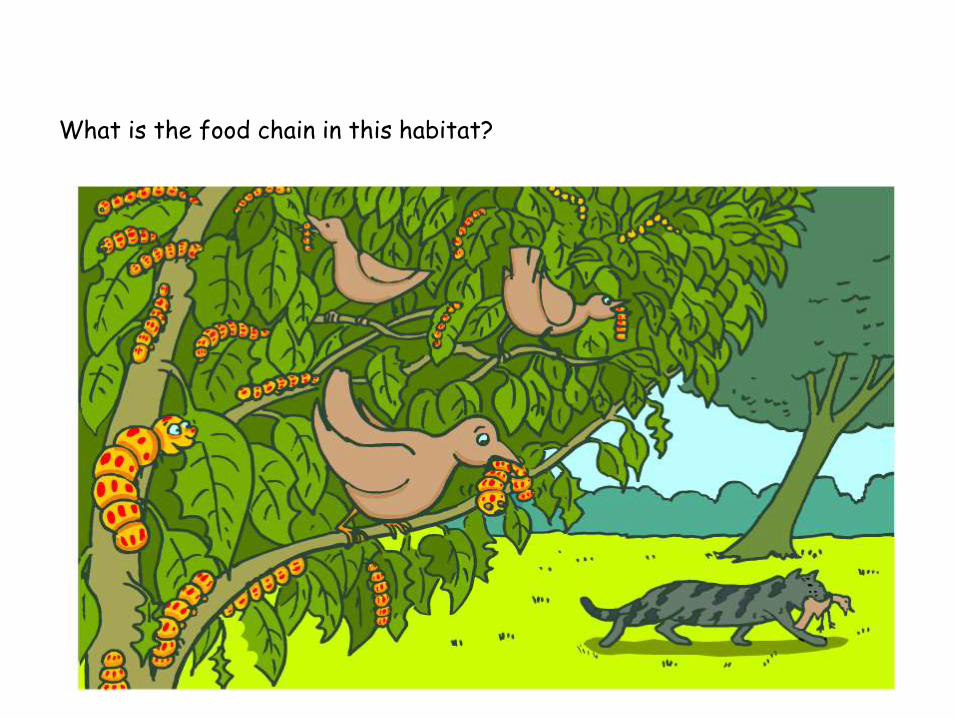
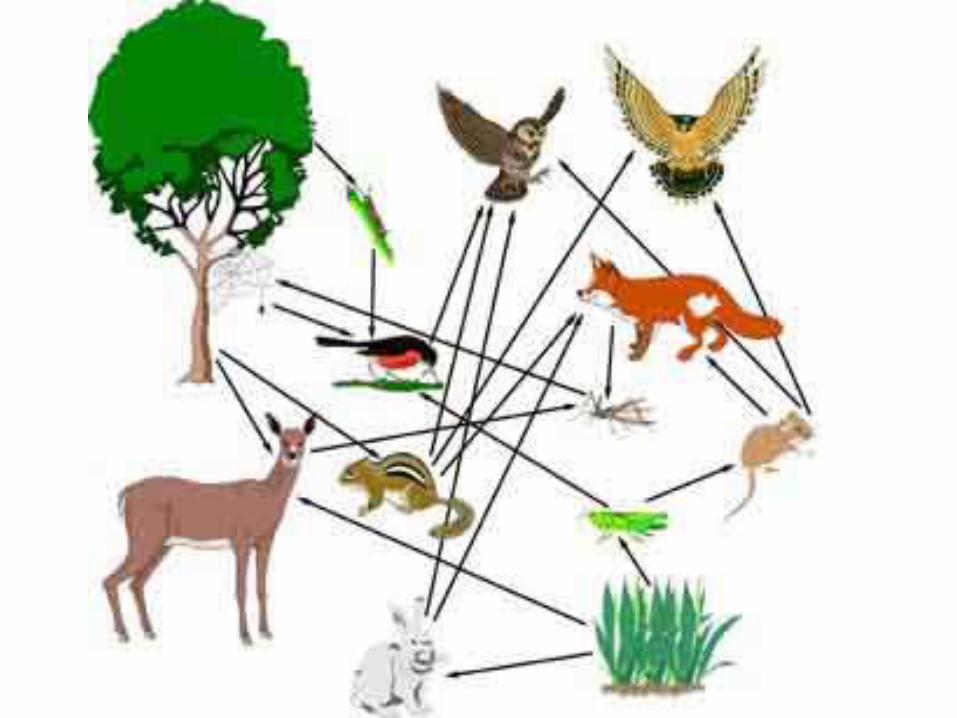
What is the food chain in this habitat?

Copy the food chain and add the following labels.Producer Primary consumer Tertiary consumer Herbivore Secondary consumer Sun Carnivore

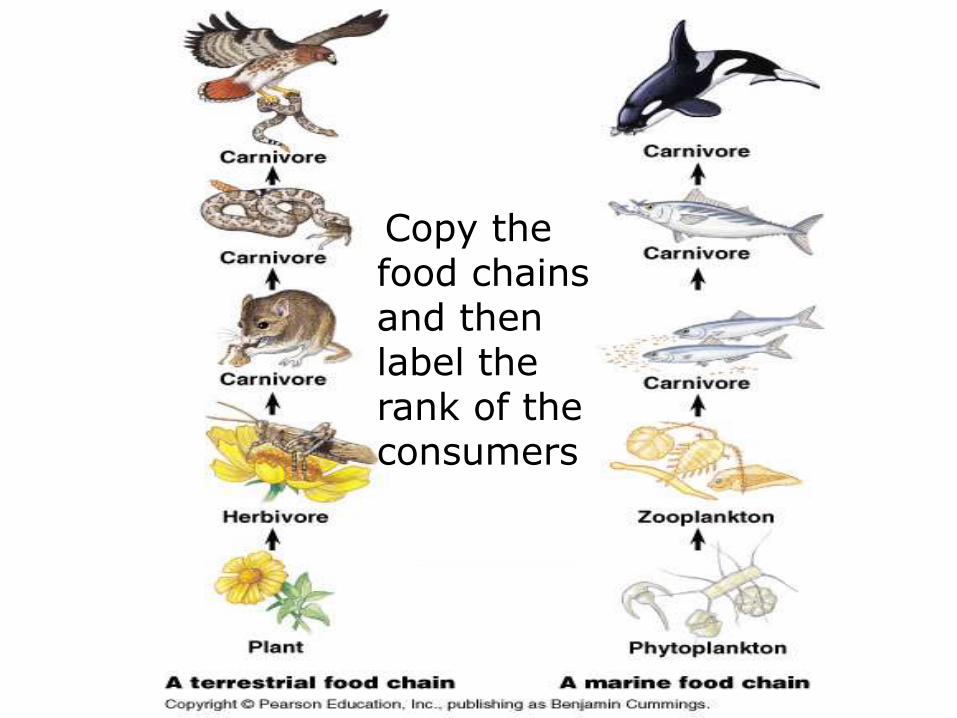
Copy the food chains and then label the rank of the consumers
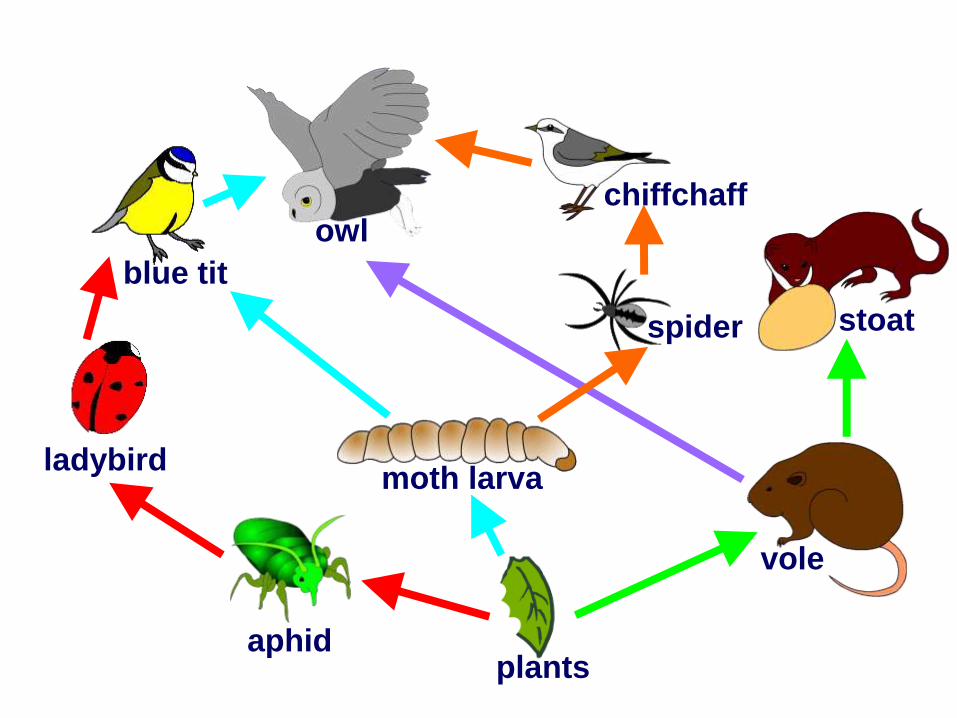
blue tit
chiffchaff
aphid
moth larva
vole
stoat
owl
spider
ladybird
plants
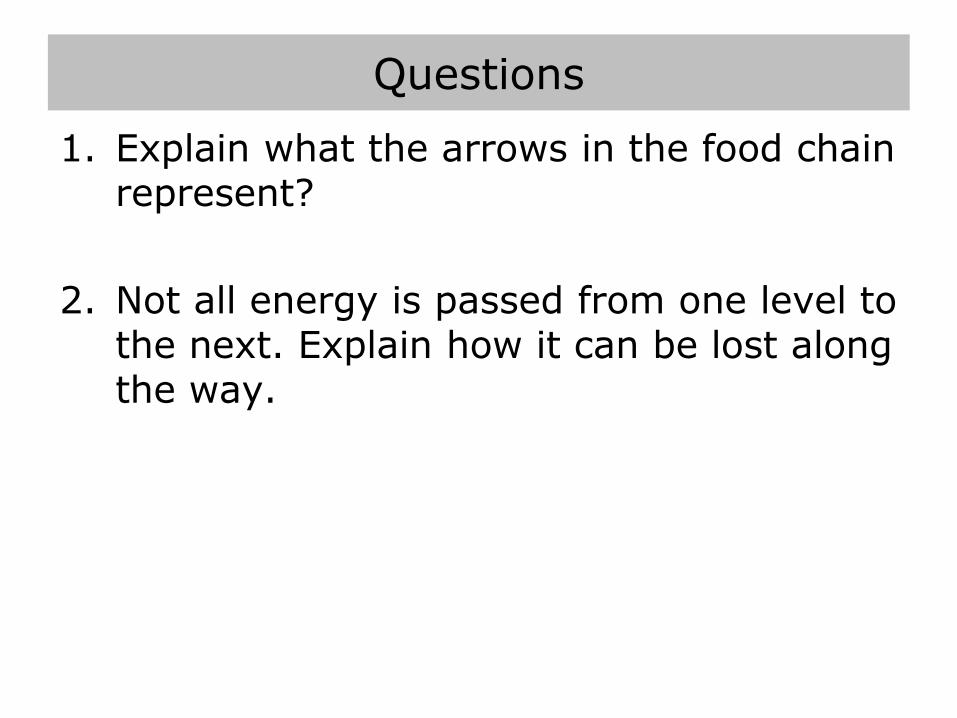
Questions
1. Explain what the arrows in the food chain represent?
2. Not all energy is passed from one level to the next. Explain how it can be lost along the way.
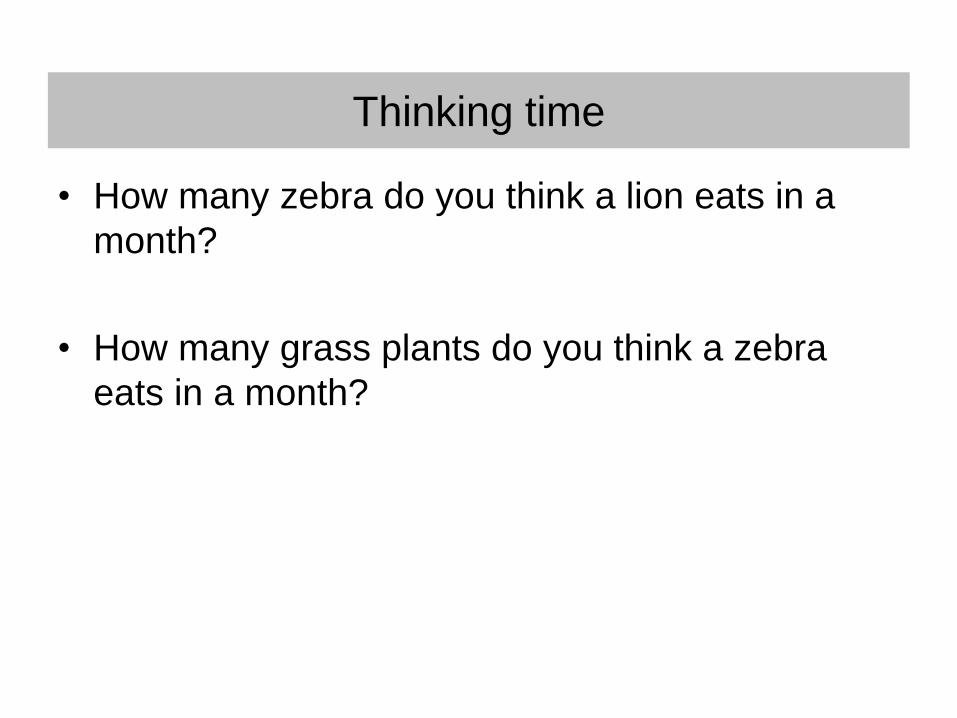
Thinking time
• How many zebra do you think a lion eats in a
month?
• How many grass plants do you think a zebra
eats in a month?
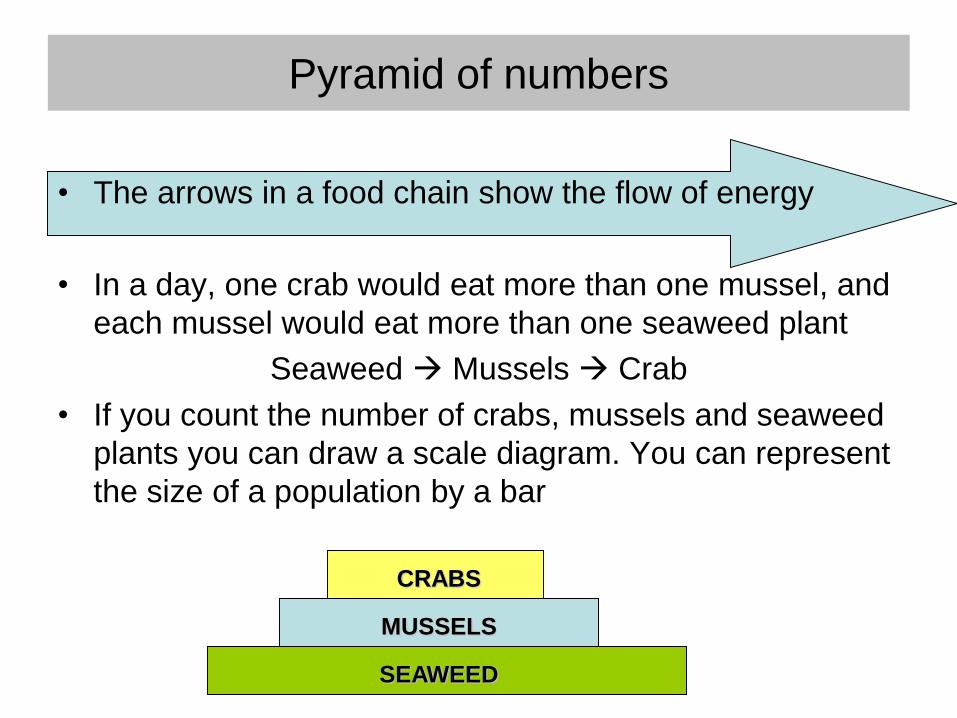
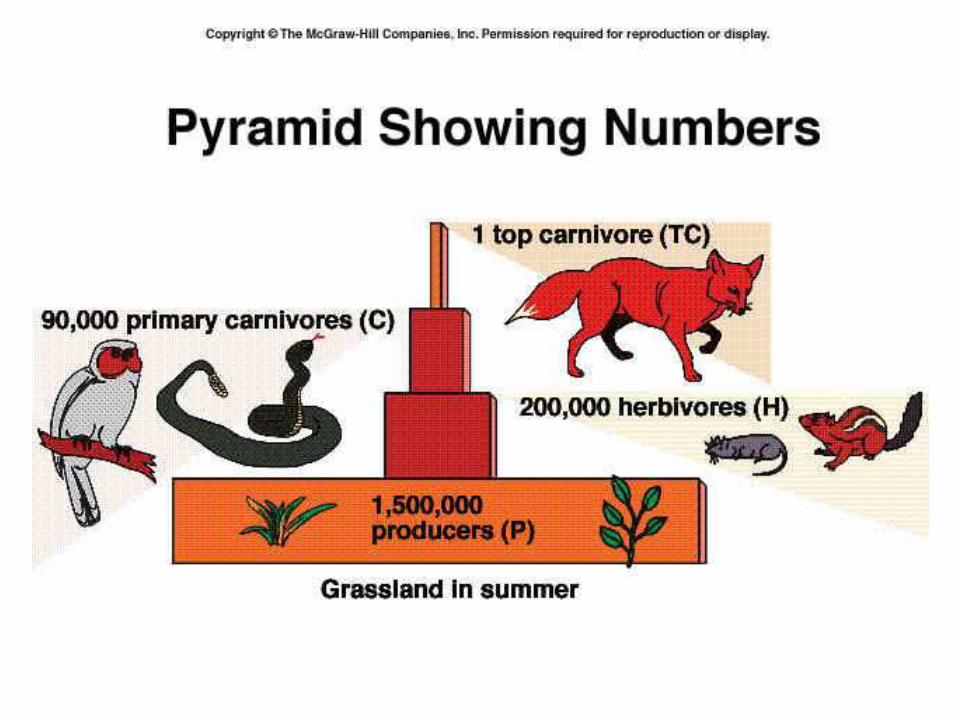
Pyramid of numbers
• The arrows in a food chain show the flow of energy
• In a day, one crab would eat more than one mussel, and
each mussel would eat more than one seaweed plant
Seaweed Mussels Crab
• If you count the number of crabs, mussels and seaweed
plants you can draw a scale diagram. You can represent
the size of a population by a bar
SEAWEED
MUSSELS
CRABS
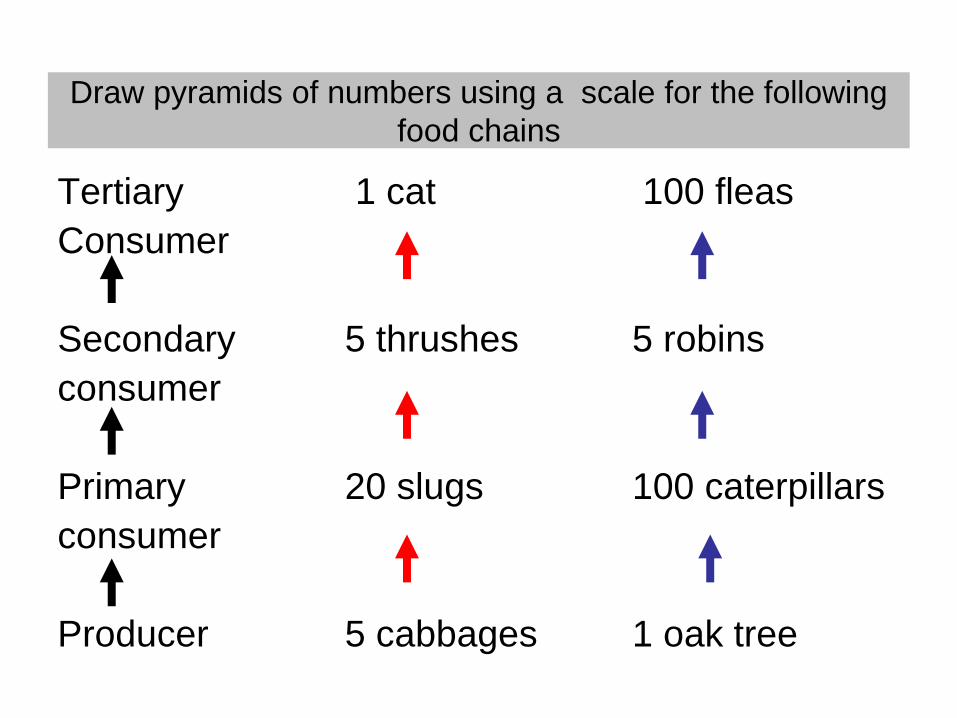
Draw pyramids of numbers using a scale for the following
food chains
Tertiary 1 cat 100 fleas
Consumer
Secondary 5 thrushes 5 robins
consumer
Primary 20 slugs 100 caterpillars
consumer
Producer 5 cabbages 1 oak tree
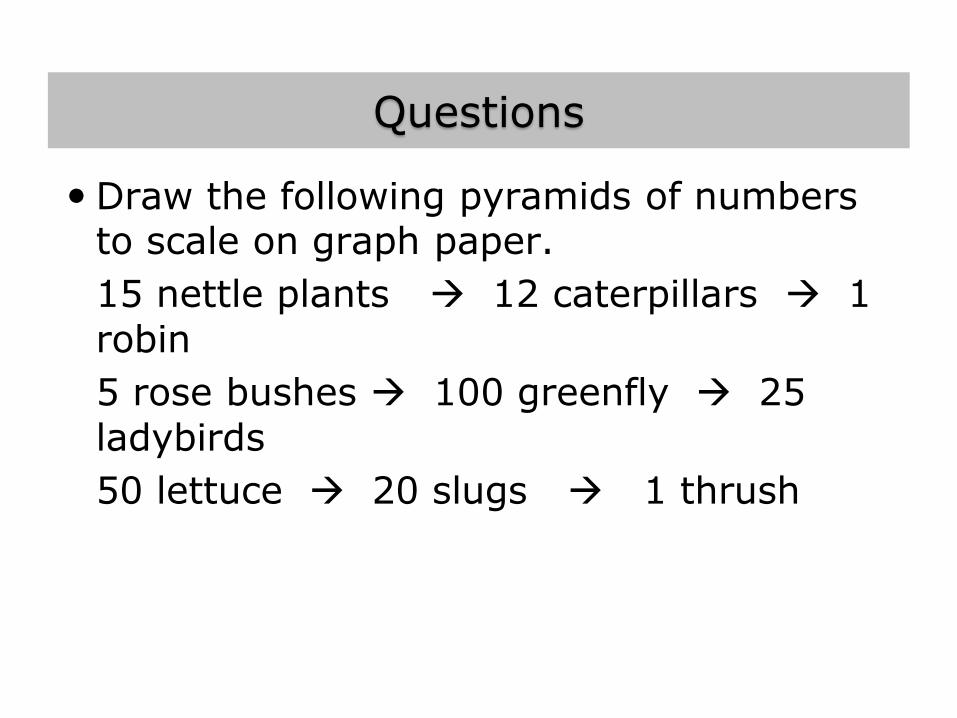
Questions
Draw the following pyramids of numbers to scale on graph paper.
15 nettle plants 12 caterpillars 1
robin
5 rose bushes 100 greenfly 25
ladybirds
50 lettuce 20 slugs 1 thrush
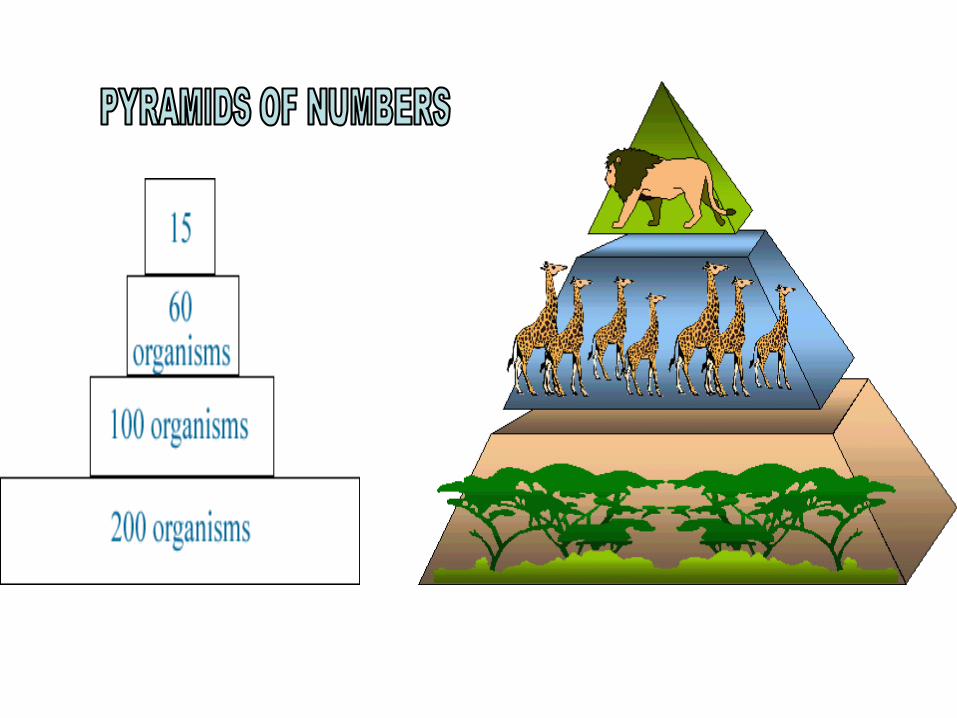
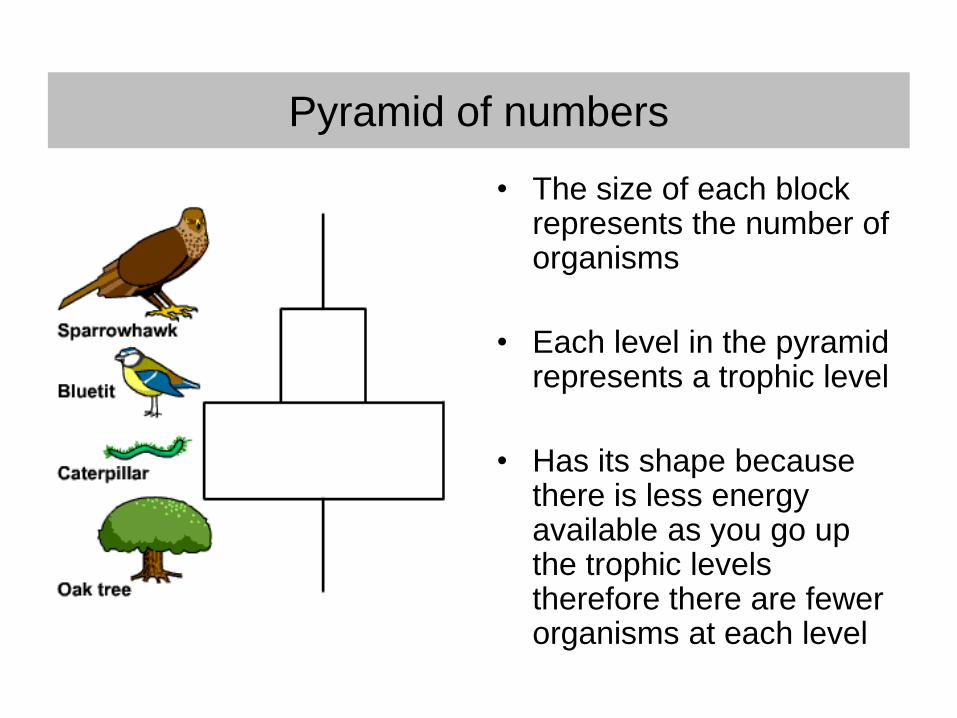
Pyramid of numbers
• The size of each block represents the number of organisms
• Each level in the pyramid represents a trophic level
• Has its shape because there is less energy available as you go up the trophic levels therefore there are fewer organisms at each level
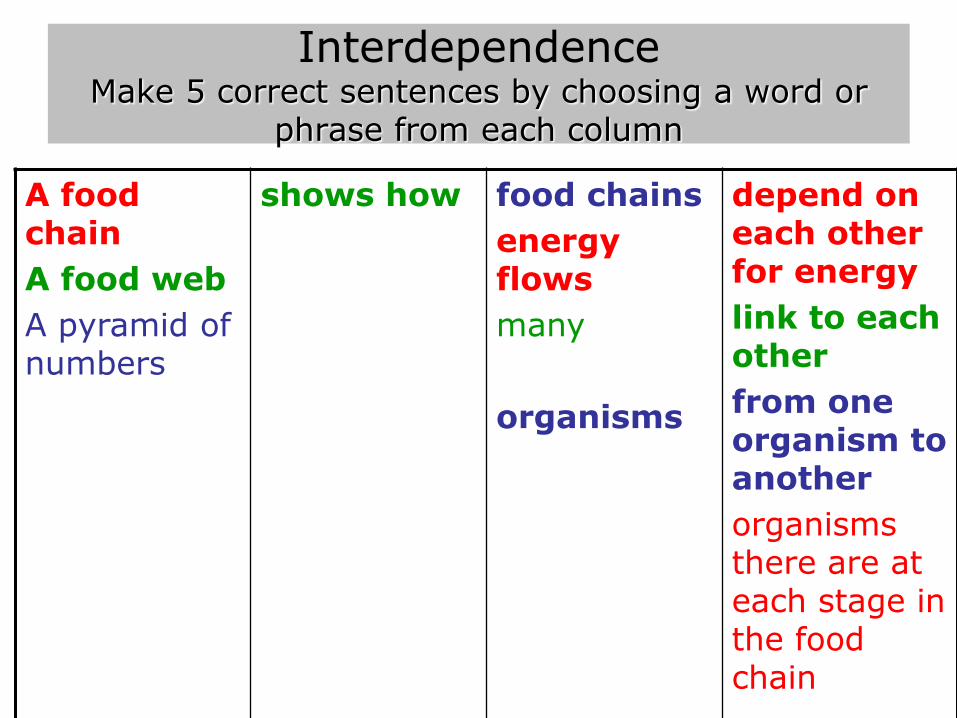
InterdependenceMake 5 correct sentences by choosing a word or
phrase from each column
A food chain
A food web
A pyramid of numbers
shows how food chains
energy flows
many
organisms
depend on each other for energy
link to each other
from one organism to another
organisms there are at each stage in the food chain
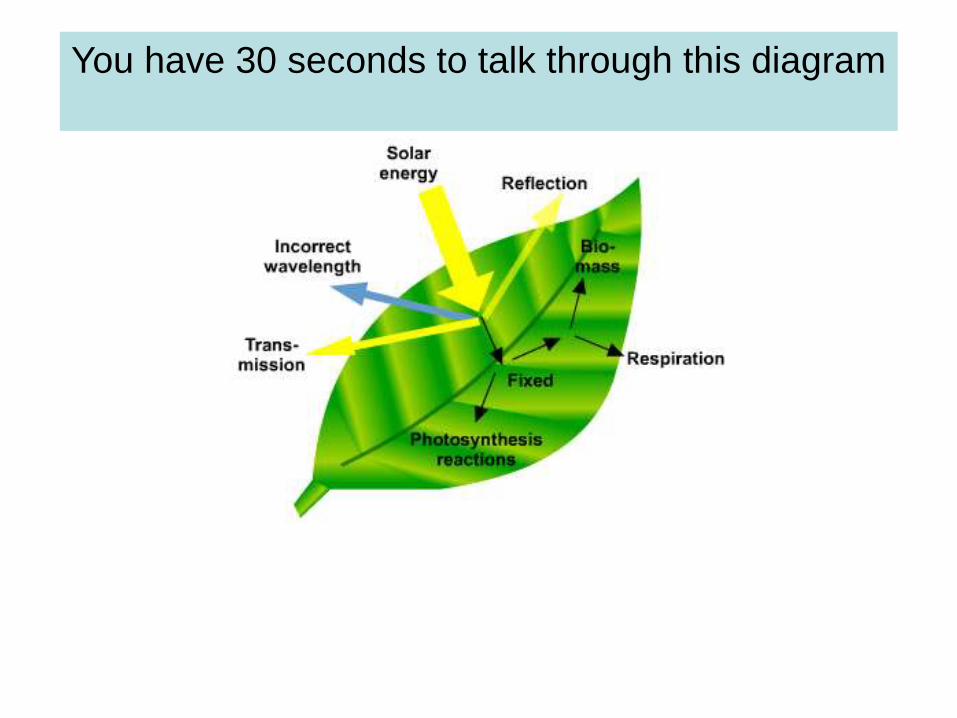
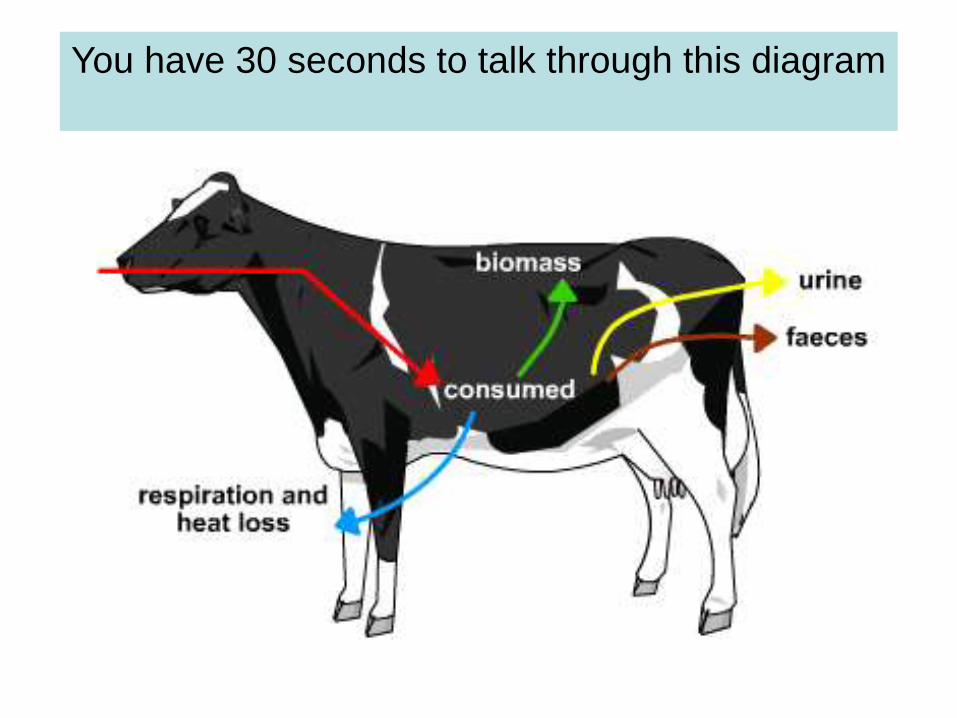
You have 30 seconds to talk through this diagram
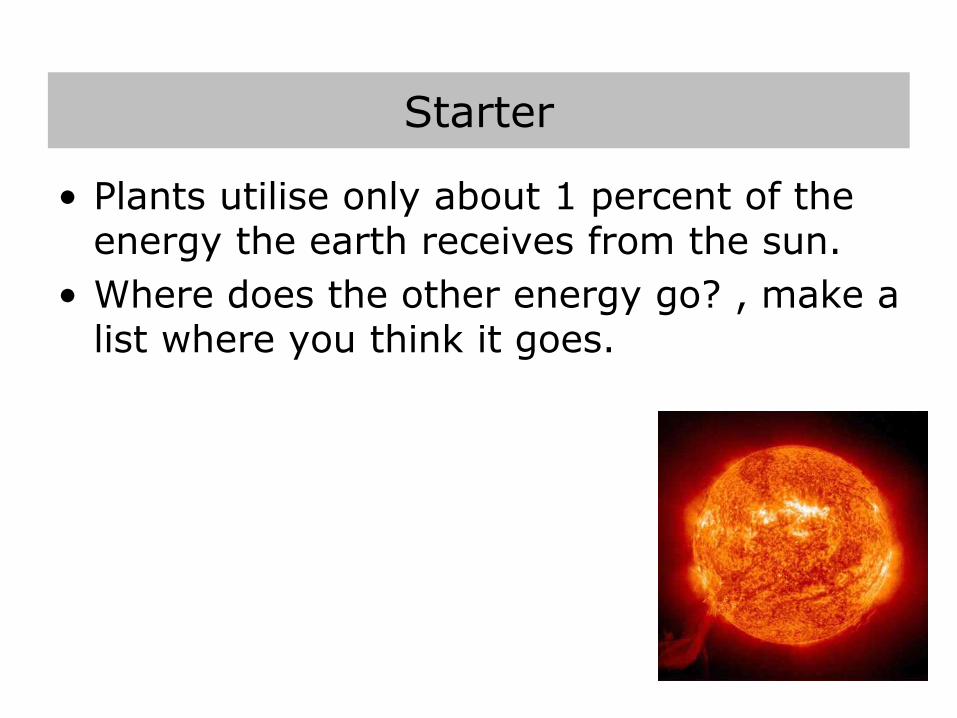
• Plants utilise only about 1 percent of the energy the earth receives from the sun.
• Where does the other energy go? , make a list where you think it goes.
Starter
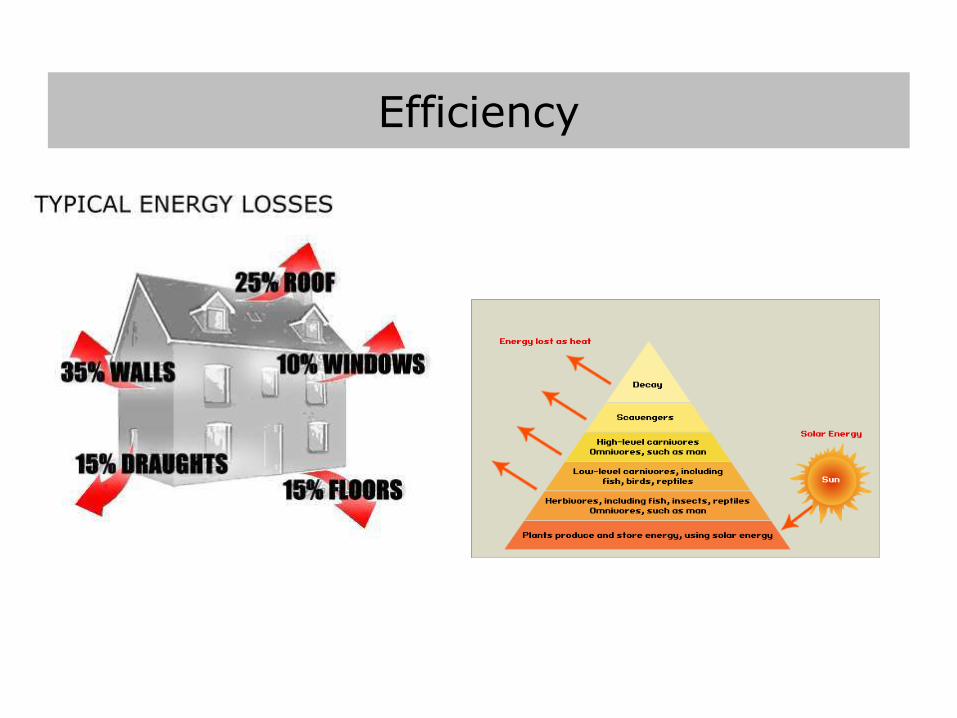
Efficiency
Energy Transfers
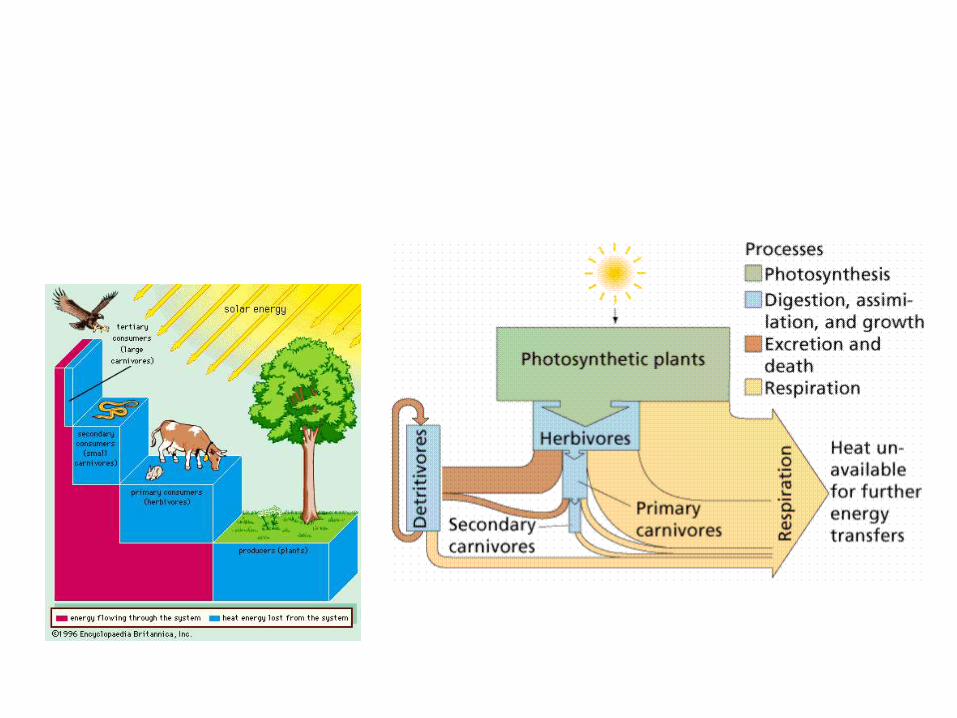
• Energy comes into an ecosystem from sunlight and is fixed by plants by photosynthesis.
• There is another process called chemosynthesis (involves bacteria).
• The energy stored in the plants can be passed onto other organisms along food chains.
• Each link in a food chain is called a trophic level.
• During this process a lot of energy is lost – dissipation.
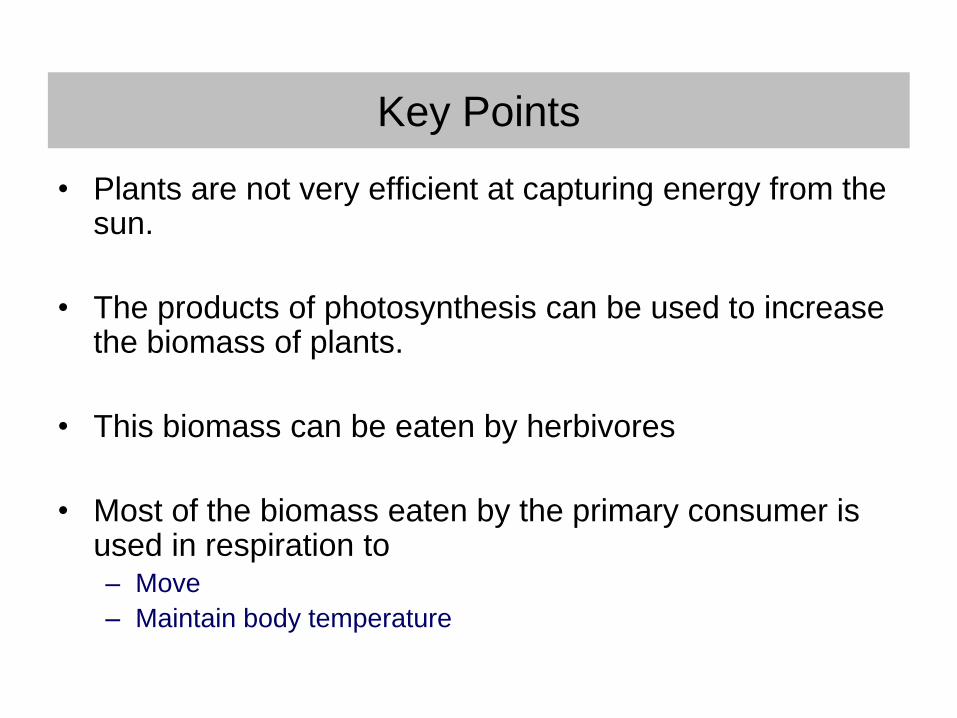
Key Points
• Plants are not very efficient at capturing energy from the sun.
• The products of photosynthesis can be used to increase the biomass of plants.
• This biomass can be eaten by herbivores
• Most of the biomass eaten by the primary consumer is used in respiration to– Move
– Maintain body temperature
Key points
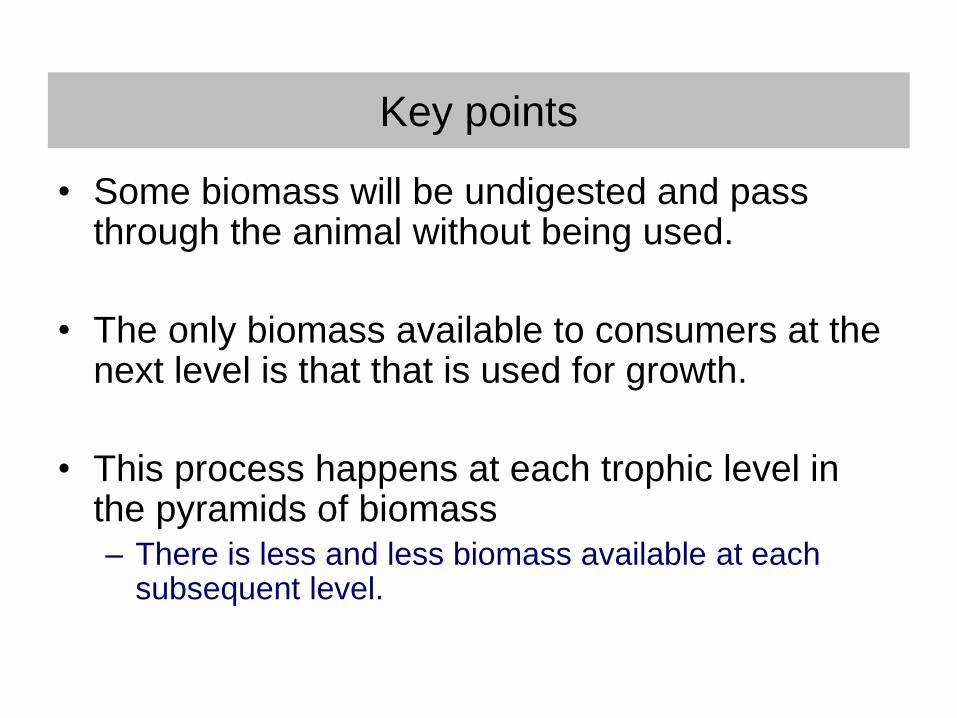
• Some biomass will be undigested and pass through the animal without being used.
• The only biomass available to consumers at the next level is that that is used for growth.
• This process happens at each trophic level in the pyramids of biomass– There is less and less biomass available at each
subsequent level.
• The energy in all ecosystems originally come from the sun.
• Most of the sunlight that falls on leaves is not absorbed and used.
• Some is reflected by the leafs surface.
• Some passes through the leaf.
• Only part of the light is useful and can be absorbed by the chlorophyll.
You have 30 seconds to talk through this diagram
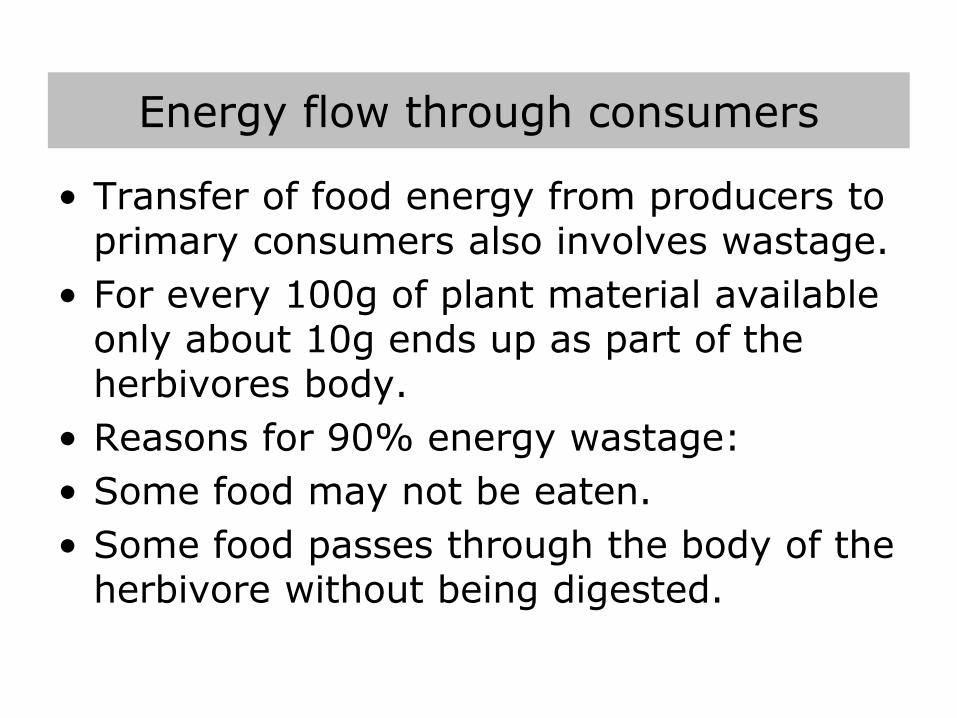
• Transfer of food energy from producers to primary consumers also involves wastage.
• For every 100g of plant material available only about 10g ends up as part of the herbivores body.
• Reasons for 90% energy wastage:
• Some food may not be eaten.
• Some food passes through the body of the herbivore without being digested.
Energy flow through consumers
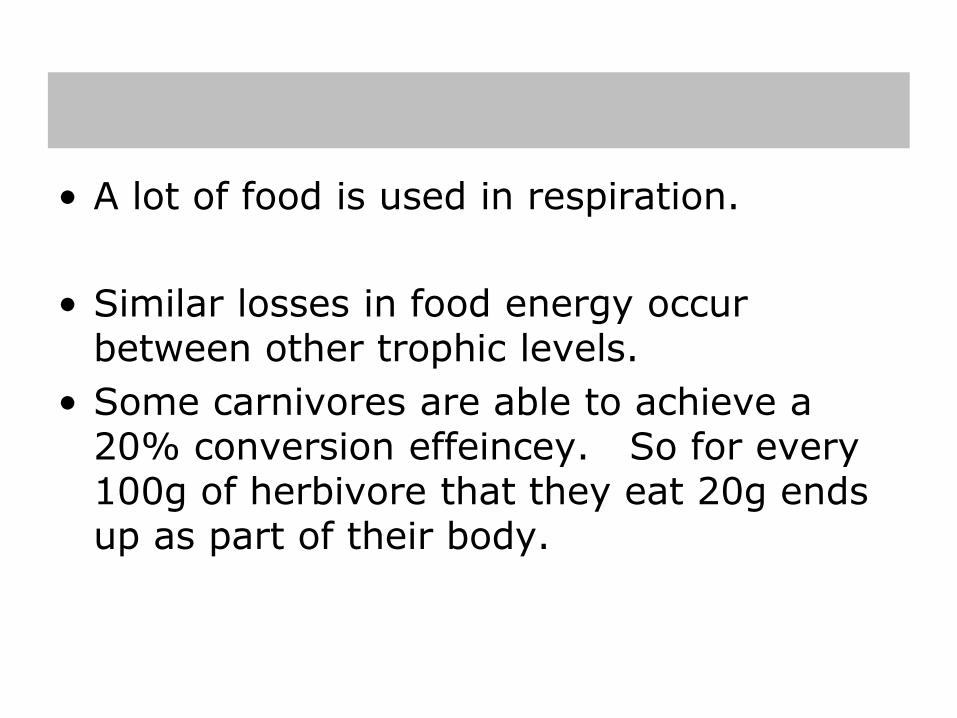
• A lot of food is used in respiration.
• Similar losses in food energy occur between other trophic levels.
• Some carnivores are able to achieve a 20% conversion effeincey. So for every 100g of herbivore that they eat 20g ends up as part of their body.

Pyramids of biomass
• The mass of living things at each stage in the food chain
• Measured in dry mass
• The size of each box represents the mass of each kind of organism
• Always makes a pyramid shape (a pyramid of numbers can be upside down)

Difficulties with food pyramids
• Many organisms eat lots of things• Could be at different levels
• Calculating dry mass involves killing and drying
organisms
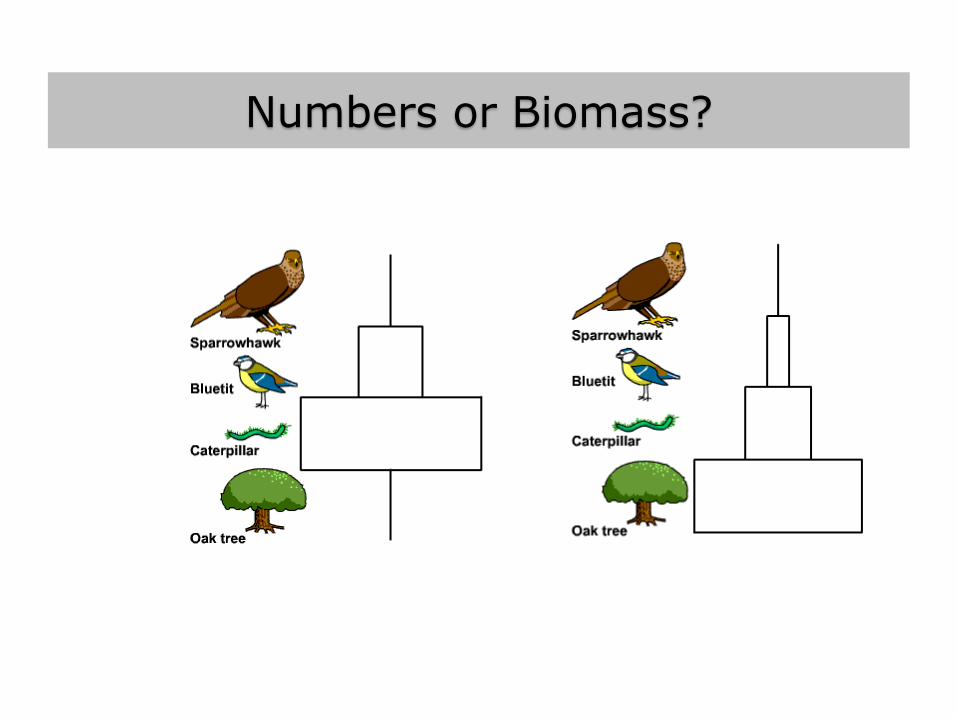
Numbers or Biomass?
Plenary
• Pyramids of numbers tell us the number of
predators-prey at each feeding level, however,
they do not give a very good indication of the
energy transferred.
• Can you think of a better way of measuring how
much energy is transferred between stages in
the food chains? What other quantity could we
use in a pyramid instead of number of
animals/plants?
Food chains
• http://www.youtube.com/watch?v=TE6wqG4nb3
M

1. Give three ways in which fish are adapted to live
underwater.
2. Explain how a polar bear is adapted to its
environment.
3. Explain how a camel is adapted to its environment.
Extension: How is a tree adapted to its environment?
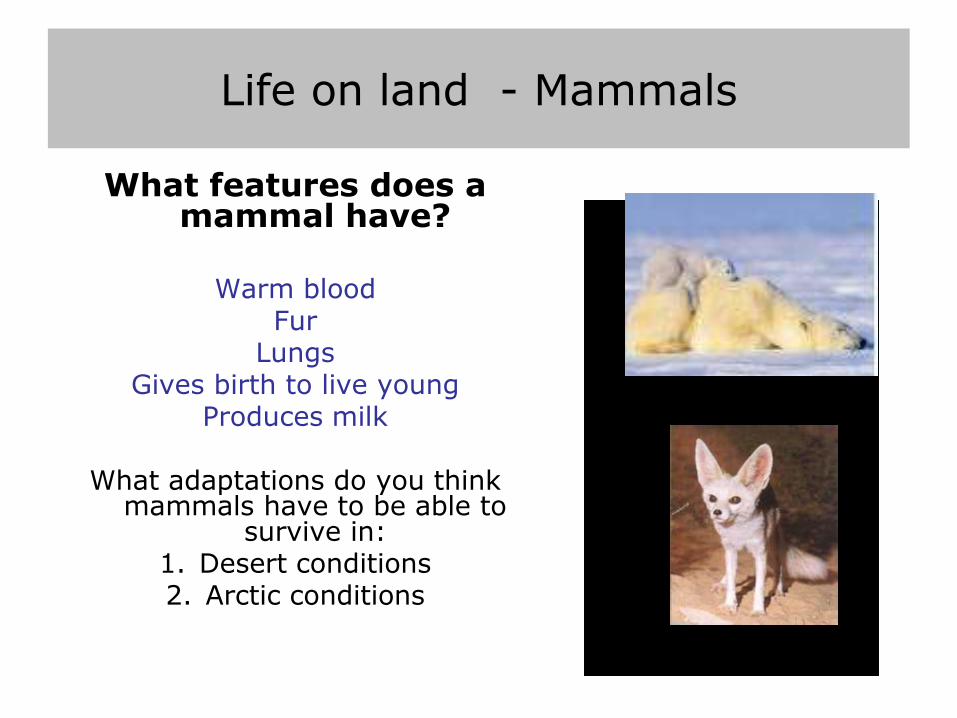
Life on land - Mammals
What features does a mammal have?
Warm bloodFur
LungsGives birth to live young
Produces milk
What adaptations do you think mammals have to be able to
survive in:1. Desert conditions2. Arctic conditions
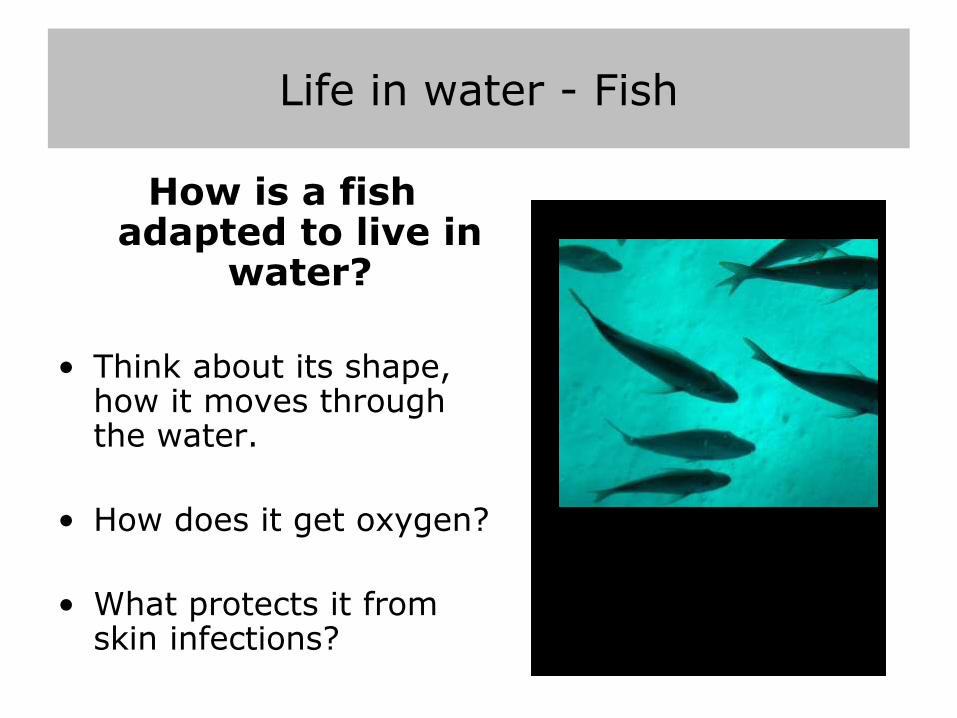
Life in water - Fish
How is a fish adapted to live in
water?
• Think about its shape, how it moves through the water.
• How does it get oxygen?
• What protects it from skin infections?
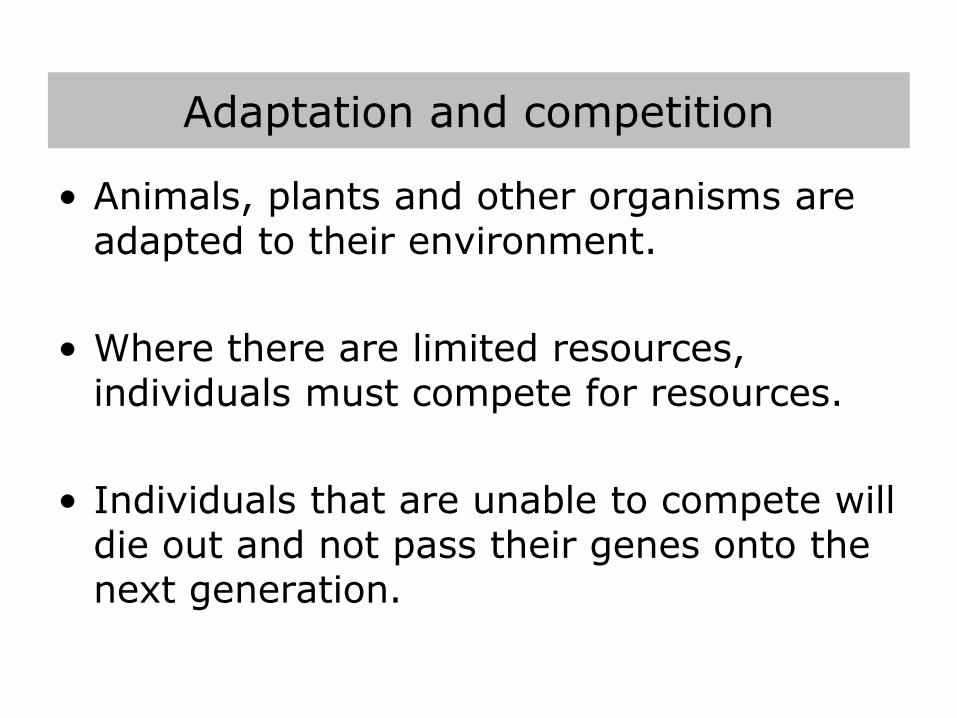
Adaptation and competition
• Animals, plants and other organisms are adapted to their environment.
• Where there are limited resources, individuals must compete for resources.
• Individuals that are unable to compete will die out and not pass their genes onto the next generation.
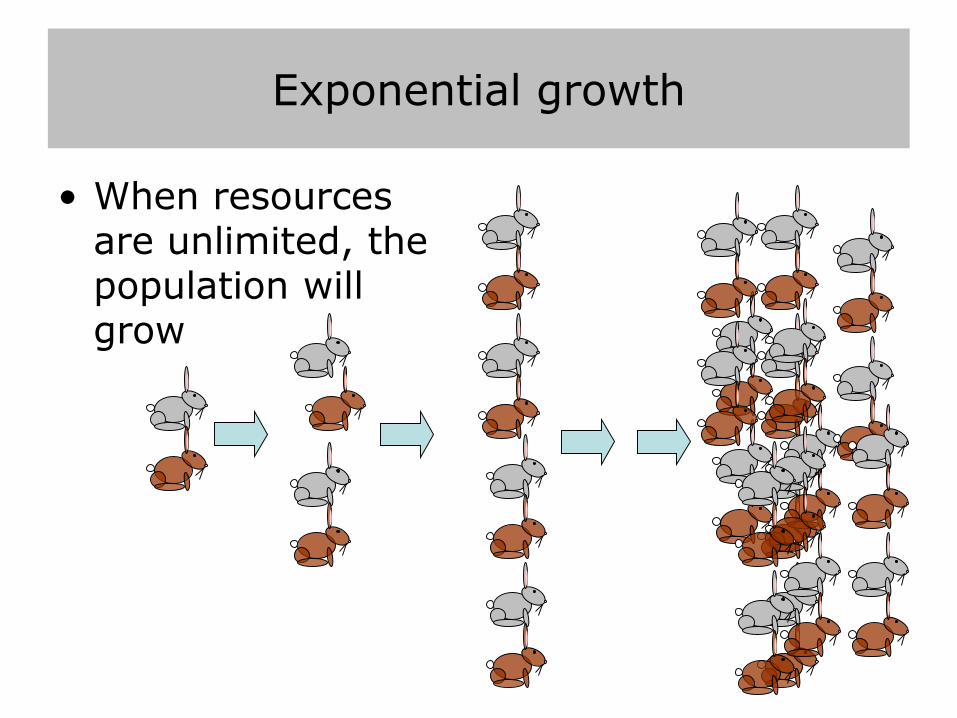
Exponential growth
• When resources are unlimited, the population will grow
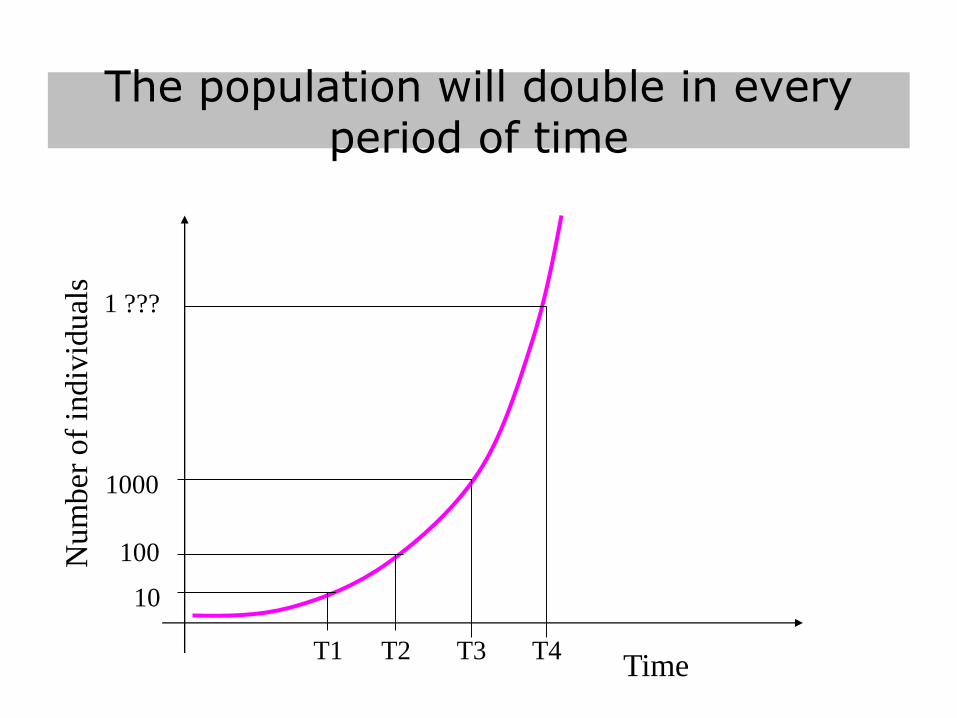
The population will double in every period of time
Time
Num
ber
of
indiv
idual
s
T1 T2 T3 T4
10
100
1000
1 ???
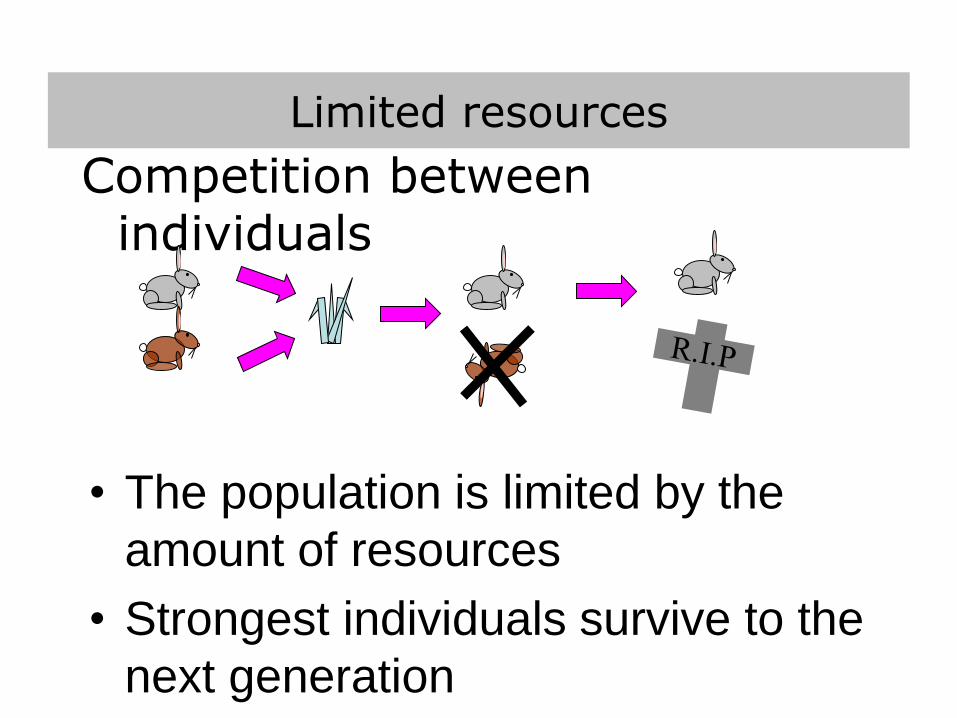
Limited resources
Competition between individuals
• The population is limited by the
amount of resources
• Strongest individuals survive to the
next generation
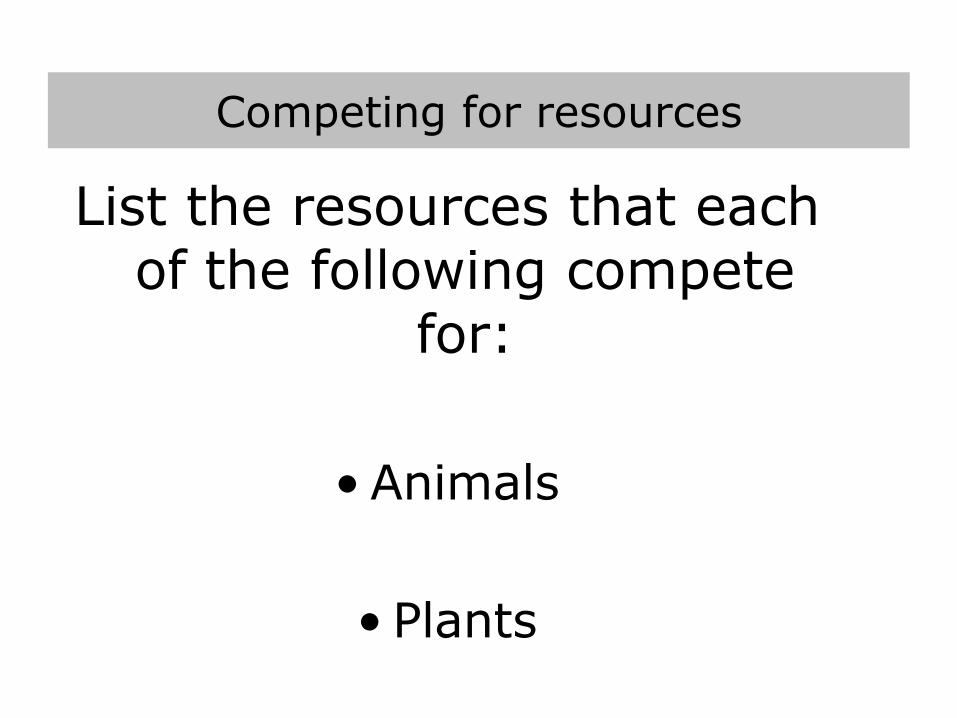
Competing for resources
List the resources that each of the following compete
for:
•Animals
• Plants
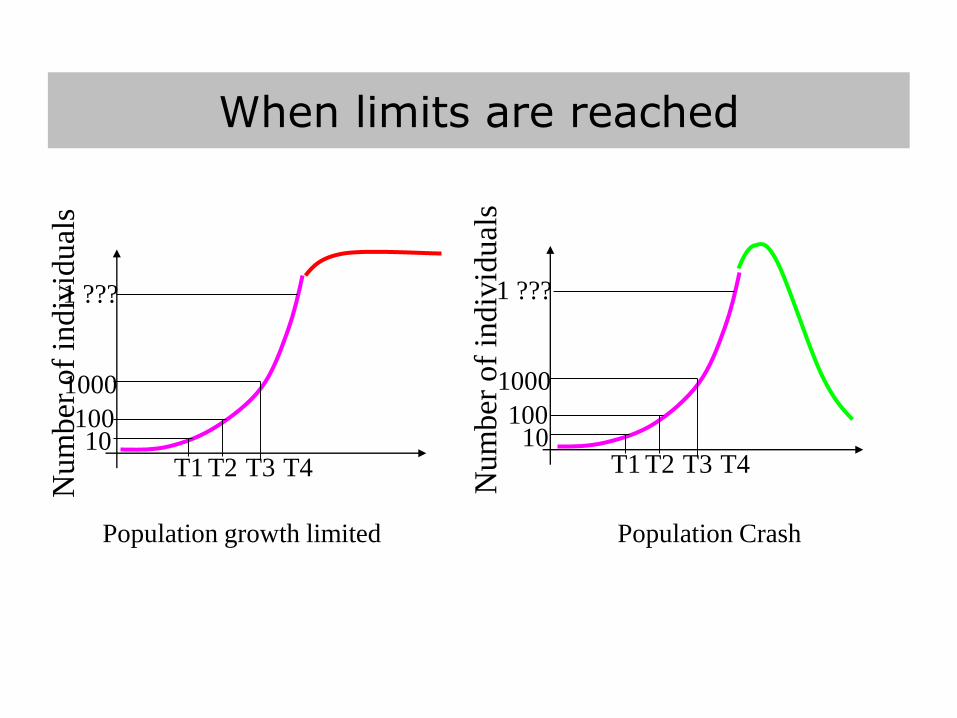
When limits are reached
Num
ber
of
indiv
idual
s
T1 T2 T3 T410
100
1000
1 ???
Num
ber
of
indiv
idual
sT1 T2 T3 T4
10100
1000
1 ???
Population CrashPopulation growth limited

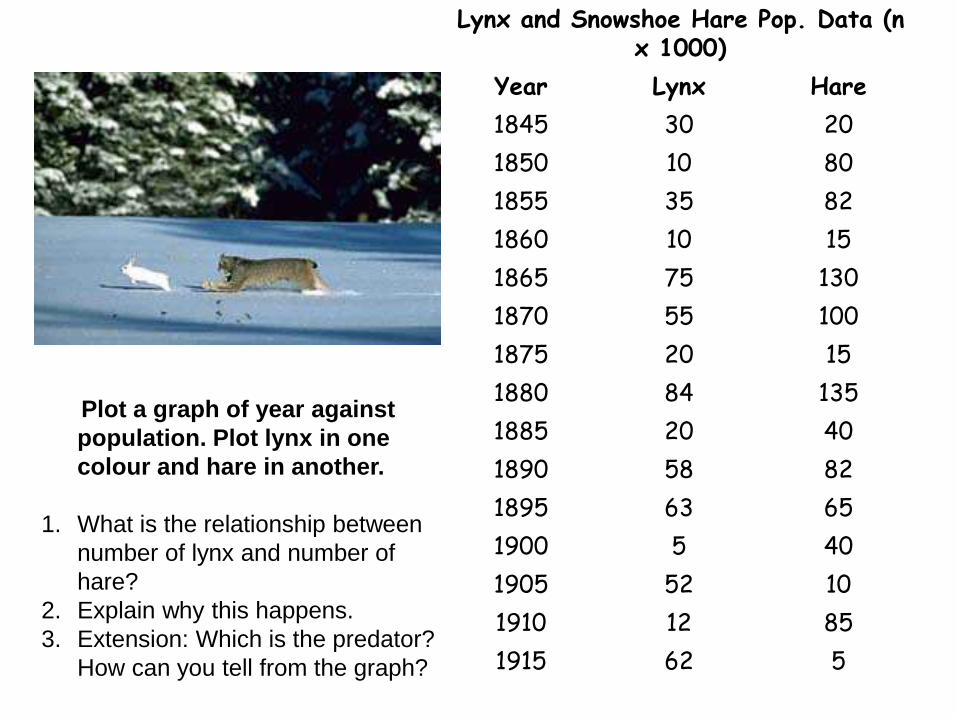
Lynx and Snowshoe Hare Pop. Data (n x 1000)
Year Lynx Hare
1845 30 20
1850 10 80
1855 35 82
1860 10 15
1865 75 130
1870 55 100
1875 20 15
1880 84 135
1885 20 40
1890 58 82
1895 63 65
1900 5 40
1905 52 10
1910 12 85
1915 62 5
Plot a graph of year against
population. Plot lynx in one
colour and hare in another.
1. What is the relationship between
number of lynx and number of
hare?
2. Explain why this happens.
3. Extension: Which is the predator?
How can you tell from the graph?