Embed Size (px)
Citation preview

PSY/315
STATISTICAL REASONING IN
PSYCHOLOGY
The Latest Version A+ Study Guide
**********************************************
PSY 315 Entire Course Link
https://uopcourses.com/category/psy-315/
**********************************************
PSY 315 Week 1 Week One Practice Problems Worksheet
Resource: Statistics for Psychology
Complete the Week One Practice Problems Worksheet.
Click the Assignment Files tab to submit your assignment.
Note. Computation methods may include the use of Microsoft® Excel
®, SPSS
™, Lotus
®,
SAS®, Minitab
®, or by-hand computation.
Week One Practice Problems
Prepare a written response to the following questions.
Chapter 1
12. Explain and give an example for each of the following types of variables:
a. Equal interval:

b. Rank-order:
c. Nominal:
d. Ratio scale:
e. Continuous:
f. Discrete:
15. Following are the speeds of 40 cars clocked by radar on a particular road in a 35-mph zone on
a particular afternoon:
30, 36, 42, 36, 30, 52, 36, 34, 36, 33, 30, 32, 35, 32, 37, 34, 36, 31, 35, 20
24, 46, 23, 31, 32, 45, 34, 37, 28, 40, 34, 38, 40, 52, 31, 33, 15, 27, 36, 40
Make a frequency table and a histogram, then describe the general shape of the distribution
21. Raskauskas and Stoltz (2007) asked a group of 84 adolescents about their involvement in
traditional and electronic bullying. The researchers defined electronic bullying as “…a means
of bullying in which peers use electronics {such as text messages, emails, and defaming Web
sites} to taunt, threaten, harass, and/or intimidate a peer” (p.565). The table below is a
frequency table showing the adolescents’ reported incidence of being victims or perpetrators or
traditional and electronic bullying.
a. Using this table as an example, explain the idea of a frequency table to a person who has
never had a course in statistics.
b. Explain the general meaning of the pattern of results.
Incidence of Traditional and Electronic Bullying and
Victimization (N=84)
Forms of Bullying N %
Electronic victims 41 48.8
Text-message victim 27 32.1
Internet victim (websites, chatrooms) 13 15.5
Picture-phone victim 8 9.5
Traditional Victims 60 71.4
Physical victim 38 45.2
Teasing victim 50 59.5
Rumors victim 32 38.6
Exclusion victim 30 50
Electronic Bullies 18 21.4
Text-message bully 18 21.4
Internet bully 11 13.1
Traditional Bullies 5 64.3
Physical bully 29 34.5
Teasing bully 38 45.2
Rumor bully 22 26.2
Exclusion bully 35 41.7
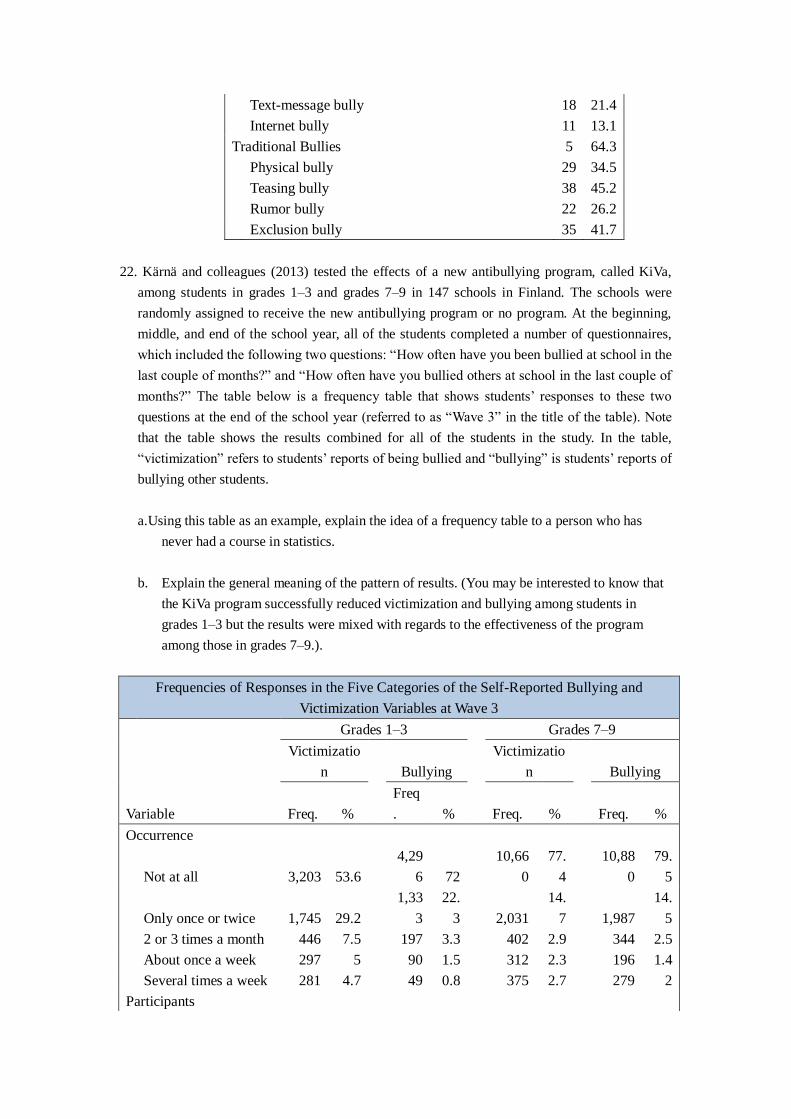
22. Kärnä and colleagues (2013) tested the effects of a new antibullying program, called KiVa,
among students in grades 1–3 and grades 7–9 in 147 schools in Finland. The schools were
randomly assigned to receive the new antibullying program or no program. At the beginning,
middle, and end of the school year, all of the students completed a number of questionnaires,
which included the following two questions: “How often have you been bullied at school in the
last couple of months?” and “How often have you bullied others at school in the last couple of
months?” The table below is a frequency table that shows students’ responses to these two
questions at the end of the school year (referred to as “Wave 3” in the title of the table). Note
that the table shows the results combined for all of the students in the study. In the table,
“victimization” refers to students’ reports of being bullied and “bullying” is students’ reports of
bullying other students.
a. Using this table as an example, explain the idea of a frequency table to a person who has
never had a course in statistics.
b. Explain the general meaning of the pattern of results. (You may be interested to know that
the KiVa program successfully reduced victimization and bullying among students in
grades 1–3 but the results were mixed with regards to the effectiveness of the program
among those in grades 7–9.).
Frequencies of Responses in the Five Categories of the Self-Reported Bullying and
Victimization Variables at Wave 3
Grades 1–3
Grades 7–9
Victimizatio
n
Bullying
Victimizatio
n
Bullying
Variable Freq. %
Freq
. % Freq. % Freq. %
Occurrence
Not at all 3,203 53.6
4,29
6 72
10,66
0
77.
4
10,88
0
79.
5
Only once or twice 1,745 29.2
1,33
3
22.
3
2,031
14.
7
1,987
14.
5
2 or 3 times a month 446 7.5
197 3.3
402 2.9
344 2.5
About once a week 297 5
90 1.5
312 2.3
196 1.4
Several times a week 281 4.7
49 0.8
375 2.7
279 2
Participants
Respondents n 5,972 100
5,96
5 100
13,78
0 100
13,68
6 100
Missing n 955
962
2,723
2,817
Total N 6,927
6,92
7
16,50
3
16,50
3
PSY 315 Week 1 Learning Team Charter
Please complete the Learning Team Charter provided by the instructor for this
course.
LEARNING TEAM CHARTER – TEAM “X”

Course Title
Team Members/Contact Information
Name Phone Time zone and
Availability During the Week
xxx-xxx-xxxx (e.g., AZ “Mtn Time”, Mon-Sat 9-11pm)
Team Ground Rules and Guidelines
What are the general expectations for all members of the
team?
___________________________________________________________________________________________
___________________________________________________________________________________________
___________________________________________________________________________________________
___________________________________________________________________________________________

___________________________________________________________________________________________
Expectations for Time Management and Involvement
(Participation, communication with the team, accessibility, etc.)
___________________________________________________________________________________________
___________________________________________________________________________________________
___________________________________________________________________________________________
___________________________________________________________________________________________
Team Leadership
Learning Teams work most effectively when there is a team leader. This can be accomplished
by having one team leader throughout the entire course or by team members taking turns each
week as the team leader. Which method do you choose? If you choose one team leader, state
who the leader is. If there is a different team leader each week, please state who will be the
leader for each week.
___________________________________________________________________________________________
___________________________________________________________________________________________
___________________________________________________________________________________________
___________________________________________________________________________________________
What are the roles and responsibilities of the team leader?
___________________________________________________________________________________________
___________________________________________________________________________________________
___________________________________________________________________________________________
___________________________________________________________________________________________
Ensuring Fair and Even Contribution and Collaboration
What strategy will you use to ensure that all team members are contributing and collaborating
appropriately? Describe the communication strategy you will use if a team member is not
contributing and collaborating effectively. How will the team manage conflicts between team
members?
___________________________________________________________________________________________
___________________________________________________________________________________________
___________________________________________________________________________________________

If team members are not contributing to an assignment equally, how will we work to resolve
this?
If a team member does not complete his/her part of the assignment, the work still must be
done. Who will complete the work of the non-contributing team member?
PSY 315 Week 2 Week Two Practice Problems Worksheet
Resource: Statistics for Psychology
Complete the Week Two Practice Problems Worksheet.
Click the Assignment Files tab to submit your assignment.
Note. Computation methods may include the use of Microsoft® Excel
®, SPSS
™, Lotus
®,
SAS®, Minitab
®, or by-hand computation.
Week Two Practice Problems
Prepare a written response to the following questions.
Chapter 2
12. For the following scores, find the mean, median, sum of squared deviations, variance, and
standard deviation:
1,112; 1,245; 1,361; 1,372; 1,472
16. A psychologist interested in political behavior measured the square footage of the desks in
the official office for four U.S. governors and of four chief executive officers (CEOs) of major
U.S. corporations. The figures for the governors were 44, 36, 52, and 40 square feet. The figures
for the CEOs were 32, 60, 48, 36 square feet.
a. Figure the means and standard deviations for the governors and CEOs.
b. Explain, to a person who has never had a course in statistics, what you have done.
c. Note the waus in which the means and standard deviations differ, and speculate on
the possible meaning of these differences, presuming that they are representative
of U.S. governors and large corporations’ CEOs in general.
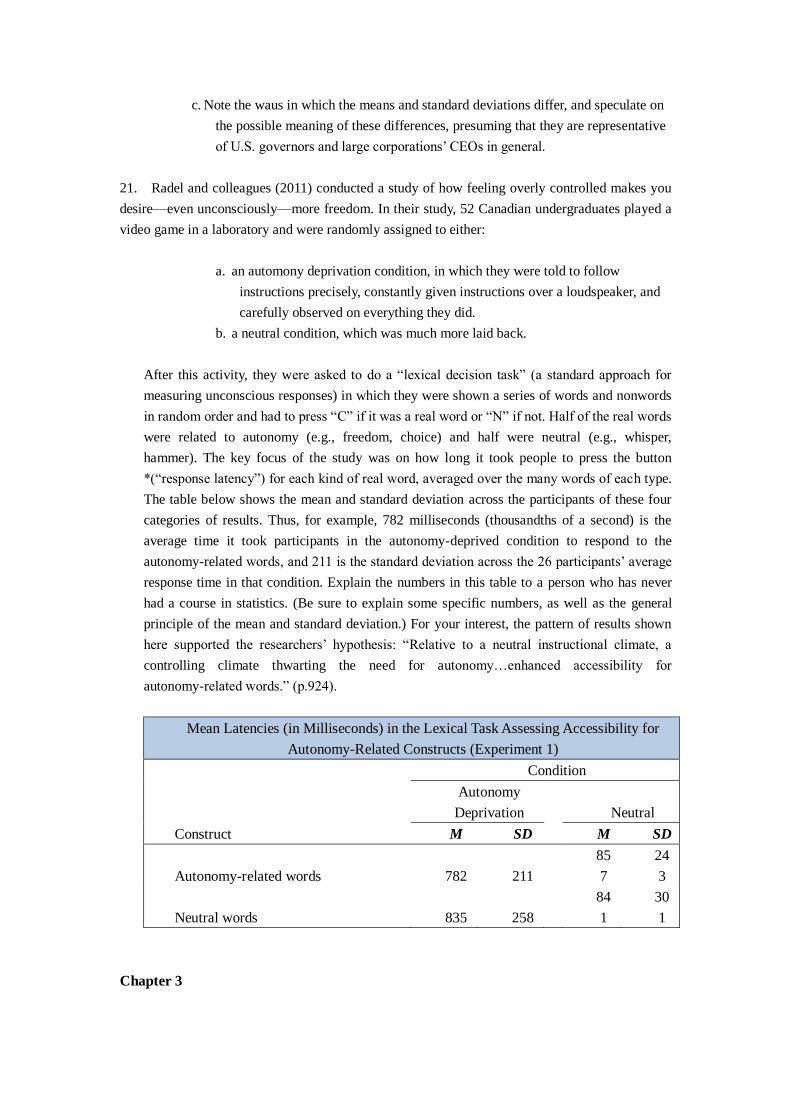
21. Radel and colleagues (2011) conducted a study of how feeling overly controlled makes you
desire—even unconsciously—more freedom. In their study, 52 Canadian undergraduates played a
video game in a laboratory and were randomly assigned to either:
a. an automony deprivation condition, in which they were told to follow
instructions precisely, constantly given instructions over a loudspeaker, and
carefully observed on everything they did.
b. a neutral condition, which was much more laid back.
After this activity, they were asked to do a “lexical decision task” (a standard approach for
measuring unconscious responses) in which they were shown a series of words and nonwords
in random order and had to press “C” if it was a real word or “N” if not. Half of the real words
were related to autonomy (e.g., freedom, choice) and half were neutral (e.g., whisper,
hammer). The key focus of the study was on how long it took people to press the button
*(“response latency”) for each kind of real word, averaged over the many words of each type.
The table below shows the mean and standard deviation across the participants of these four
categories of results. Thus, for example, 782 milliseconds (thousandths of a second) is the
average time it took participants in the autonomy-deprived condition to respond to the
autonomy-related words, and 211 is the standard deviation across the 26 participants’ average
response time in that condition. Explain the numbers in this table to a person who has never
had a course in statistics. (Be sure to explain some specific numbers, as well as the general
principle of the mean and standard deviation.) For your interest, the pattern of results shown
here supported the researchers’ hypothesis: “Relative to a neutral instructional climate, a
controlling climate thwarting the need for autonomy…enhanced accessibility for
autonomy-related words.” (p.924).
Mean Latencies (in Milliseconds) in the Lexical Task Assessing Accessibility for
Autonomy-Related Constructs (Experiment 1)
Condition
Autonomy
Deprivation
Neutral
Construct M SD
M SD
Autonomy-related words 782 211
85
7
24
3
Neutral words 835 258
84
1
30
1
Chapter 3

14. On a standard measure of hearing ability, the mean is 300 and the standard deviation is 20.
Give the raw scores for persons whose Z scores for persons who score 340, 310, and 260. Give the
raw scores for persons whose Z scores on this test are 2.4, 1.5, and -4.5.
16. The amount of time it takes to recover physiologically from a certain kind of sudden noise is
found to be normally distributed with a mean of 80 seconds and a standard deviation of 10
seconds. Using the 50%–34%–14% figures, approximately what percentage of scores (on time to
recover) will be:
Above 100?
Below 100?
Above 90?
Below 90?
Above 80?
Below 80?
Above 70?
Below 70?
Above 60?
Below 60?
18. Suppose that the scores of architects on a particular creativity test are normally distributed.
Using a normal curve table, what percentage of architects have Z scores:
Above .10?
Below .10?
Above .20?
Below .20?
Above 1.10?
Below 1.10?
Above -.10?
Below -.10?
21. Suppose that you are designing an instrument panel for a large industrial machine. The
machine requires the person using it to reach 2 feet from a particular position. The reach from this
position for adult women is known to have a mean of 2.8 feet with a standard deviation of .5. The
reach for adult men is known to have a mean of 3.1 feet with a standard deviation of .6. Both
women’s and men’s reach from this position is normally distributed. If this design is implemented:
What percentage of women will not be able to work on this instrument panel?
What percentage of men will not be able to work on this instrument panel?
Explain your answers to a person who has never had a course in statistics.
24. Suppose that you were going to conduct a survey of visitors to your campus. You want the
survey to be as representative as possible.
How would you select the people to survey?
Why would that be your best method?
PSY 315 Week 2 Descriptive and Inferential Statistics
Presentation
Resource: Assigned journal article
Create a 7- to 10-slide presentation with speaker notes examining the differences
between descriptive and inferential statistics used in the journal article you were assigned.
Address the following items as they apply to the article:
Describe the functions of statistics.
Define descriptive and inferential statistics.
Provide at least one example of the relationship between descriptive and
inferential statistics.
Format your presentation consistent with APA guidelines.
Note: A minimum of 3 scholarly sources are required. Scholarly sources are journal
articles or books. Websites will only be considered supplemental sources and will not be
included as a part of the minimum of 3 scholarly sources required for papers.
Click the Assignment Files tab to submit your assignment.
PSY 315 Week 3 Week Three Practice Problems Worksheet
Resource: Statistics for Psychology
Complete the Week Three Practice Problems Worksheet.
Click the assignment files tab to submit your assignment.
Note. Methods of computation may include the usage of Microsoft® Excel®, SPSS™,
Lotus®, SAS®, Minitab®, or by-hand computation.
Week Three Practice Problems
Prepare a written response to the following questions.

Chapter 4
11. List the five steps of hypothesis testing, and explain the procedure and logic of each.
14. Based on the information given for the following studies, decide whether to reject the null
hypothesis. Assume that all populations are normally distributed. For each, give:
a. The Z-score cutoff (or cutoffs) on the comparison distribution at which the null
hypothesis should be rejected.
b. The Z-score on the comparison distribution for the sample score.
c. Your conclusion.
Study µ σ
Sample
Score p Tails of Tests
A 5 1 7 0.05 1 (high predicted)
B 5 1 7 0.05 2
C 5 1 7 0.01 1 (High predicted)
D 5 1 7 0.01 2
18. A researcher predicts that listening to music while solving math problems will make a
particular brain area more active. To test this, a research participant has her brain scanned
while listening to music and solving math problems, and the brain area of interest has a
percentage signal change of 58. From many previous studies with this same math
problem’s procedure (but not listening to music), it is known that the signal change in this
brain is normally distributed with a mean of 35 and a standard deviation of 10.
a. Using the .01 level, what should the researcher conclude? Solve this problem explicity
using all five steps of hypothesis testing, and illustrate your answer with a sketch showing
the comparison distribution, the cutoff (or cutoffs), and the score of the sample on this
distribution.
b. Explain your answer to someone who has never had a course in statistics (but who is
familiar with mean, standard deviation, and Z scores).
PSY 315 Week 3 Research Article Critique
Select an article from the university library.
Provide a 1050 to 1400 word paper in which you include the following information about
the article:
A brief summary of the background of the topic of the article

The researchers' hypothesis
Explain the 5 steps of hypothesis testing and explain how the researchers used
them in their study
Provide your team's critique of the research including the limitations of the study
Format your paper in APA style.
Click the Assignment Files tab to submit your assignment.
PSY 315 Week 4 Week Four Practice Problems Worksheet
Resource: Statistics for Psychology
Complete the Week Four Practice Problems Worksheet.
Click on the assignment files tab to submit your assignment.
Note. Methods of computation may include the usage of Microsoft® Excel®, SPSS™,
Lotus®, SAS®, Minitab®, or by-hand computation.
Week Four Practice Problems
Prepare a written response to the following questions.
Chapter 7
26. The table below shows ratings of various aspects of work and home life of 100
middle-class men in India who were fathers. Pick three rows of interest to you and
explain the results to someone who is familiar with the mean, variance, and Z scores, but
knows nothing else about statistics.
Comparison of Fathers' Mean Psychological States in the Job and
Home Spheres (N = 100)
Sphere
Scale Range Work Home Work vs. home
Important 0-9 5.98 5.06 6.86***
Attention 0-9 6.15 5.13 7.96***
Challenge 0-9 4.11 2.41 11.49***
Choice 0-9 4.28 4.74 -3.38***
Wish doing else 0-9 1.5 1.44 0.61
Hurried 0-3 1.8 1.39 3.21**
Social Anxiety 0-3 0.81 0.64 3.17**
Affect 1-7 4.84 4.98 -2.64**
Social Climate 1-7 5.64 5.95 4.17***

Note: Values for column 3 are t scores; df = 90 for all t tests.
**p < .01
***p < .001
Chapter 8
12. Barker and colleagues (2012) compared 61 parents fo children who had a serious mental
illness (SMI) to 321 parents of children withour such an illness. The researchers
examined the parents’ reported levels of stress, their levels of a hormone called cortisol
(levels of this hormone provide an indication of chronic stress), and their use of several
types of medication. The table below shows the results of the study. Focusing on the
parents’ number of stressors (the first row of the table) and the parents’ use of medications
for anxiety or depression (the last row in the table), explain these results to a person who
knows about the t test for a single sample but is unfamiliar with the t test for independent
means.
Descriptive Statistics and Mean-Level Comparisons
SMI Parents
Comparison
Parents
N = 61
N = 321
Mean SD Mean SD t p
Stress
Number of stressors 0.65 0.56
0.42 0.37
-3.08 0.00
Stress severity sum 1.89 1.63
1.16 1.1
-3.3 0.00
Cortisol (nmol/L)
Wake 17.46 10.72
16.75 7.38
-0.14 0.90
Out of bed 22.83 11.48
24.19 10.59
1.13 0.26
Bed 5.72 8.56
4.22 5.57
-1.86 0.06
Cortisol awakening response 5.62 9.7
7.48 8.34
1.55 0.12
Decline from out of bed 17.13 11.35
20.11 10.71
1.97 0.05
Medication use (proportion)
Allergy 0.26 0.44
0.16 0.37
-1.71 0.09
Steroid 0.2 0.4
0.12 0.33
-1.32 0.19
Hormone 0.13 0.34
0.14 0.35
0.25 0.80
Anxiety or depression 0.26 0.44 0.12 0.33 -2.36 0.02
14. For each of the following studies, say whether you would use a t test for dependent means
or a t test for independent means.
d. A researcher measures the heights of 40 university students who are the firstborn in their
families and compares the 15 who come from large families to the 25 who come from
smaller families.
e. A researcher tests performance on a math skills test of each of 250 individuals before and
after they complete a one-day seminar on managing test anxiety.

f. A researcher compares the resting heart rate of 15 individuals who have been taking a
particular drug to the resting heart rate of 48 other individuals who have not been taking
the drug.
Chapter 9
23. An experiment is conducted in which 60 participants each fill out a personality test, but
not according to the way the participants see themselves. Instead, 15 are randomly
assigned to fill it out according to the way they think theur mothers see them (that is, the
way they think their mothers would fill it out to describe the participants); 15 as their
fathers would fill it out for them; 15 as their best friends would fill it out for them; 15 as
the professors they know best would fill it out for them. The main results appear in Table
9-17. Explain these results to a person who has never had a course in statistics.
Means for Main Personality Scales for Each Experimental Condition
Scale Mother Father Friend Professor F(3, 56)
Conformity 24 21 12 16 4.21**
Extroversion 14 13 15 13 2.05
Maturity 15 15 22 19 3.11*
Self-Confidence 38 42 27 32 3.58*
*p < .05, **p < .01
24. Rosalie Friend (2001), and educational psychologist, compared three methods of teaching
writing. Students were randomly assigned to three different experimental conditions involving
different methods of writing a summary. At the end of the two days of instructions,
participants wrote a summary. One of the ways it was scored was the percentage of specific
details of information it included from the original material. Here is a selection from her
article describing one of the findings:
The effect of summarization method on inclusion of important information was
significant F(2, 144) = 4.1032, p < .019. The mean scores (with standard deviations in
parantheses) were as follows: Argument Repetition, 59.6% (17.9); Generalization, 59.8%
(15.2); and Self-Reflection, 50.2% (18.0). (p.14)
a. Explain these results to a person who has never had a course in statistics.
b. Using the information in the preceding description, figure the effect size for the study.
PSY 315 Week 4 Hypothesis Testing Outline
Select a research issue, problem, or opportunity in the field of psychology.

Prepare a document outlining the information you plan to discuss in your Week 5 paper.
Your outline should include at minimum the following:
Describe your selected research issue, problem, or opportunity.
Formulate a hypothesis statement concerning your selected research issue,
problem, or opportunity.
Determine your population and describe which sampling method you would use to
generate your sample
Describe how you would collect your data, the level of measurement of your data
and which statistical technique you would use to analyze the data. Explain why
you chose that statistical technique.
At least 3 scholarly sources you plan to use for your paper
Include a conclusion of your anticipated findings.
Note: A minimum of 3 scholarly sources are required. Scholarly sources are journal
articles or books. Websites will only be considered supplemental sources and will not be
included as a part of the minimum of 3 scholarly sources required for papers.
Click the Assignment Files tab to submit your assignment.
PSY 315 Week 5 Hypothesis Testing Paper
Resource: Instructor approved research issue, problem, or opportunity in the field of
psychology
Prepare a 1,400- to 1,750-word paper in which you formulate a hypothesis based on your
selected research issue, problem, or opportunity.
Address the following:
Describe your selected research issue, problem, or opportunity.
Formulate a hypothesis statement concerning your selected research issue,
problem, or opportunity.
Determine your population and describe which sampling method you would use to
generate your sample
Describe how you would collect your data, the level of measurement of your data
and which statistical technique you would use to analyze the data. Explain why
you chose that statistical technique.

Include a conclusion of your anticipated findings.
Format your paper consistent with APA guidelines.
Click the Assignment Files tab to submit your assignment.
PSY 315 Week 5 Correlation Study Worksheet
Resource: Statistics for Psychology
Complete the Correlation Study Worksheet.
Click the Assignment Files tab to submit your assignment.
Correlation Study Worksheet
Your research team has been tasked with finding the correlation of the following scenario:
Four research participants take a test of manual dexterity (high scores mean better dexterity)
and an anxiety test (high scores mean more anxiety). The scores are as follows:
Person Dexterity Anxiety
1 1 10
2 1 8
3 2 4
4 4 -2
Describe the process that your research team would go through by completing the following:
1. Make a scatter diagram of the scores.
2. Describe in words the general pattern of correlation, if any.
3. Figure the correlation coefficient.
4. Figure whether the correlation is statistically significant (use the .05 significance level,
two-tailed).
5. Explain the logic of what you have done, writing as if you are speaking to someone who
has never heard of correlation (but who does understand the mean, standard deviation, Z
scores, and hypothesis testing).
6. Give three logically possible directions of causality, indicating for each direction whether
it is a reasonable explanation for the correlation in light of the variables involved (and
why).


![[Psy] ch03](https://img.pdfslide.us/doc/110x75/555d741ad8b42a687b8b53c6/psy-ch03.jpg)