Embed Size (px)
Citation preview
Seminar presentation on
PROJECT SCHEDULING
G R O U P M E M B E R S :
A J E ES H M O OSA KU T T Y ( 4 )
S A B I T H P ( 3 3 )
S R U T H I . K . R ( 4 5 )
S H A F EEK M A ( )
N I D EES H ( )
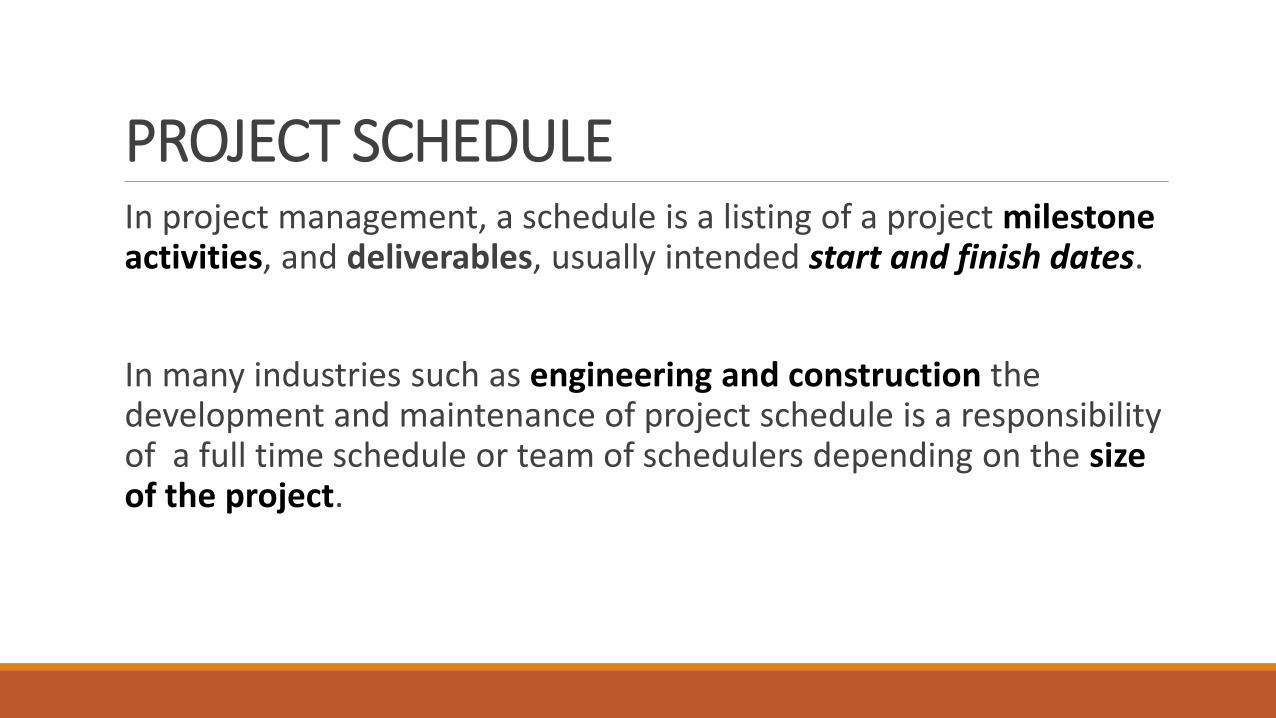
PROJECT SCHEDULEIn project management, a schedule is a listing of a project milestone activities, and deliverables, usually intended start and finish dates.
In many industries such as engineering and construction the development and maintenance of project schedule is a responsibility of a full time schedule or team of schedulers depending on the size of the project.
TERMINOLOGIES IN PROJECT SCHEDULINGMILESTONE: A milestone is a significant event that normally has no duration
It often takes several activities and a lot of work to complete a milestone
They’re useful tools for setting schedule goals and monitoring progress
Examples include obtaining customer sign-off on key documents or completion of specific products
Milestones should be:Specific Measurable Assignable Realistic Time-framed
BASIC STEPS TAKEN IN PROJECT MANAGEMENT
•Define Activities – identifying the specific actions to be performed to produce the project deliverables
•Sequencing Activities – identifying and documenting relationships among the project activities.
•Estimate Activity Resources – estimating the type and quantities of material, people, equipment, or supplies required to perform each activity.
•Estimate Activity Duration – approximating the number of work periods needed to complete individual activities with estimated resources.
BASIC STEPS TAKEN IN PROJECT MANAGEMENT -continue•Develop Schedule – analyzing activity sequences, durations, resource requirements, and schedule constraints to create the project schedule.
•Control Schedule – monitoring the status of the project to update project progress and managing changes to the schedule baseline
TECHNIQUE USED PROJECT SCHEDULING Before a project schedule can be created the schedule maker.
It should have a WORK BREAKDOWN STRUCTURE (WBS) an effort estimate for each task and resource list with available resource.
WORK BREAKDOWN STRUCTUREDividing complex projects to simpler and manageable tasks is the process identified as WORK BREAKDOWN STRUCTURE (WBS).
Usually, the project managers use this method for simplifying the project execution. In WBS, much larger tasks are broken-down to manageable chunks of work. These chunks can be easily supervised and estimated.
Further sub dividing can be said as Decomposition.
WORK BREAKDOWN STRUCTURE(CONTINUE)In project management and systems engineering, is a deliverable oriented decomposition of a project into smaller components.
A work breakdown structure element may be a product, data, a service, or any combination. A WBS also provides the necessary framework for detailed cost estimating and control along with providing guidance for schedule development and control
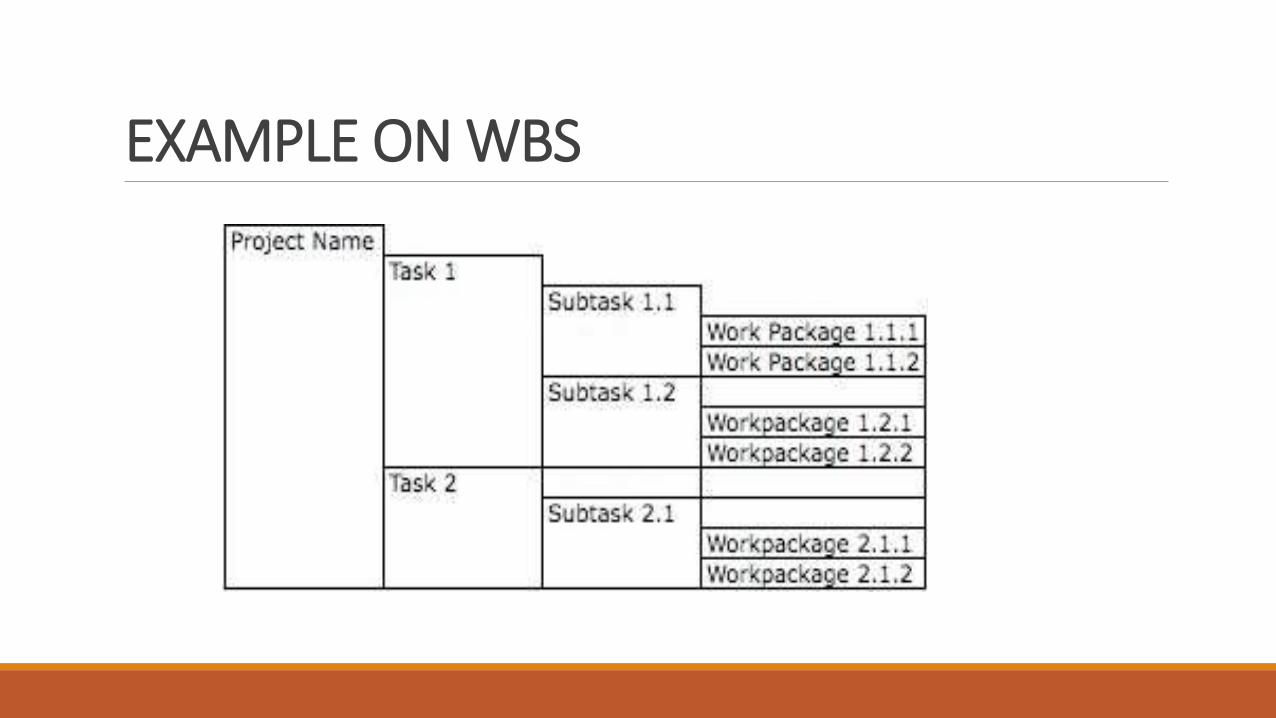
EXAMPLE ON WBS
AIM OF WORK BREAKDOWN STRUCTUREGiving visibility to important work efforts.
Giving visibility to risky work efforts.
Illustrate the correlation between the activities and deliverables.
Show clear ownership by task leaders.
METHODS FOR MAKING A PROJECT SCHEDULE HEALTHY
• Schedule must be constantly updated.
• The EAC(Estimation At Completion) value must be equal base line value.
•The remaining efforts must be approximately distributed among team members(taking vacation into consideration).
SCHEDULING TOOLS OR TECHNIQUESMOSTLY COMMONLY USED METHODS ARE:
1. GANTT CHART
2. NETWORK DIAGRAMS(PERT/CPM)
SCHEDULING TOOLSGantt chart
A bar chart that is a visual representation of the sequencing and duration of activities on any given project.
Useful:◦ Easy to read
◦ Give each team members overview of the project.
◦ Indicate clearly the status of each activity
◦ Can be drawn to show the budgets, equipment's usage
GANTT CHART
Gantt charts are used as a tool to monitor and control the project progress.
Developed in 1918 by H.L. Gantt
A Gantt chart is a graphical presentation that displays activities as follows:◦ Time is measured on the horizontal axis. A horizontal bar is drawn proportionately to an
activity’ s expected completion time.
◦ Each activity is listed on the vertical axis.
In an earliest time Gantt chart each bar begins and ends at the earliest start/finish the activity can take place.
APPLICATION OF GANTT CHARToGantt chart can be used as a visual aid for tracking the progress of project activities.
oAppropriate percentage of a bar is shaded to document the completed work.
oThe manager can easily see if the project is progressing on schedule (with respect to the earliest possible completion times).
ADVANTAGES AND DISADVANTAGES OF GANTT CHART
Advantages.◦ Easy to construct
◦ Gives earliest completion date.
◦ Provides a schedule of earliest possible start and finish times of activities.
Disadvantages◦ Gives only one possible schedule (earliest).
◦ Does not show whether the project is behind schedule.
◦ Does not demonstrate the effects of delays in any one activity on the start of
another activity, thus on the project completion time.
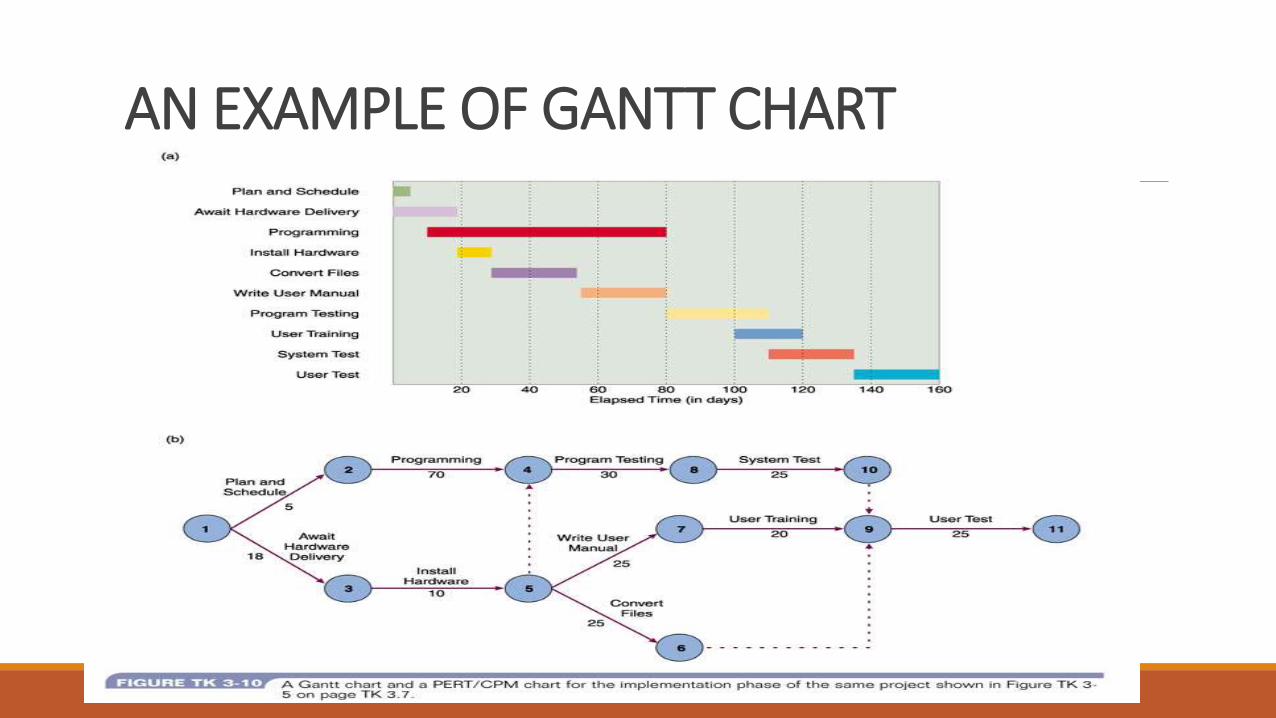
AN EXAMPLE OF GANTT CHART
NETWORK DIAGRAM Is a graphical depiction of project tasks and their inter-relationships.
The distinguishing feature of a network diagram is that the ordering of tasks is shown by connecting with its predecessor and successor tasks.
Network diagramming is a critical path scheduling technique used for controlling resources.
Critical path scheduling
A Scheduling Technique whose order and duration of a sequence of task activities directly affect the completion date of a project.
CRITICAL PATH METHOD(CPM)CPM is a network diagramming technique used to predict total project duration.
A critical path for a project is the series of activities that determines the earliest time by which the project can be completed.
The critical path is the longest path through the network diagram and has the least amount of slack or float.
Slack or float is the amount of time an activity can be delayed without delaying a succeeding activity or the project finish date.
Reducing an activity’s completion time is called “crashing.”
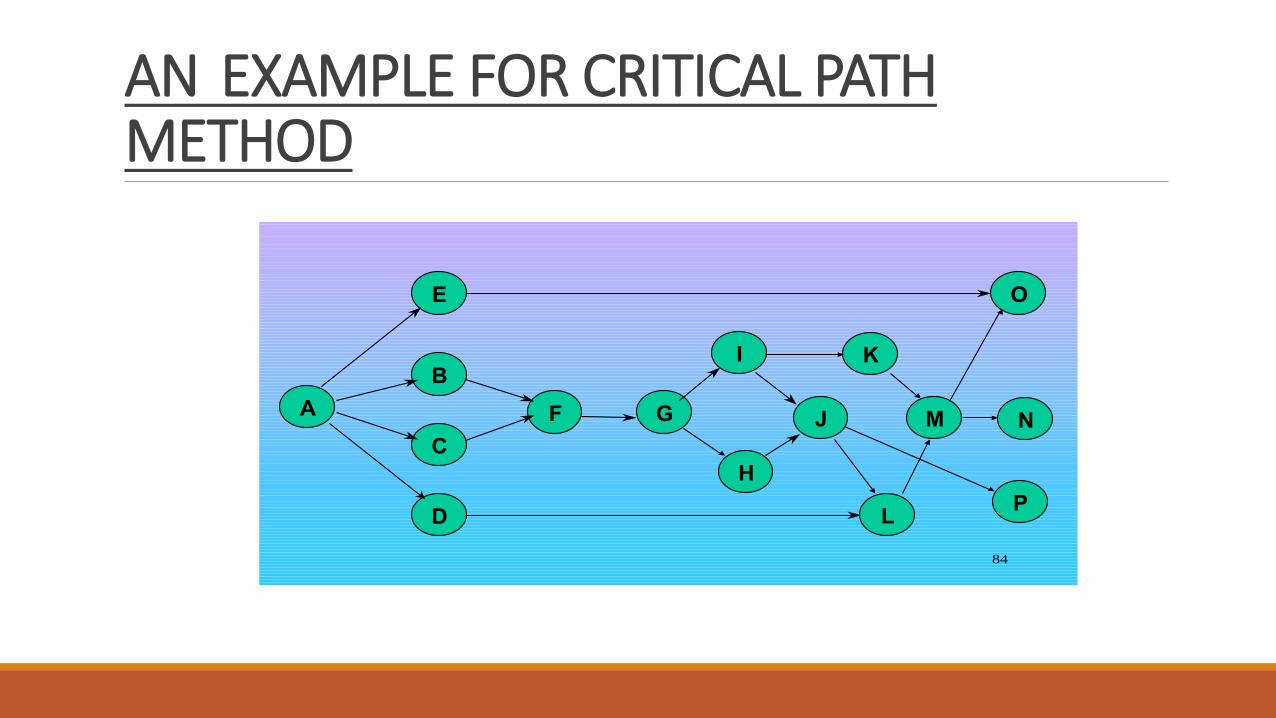
AN EXAMPLE FOR CRITICAL PATH METHOD
84
A
D
C
B
E
F G
I
H
Baja Burrito Restaurants –
Network presentation
L
O
J NM
K
P
PROGRAM EVALUATION REVIEW TECHNIQUE (PERT)
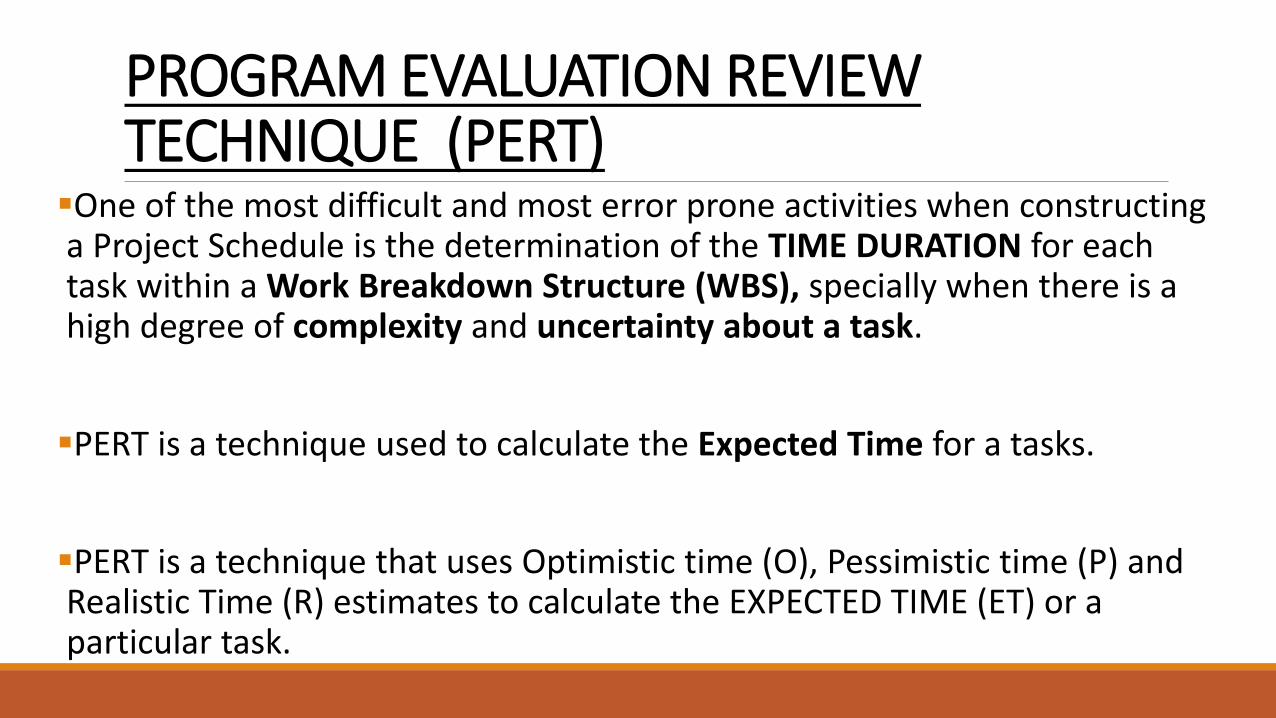
One of the most difficult and most error prone activities when constructing a Project Schedule is the determination of the TIME DURATION for each task within a Work Breakdown Structure (WBS), specially when there is a high degree of complexity and uncertainty about a task.
PERT is a technique used to calculate the Expected Time for a tasks.
PERT is a technique that uses Optimistic time (O), Pessimistic time (P) and Realistic Time (R) estimates to calculate the EXPECTED TIME (ET) or a particular task.
PROGRAM EVALUATION REVIEW TECHNIQUE (PERT) -continue
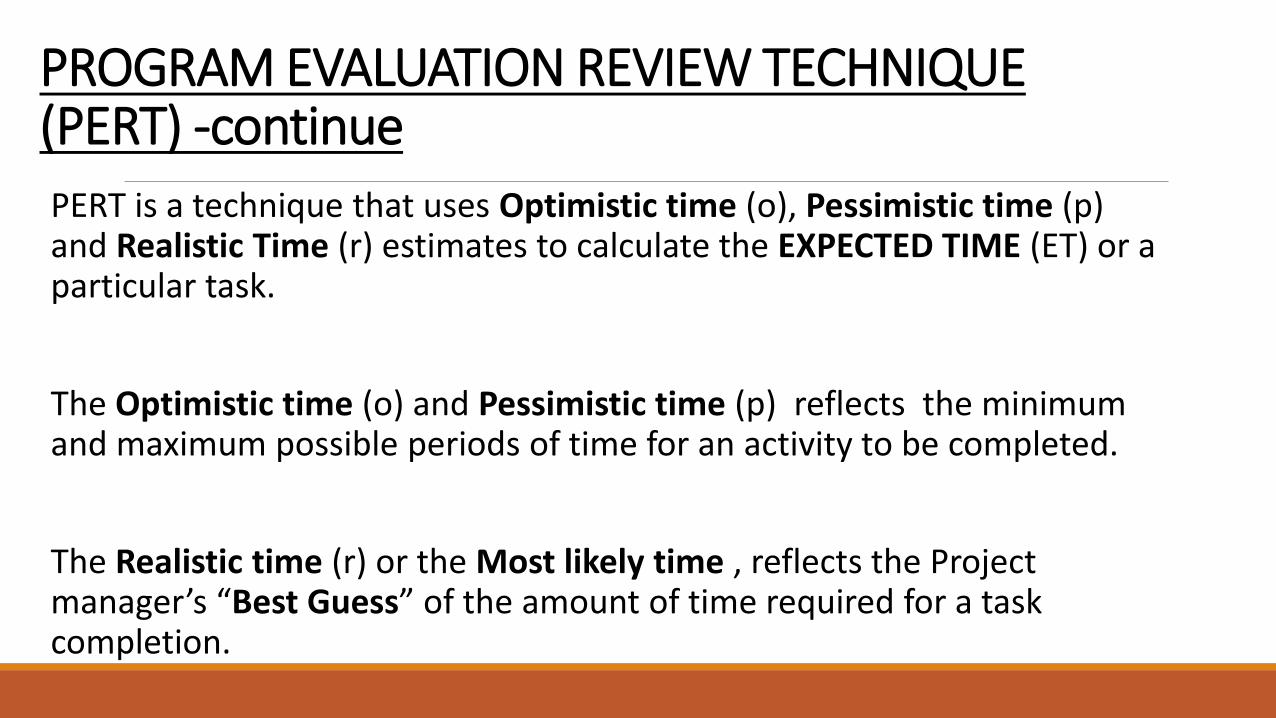
PERT is a technique that uses Optimistic time (o), Pessimistic time (p) and Realistic Time (r) estimates to calculate the EXPECTED TIME (ET) or a particular task.
The Optimistic time (o) and Pessimistic time (p) reflects the minimum and maximum possible periods of time for an activity to be completed.
The Realistic time (r) or the Most likely time , reflects the Project manager’s “Best Guess” of the amount of time required for a task completion.
PROGRAM EVALUATION REVIEW TECHNIQUE (PERT) -continue
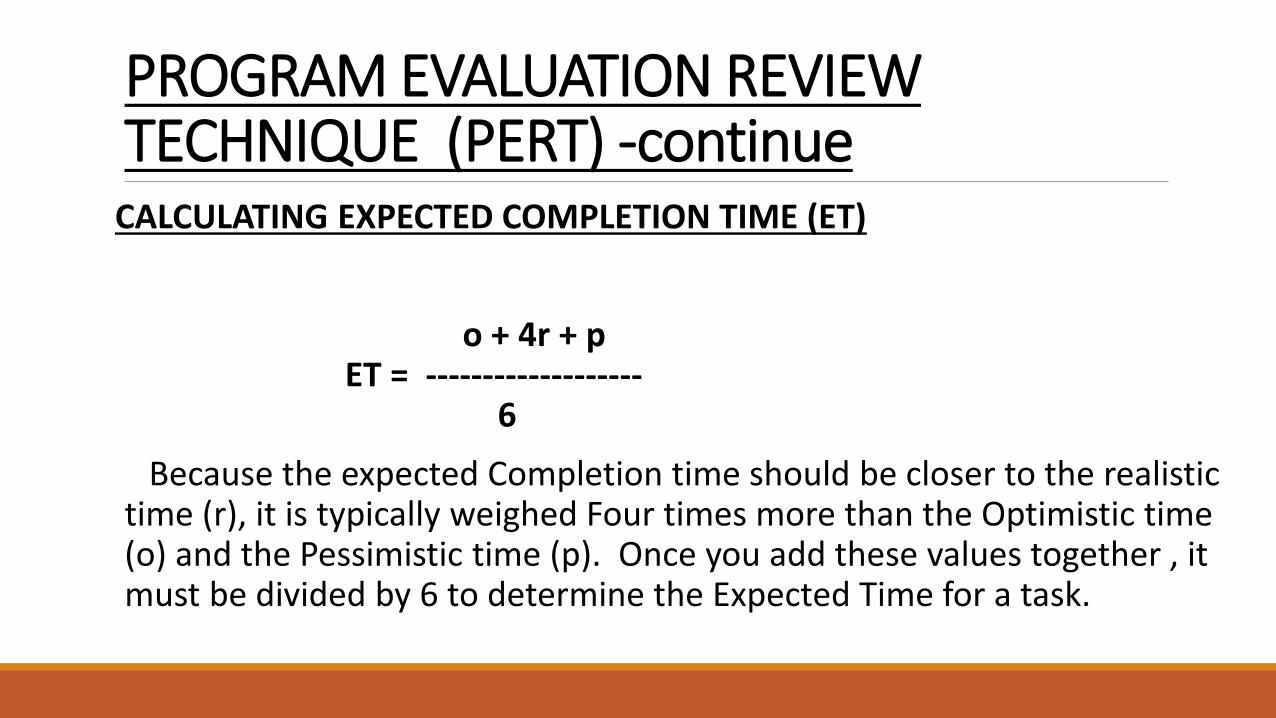
CALCULATING EXPECTED COMPLETION TIME (ET)
o + 4r + pET = -------------------
6
Because the expected Completion time should be closer to the realistic time (r), it is typically weighed Four times more than the Optimistic time (o) and the Pessimistic time (p). Once you add these values together , it must be divided by 6 to determine the Expected Time for a task.
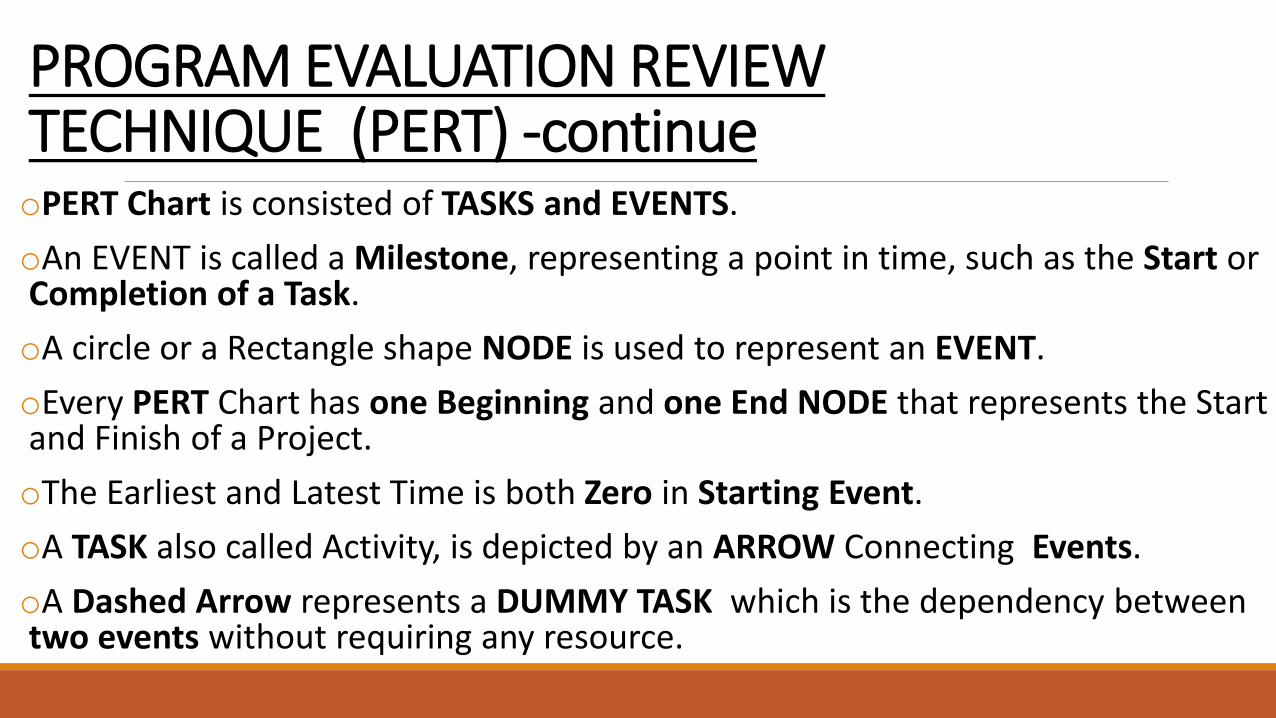
PROGRAM EVALUATION REVIEW TECHNIQUE (PERT) -continueoPERT Chart is consisted of TASKS and EVENTS.
oAn EVENT is called a Milestone, representing a point in time, such as the Start or Completion of a Task.
oA circle or a Rectangle shape NODE is used to represent an EVENT.
oEvery PERT Chart has one Beginning and one End NODE that represents the Start and Finish of a Project.
oThe Earliest and Latest Time is both Zero in Starting Event.
oA TASK also called Activity, is depicted by an ARROW Connecting Events.
oA Dashed Arrow represents a DUMMY TASK which is the dependency between two events without requiring any resource.
PERT/CPM Network◦ Activity-On-Nodes
◦ Activity-On-Arrows
ACTIVITY-ON-NODE:
Activity-On-Nodes each activity is represented by nod or a box.
PRECEDENCE DIAGRAMMING METHOD
The precedence diagramming method (PDM) is a way of constructing a project network diagram that employs boxes or rectangles (nodes) to represent the activities and connects them with arrows that show the dependencies. Essentially, it is an AON network logic diagram with time added.
To calculate project duration using a PDM, you identify the early start and early finishes using a calculation known as forward pass. A similar calculation, known as backward pass, is used to calculate the critical path for the project with the float of each activity.
-continueFORWARD PASS:
Forward pass is the calculation of the early start and early finish dates for the uncompleted portions of all network activities.
BACKWARD PASS:
Backward pass is the calculation of late finish dates and late start dates for the uncompleted portions of all network activities. It is determined by working backwards through the network logic from the project’s end date. The end date may be calculated in a forward pass or set by the customer or sponsor.
DIFFERENT TASK DEPENDENCY RELATIONSHIPS(ACTIVITY-ON-NODES)
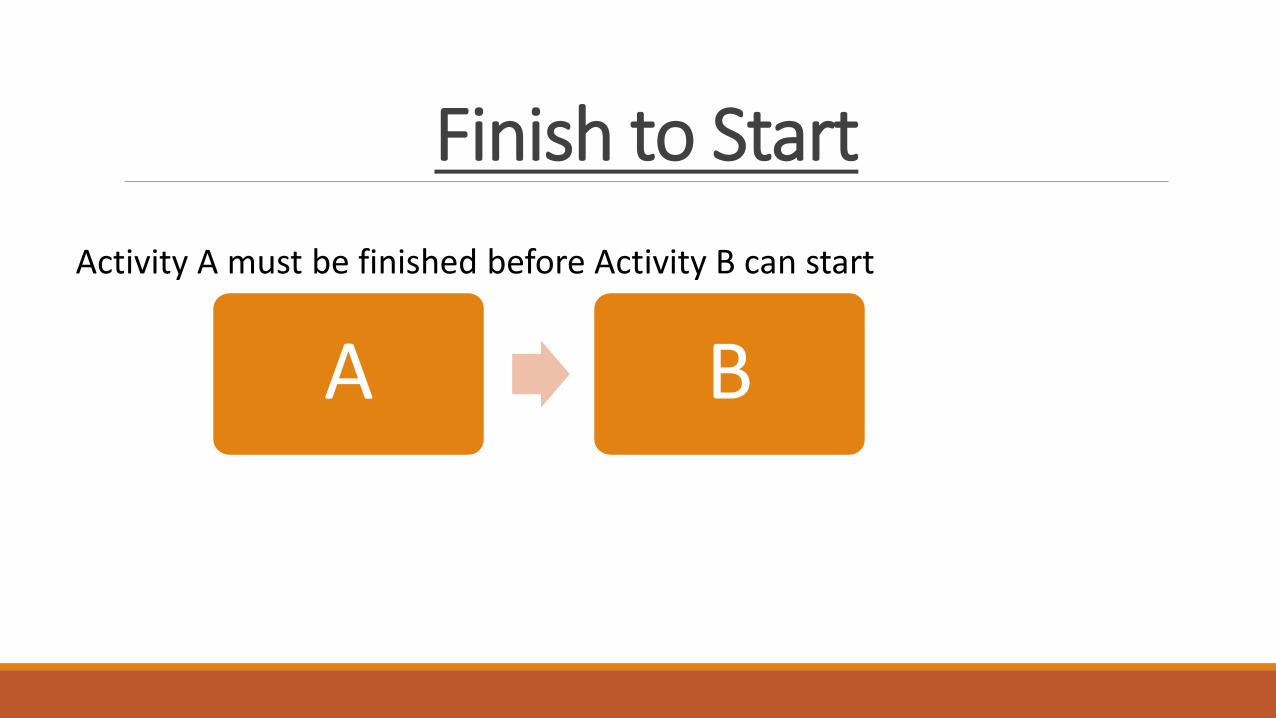
Finish to Start
Activity A must be finished before Activity B can start
A B
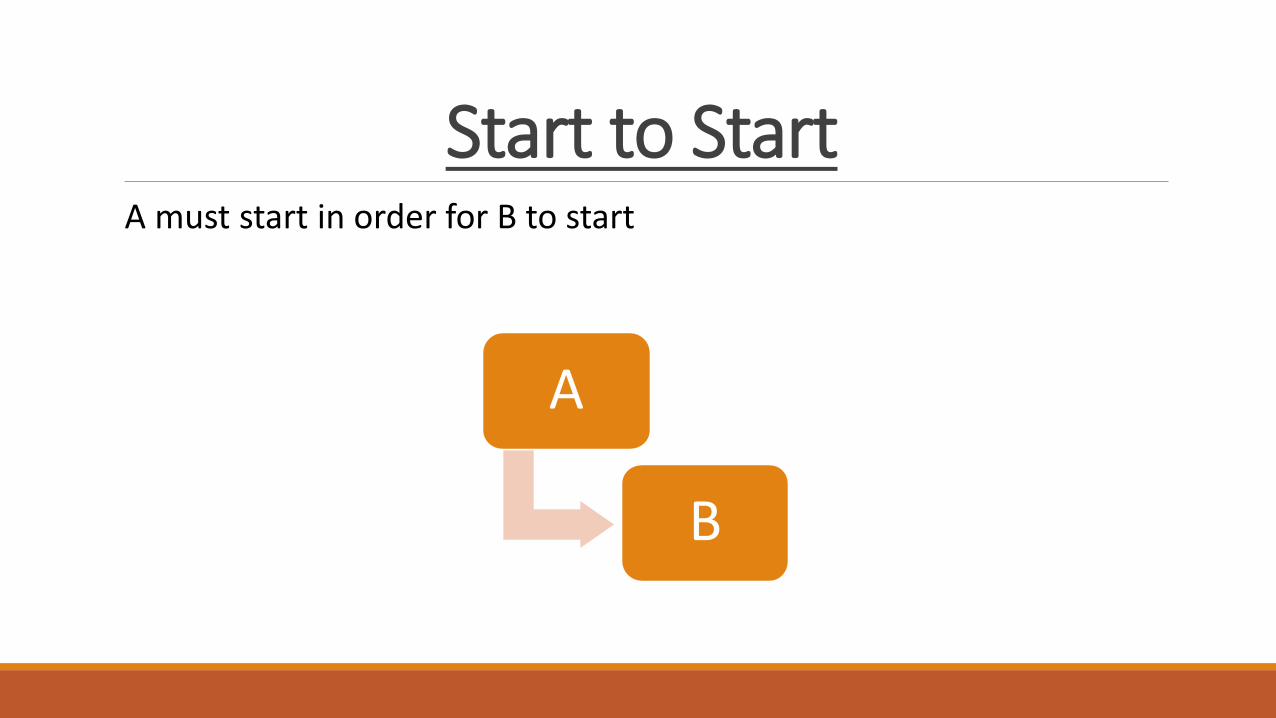
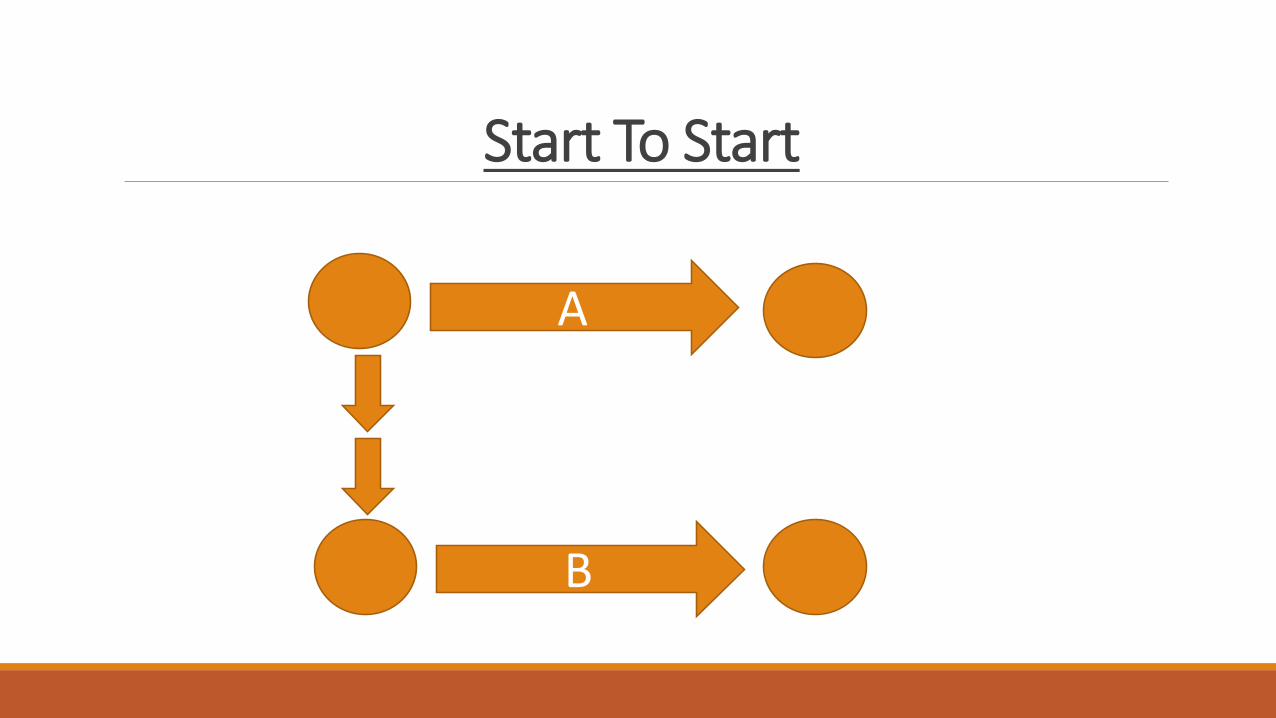
Start to StartA must start in order for B to start
A
B
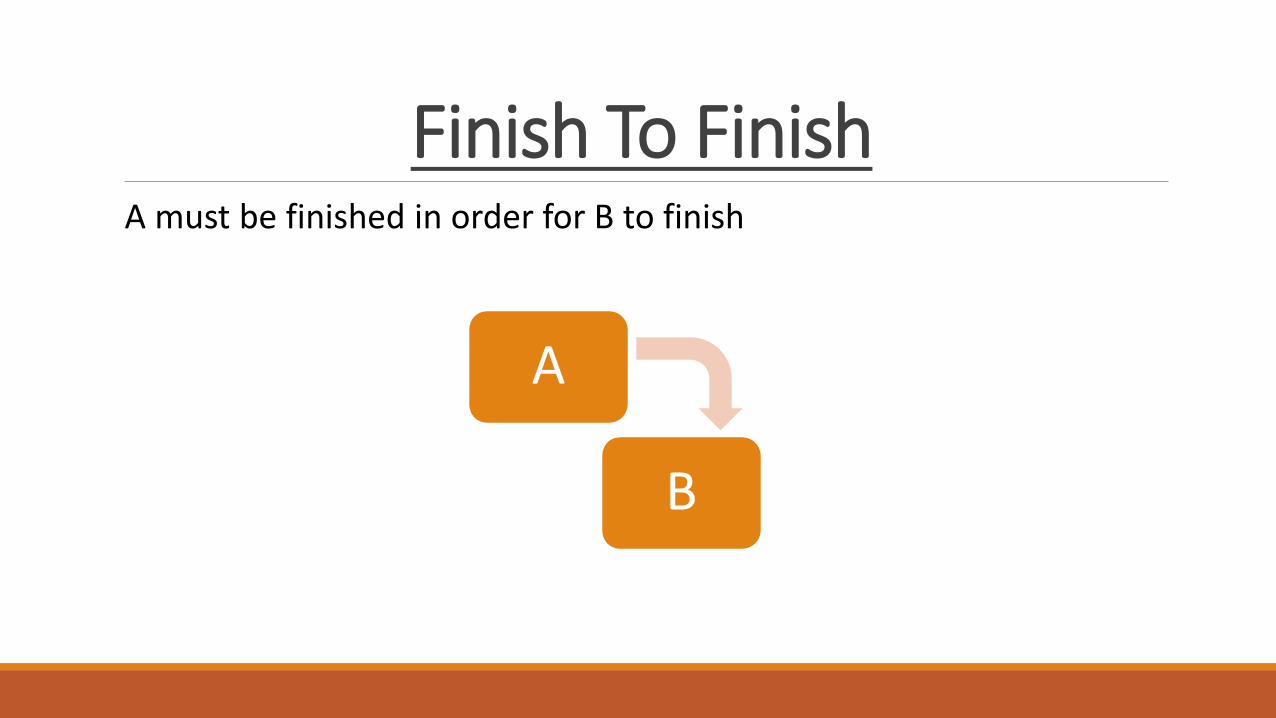
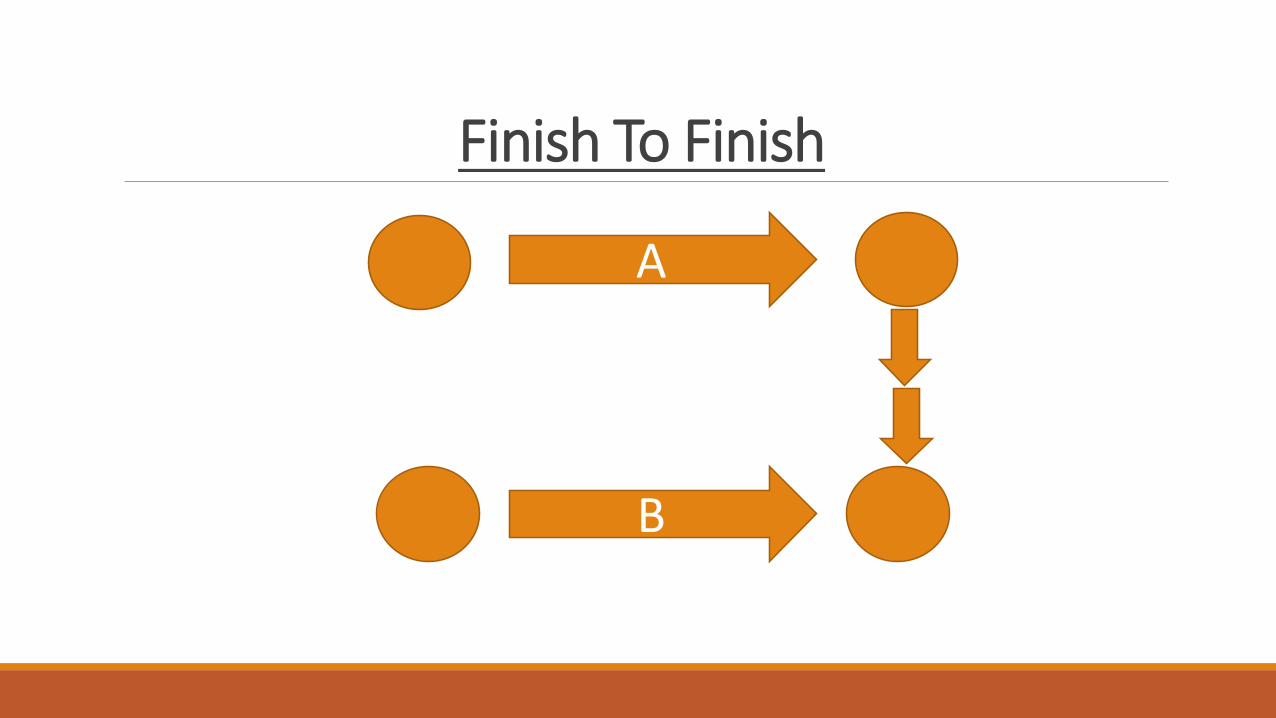
Finish To FinishA must be finished in order for B to finish
A
B
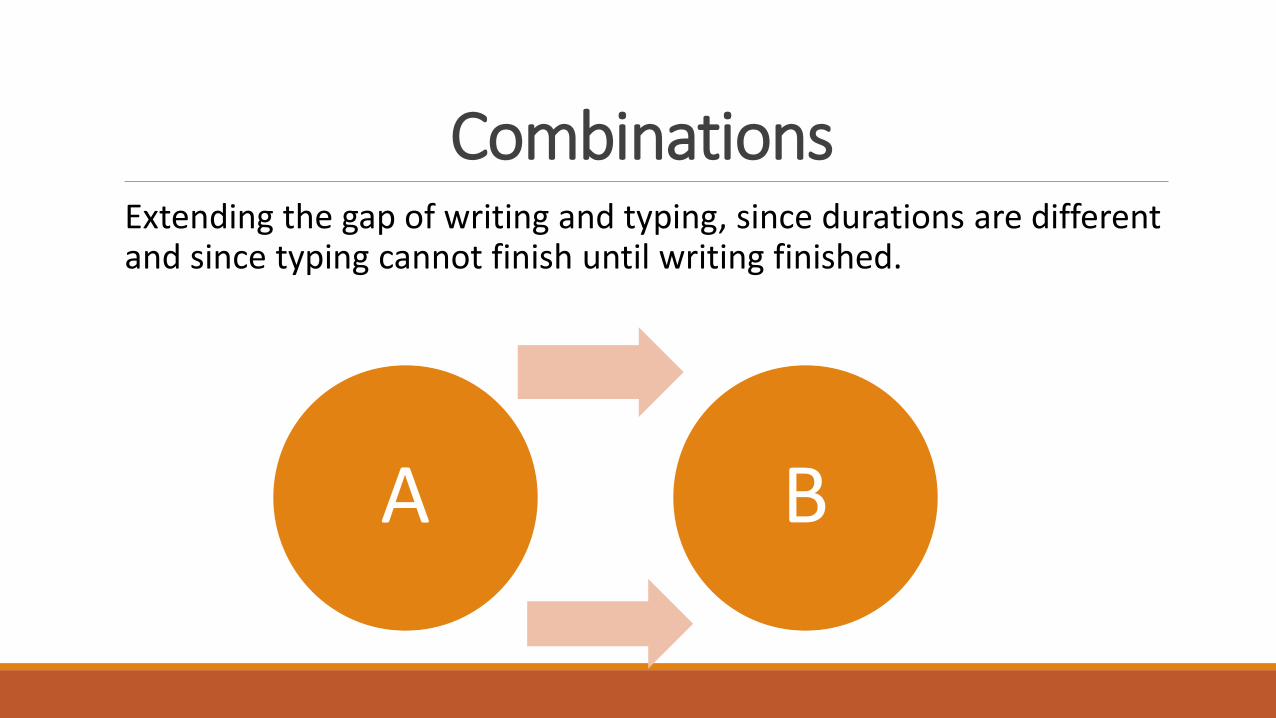
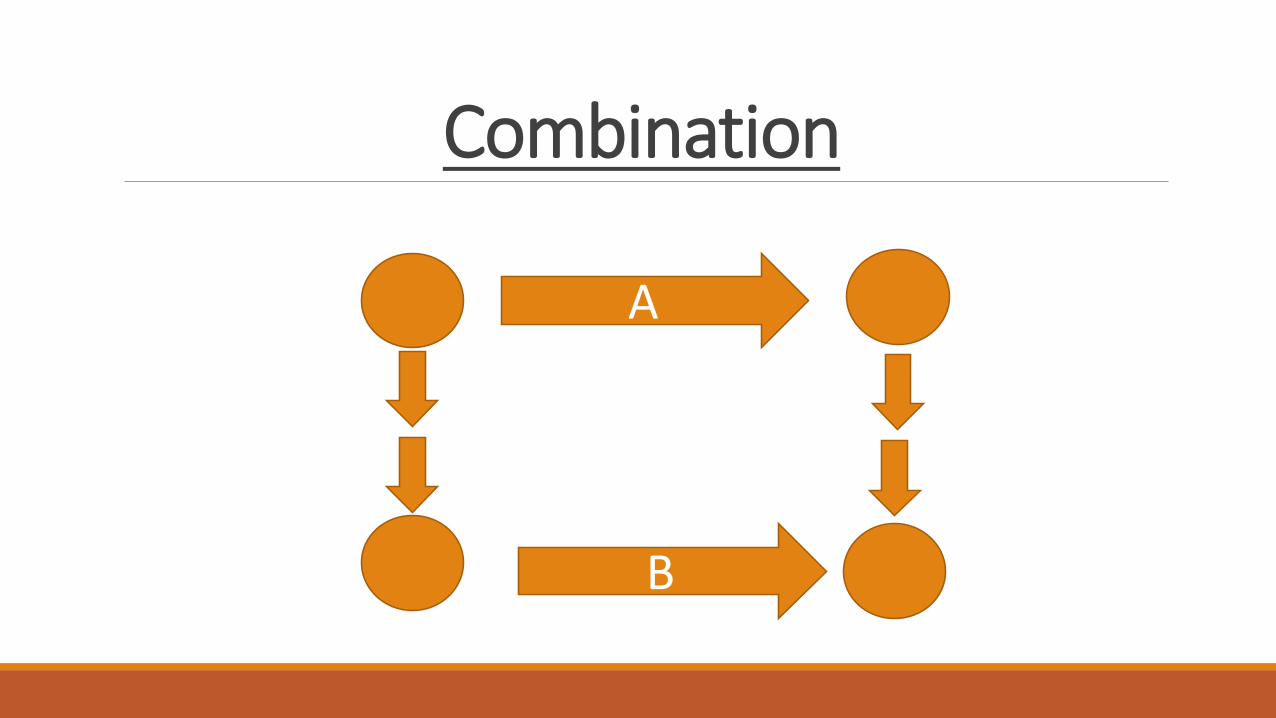
Combinations Extending the gap of writing and typing, since durations are different and since typing cannot finish until writing finished.
A B
ACTIVITY ON ARROW
The Arrow move from Label to Label, and you may use two labels to relate a more detailed description of an activity on Spreadsheet.
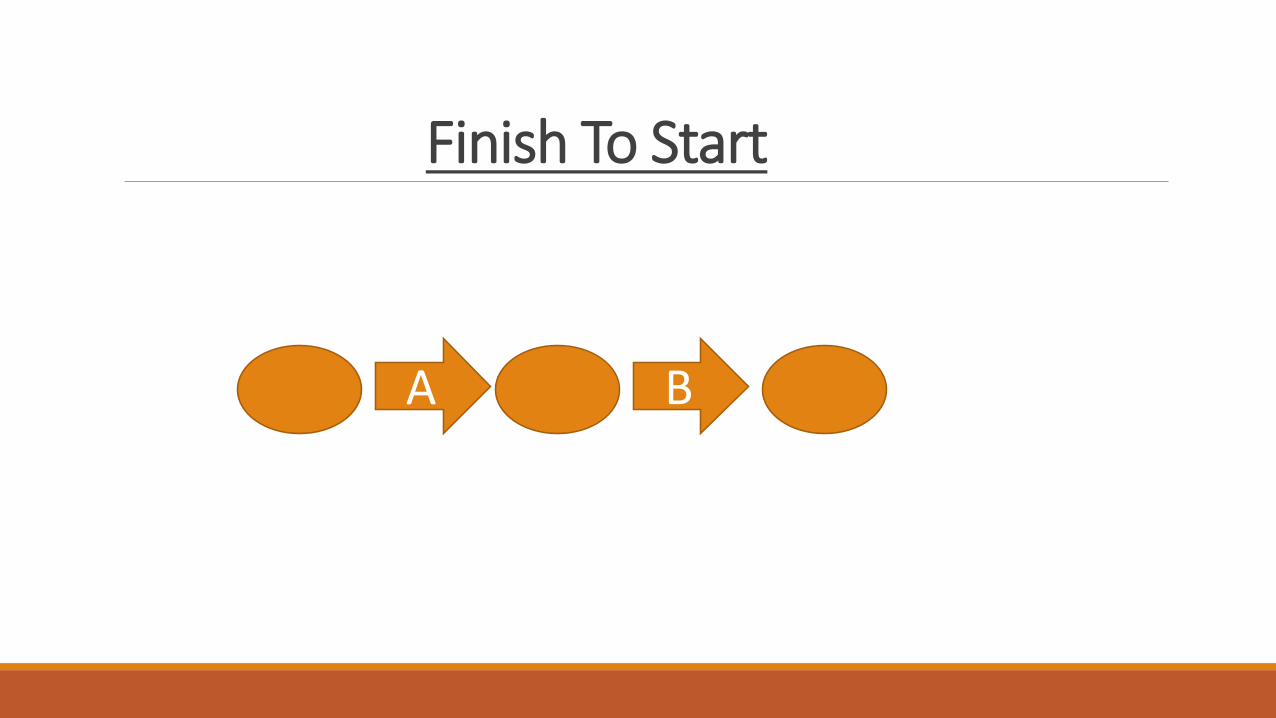
Finish To Start
A B
Start To Start
A
B
Finish To Finish
A
B
Combination
A
B
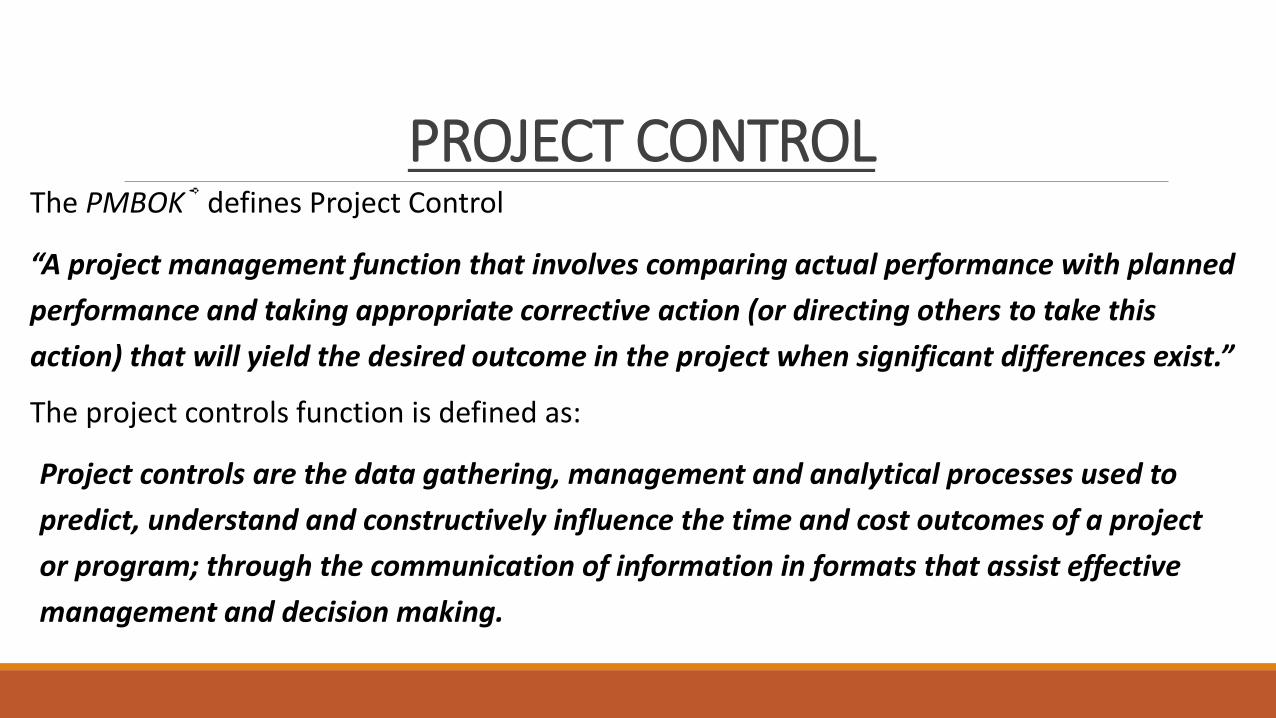
PROJECT CONTROLThe PMBOK® defines Project Control
“A project management function that involves comparing actual performance with planned
performance and taking appropriate corrective action (or directing others to take this
action) that will yield the desired outcome in the project when significant differences exist.”
The project controls function is defined as:
Project controls are the data gathering, management and analytical processes used to
predict, understand and constructively influence the time and cost outcomes of a project
or program; through the communication of information in formats that assist effective
management and decision making.
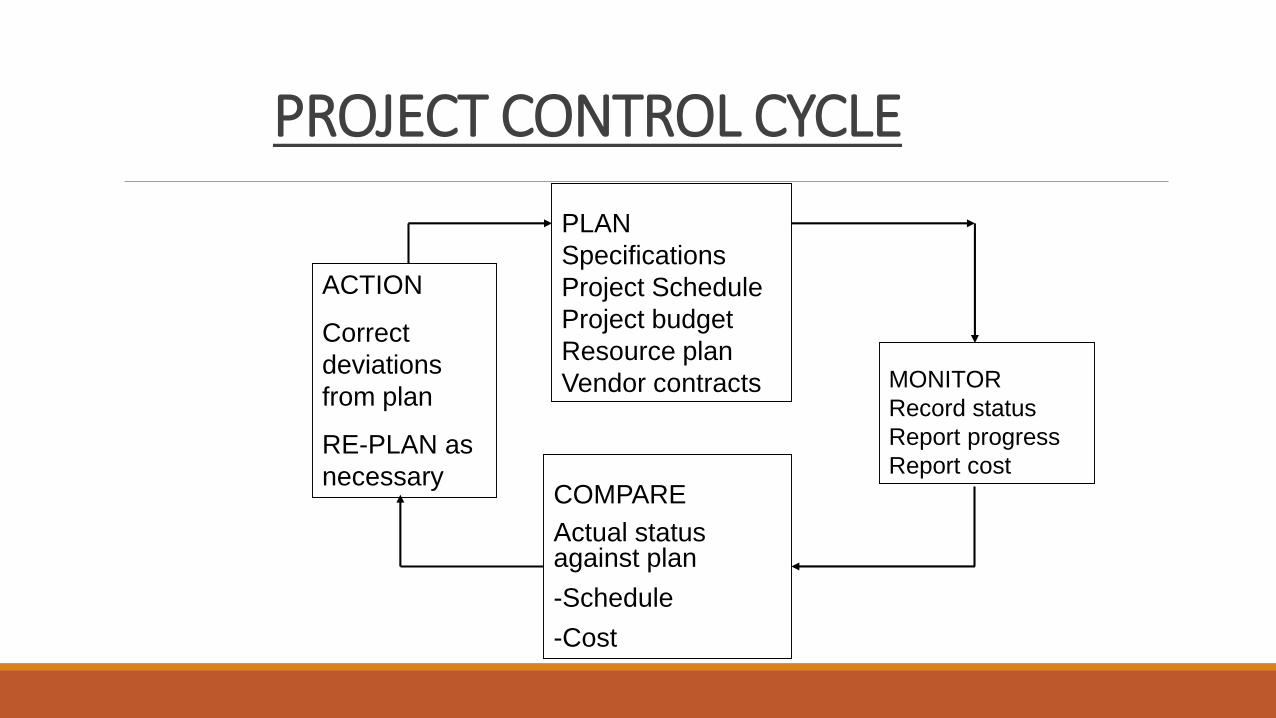
PROJECT CONTROL CYCLE
PLAN
Specifications
Project Schedule
Project budget
Resource plan
Vendor contracts MONITOR
Record status
Report progress
Report cost
COMPARE
Actual status against plan
-Schedule
-Cost
ACTION
Correct
deviations
from plan
RE-PLAN as
necessary
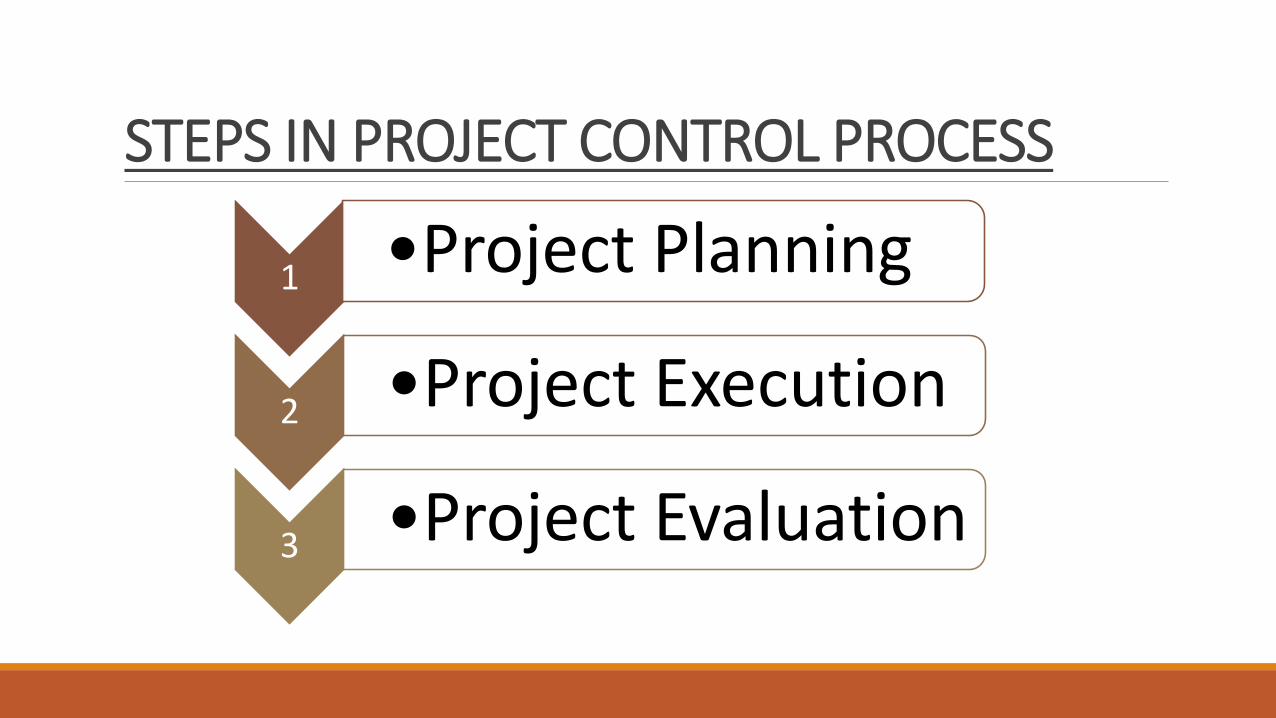
STEPS IN PROJECT CONTROL PROCESS
1 •Project Planning
2 •Project Execution
3 •Project Evaluation
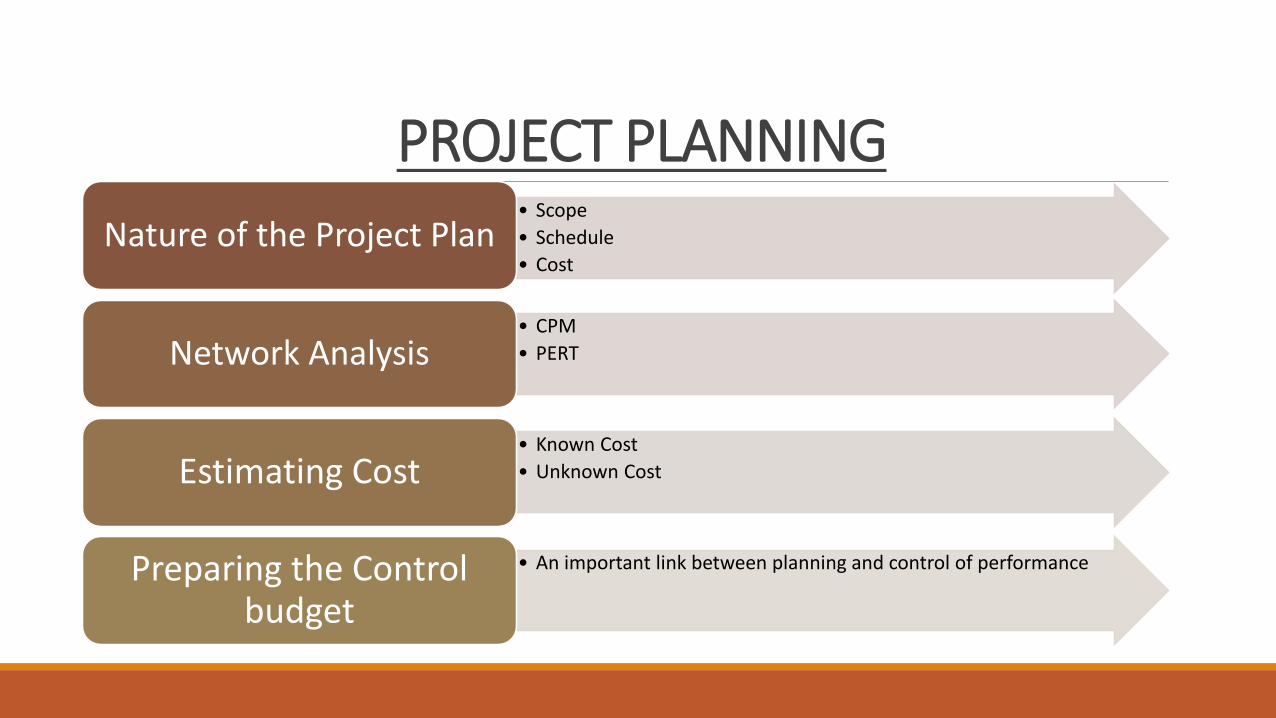
PROJECT PLANNING• Scope
• Schedule
• CostNature of the Project Plan
• CPM
• PERTNetwork Analysis
• Known Cost
• Unknown CostEstimating Cost
• An important link between planning and control of performancePreparing the Control budget
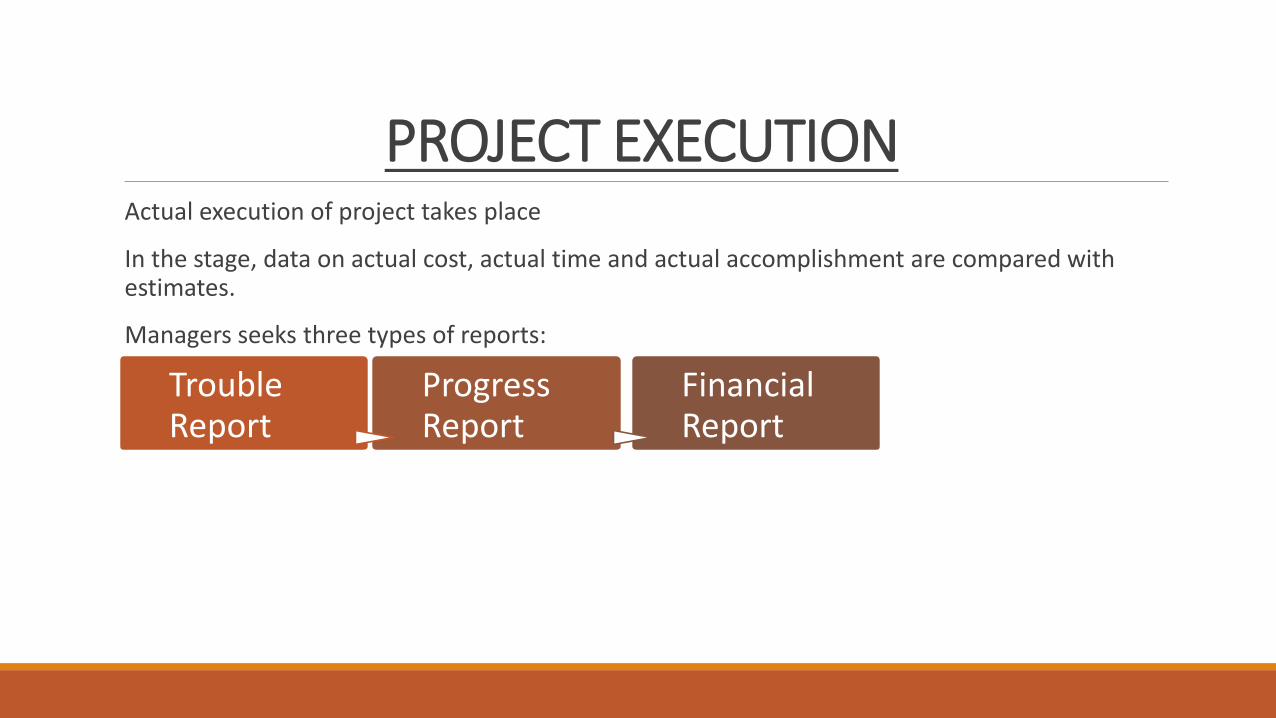
PROJECT EXECUTIONActual execution of project takes place
In the stage, data on actual cost, actual time and actual accomplishment are compared with estimates.
Managers seeks three types of reports:
Trouble Report
Progress Report
Financial Report
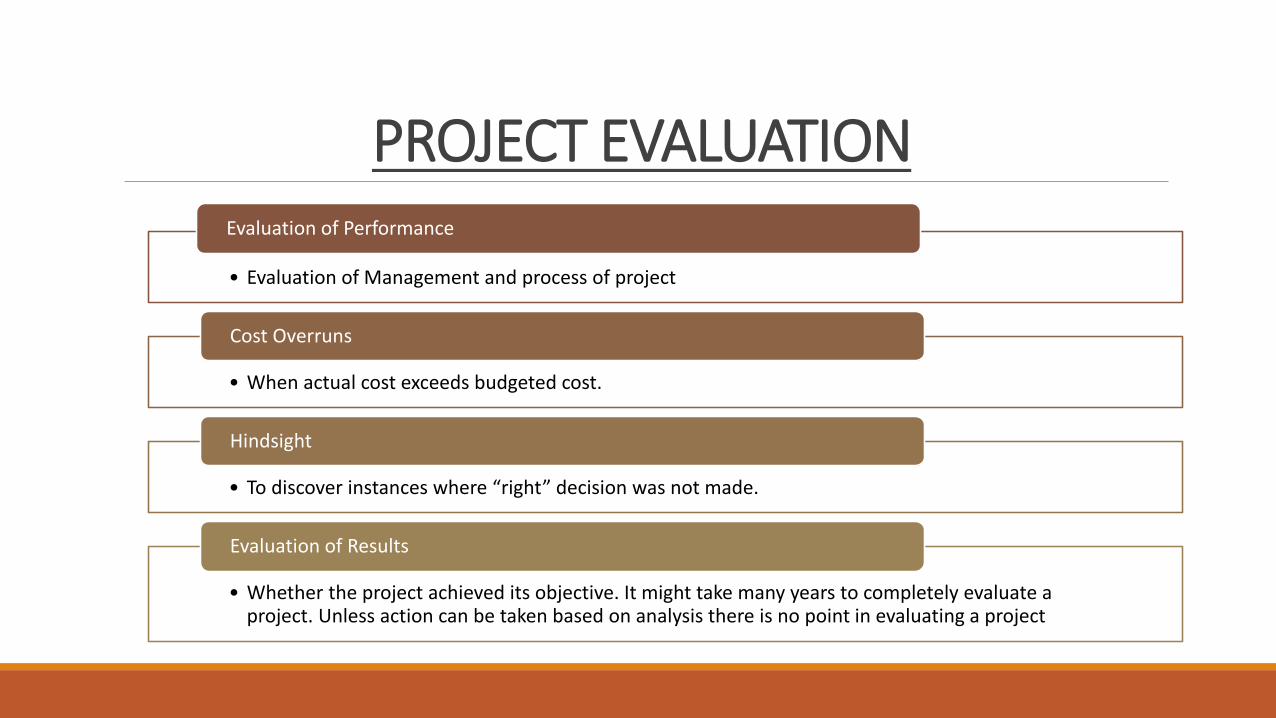
PROJECT EVALUATION
• Evaluation of Management and process of project
Evaluation of Performance
• When actual cost exceeds budgeted cost.
Cost Overruns
• To discover instances where “right” decision was not made.
Hindsight
• Whether the project achieved its objective. It might take many years to completely evaluate a project. Unless action can be taken based on analysis there is no point in evaluating a project
Evaluation of Results
RISK MANAGEMENTRisk is the chance or probability of something that may or may not occur; it is something which can be quantified or calculated (using standard deviation). Whereas, Uncertainty is something, which cannot be predicted with statistical confidence, normally due to insufficient information.
A project manager has to consider different tasks, activities, and work to be accomplished and consider risk associated with the actual outcome which would be differ from expected outcome.
Models such as PEST or SLEPT analysis and other derivatives help to analyze different types of risk e.g. social, legal, economic, political and technological risk.
Risk management processes can also help to identify those risks that are controllable and uncontrollable