Embed Size (px)
Citation preview
1
Panola County GCD
DFC Evaluations
May 19, 2016
By:
Wade Oliver, P.G.
To:
Texas Alliance of
Groundwater Districts
May 19, 2016
2
Issuing Permits
Summary
• The MAG is a consideration, not a permitting or
pumping cap
• The requirement is to manage on a long-term basis to
achieve the DFC
• MAG appears 6 times Ch. 36 Texas Water Code
• DFC appears 56 times in Ch. 36 Texas Water Code
The primary purpose of an alternative
approach to DFC development is to ensure
that the DFC is meaningful, achievable and
results in a realistic MAG.
3
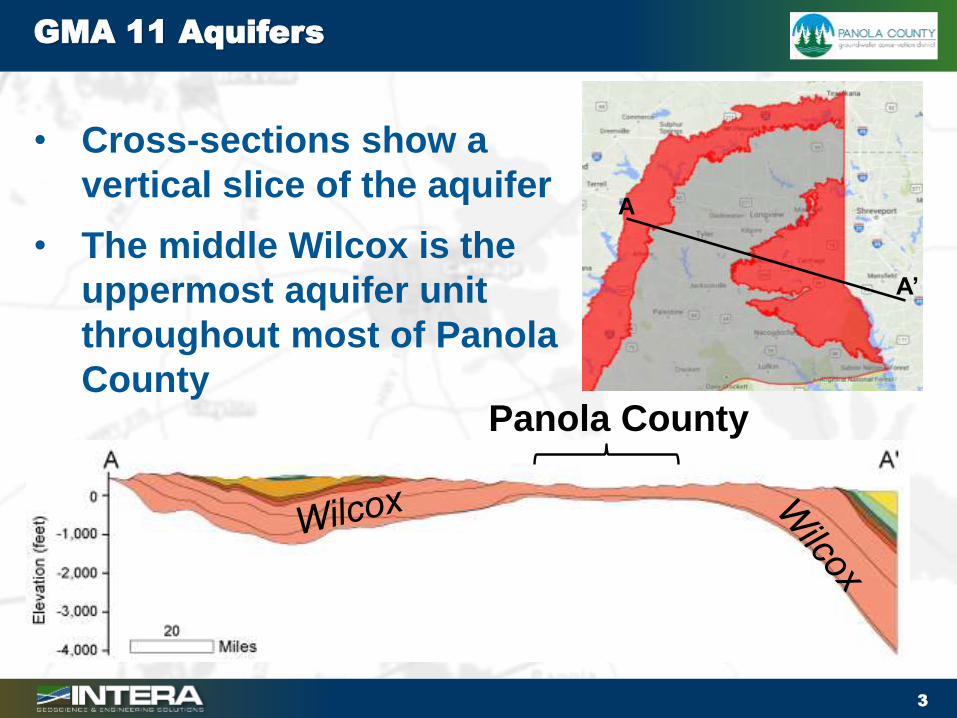
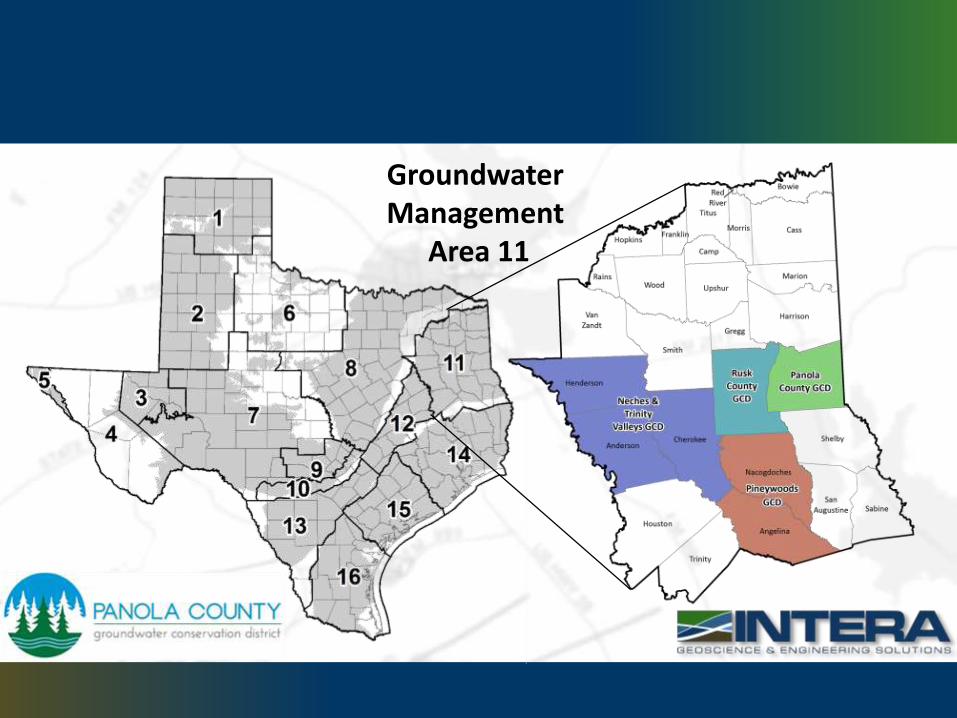
GMA 11 Aquifers
Panola County
A
A’
• Cross-sections show a
vertical slice of the aquifer
• The middle Wilcox is the
uppermost aquifer unit
throughout most of Panola
County
4
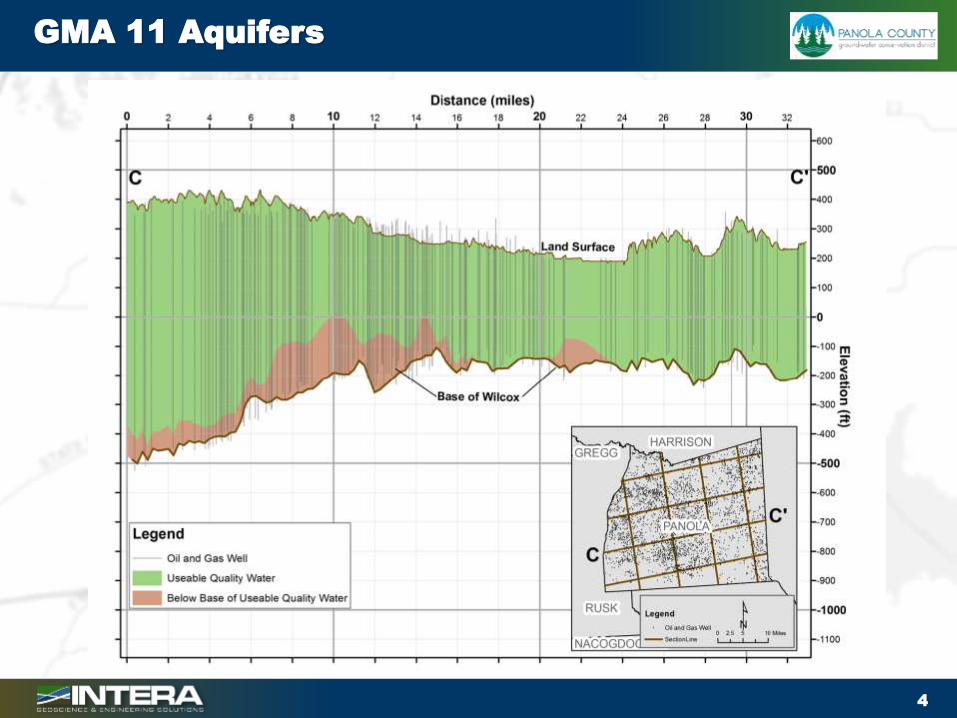
GMA 11 Aquifers
5
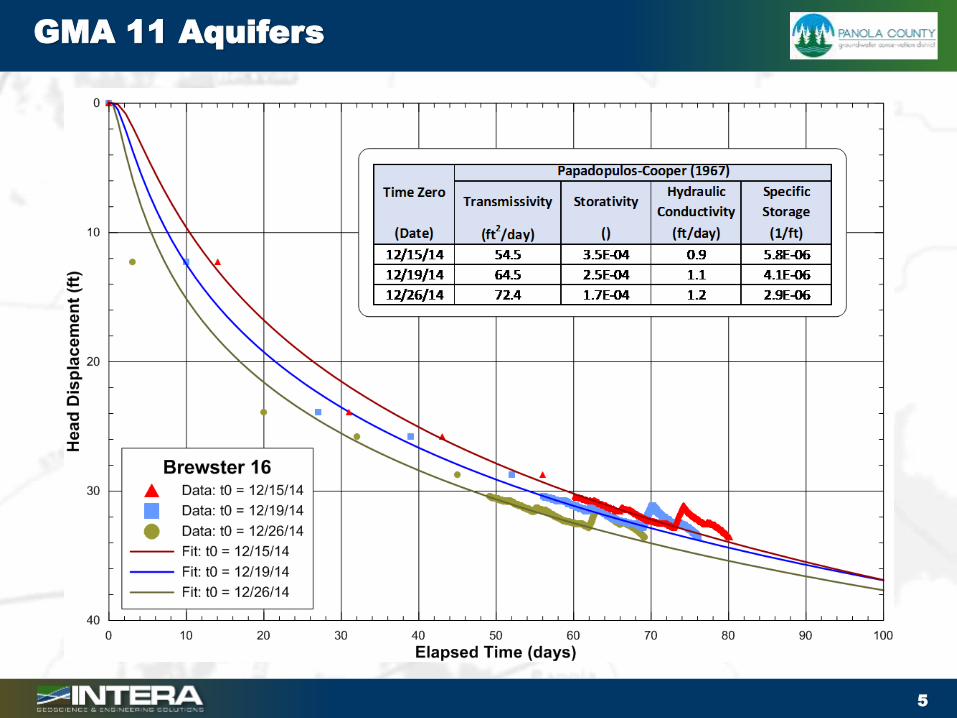
GMA 11 Aquifers
6
Analytical Well Impacts Tool
Purpose
• Enable the District to quickly evaluate the local-
scale lateral and vertical impacts on water
levels of new and existing wells
Highlights
• Based on an analytic element model (TTIM) that
solves for water level in the well bore
• High vertical resolution: 20-ft thick aquifer layers
• Automatic layering – don’t need to specify layer,
just surface elevation and screened interval
• Accepts one or more pumping wells for analysis
• Evaluated impacts of existing wells
7
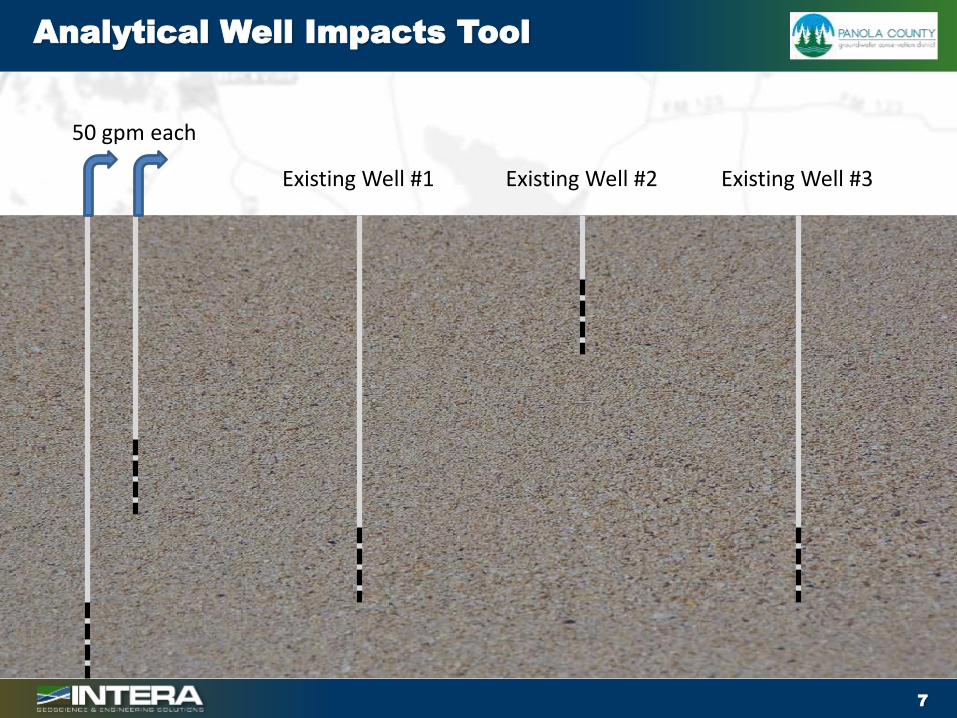
Analytical Well Impacts Tool
Existing Well #1 Existing Well #2 Existing Well #3
50 gpm each
8
Analytical Well Impacts Tool
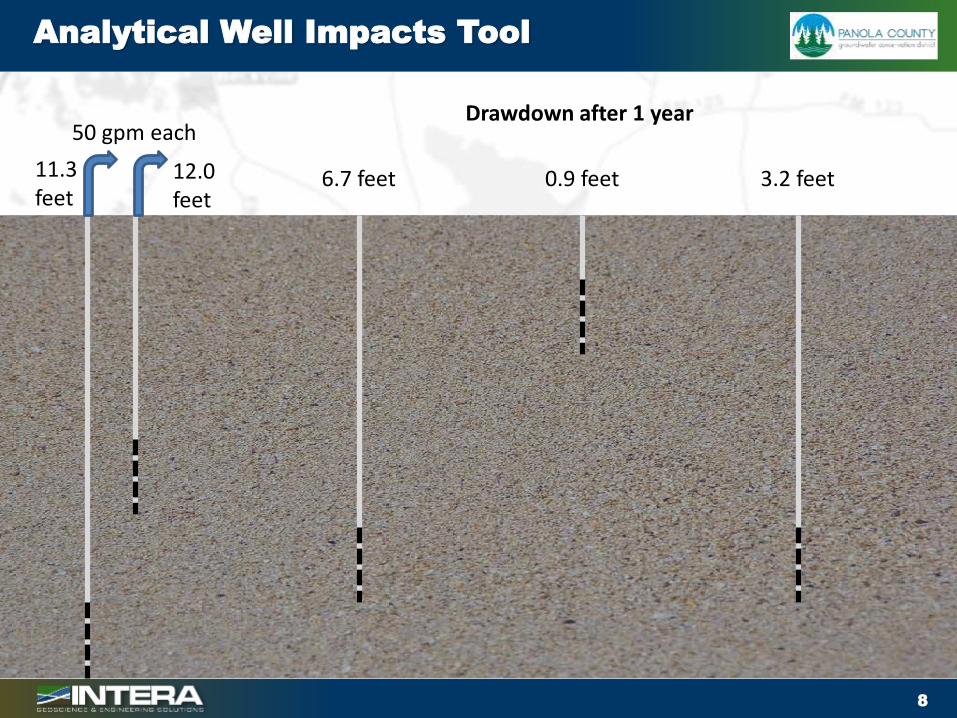
50 gpm each
6.7 feet 0.9 feet 3.2 feet
Drawdown after 1 year
11.3feet
12.0feet
9
Evaluating Impacts of Existing Wells
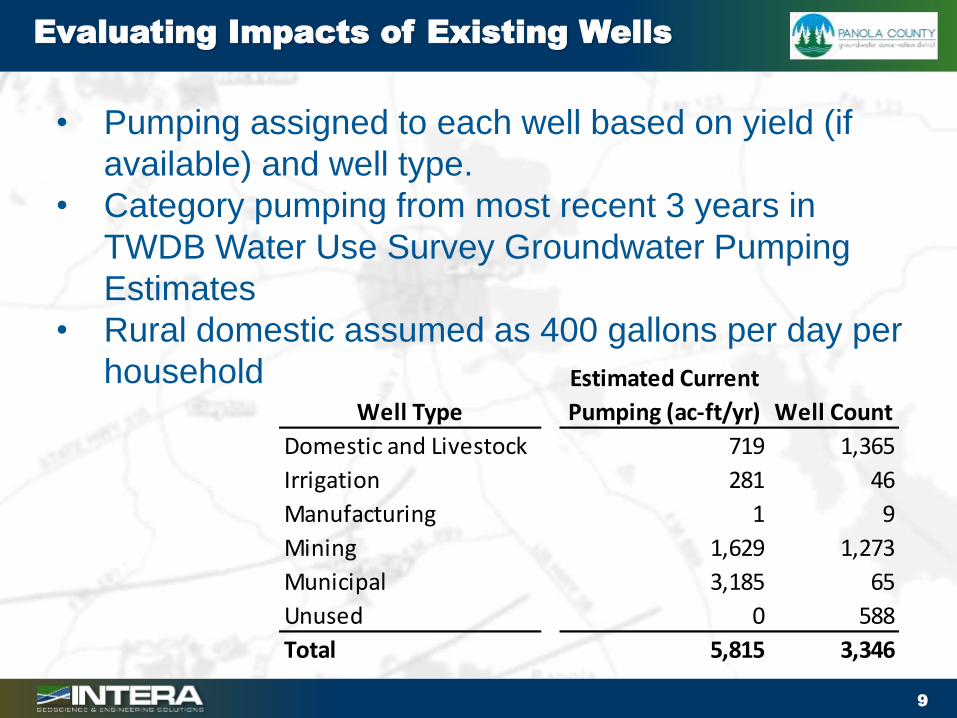
• Pumping assigned to each well based on yield (if
available) and well type.
• Category pumping from most recent 3 years in
TWDB Water Use Survey Groundwater Pumping
Estimates
• Rural domestic assumed as 400 gallons per day per
householdWell Type
Estimated Current
Pumping (ac-ft/yr) Well Count
Domestic and Livestock 719 1,365
Irrigation 281 46
Manufacturing 1 9
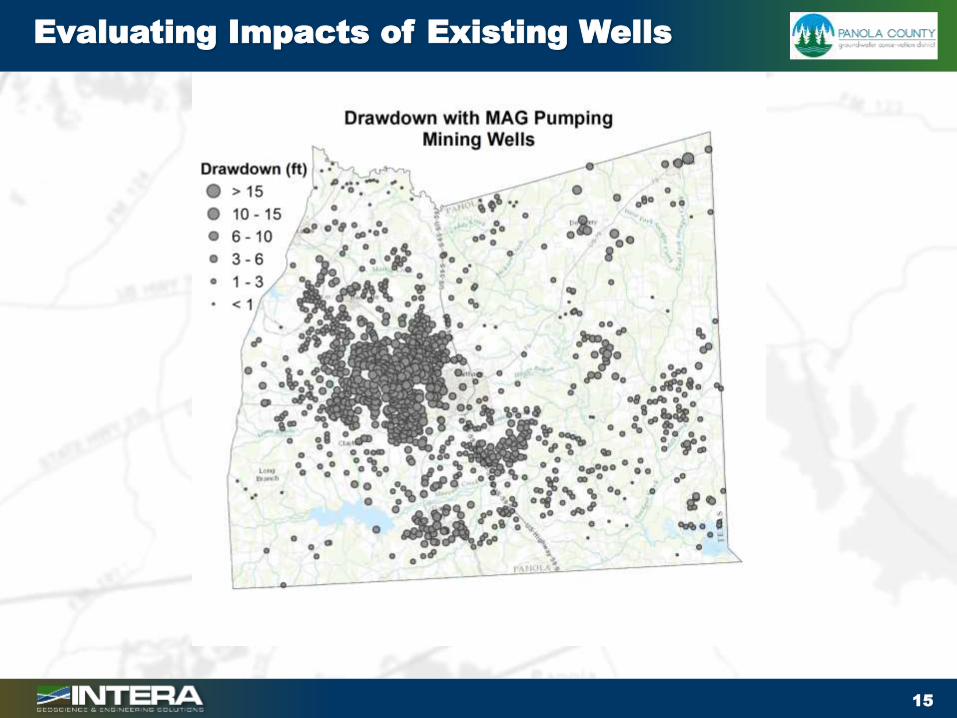
Mining 1,629 1,273
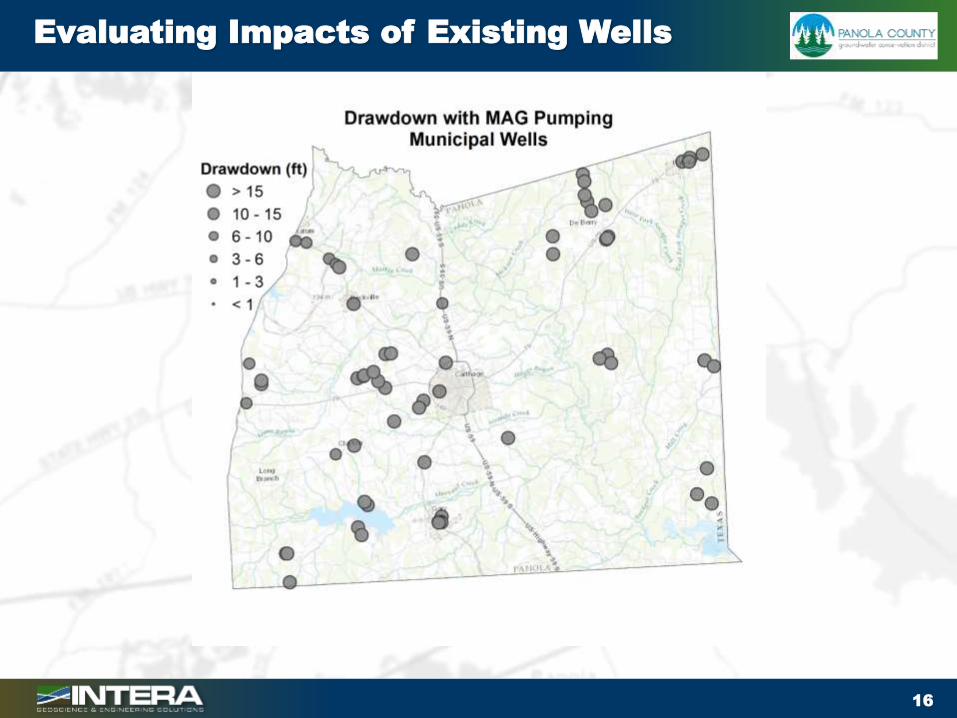
Municipal 3,185 65
Unused 0 588
Total 5,815 3,346
10
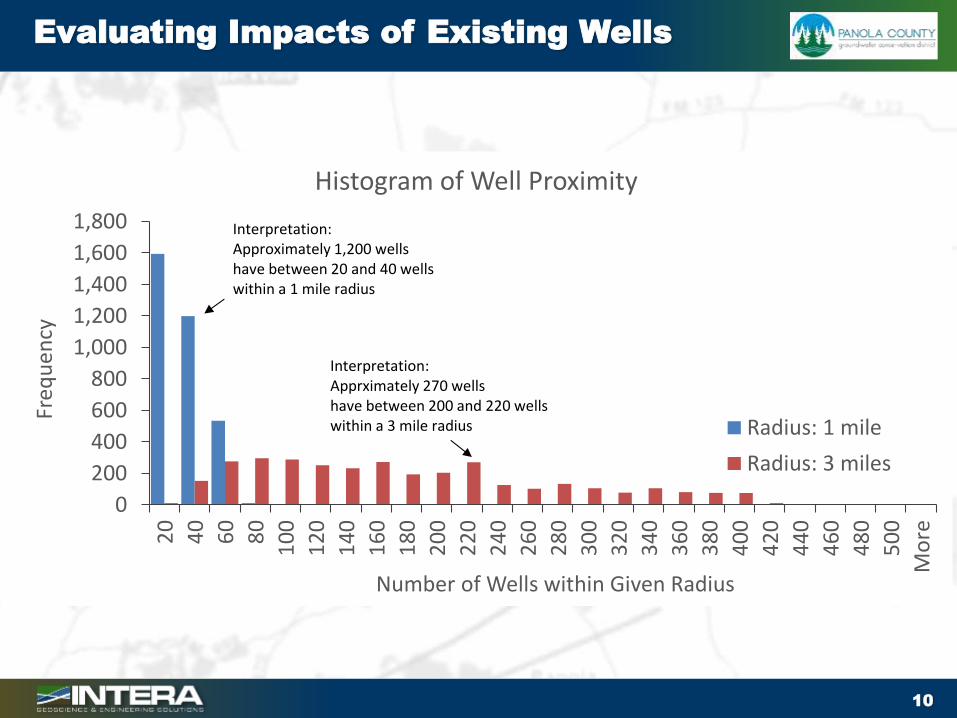
Evaluating Impacts of Existing Wells
0
200
400
600
800
1,000
1,200
1,400
1,600
1,800
20
40
60
80
10
0
12
0
14
0
16
0
18
0
20
0
22
0
24
0
26
0
28
0
30
0
32
0
34
0
36
0
38
0
40
0
42
0
44
0
46
0
48
0
50
0
Mo
re
Freq
uen
cy
Number of Wells within Given Radius
Histogram of Well Proximity
Radius: 1 mile
Radius: 3 miles
Interpretation:Approximately 1,200 wells have between 20 and 40 wells within a 1 mile radius
Interpretation:Apprximately 270 wells have between 200 and 220 wells within a 3 mile radius
11
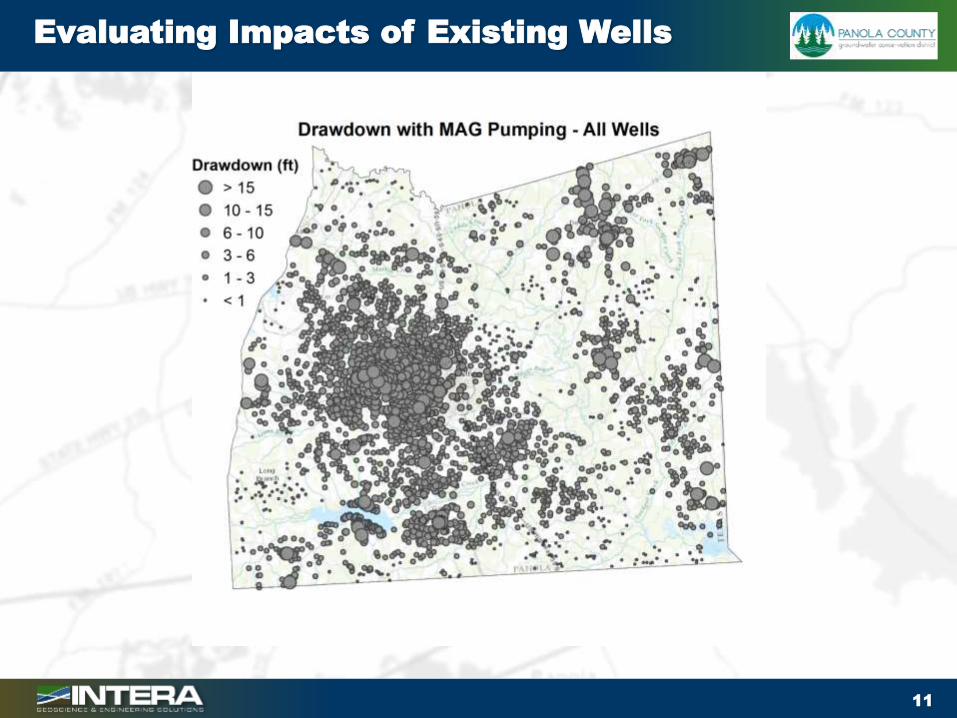
Evaluating Impacts of Existing Wells
12
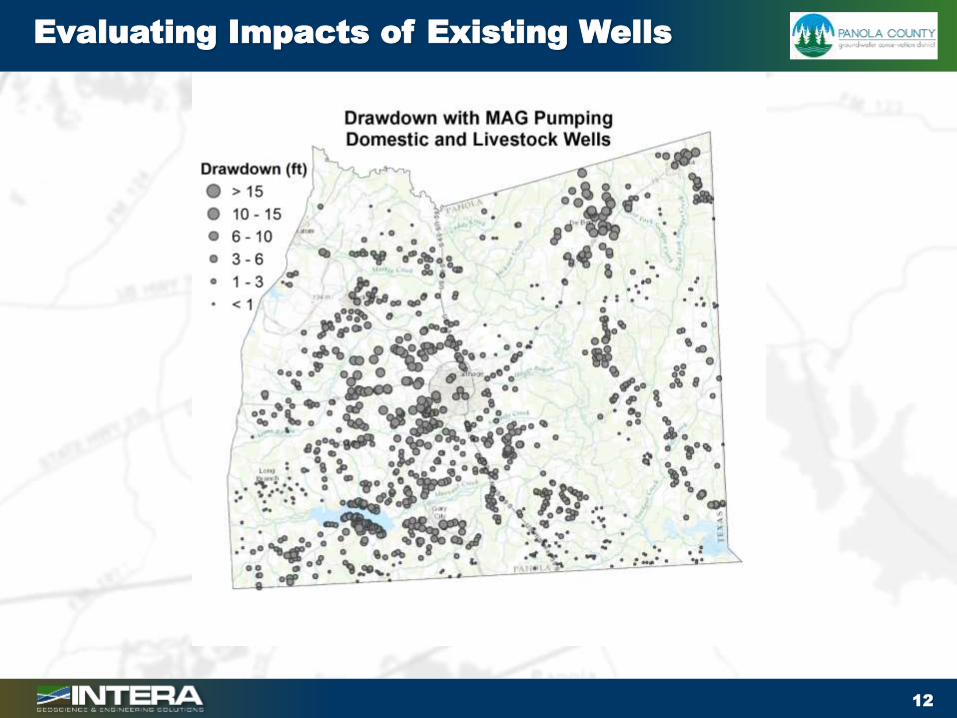
Evaluating Impacts of Existing Wells

13
Evaluating Impacts of Existing Wells
14
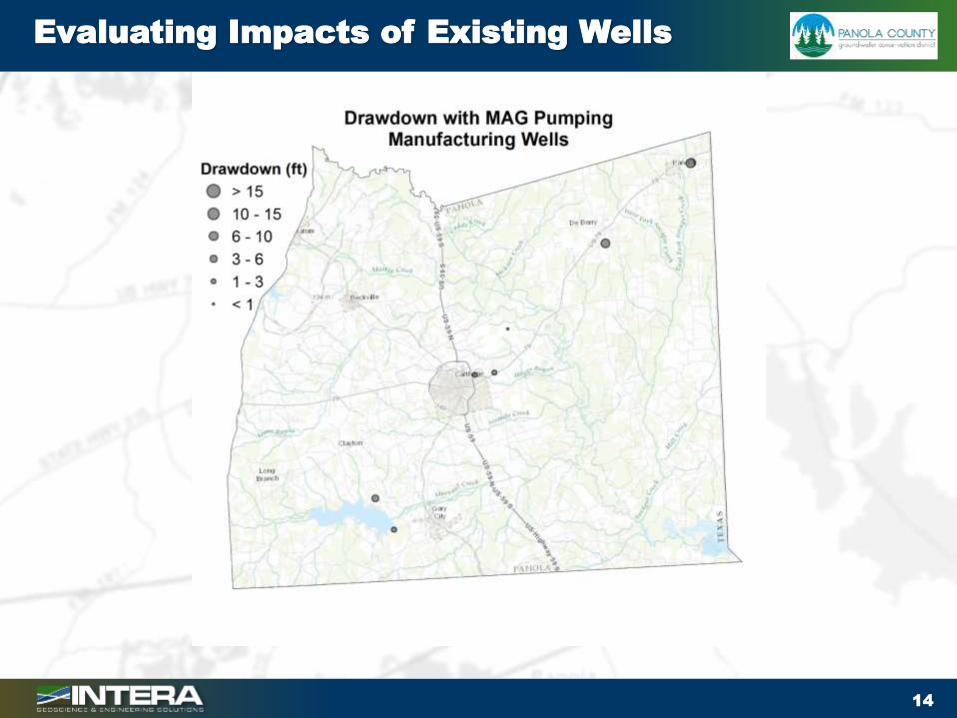
Evaluating Impacts of Existing Wells
15
Evaluating Impacts of Existing Wells
16
Evaluating Impacts of Existing Wells
17
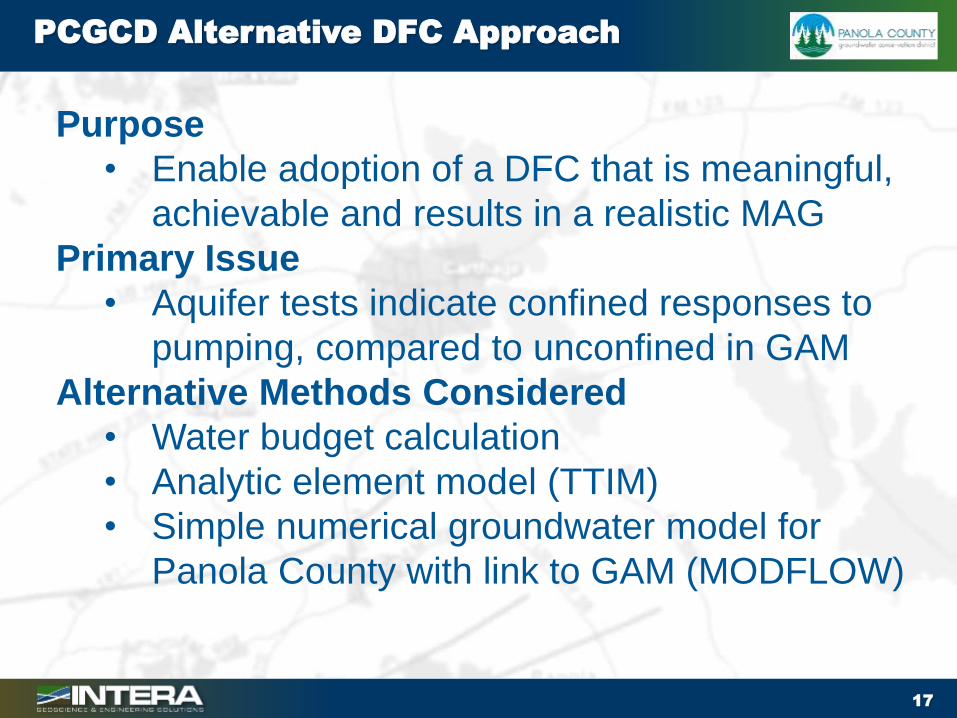
PCGCD Alternative DFC Approach
Purpose
• Enable adoption of a DFC that is meaningful,
achievable and results in a realistic MAG
Primary Issue
• Aquifer tests indicate confined responses to
pumping, compared to unconfined in GAM
Alternative Methods Considered
• Water budget calculation
• Analytic element model (TTIM)
• Simple numerical groundwater model for
Panola County with link to GAM (MODFLOW)
18
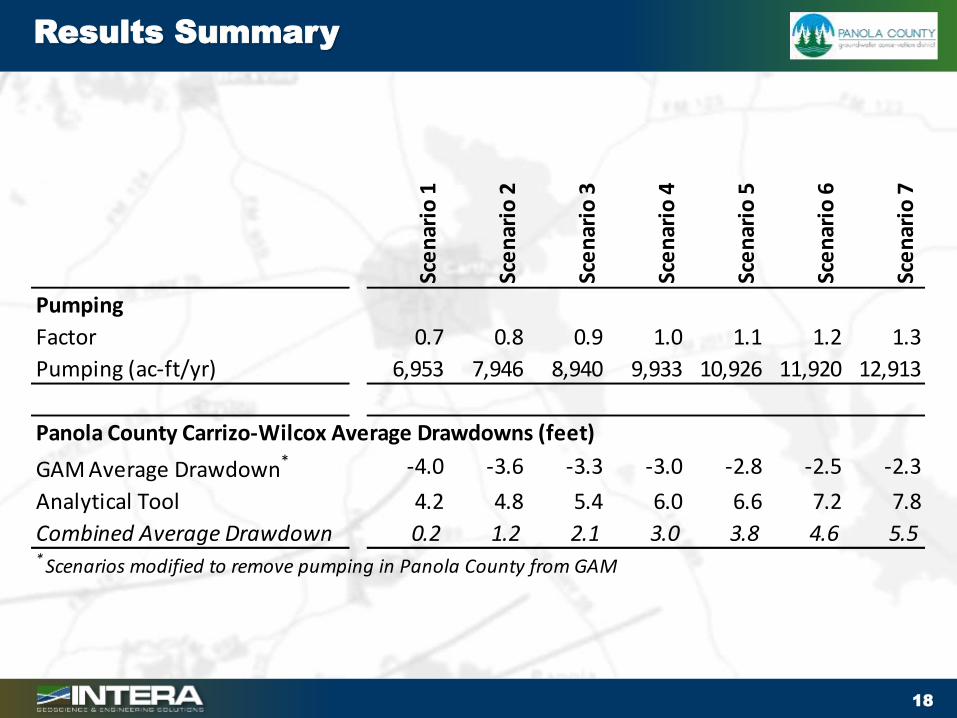
Results Summary
Sce
nar
io 1
Sce
nar
io 2
Sce
nar
io 3
Sce
nar
io 4
Sce
nar
io 5
Sce
nar
io 6
Sce
nar
io 7
Pumping
Factor 0.7 0.8 0.9 1.0 1.1 1.2 1.3
Pumping (ac-ft/yr) 6,953 7,946 8,940 9,933 10,926 11,920 12,913
Panola County Carrizo-Wilcox Average Drawdowns (feet)
GAM Average Drawdown* -4.0 -3.6 -3.3 -3.0 -2.8 -2.5 -2.3
Analytical Tool 4.2 4.8 5.4 6.0 6.6 7.2 7.8
Combined Average Drawdown 0.2 1.2 2.1 3.0 3.8 4.6 5.5* Scenarios modified to remove pumping in Panola County from GAM
19
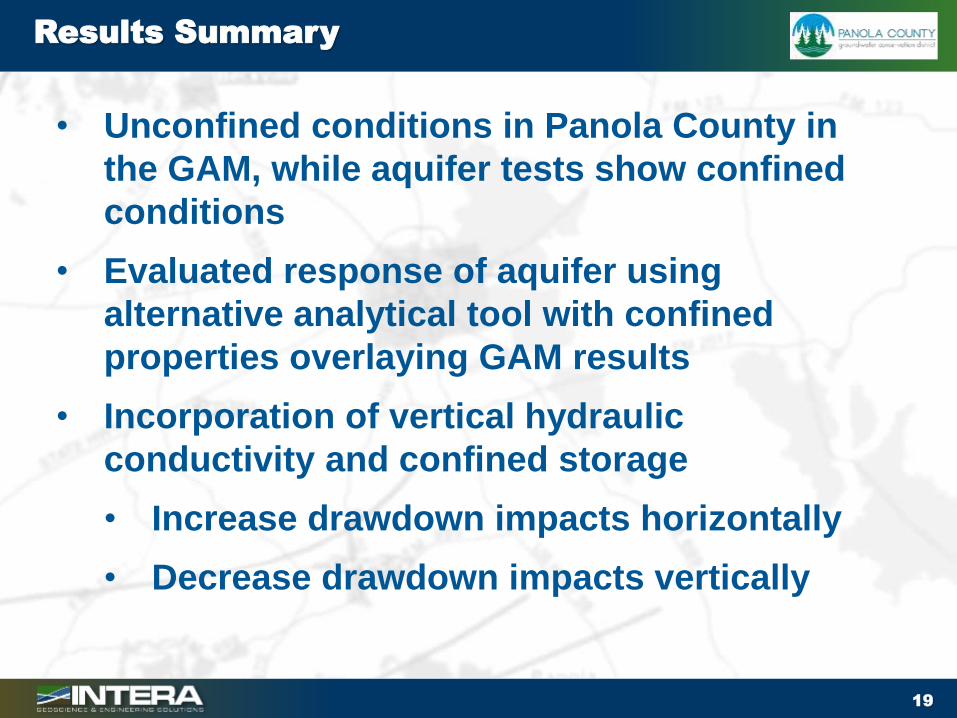
Results Summary
• Unconfined conditions in Panola County in
the GAM, while aquifer tests show confined
conditions
• Evaluated response of aquifer using
alternative analytical tool with confined
properties overlaying GAM results
• Incorporation of vertical hydraulic
conductivity and confined storage
• Increase drawdown impacts horizontally
• Decrease drawdown impacts vertically
20
Groundwater Management
Area 11