Embed Size (px)
Citation preview
Richard W. Todd and N. Andy Cole
USDA-ARS
Conservation and Production Research
Laboratory
Bushland, Texas
G. Robert Hagevoort
New Mexico State University
Clovis, New Mexico
Kenneth D. Casey and Brent W. Auvermann
Texas AgriLife Research and Extension
Amarillo, Texas
Open Lot Dairy Ammonia Losses and
Nitrogen Balance: A New Mexico Study
Partially funded by USDA-CSREES
Special Research Grants AG09-
4288 and 2010-02674.
Regulatory Pressures
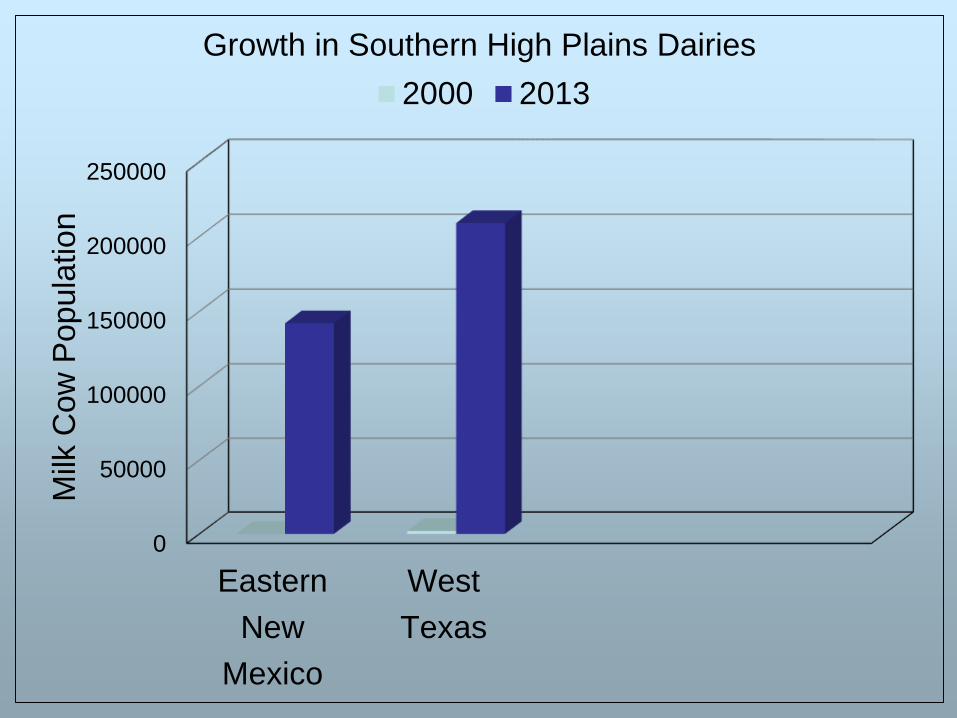
0
50000
100000
150000
200000
250000
Eastern
New
Mexico
West
Texas
Milk
Co
w P
op
ula
tio
nGrowth in Southern High Plains Dairies
2000 2013
Objectives
• Quantify NH3 emissions from open lot and lagoons
• Build dairy nitrogen balance – stores and flows
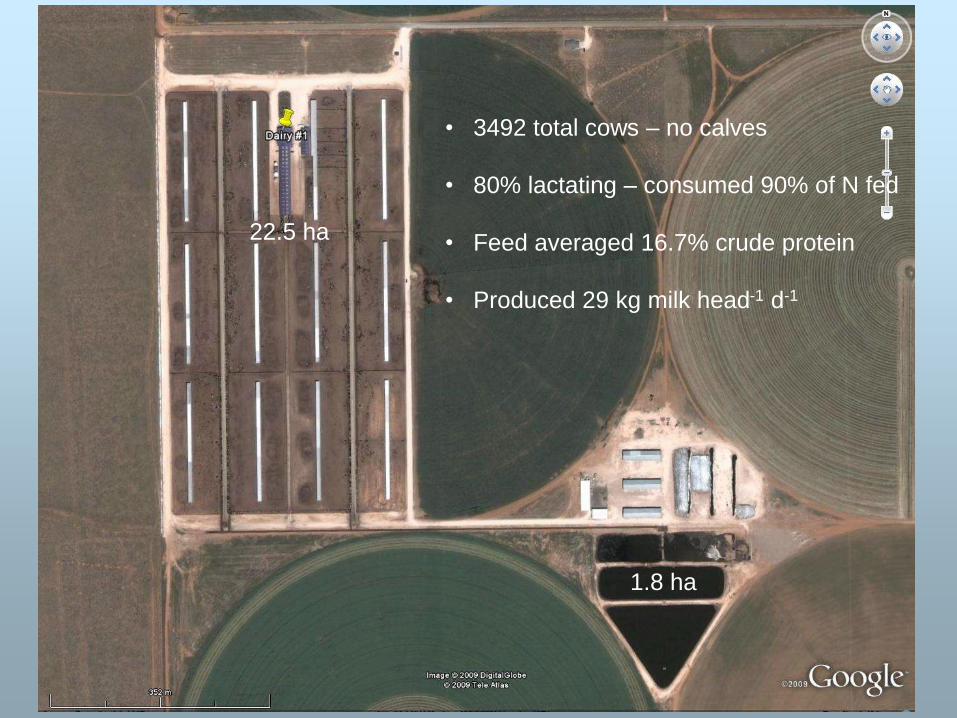
• 3492 total cows – no calves
• 80% lactating – consumed 90% of N fed
• Feed averaged 16.7% crude protein
• Produced 29 kg milk head-1 d-1
22.5 ha
1.8 ha
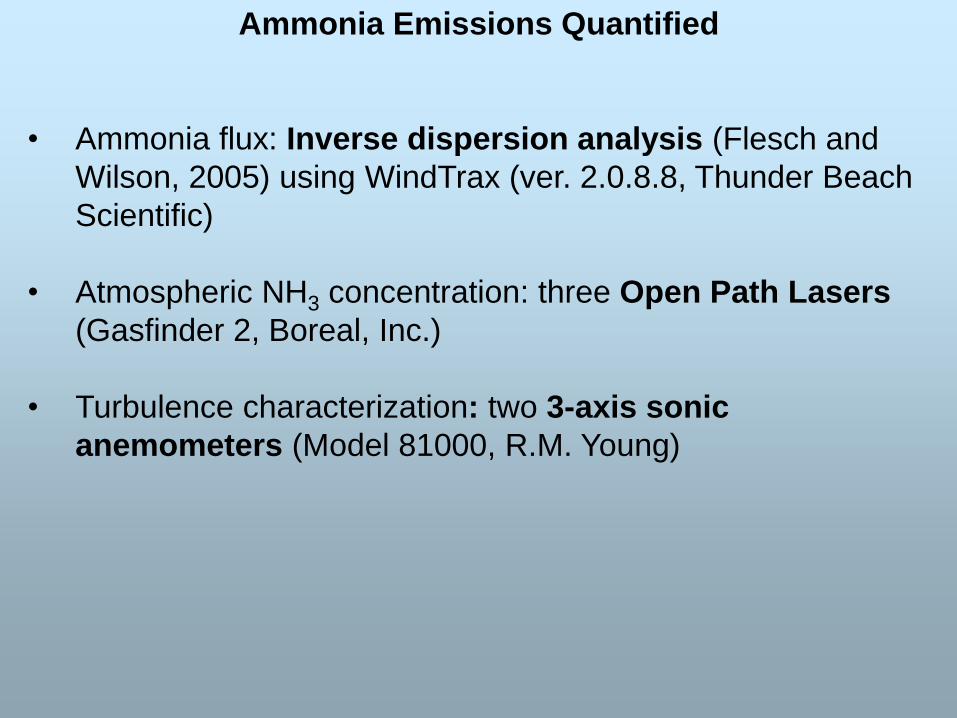
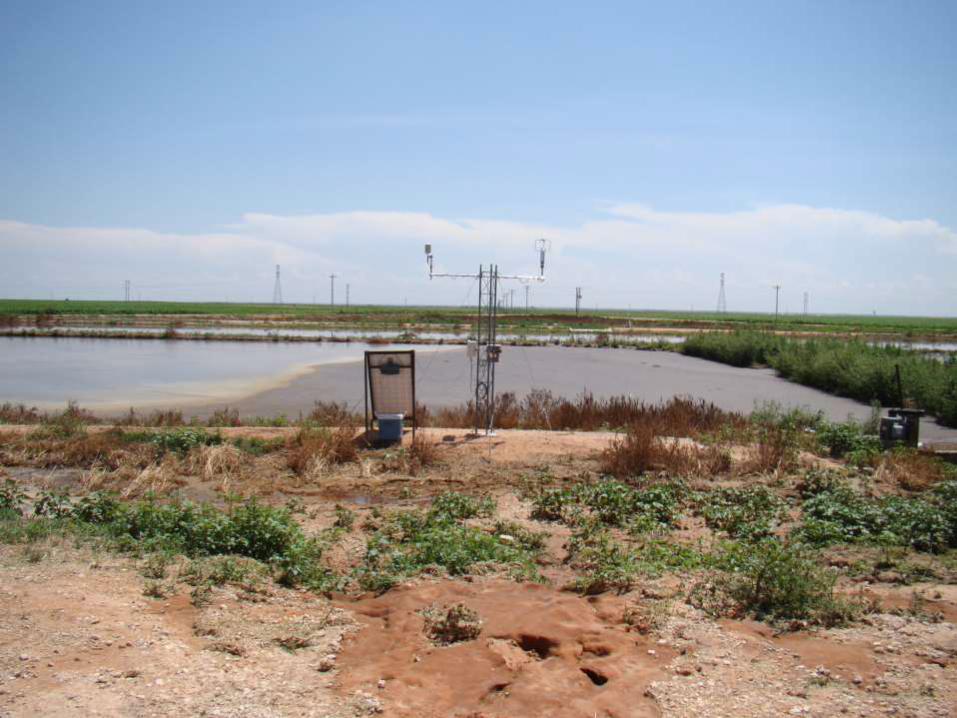
Ammonia Emissions Quantified
• Ammonia flux: Inverse dispersion analysis (Flesch and
Wilson, 2005) using WindTrax (ver. 2.0.8.8, Thunder Beach
Scientific)
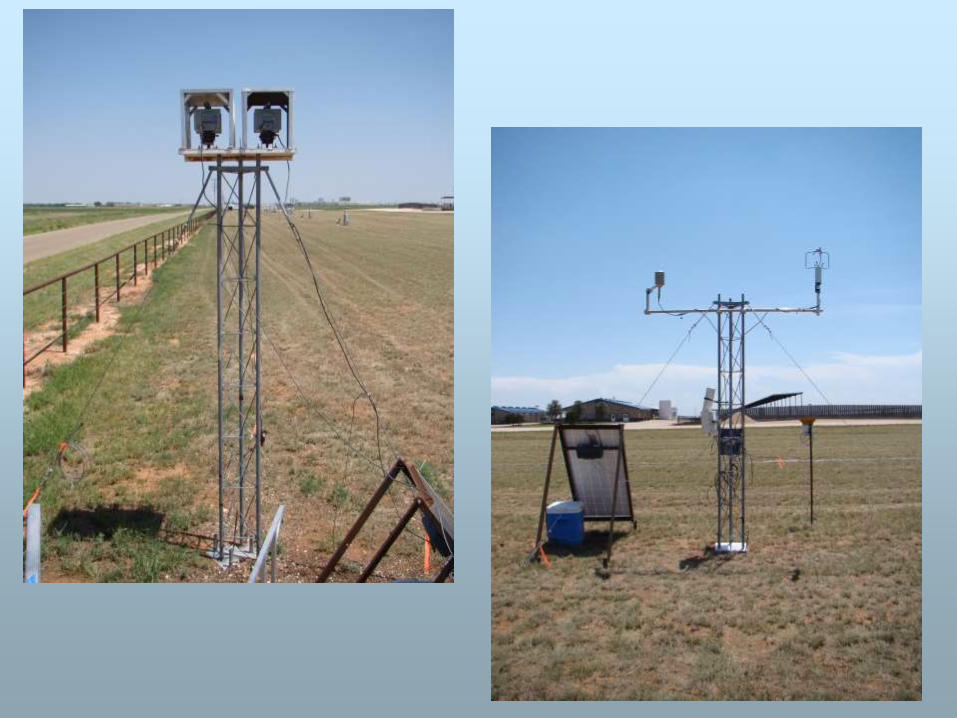
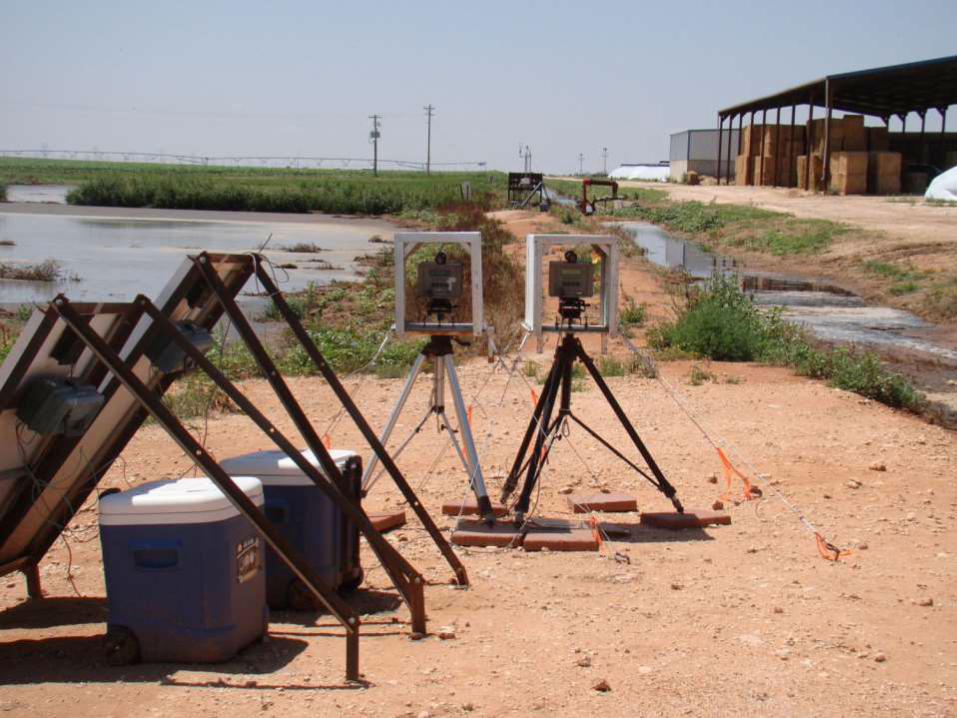
• Atmospheric NH3 concentration: three Open Path Lasers
(Gasfinder 2, Boreal, Inc.)
• Turbulence characterization: two 3-axis sonic
anemometers (Model 81000, R.M. Young)
Nitrogen Partitioning
• N intake and milk N by cow class (dairy management
provided) and NH3-N loss (measured)
• Cow N retention, milk N and N excretion calculated as
functions of DMI (Castillo et al., 2000)
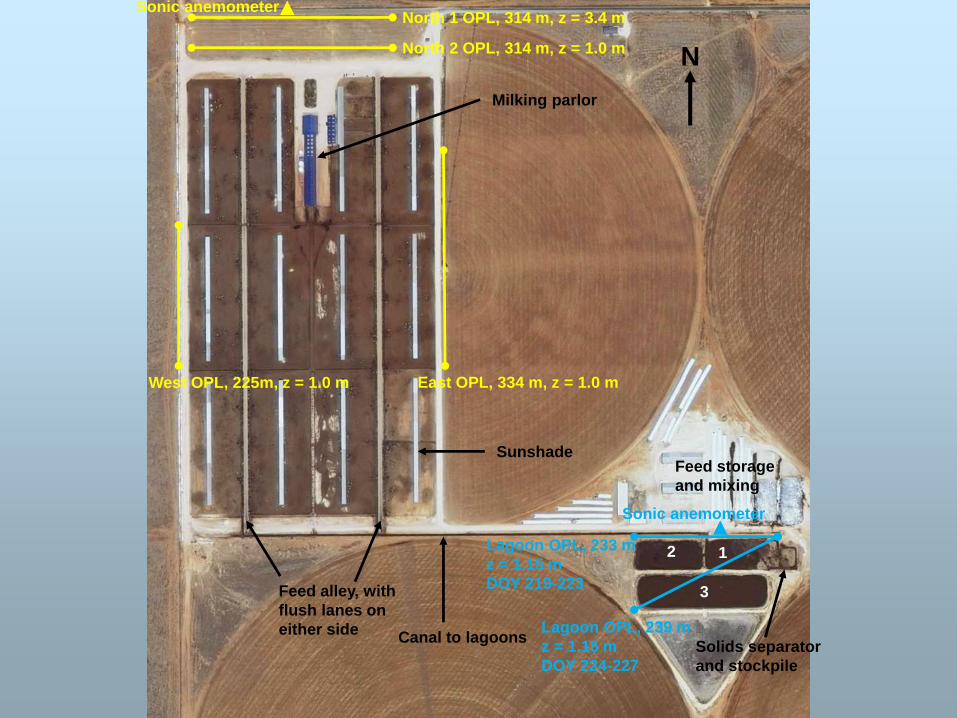
Sonic anemometer
Lagoon OPL, 233 m
z = 1.15 m
DOY 219-223
East OPL, 334 m, z = 1.0 mWest OPL, 225m, z = 1.0 m
North 2 OPL, 314 m, z = 1.0 m
North 1 OPL, 314 m, z = 3.4 m
Sonic anemometer
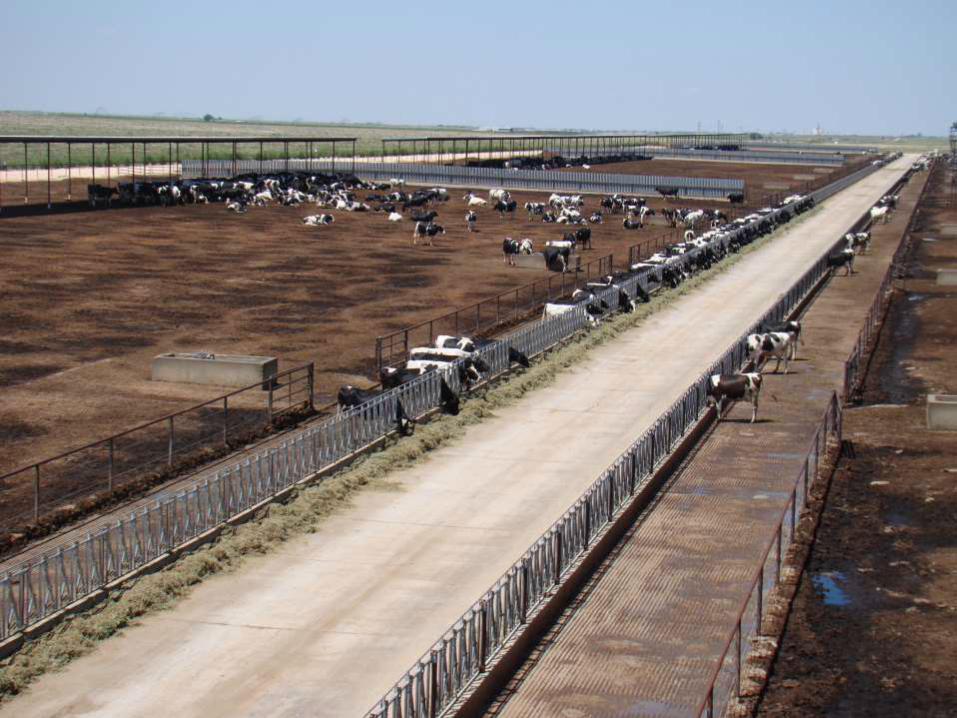
Sunshade
Milking parlor
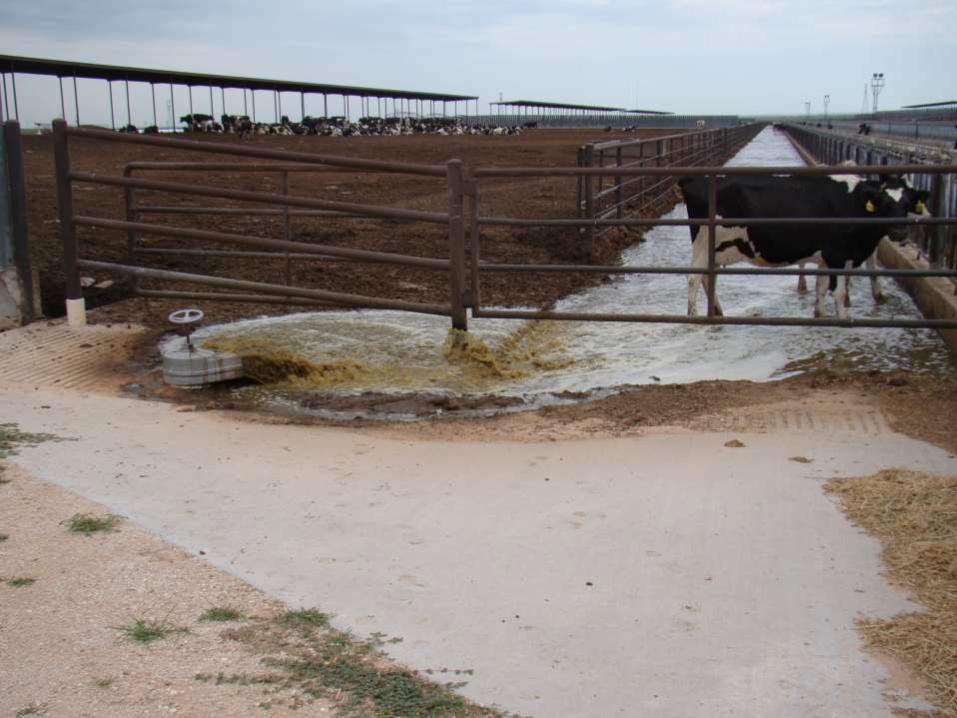
Feed alley, with
flush lanes on
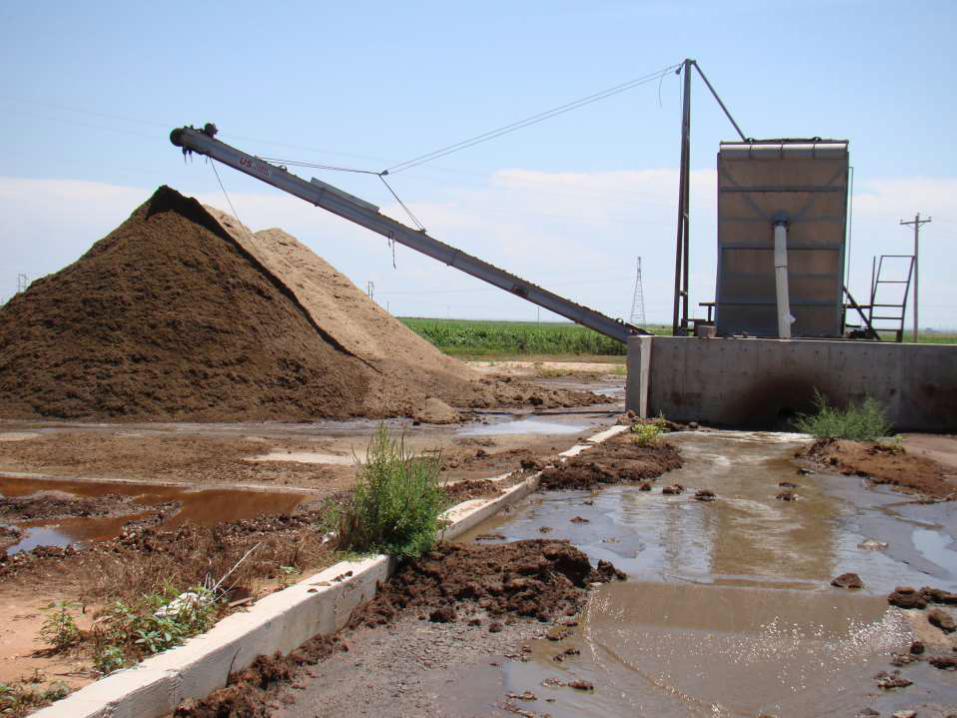
either sideSolids separator
and stockpile
Feed storage
and mixing
N
Canal to lagoonsLagoon OPL, 239 m
z = 1.15 m
DOY 224-227
12
3
• 3500 total cows
• 80% of total milked
• Produced 29 kg milk head-1 d-1
• Fed 16.6% - 17.4% crude protein

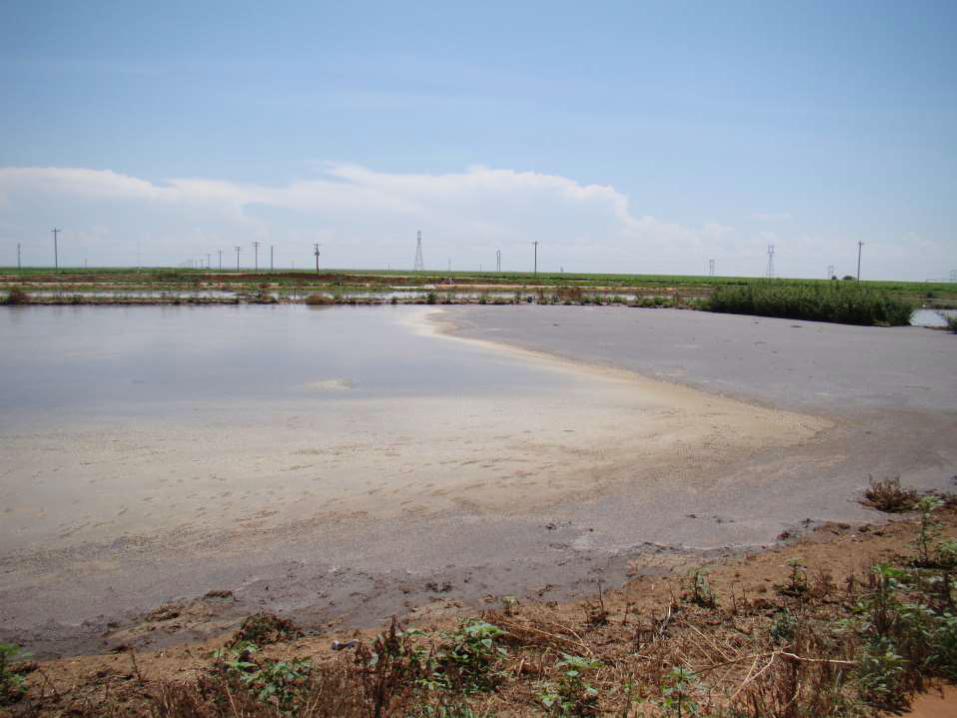
Laser path, DOY 219-223, 233 m
Laser path, DOY 224-227, 239 m
Met tower
No
water
3
2 1
• Methane concentration
• Wind and turbulence variables
• Inverse dispersion model
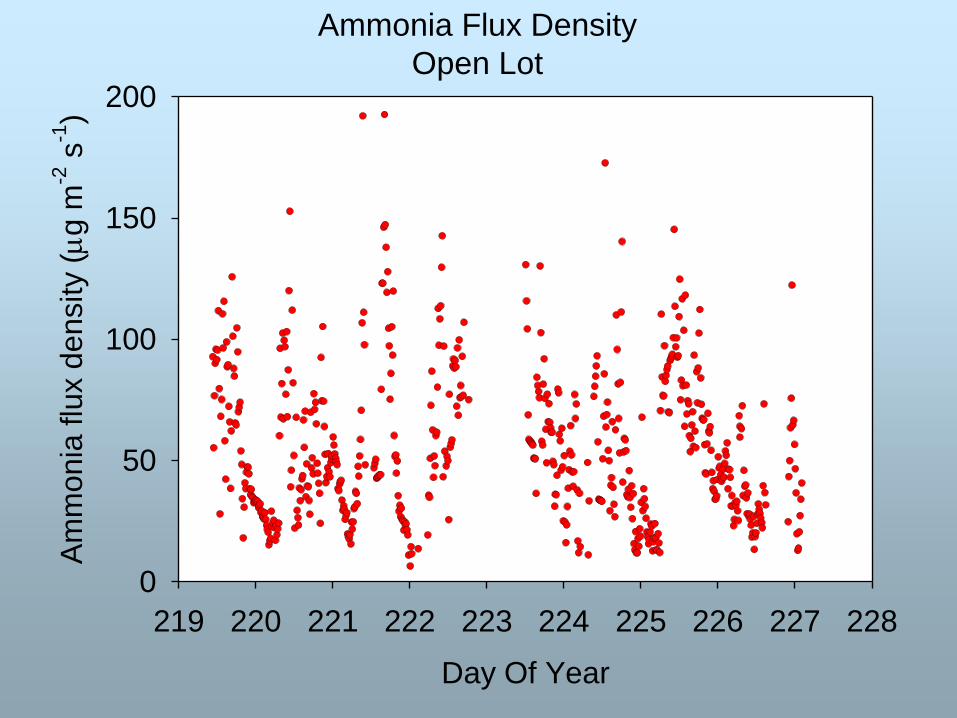
Day Of Year
219 220 221 222 223 224 225 226 227 228
Am
mo
nia
flu
x d
en
sity (
g m
-2 s
-1)
0
50
100
150
200
Ammonia Flux Density
Open Lot
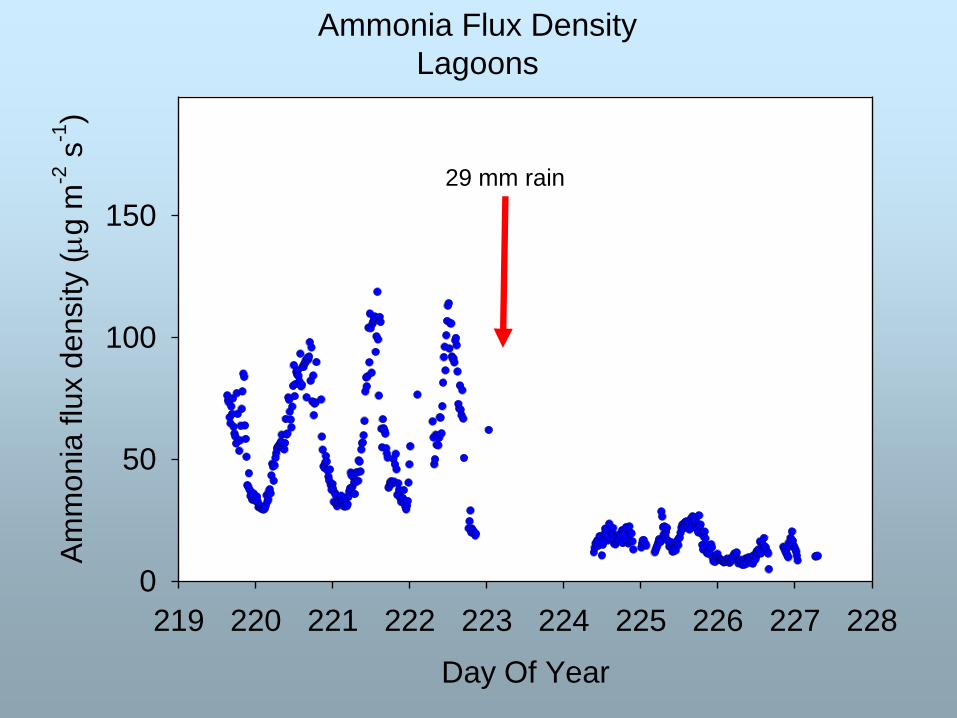
Ammonia Flux Density
Lagoons
Day Of Year
219 220 221 222 223 224 225 226 227 228
Am
mo
nia
flu
x d
en
sity (
g m
-2 s
-1)
0
50
100
150
29 mm rain
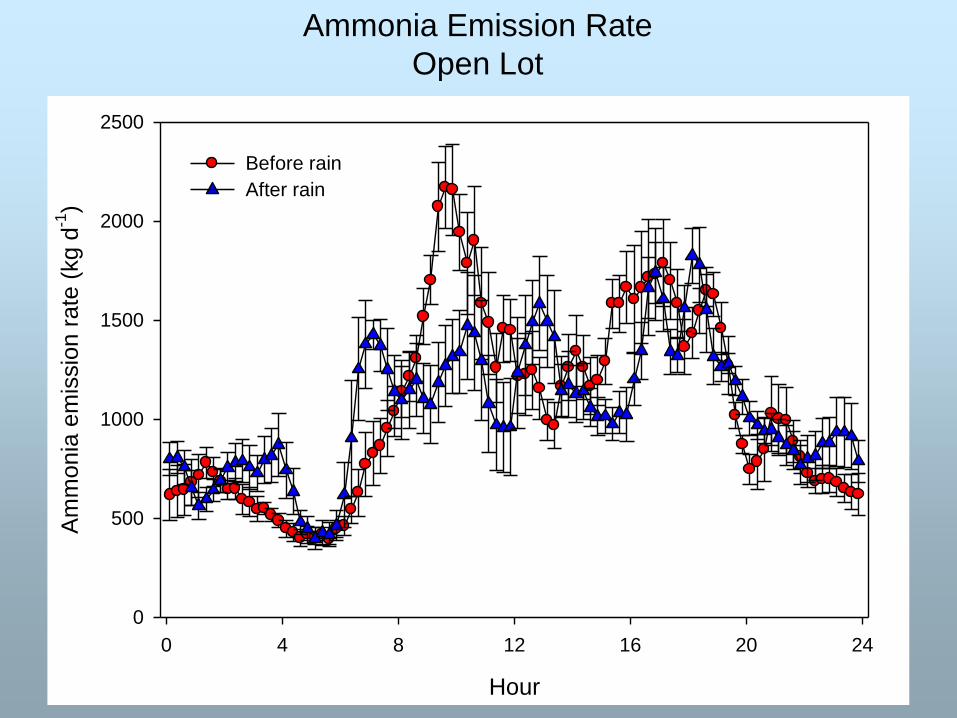
Hour
0 4 8 12 16 20 24
Am
monia
em
issio
n r
ate
(kg d
-1)
0
500
1000
1500
2000
2500
Before rain
After rain
Ammonia Emission Rate
Open Lot
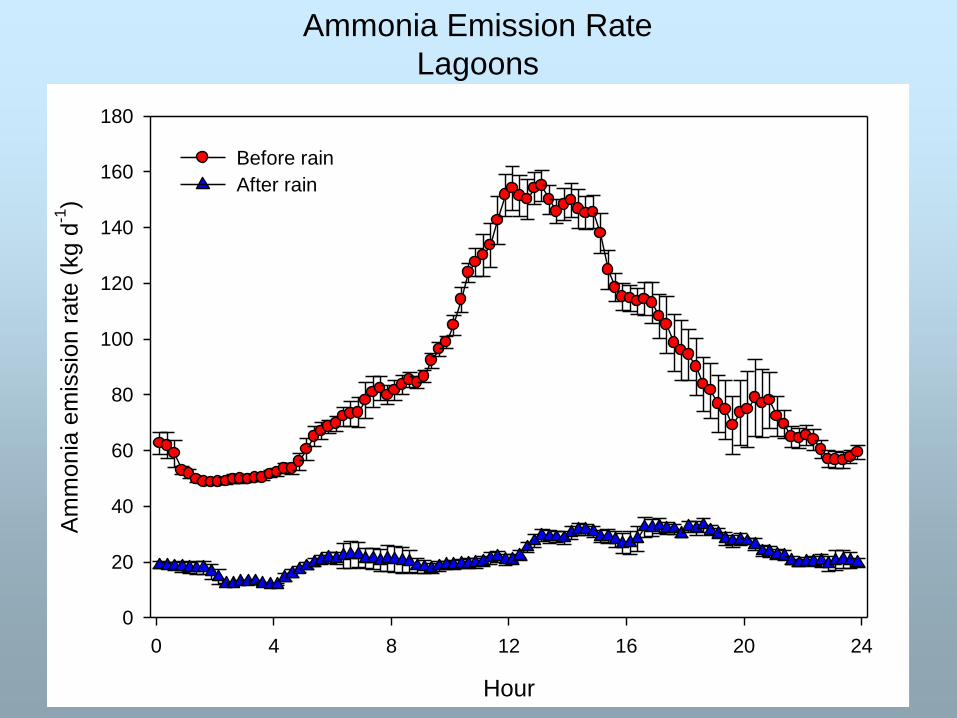
Hour
0 4 8 12 16 20 24
Am
mo
nia
em
issio
n r
ate
(kg d
-1)
0
20
40
60
80
100
120
140
160
180
Before rain
After rain
Ammonia Emission Rate
Lagoons
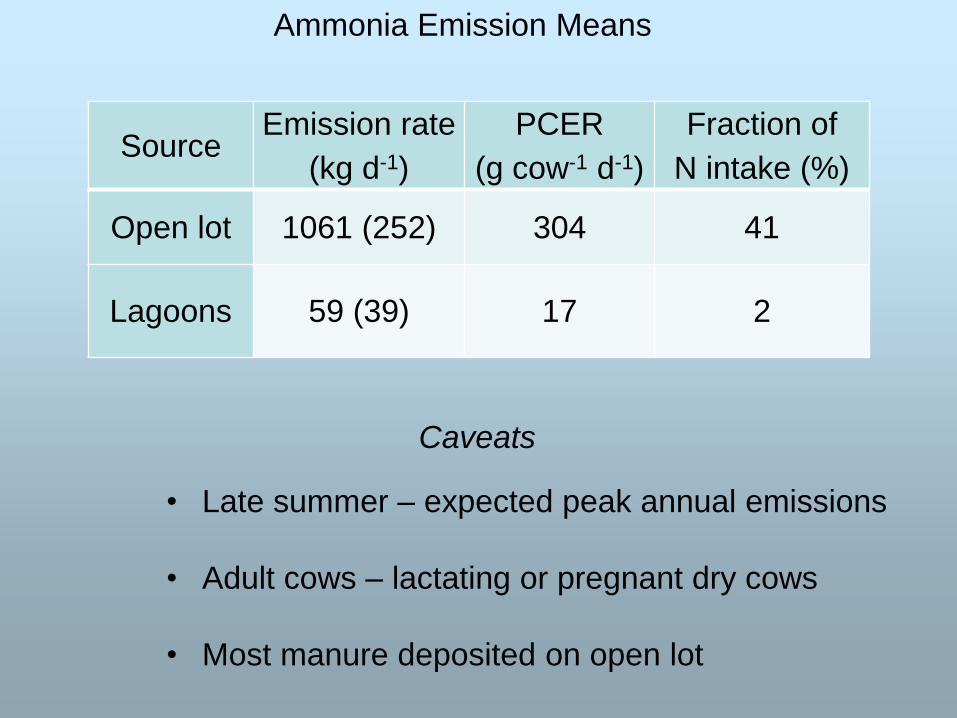
SourceEmission rate
(kg d-1)
PCER
(g cow-1 d-1)
Fraction of
N intake (%)
Open lot 1061 (252) 304 41
Lagoons 59 (39) 17 2
Ammonia Emission Means
• Late summer – expected peak annual emissions
• Adult cows – lactating or pregnant dry cows
• Most manure deposited on open lot
Caveats
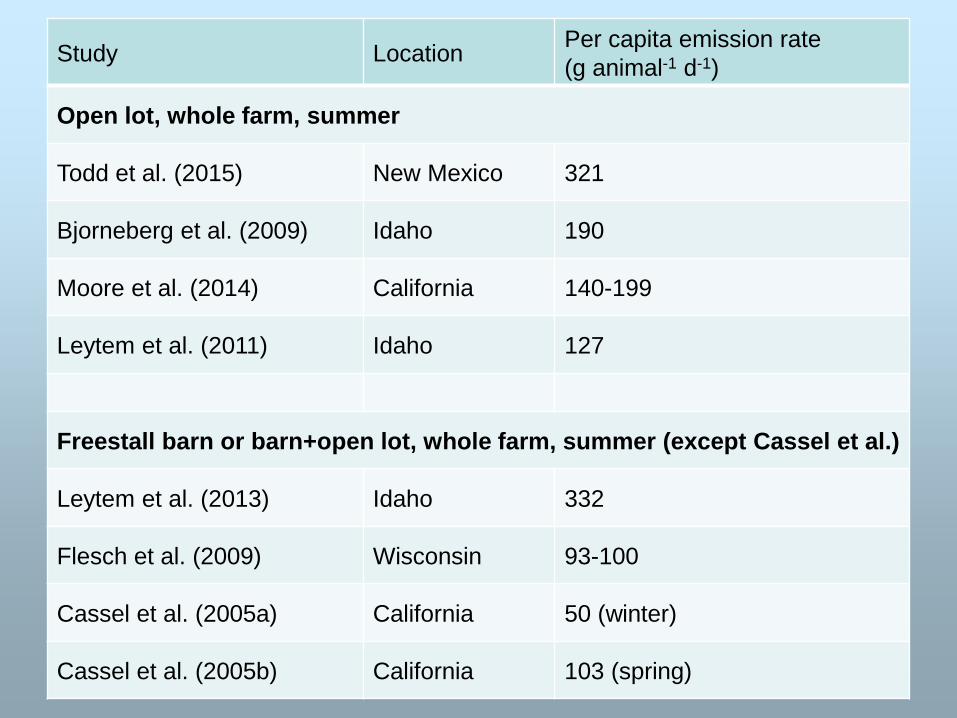
Study LocationPer capita emission rate
(g animal-1 d-1)
Open lot, whole farm, summer
Todd et al. (2015) New Mexico 321
Bjorneberg et al. (2009) Idaho 190
Moore et al. (2014) California 140-199
Leytem et al. (2011) Idaho 127
Freestall barn or barn+open lot, whole farm, summer (except Cassel et al.)
Leytem et al. (2013) Idaho 332
Flesch et al. (2009) Wisconsin 93-100
Cassel et al. (2005a) California 50 (winter)
Cassel et al. (2005b) California 103 (spring)
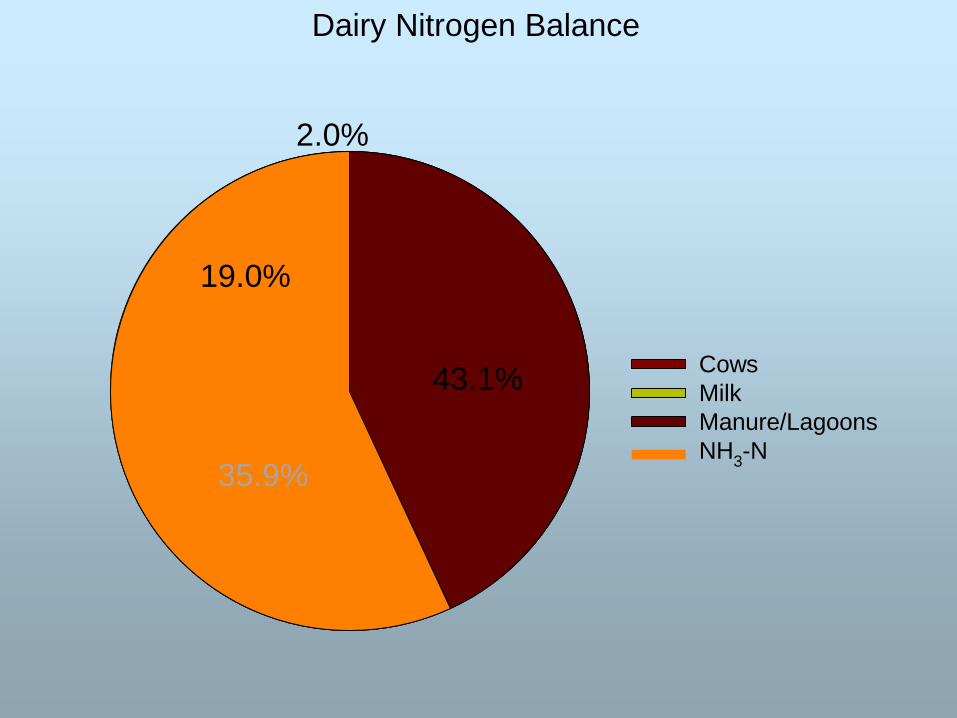
Cows
Milk
Manure/Lagoons
NH3-N
2.0%
43.1%
35.9%
19.0%
Dairy Nitrogen Balance
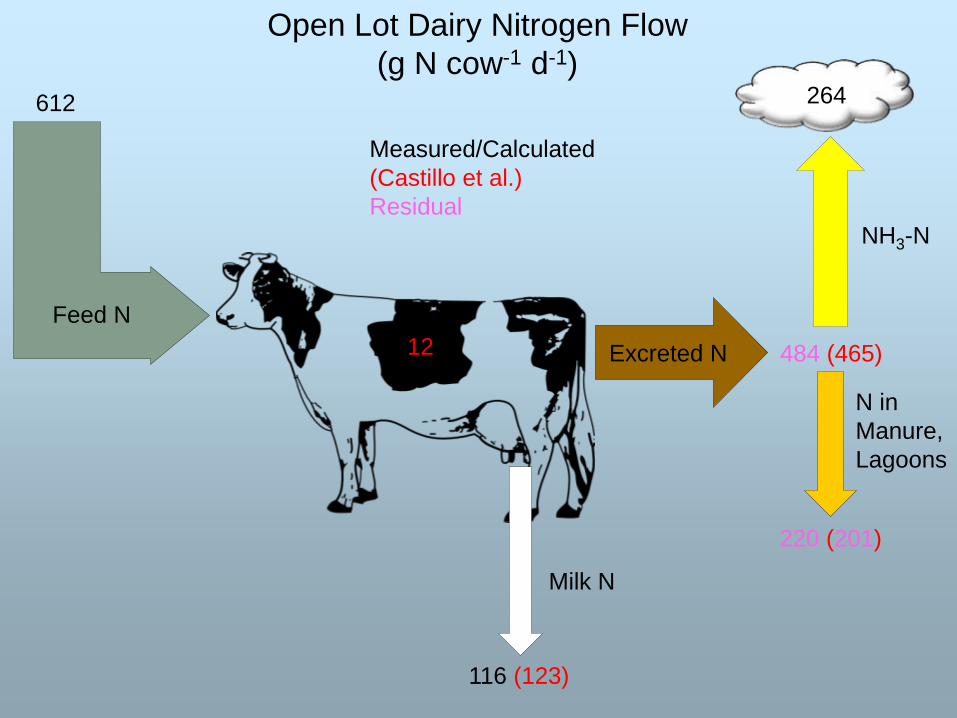
612
116 (123)
Excreted N12 484 (465)
264
NH3-N
Milk N
220 (201)
N in
Manure,
Lagoons
Open Lot Dairy Nitrogen Flow
(g N cow-1 d-1)
Measured/Calculated
(Castillo et al.)
Residual
Feed N
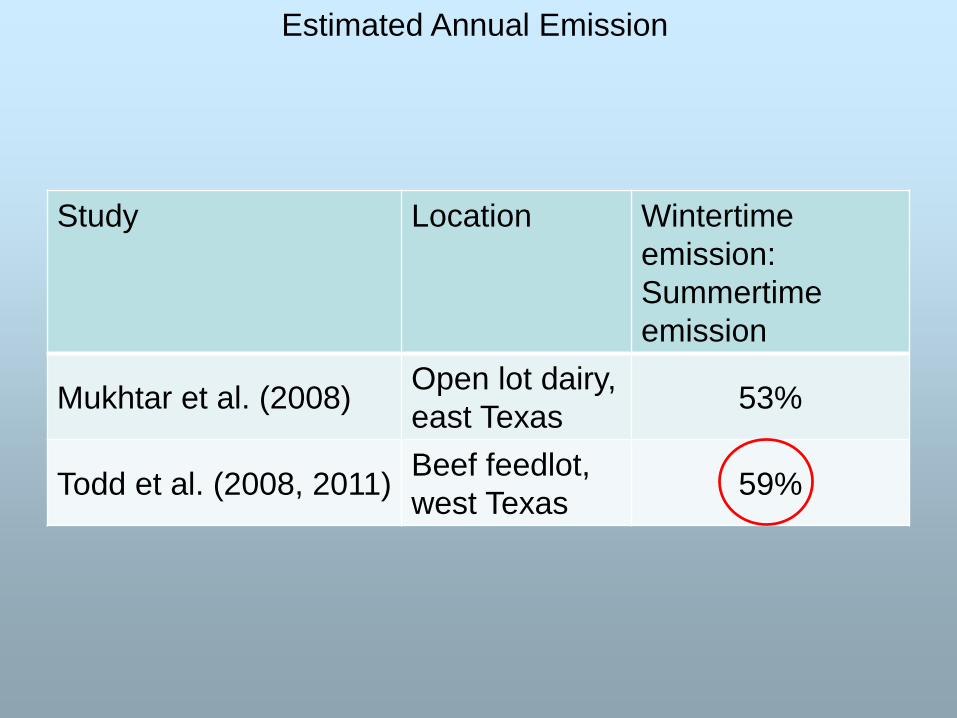
Estimated Annual Emission
Study Location Wintertime
emission:
Summertime
emission
Mukhtar et al. (2008)Open lot dairy,
east Texas53%
Todd et al. (2008, 2011)Beef feedlot,
west Texas59%
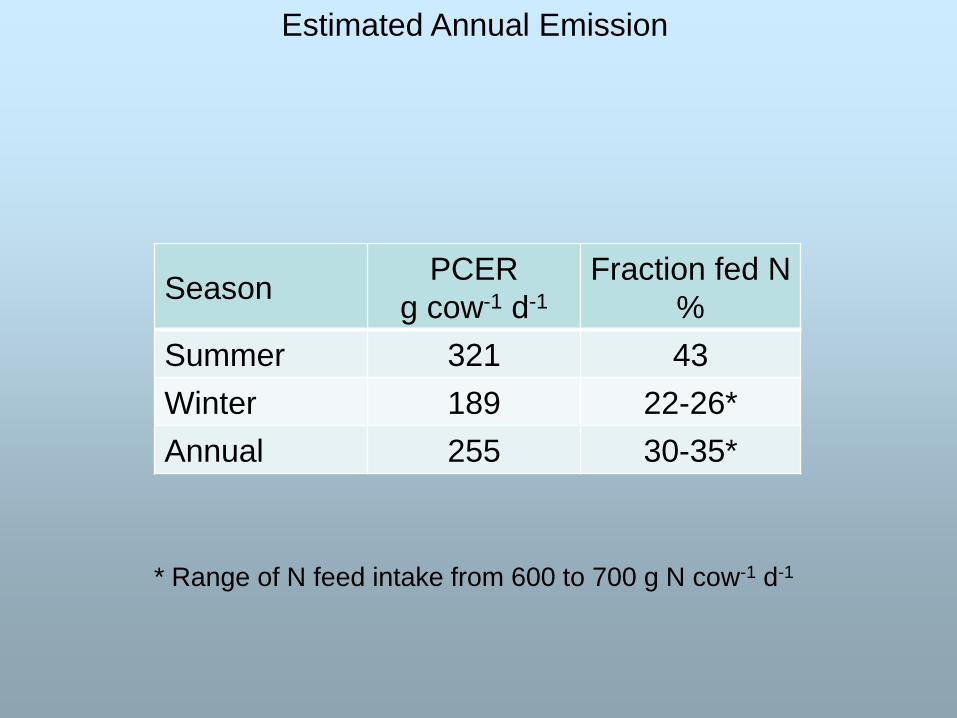
Estimated Annual Emission
SeasonPCER
g cow-1 d-1
Fraction fed N
%
Summer 321 43
Winter 189 22-26*
Annual 255 30-35*
* Range of N feed intake from 600 to 700 g N cow-1 d-1
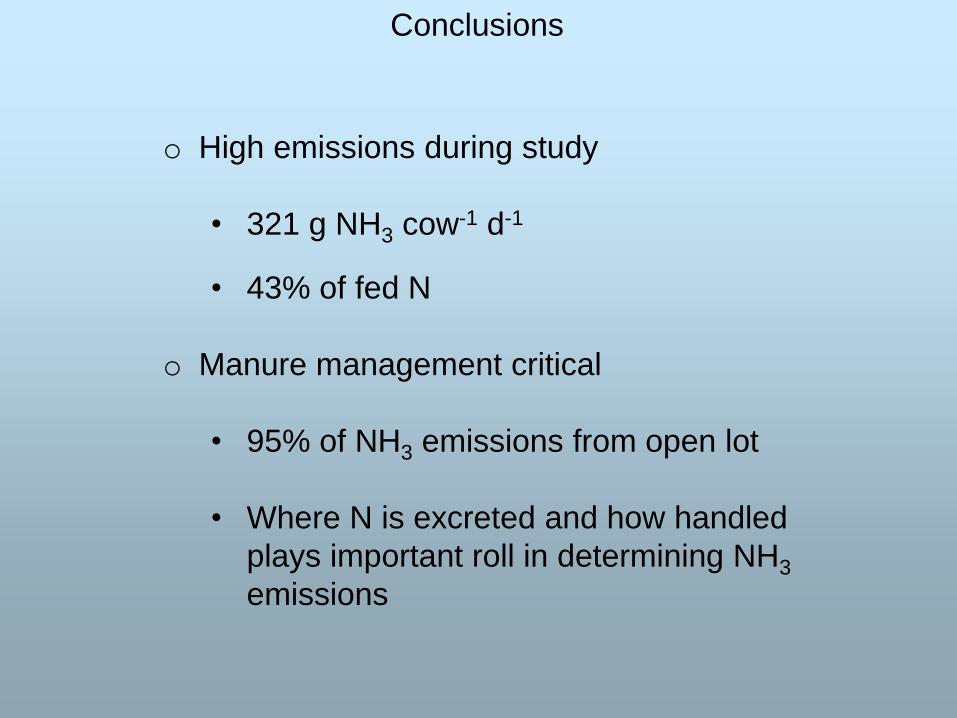
Conclusions
o High emissions during study
• 321 g NH3 cow-1 d-1
• 43% of fed N
o Manure management critical
• 95% of NH3 emissions from open lot
• Where N is excreted and how handled
plays important roll in determining NH3
emissions


![PowerPoint Presentation ANALYSIS. Nitrogen Testing. Total Nitrogen (TN) Total Kjeldahl Nitrogen (TKN) [Organic Nitrogen + Ammonia (inorganic )] Nitrate (NO. 3-) Nitrite (NO. 2-) Inorganic](https://img.pdfslide.us/doc/110x75/5e97650d317cbf0e395cb525/powerpoint-presentation-analysis-nitrogen-testing-total-nitrogen-tn-total-kjeldahl.jpg)