Embed Size (px)
Citation preview

New England Tornado Hazard
Regional Climatology & Risk
Mary D. Stampone
Department of Geography
New Hampshire State Climate Office
University of New Hampshire
Presentation for thePlymouth State University
Environmental Science & Policy Colloquium
September 19, 2012

National Tornado Statistics
Time-Series
Tornado
Statistics by US State
http://www.spc.noaa.gov/wcm/#data
New England
states have the
fewest average
annual tornado
occurrence of
the lower 48.

National Tornado Statistics
Record Tornado
New Hampshire
July 28, 2008
http://www.erh.noaa.gov/gyx/
Just before noon, a
tornado touched down
near Deerfield, NH.
This tornado cut a 50 mile
path over 80 minutes to
the Maine border

New England Tornadoes
New England
Tornado
Influences
Lewis (2007)
Public
misconceptions
about tornado
influences
strengthen belief
that “tornadoes do
not happen here.”
Tornado Origins
(1981-2010)

New England Tornadoes
http://www.erh.noaa.gov/box/
Prior to the 2011 Joplin
tornado, the Worchester
MA tornado of 1953 was
the deadliest US tornado
since 1950.
Deadliest US Tornadoes:
Worchester, MA
June 9, 1953
New England Tornadoes
http://www.erh.noaa.gov/box/
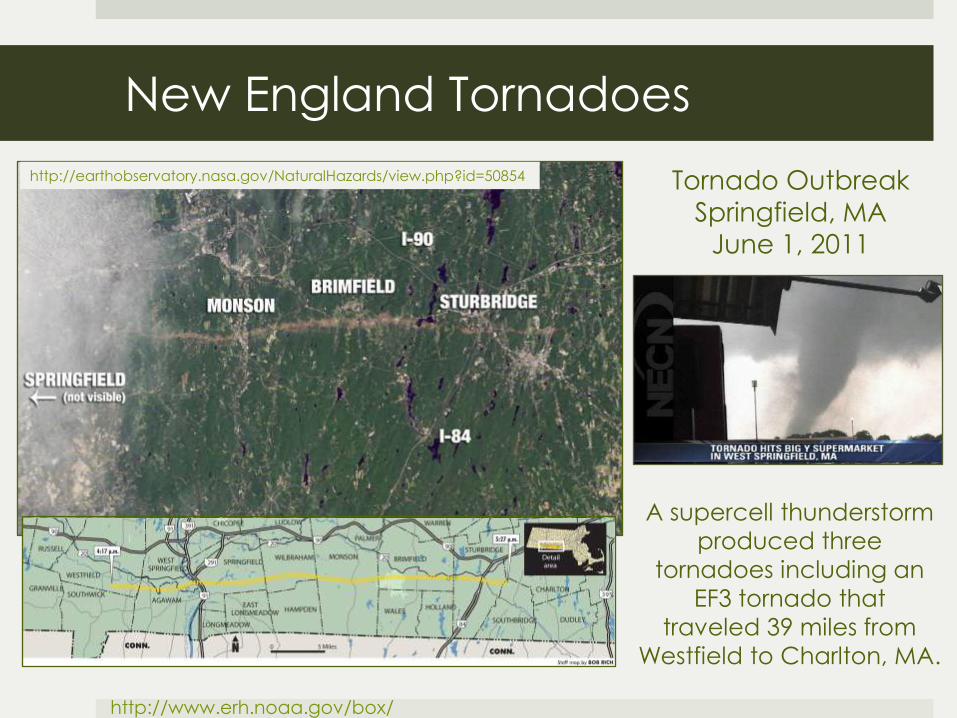
A supercell thunderstorm
produced three
tornadoes including an
EF3 tornado that
traveled 39 miles from
Westfield to Charlton, MA.
Tornado Outbreak
Springfield, MA
June 1, 2011
http://earthobservatory.nasa.gov/NaturalHazards/view.php?id=50854

National Tornado Statistics
http://www.spc.noaa.gov/wcm/#data
Area-Weighted
Time-Series
Tornado
Statistics by US
State
New England
states have the
fewest average
annual tornado
occurrence east
of the Rockies.

National Tornado Statistics
Tornado
Data
(1951-2011)
http://www.spc.noaa.gov/wcm/#data
Tornado data for 1951 to 2010 obtained from the Storm
Prediction Center “Storm Data” publication for NCDC.
Dataset Includes:
Location
Path Lengths
Time
Magnitude
Injuries/Fatalities
Damages

New England Tornado Climatology
New England
Tornado
Climatology
(1951-2010)
http://www.spc.noaa.gov/wcm/#data
A lack of consistency
in older tornado
reports reduces
confidence in the
accuracy of the
data.0
20
40
60
80
100
120
140
1951-60 1961-70 1971-80 1981-90 1991-00 2001-10
Tota
l To
rna
do
Re
po
rts
Decade
CT MA ME NH RI VT
*
*RI - No reports prior to 1971.
*
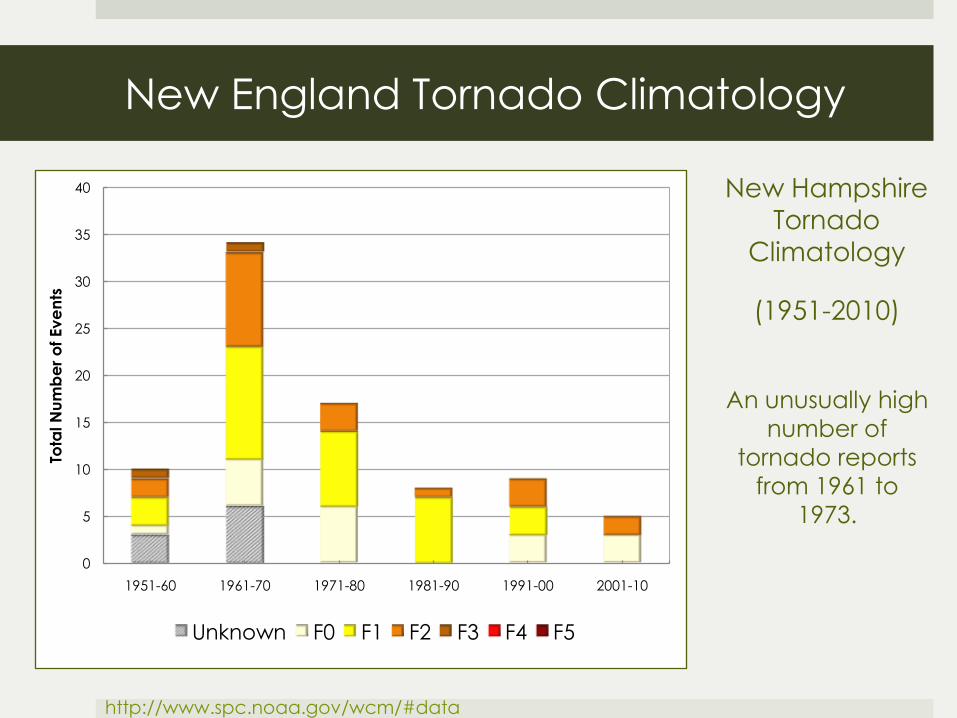
New England Tornado Climatology
New Hampshire
Tornado
Climatology
(1951-2010)
http://www.spc.noaa.gov/wcm/#data
An unusually high
number of
tornado reports
from 1961 to
1973.
0
5
10
15
20
25
30
35
40
1951-60 1961-70 1971-80 1981-90 1991-00 2001-10
Tota
l N
um
be
r o
f Ev
en
ts
Unknown F0 F1 F2 F3 F4 F5

CT MA ME NH RI VT
New England Tornado Climatology
New England Tornado
Climatology
(1981-2010)
http://www.spc.noaa.gov/wcm/#data
The most recent climate
normal period is of
reasonable length and
consistency for analysis.
0
10
20
30
40
50
60
70
Tota
l To
rna
do
Re
po
rts
Decade
1981-90 1991-00 2000-10

New England Tornado Climatology
New England Tornado Climatology
(1981-2010)
http://www.spc.noaa.gov/wcm/#data

New England Tornado Climatology
New England
Tornado
Climatology
(1981-2010)
http://www.spc.noaa.gov/wcm/#data
Tornadoes occur
most often during
warm season
from May
through
September. 0
5
10
15
20
25
Tota
l To
rna
do
Re
po
rts
CT MA ME NH RI VT

New England Tornado Climatology
New England
Tornado
Climatology
(1981-2010)
http://www.spc.noaa.gov/wcm/#data
Tornadoes occur
most often during
the afternoon
hours and rarely
occur over night. 0
5
10
15
20
25
Tota
l To
rna
do
Re
po
rts
CT MA ME NH RI VT

New England Tornado Climatology
New England
Tornado
Climatology
(1981-2010)
http://www.spc.noaa.gov/wcm/#data
Locations of New
England tornado
origins.
Highest highest
tornado density
occurs over
southeastern CT.
Tornadoes per 100 km2
1-2
1
<1

New England Population Distribution
Distribution of
New England
Urban Centers
http://2010.census.gov/2010census/data/
Southern New
England is part of
the densely
populated
northeast
corridor.
Image Source: Annemarie
Schneider/NASA Landsat
Distribution of Urban Surfaces (2010)
Providence
BostonWorchester
ConnecticutRiver
Valley

New England Population Distribution
Distribution of
New England
Urban Centers
http://www.spc.noaa.gov/wcm/#data
Parts of southern
New England’s most
densely populated
urban/suburban
landscapes
are located within
the areas of highest
tornado
occurrence.
Total hazard is a
function of event
occurrence and
potential impact
Population Density& Tornado Tracks
Population Density
-2
-1.5
-1
-0.5
0
0.5
1
1.5
2
-2 -1.5 -1 -0.5 0 0.5 1 1.5 2
Torn
ad
o O
cc
urr
en
ce
Tornado Impact
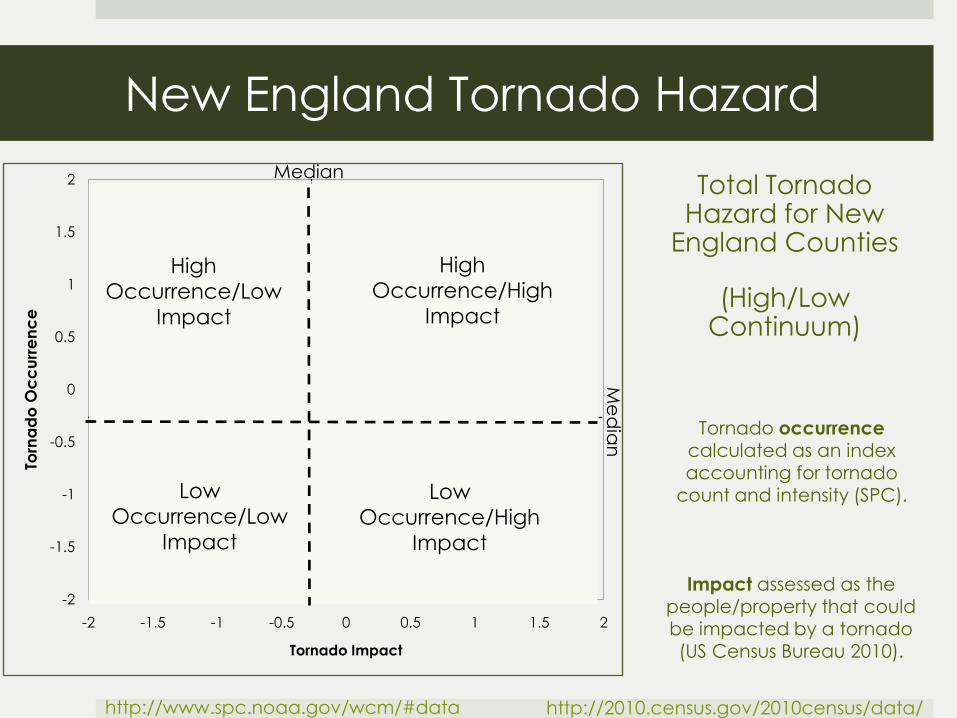
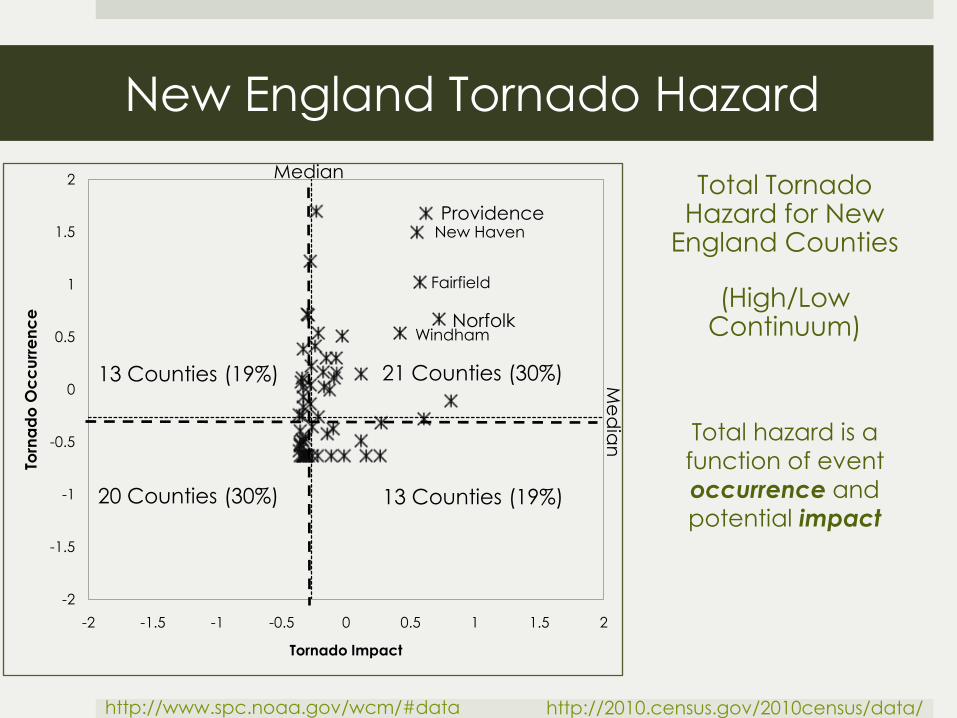
New England Tornado Hazard
Total Tornado Hazard for New
England Counties
(High/Low Continuum)
http://www.spc.noaa.gov/wcm/#data
Tornado occurrence
calculated as an index accounting for tornado
count and intensity (SPC).
Impact assessed as the people/property that could be impacted by a tornado (US Census Bureau 2010).
Median
Me
dia
n
http://2010.census.gov/2010census/data/
High
Occurrence/Low
Impact
High
Occurrence/High
Impact
Low
Occurrence/Low
Impact
Low
Occurrence/High
Impact
-2
-1.5
-1
-0.5
0
0.5
1
1.5
2
-2 -1.5 -1 -0.5 0 0.5 1 1.5 2
Torn
ad
o O
cc
urr
en
ce
Tornado Impact
Total hazard is a
function of event
occurrence and
potential impact
New England Tornado Hazard
Total Tornado Hazard for New
England Counties
(High/Low Continuum)
http://www.spc.noaa.gov/wcm/#data
Median
Me
dia
n
20 Counties (30%) 13 Counties (19%)
13 Counties (19%) 21 Counties (30%)
ProvidenceNew Haven
Fairfield
NorfolkWindham
http://2010.census.gov/2010census/data/

New England Tornado Hazard
Total Tornado Hazard for
New England Counties
(High/Low Continuum)
Densely populated counties of
southern New England coincide
with the region’s highest
tornado occurrence.
These areas have the
highest hazard relative to
the rest of the region.
http://www.spc.noaa.gov/wcm/#data http://2010.census.gov/2010census/data/

*
** *
**
New England Tornado Hazard
Total Tornado Hazard for
New England Counties
(Product of Occurrence
and Impact)
http://www.spc.noaa.gov/wcm/#data
Tornado probability of
occurrence
multiplied by the
probability of impact
humans/infrastructure.
Evaluated as a product may
overstate the relative hazard.*
*
*
*
*
*
*
*
*
**
*

Next Step:
Beyond knowing where tornadoes are most likely to occur and the areas
where the impact will be highest, it is important to understand the
mechanisms that lead to the formation of tornadoes. Studies indicate
areas of enhanced convection and increased storm frequency during the
warm season that coincide with areas of highest tornado occurrence
(Lombardo & Colle 2010, 2011; Waslua et. al 2002; Murray & Colle 2011).
Prepare database of detailed weather observations (where available)
for the time of each tornado.
Compare the weather characteristics during each event to the general
atmosphere conditions associated with regional convective and other
severe thunderstorm events.

Resources:
Storm Prediction Center (SPC) Storm http://www.spc.noaa.gov/wcm/#data
US Census Bureau (2010) http://2010.census.gov/2010census/data/
Dixon, R.W., A.E. Mercer, J. Choi, and J.S. Allen (2011) Tornado Risk Analysis: Is Dixie Alley and Extension of Tornado Alley? Bulletin of the American Meteorological Society 92(4), 433-441
Dixon, R.W. and T.W Moore (2012) Tornado Vulnerability in Texas. Weather, Climate, and Society. 59-67. doi: 10.1175/WCAS-D-11-00004.1
Lewis, T.R. (2006) The Tornado Hazard In Southern New England:
History, Characteristics, Student and Teacher Perceptions. Journal of Geography 105, 258-266.
Questions?
New Hampshire State Climate Office
The New Hampshire State Climate Office (NHSCO) resides within the Department
of Geography at the University of New Hampshire.
The NHSCO is officially recognized by the American Association of State
Climatologists and the National Oceanic and Atmospheric Administration (NOAA).
http://www.unh.edu/stateclimatologist/ Follow on Twitter at: https://twitter.com/nh_sco


![Climatology [Autosaved]](https://img.pdfslide.us/doc/110x75/577cd2e91a28ab9e78964bc6/climatology-autosaved.jpg)