Embed Size (px)
Citation preview
Changes in Tornado Climatology Accompanying the Enhanced Fujita Scale
ROGER EDWARDS,a HAROLD E. BROOKS,b AND HANNAH COHNc,d
a Storm Prediction Center, National Weather Service, Norman, OklahomabNational Severe Storms Laboratory and School of Meteorology, University of Oklahoma, Norman, Oklahoma
c IBM Weather Company, Dallas, TexasdAmerican Airlines, Dallas, Texas
(Manuscript received 30 March 2021, in final form 23 August 2021)
ABSTRACT: U.S. tornado records form the basis for a variety ofmeteorological, climatological, and disaster-risk analyses,
but how reliable are they in light of changing standards for rating, as with the 2007 transition of Fujita (F) to enhanced Fujita
(EF) damage scales? Towhat extent are recorded tornadometrics subject to such influences that may be nonmeteorological
in nature? While addressing these questions with utmost thoroughness is too large of a task for any one study, and may not
be possible given the many variables and uncertainties involved, some variables that are recorded in large samples are ripe
for new examination. We assess basic tornado-path characteristics—damage rating, length, width, and occurrence time, as
well as some combined and derived measures—for a 24-yr period of constant path-width recording standard that also
coincides with National Weather Service modernization and the WSR-88D deployment era. The middle of that period (in
both time and approximate tornado counts) crosses the official switch from F to EF. At least minor shifts in all assessed path
variables are associated directly with that change, contrary to the intent of EF implementation. Major and essentially
stepwise expansion of tornadic path widths occurred immediately upon EF usage, and widths have expanded still farther
within the EF era. We also document lesser increases in pathlengths and in tornadoes rated at least EF1 in comparison with
EF0. These apparently secular changes in the tornado data can impact research dependent on bulk tornado-path charac-
teristics and damage-assessment results.
KEYWORDS: Atmosphere; North America; Severe storms; Tornadoes; Data quality control; Damage assessment
1. Background
United States tornado data are gathered by local National
Weather Service (NWS) offices, compiled in county-segmented
form byNCEI (formerly NCDC), and thenmolded into whole-
path ‘‘One Tornado’’ (ONETOR) files made freely available
by the Storm Prediction Center (Schaefer and Edwards 1999;
https://www.spc.noaa.gov/wcm/#data). Path characteristics in
ONETOR include start and end times, starting and ending
locations (via state, latitude, and longitude), pathlengths and
widths, nonagricultural and crop damage codes corresponding
to ranges of dollar values, direct deaths and injuries, and
damage ratings based on the maximum damage indicator (DI)
found in each path. Tornadoes in ONETOR were observed
directly by eyewitnesses, were inferred from remote sensing
(such as radar imagery) that motivated subsequent survey-
based verification, or were discovered post facto from other-
wise surveyed damage patterns (Schaefer and Edwards 1999;
Edwards et al. 2013).
While true intensity of tornadoes cannot be known, nor
sampled directly along an entire path, tornado strength has
been inferred through peak-DI damage intensity according
to two successive measures: the Fujita (F) scale (e.g., Fujita
1971, 1981), applied to tornado records from 1950 through
January 2007, and the enhanced Fujita (EF) scale (Wind
Science and Engineering Center 2006), implemented in
February 2007 (LaDue and Ortega 2008). These scales dif-
fer considerably from each other in terms of precision and
application, leading to our general motivating hypothesis
for this work: that the switch from F to EF brought about
climatologically apparent changes in recorded tornado
characteristics.
Final tornado ratings in both scales are based on the maxi-
mum known damage point of each tornado, on a six-step scale
numbered from 0 to 5, representing weakest to strongest
damage as the number increases. Submaximal DIs also are
rated along most paths, to estimate point ranges of the fastest
quarter-mile (0.4 km) of responsible wind (McDonald 2001;
Edwards et al. 2013). The NWS adopted the F scale for official
rating purposes in a gradual process during the mid-1970s. This
included retroactively rating tornadoes to 1950, based largely
on photographs, printed news accounts, and descriptions available
in NCDC Storm Data periodicals. For that retroactive-rating era,
Agee and Childs (2014) documented apparent secular en-
hancement of F2 ratings, at the expense of F1. This relative
F2 enhancement also was apparent in the earlier work of
Verbout et al. (2006), although it was not identified specifi-
cally as the retroactive-rating era. To segregate generally
weaker, less-impactful events from the most deadly and
damaging ones, for research and forecasting applications,
Hales (1988) introduced the notion of significant (F2–F5)
tornadoes, a practice that became well established in tornado
climatology during the remainder of the F era (e.g., Grazulis
1993), and has remained customary for the corresponding EF
levels in research and operations [e.g., herein, and with ex-
plicit significant-tornado forecasts in SPC outlooks, per
Edwards et al. (2015)].
The F scale nominally was based on ‘‘well built’’ houses;
however, damages to both other human structures and vegetation,Corresponding author: Roger Edwards, [email protected]
OCTOBER 2021 EDWARDS ET AL . 1465
DOI: 10.1175/JAMC-D-21-0058.1
� 2021 American Meteorological Society. For information regarding reuse of this content and general copyright information, consult the AMS CopyrightPolicy (www.ametsoc.org/PUBSReuseLicenses).
Brought to you by NOAA Central Library | Unauthenticated | Downloaded 10/09/21 06:47 AM UTC
such as crops and trees, often were used to infer wind speeds and
assign corresponding F ratings (e.g., Wurman and Alexander
2005), including by the inventor of the scale (e.g., Fujita 1989,
1992, 1993). Leading up to and motivating EF-scale develop-
ment, concerns grew among wind engineers and research and
operational meteorologists about the F scale’s subjectivity,
imprecision, inconsistent application, and lack of diverse and
engineering-informed DIs (e.g., Minor et al. 1977; Doswell and
Burgess 1988; Edwards 2003). Taken together, Doswell et al.
(2009) and Edwards et al. (2013) comprehensively covered the
history and application of both scales, with implications for
tornado climatology.
Tornado-rating practices can affect operations as well as cli-
matological research (Weiss and Vescio 1998). Meteorological
factors known to lead to higher-rated, more-destructive and
generally deadlier tornadoes influence operational forecast de-
cisions and messaging at all scales—from severe-weather out-
looks to mesoscale discussions, watches, and warnings. That
includes explicit probabilistic predictions of potential for cer-
tain EF-rating categories to be realized (e.g., Edwards et al.
2015; Smith et al. 2015, 2020a,b). Tornado ratings also impact
risk analysis (e.g., Grazulis 1993; Concannon et al. 2000;
Coleman and Dixon 2014). As such, systemic artifacts in the
rating process may subvert data integrity and impact both
scientific and socioeconomic users of the data in a myriad of
ways, some unknown.
The F and EF scales should be analytically interchangeable.
The common DI between the F and EF scales (‘‘well built’’
homes) nominally was calibrated in EF development so that
any F-scale DI rated F3, for example, still would qualify as EF3
in the newer, more-precise scale. The intent (Doswell et al.
2009; Edwards et al. 2013) was to ensure a smooth transition
from F to EF, thereby making tornado data from the F era
essentially interchangeable with EF data, and vice versa, for
research purposes, including tornado climatology. Such F–EF
cross calibration ideally would prevent undesirable, secular
climatological shocks (Thorne and Vose 2010), such as signif-
icant discontinuities in bulk tornadic ratings and pathmeasures
from F to EF eras. In retrospect, how well was that ideal
achieved? Or put another way, what has been the EF scale’s
effect on tornado climatology? Our research addresses these
questions.
Tornadic path-size characteristics have been used for
over five decades to establish climatologies and evaluate
risk (e.g., Thom 1963), and should remain important for
that purpose as the built-environment footprint keeps
growing in tornado-prone regions (Ashley et al. 2014;
Strader et al. 2017). Path characteristics also relate to the
meteorological environments in which tornadoes occur,
with some longitudinal changes across the conterminous
United States (Garner et al. 2021, within the EF era). As
such, any systemic path-size changes in the existing tor-
nado records will affect evaluations of both the climatol-
ogy and future threats of tornadoes. To the extent those
path-area trends are nonmeteorological in nature, they
also can subvert the fidelity of research analyses and con-
clusions that do not account for them. Do such secular
changes exist?
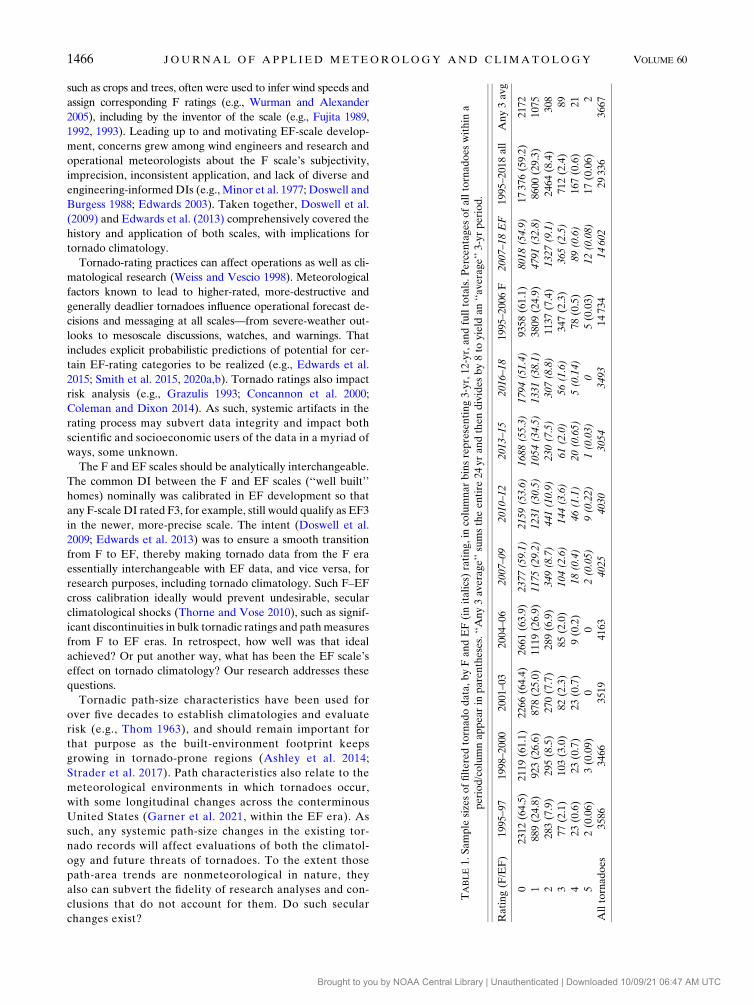
TABLE1.Sample
sizesoffilteredtornadodata,byFandEF(initalics)rating,in
columnarbinsrepresenting3-yr,12-yr,andfulltotals.Percen
tagesofalltornadoeswithin
a
period/columnappear
inparentheses.‘‘Any3average’’sumstheentire
24yrandthendividesby8to
yield
an‘‘average’’3-yrperiod.
Rating(F/EF)
1995–97
1998–2000
2001–03
2004–06
2007–09
2010–12
2013–15
2016–18
1995–2006
F2007–18EF
1995–2018all
Any3avg
02312(64.5)
2119(61.1)
2266(64.4)
2661(63.9)
2377(59.1)
2159(53.6)
1688(55.3)
1794(51.4)
9358(61.1)
8018(54.9)
17376(59.2)
2172
1889(24.8)
923(26.6)
878(25.0)
1119(26.9)
1175(29.2)
1231(30.5)
1054(34.5)
1331(38.1)
3809(24.9)
4791(32.8)
8600(29.3)
1075
2283(7.9)
295(8.5)
270(7.7)
289(6.9)
349(8.7)
441(10.9)
230(7.5)
307(8.8)
1137(7.4)
1327(9.1)
2464(8.4)
308
377(2.1)
103(3.0)
82(2.3)
85(2.0)
104(2.6)
144(3.6)
61(2.0)
56(1.6)
347(2.3)
365(2.5)
712(2.4)
89
423(0.6)
23(0.7)
23(0.7)
9(0.2)
18(0.4)
46(1.1)
20(0.65)
5(0.14)
78(0.5)
89(0.6)
167(0.6)
21
52(0.06)
3(0.09)
00
2(0.05)
9(0.22)
1(0.03)
05(0.03)
12(0.08)
17(0.06)
2
Alltornadoes
3586
3466
3519
4163
4025
4030
3054
3493
14734
14602
29336
3667
1466 JOURNAL OF APPL IED METEOROLOGY AND CL IMATOLOGY VOLUME 60
Brought to you by NOAA Central Library | Unauthenticated | Downloaded 10/09/21 06:47 AM UTC
Upward temporal trends in path dimensions into this
century have been noticed and discussed in other research
(e.g., Agee and Childs 2014; Elsner et al. 2014), and as the
latter stated, ‘‘more work needs to be done to understand
the reason behind the increase in path length and width.’’
Our work represents updated documentation of those trends
(in the WSR-88D era), extending deeper into this century to
reveal an apparent strong secular contribution to path-area
increases corresponding to the change from F to EF scales.
Section 2 describes data used, filters applied thereto, anal-
ysis methods, and sampling, while section 3 offers results
and interpretations of our analyses. We conclude with
section 4, summarizing this examination, along with its im-
plications and recommendations for future research using
U.S. tornado data.
2. Data, filtering and sorting
The WSR-88D radar network (Crum and Alberty 1993)
largely was completed by 1995. The ensuing time frame rep-
resents the ‘‘modernized’’ NWS period, a time of relative stasis
in data-recording procedures for tornadoes, motivated by
largely WSR-88D-based warnings and verification thereof
(Edwards 2012). Relative to 1950–94, this also represents
an era of greater traditional-media coverage of tornadoes,
the popularization and proliferation of storm chasing, con-
sumer digital cameras, expansion of cellular communica-
tions, and (in the EF era) social media, to aid in tornado
documentation. Verbout et al. (2006) discussed changes
in tornado-data characteristics related to the WSR-88D, as
well as prior data shifts, and emphasized using statistical
detrending techniques when analyzing the entire ONETOR
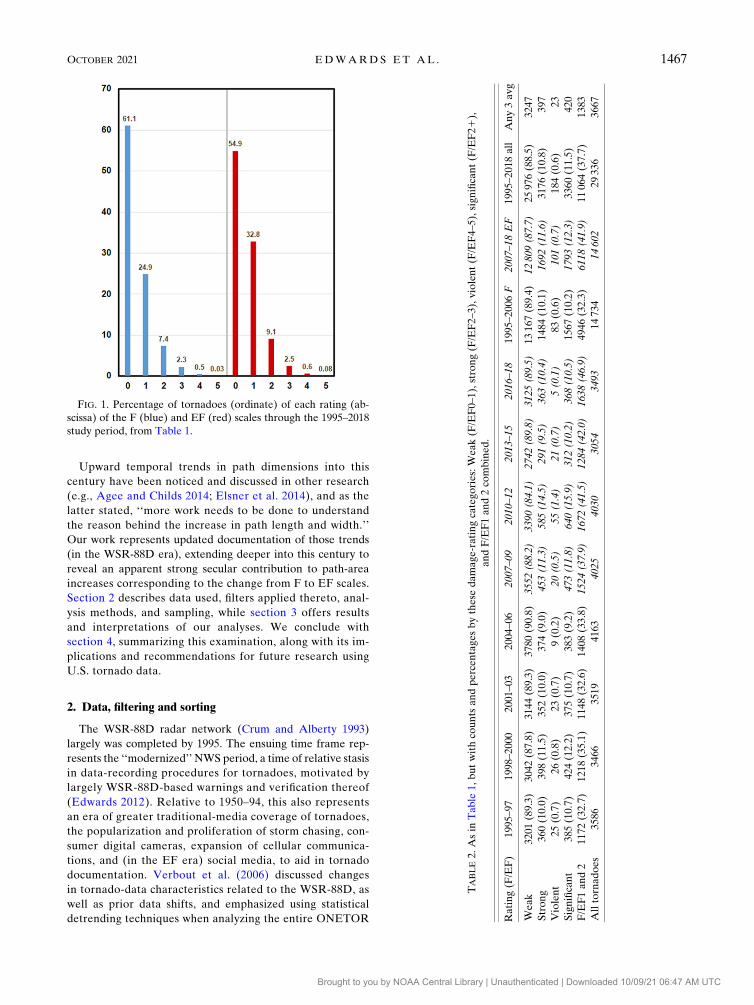
FIG. 1. Percentage of tornadoes (ordinate) of each rating (ab-
scissa) of the F (blue) and EF (red) scales through the 1995–2018
study period, from Table 1.
TABLE2.Asin
Tab
le1,butwithcountsandpercentagesbythese
damage-ratingcategories:W
eak(F/EF0–1),strong(F/EF2–3),violent(F/EF4–5),sign
ificant(F/EF21),
andF/EF1and2combined.
Rating(F/EF)
1995–97
1998–2000
2001–03
2004–06
2007–09
2010–12
2013–15
2016–18
1995–2006F
2007–18EF
1995–2018all
Any3avg
Weak
3201(89.3)
3042(87.8)
3144(89.3)
3780(90.8)
3552(88.2)
3390(84.1)
2742(89.8)
3125(89.5)
13167(89.4)
12809(87.7)
25976(88.5)
3247
Strong
360(10.0)
398(11.5)
352(10.0)
374(9.0)
453(11.3)
585(14.5)
291(9.5)
363(10.4)
1484(10.1)
1692(11.6)
3176(10.8)
397
Violent
25(0.7)
26(0.8)
23(0.7)
9(0.2)
20(0.5)
55(1.4)
21(0.7)
5(0.1)
83(0.6)
101(0.7)
184(0.6)
23
Significant
385(10.7)
424(12.2)
375(10.7)
383(9.2)
473(11.8)
640(15.9)
312(10.2)
368(10.5)
1567(10.2)
1793(12.3)
3360(11.5)
420
F/EF1and2
1172(32.7)
1218(35.1)
1148(32.6)
1408(33.8)
1524(37.9)
1672(41.5)
1284(42.0)
1638(46.9)
4946(32.3)
6118(41.9)
11064(37.7)
1383
Alltornadoes
3586
3466
3519
4163
4025
4030
3054
3493
14734
14602
29336
3667
OCTOBER 2021 EDWARDS ET AL . 1467
Brought to you by NOAA Central Library | Unauthenticated | Downloaded 10/09/21 06:47 AM UTC
dataset from 1950. Analyses by Agee and Childs (2014)
adjusted pre-1995 path-width data upward, to account
for a procedural change that year from recording mean to
maximum path width. Florida-focused analyses in Elsner
et al. (2018) detrended width data after the 1995 width-
standard reset.
We examine relatively stable ‘‘modernized era’’ data-gathering
practices and standards (including width), to minimize or avoid
detrending, and for balance of both time sampling and tornado
counts. This study follows through on the informal work of
Edwards and Brooks (2010, hereinafter EB10), which com-
pared the first 3 yr of the EF era with the last 12 yr of
F. Preliminarily findings included loss of EF0 events to EF1
and EF2 bins, but path-size characteristics were not examined.
Here, we restrict analyses to fundamental ONETOR variables
in the WSR-88D era, and one index derived arithmetically
from them, in two 12-yr bins: end of the F era from 1995 to
2006, and the 2007–18 part of the EF era. The data further are
compared across eight 3-yr bins (four using F, four of EF) that
are arbitrary in time-size choice but temporally balanced, and
of large sample size, after EB10. Data also were examined
across individual years. Because January 2007 had only 21
tornadoes (of 985 filtered events or 2.1% of the yearly tally),
they are included with tornadoes for the rest of 2007 and
the EF era.
Filtering was performed to expunge obviously bad or ex-
traneous ONETOR entries, in these quantities: 33 located
outside the conterminous 48U.S. states, 562 with an unphysical
value of zero for pathlength and/or width (oddly, 65% of which
were in one year, 1999), and 32 with zero as latitude and/or
longitude. Data with each of those problems were not used for
analyses, but instead separated out for documentation, repro-
ducibility, and potentially to inform future work outside the
scope of this study. Also disused were 111 EF-unknown (EFU)
entries, all from 2016 to 2018 when that category became valid
in NWS Storm Data compilation directives. That category is
meant to substitute for the legacy default practice of rating
nondamaging tornadoes, or those with inaccessible paths or
otherwise unknown damage, as F/EF0 (Edwards et al. 2013).
The EFU rating did not come into practical use until 2016, and
seldom has been applied since. Since their purpose largely is to
substitute for a defined subset of EF0 ratings, onemay presume
that EFUs otherwise would be EF0s, and analyze them ac-
cordingly. However, given that some uncertain number of
them truly may be rated due to unknown (as opposed to lack
of) damage, rating-based indices should not use a nonnumeric
category such as EFU, whose sample size also is small (two
orders of magnitude less) relative to the dataset as a whole.
As such, we simply set those aside.
The final, filtered analysis dataset contains 29 336 tornado
records: 14 734 tornado records (50.2%) from 1996 to 2006 and
14 602 (49.8%) from 2007 to 2018. Table 1 provides sample-size
characteristics for the resulting filtered dataset by F and EF
ratings, as well as eight 3-yr subsamples analyzed in section 3.
Although unsurprising natural variability in total tornado
counts exists on smaller time scales, such as 1–3 yr, the re-
markable and unplanned balance between the two 12-yr
periods represents essentially steady bulk tornado-sampling
levels between the last 12 yr of F and the first 12 yr of
EF. This is consistent with the aforementioned notion of no
need for detrending subsampled (1- or 3-yr) tornado counts
for our purposes, within the conterminous WSR-88D and
maximum-path-width eras. Large sample size is important in
evaluating tornado data that are affected by assorted secular
influences (Doswell 2007). Both the 12-yr sets (;104 events)
and 3-yr subsamples (;103) offer that advantage.
Every tornado in the filtered 24-yr dataset has a damage-
rating integer based on the F (first 12 yr) and EF (second
12 yr) scales. Doswell and Burgess (1988) discussed subjec-
tivity and inconsistencies in F-scale ratings, demonstrated
in a multiaudience teaching exercise by Edwards (2003).
Despite its far-greater precision, subjectivity issues affect the
EF scale also, given uncertain engineering of many specific
local DIs, and the rating process’s inherent dependence on
judgment calls (Doswell et al. 2009; Edwards et al. 2013).
Nonetheless, the 104 order of magnitude of tornado records
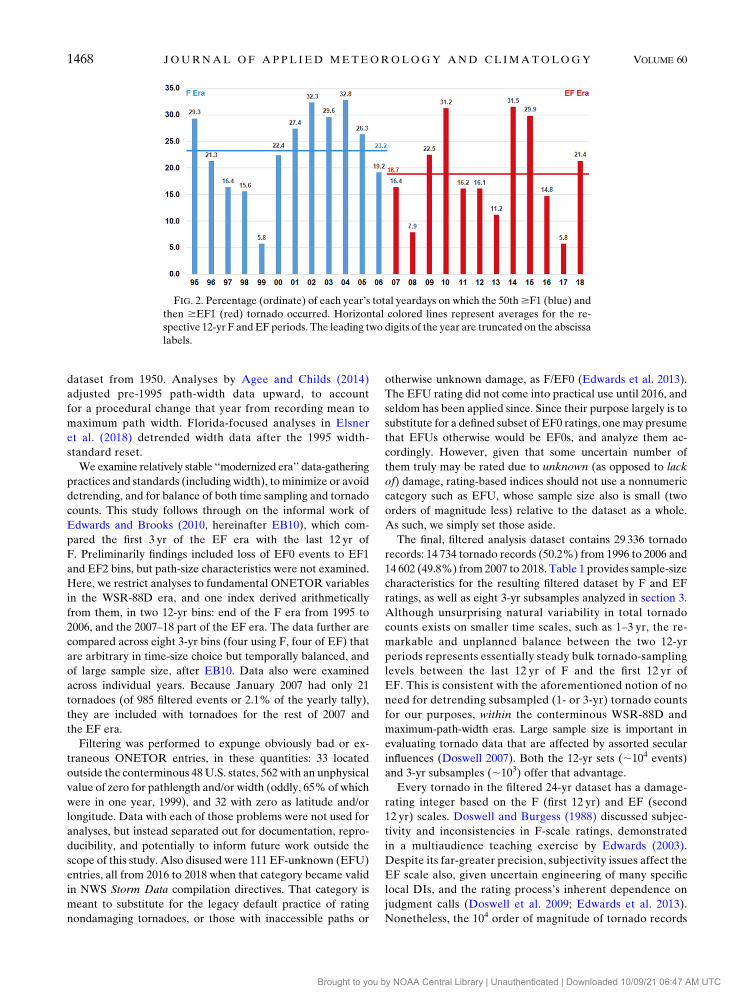
FIG. 2. Percentage (ordinate) of each year’s total yeardays on which the 50th$F1 (blue) and
then $EF1 (red) tornado occurred. Horizontal colored lines represent averages for the re-
spective 12-yr F andEF periods. The leading two digits of the year are truncated on the abscissa
labels.
1468 JOURNAL OF APPL IED METEOROLOGY AND CL IMATOLOGY VOLUME 60
Brought to you by NOAA Central Library | Unauthenticated | Downloaded 10/09/21 06:47 AM UTC
in our analysis should mitigate the bulk analytic impacts of
either local rating outliers or singular, nonsystemic data-
entry errors in individual events.
We analyzed the filtered data via comparative absolute
numbers, percentages of totals, means, medians, distributions
via percentile analyses, and Weibull distribution functions.
The latter functions were accumulated and plotted from the
shape and scale parameter of the width and length values for
each category (F and EF) and damage level 0–5. F/EF3–5
data were combined because of relatively small sampling per
damage level. Weibull distributions are a useful tool in de-
termining probability distributions and have been used to
model wind speed (Wilks 1995). The Weibull distributions
are given by
f (x)5
�a
b
��x
b
�a21
exp
�2
�x
b
�a�, (1)
where a and b represent the scale and shape parameters. The
shape and scale parameters were calculated inRStudio (https://
rstudio.com/products/rstudio/)—an open-source package that
runs the R Project for Statistical Computing (https://www.r-
project.org/)—using the ‘‘fitdistr’’ formula. Once the scale
and shape parameters were derived, these values were used
with two functions; dweibull, which gives the density, and
pweibull, which was used to calculate the cumulative den-
sity function (CDF). The dweibull formula was used with
the same shape and scale parameters to produce the prob-
ability density functions (PDFs) for each rating level and
F/EF era for the width and length. Finally, cumulative dis-
tribution functions (CDFs) were produced for the width and
the length using pweibull. The same shape and scale pa-
rameters were used for each level (F/EF0, F/EF1, F/EF2,
and F/EF31).
3. Analytic results and interpretations
We assessed the filtered tornado data based on the following
variables native to ONETOR: F or EF rating, pathlength,
maximum path width, tornadic start time, deaths, and injuries.
A derived, nonlinear composite parameter was used also: de-
struction potential index (DPI; Thompson and Vescio 1998;
Doswell et al. 2006), which simply multiplies pathlength,
path width, and the F or EF rating plus one (to eliminate
multiples of zero). DPI has been used both as an individual
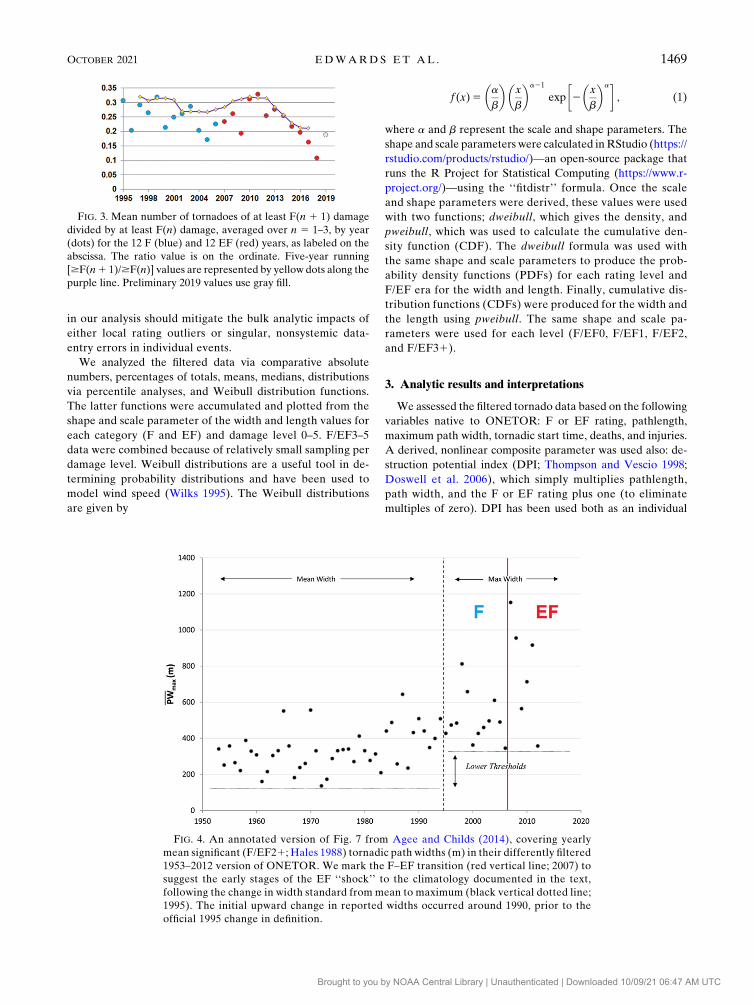
FIG. 3. Mean number of tornadoes of at least F(n 1 1) damage
divided by at least F(n) damage, averaged over n 5 1–3, by year
(dots) for the 12 F (blue) and 12 EF (red) years, as labeled on the
abscissa. The ratio value is on the ordinate. Five-year running
[$F(n1 1)/$F(n)] values are represented by yellow dots along the
purple line. Preliminary 2019 values use gray fill.
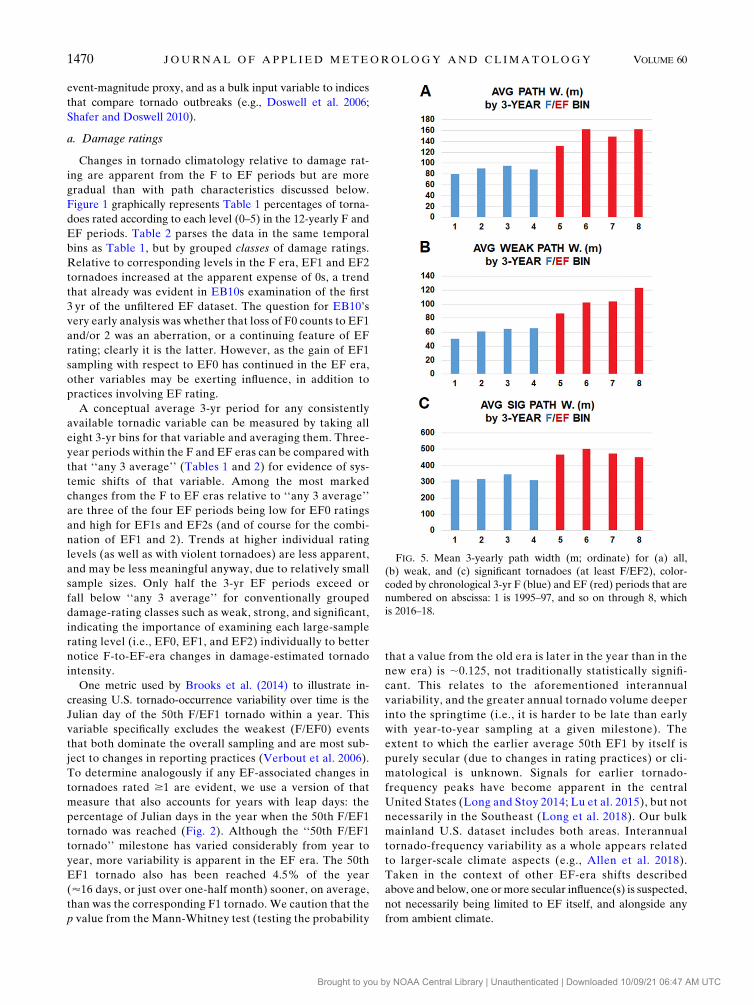
FIG. 4. An annotated version of Fig. 7 from Agee and Childs (2014), covering yearly
mean significant (F/EF21; Hales 1988) tornadic path widths (m) in their differently filtered
1953–2012 version of ONETOR. We mark the F–EF transition (red vertical line; 2007) to
suggest the early stages of the EF ‘‘shock’’ to the climatology documented in the text,
following the change in width standard from mean to maximum (black vertical dotted line;
1995). The initial upward change in reported widths occurred around 1990, prior to the
official 1995 change in definition.
OCTOBER 2021 EDWARDS ET AL . 1469
Brought to you by NOAA Central Library | Unauthenticated | Downloaded 10/09/21 06:47 AM UTC
event-magnitude proxy, and as a bulk input variable to indices
that compare tornado outbreaks (e.g., Doswell et al. 2006;
Shafer and Doswell 2010).
a. Damage ratings
Changes in tornado climatology relative to damage rat-
ing are apparent from the F to EF periods but are more
gradual than with path characteristics discussed below.
Figure 1 graphically represents Table 1 percentages of torna-
does rated according to each level (0–5) in the 12-yearly F and
EF periods. Table 2 parses the data in the same temporal
bins as Table 1, but by grouped classes of damage ratings.
Relative to corresponding levels in the F era, EF1 and EF2
tornadoes increased at the apparent expense of 0s, a trend
that already was evident in EB10s examination of the first
3 yr of the unfiltered EF dataset. The question for EB10’s
very early analysis was whether that loss of F0 counts to EF1
and/or 2 was an aberration, or a continuing feature of EF
rating; clearly it is the latter. However, as the gain of EF1
sampling with respect to EF0 has continued in the EF era,
other variables may be exerting influence, in addition to
practices involving EF rating.
A conceptual average 3-yr period for any consistently
available tornadic variable can be measured by taking all
eight 3-yr bins for that variable and averaging them. Three-
year periods within the F and EF eras can be compared with
that ‘‘any 3 average’’ (Tables 1 and 2) for evidence of sys-
temic shifts of that variable. Among the most marked
changes from the F to EF eras relative to ‘‘any 3 average’’
are three of the four EF periods being low for EF0 ratings
and high for EF1s and EF2s (and of course for the combi-
nation of EF1 and 2). Trends at higher individual rating
levels (as well as with violent tornadoes) are less apparent,
and may be less meaningful anyway, due to relatively small
sample sizes. Only half the 3-yr EF periods exceed or
fall below ‘‘any 3 average’’ for conventionally grouped
damage-rating classes such as weak, strong, and significant,
indicating the importance of examining each large-sample
rating level (i.e., EF0, EF1, and EF2) individually to better
notice F-to-EF-era changes in damage-estimated tornado
intensity.
One metric used by Brooks et al. (2014) to illustrate in-
creasing U.S. tornado-occurrence variability over time is the
Julian day of the 50th F/EF1 tornado within a year. This
variable specifically excludes the weakest (F/EF0) events
that both dominate the overall sampling and are most sub-
ject to changes in reporting practices (Verbout et al. 2006).
To determine analogously if any EF-associated changes in
tornadoes rated $1 are evident, we use a version of that
measure that also accounts for years with leap days: the
percentage of Julian days in the year when the 50th F/EF1
tornado was reached (Fig. 2). Although the ‘‘50th F/EF1
tornado’’ milestone has varied considerably from year to
year, more variability is apparent in the EF era. The 50th
EF1 tornado also has been reached 4.5% of the year
(’16 days, or just over one-half month) sooner, on average,
than was the corresponding F1 tornado. We caution that the
p value from the Mann-Whitney test (testing the probability
that a value from the old era is later in the year than in the
new era) is ;0.125, not traditionally statistically signifi-
cant. This relates to the aforementioned interannual
variability, and the greater annual tornado volume deeper
into the springtime (i.e., it is harder to be late than early
with year-to-year sampling at a given milestone). The
extent to which the earlier average 50th EF1 by itself is
purely secular (due to changes in rating practices) or cli-
matological is unknown. Signals for earlier tornado-
frequency peaks have become apparent in the central
United States (Long and Stoy 2014; Lu et al. 2015), but not
necessarily in the Southeast (Long et al. 2018). Our bulk
mainland U.S. dataset includes both areas. Interannual
tornado-frequency variability as a whole appears related
to larger-scale climate aspects (e.g., Allen et al. 2018).
Taken in the context of other EF-era shifts described
above and below, one ormore secular influence(s) is suspected,
not necessarily being limited to EF itself, and alongside any
from ambient climate.
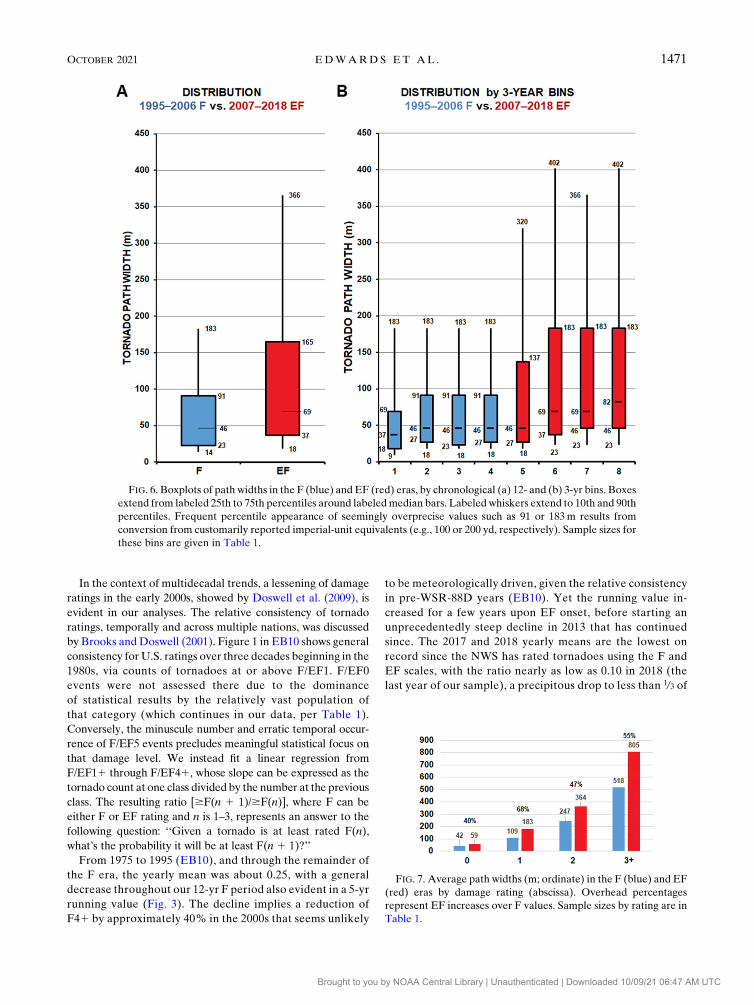
FIG. 5. Mean 3-yearly path width (m; ordinate) for (a) all,
(b) weak, and (c) significant tornadoes (at least F/EF2), color-
coded by chronological 3-yr F (blue) and EF (red) periods that are
numbered on abscissa: 1 is 1995–97, and so on through 8, which
is 2016–18.
1470 JOURNAL OF APPL IED METEOROLOGY AND CL IMATOLOGY VOLUME 60
Brought to you by NOAA Central Library | Unauthenticated | Downloaded 10/09/21 06:47 AM UTC
In the context of multidecadal trends, a lessening of damage
ratings in the early 2000s, showed by Doswell et al. (2009), is
evident in our analyses. The relative consistency of tornado
ratings, temporally and across multiple nations, was discussed
by Brooks andDoswell (2001). Figure 1 in EB10 shows general
consistency forU.S. ratings over three decades beginning in the
1980s, via counts of tornadoes at or above F/EF1. F/EF0
events were not assessed there due to the dominance
of statistical results by the relatively vast population of
that category (which continues in our data, per Table 1).
Conversely, the minuscule number and erratic temporal occur-
rence of F/EF5 events precludes meaningful statistical focus on
that damage level. We instead fit a linear regression from
F/EF11 through F/EF41, whose slope can be expressed as the
tornado count at one class divided by the number at the previous
class. The resulting ratio [$F(n 1 1)/$F(n)], where F can be
either F or EF rating and n is 1–3, represents an answer to the
following question: ‘‘Given a tornado is at least rated F(n),
what’s the probability it will be at least F(n 1 1)?’’
From 1975 to 1995 (EB10), and through the remainder of
the F era, the yearly mean was about 0.25, with a general
decrease throughout our 12-yr F period also evident in a 5-yr
running value (Fig. 3). The decline implies a reduction of
F41 by approximately 40% in the 2000s that seems unlikely
to be meteorologically driven, given the relative consistency
in pre-WSR-88D years (EB10). Yet the running value in-
creased for a few years upon EF onset, before starting an
unprecedentedly steep decline in 2013 that has continued
since. The 2017 and 2018 yearly means are the lowest on
record since the NWS has rated tornadoes using the F and
EF scales, with the ratio nearly as low as 0.10 in 2018 (the
last year of our sample), a precipitous drop to less than 1/3 of
FIG. 6. Boxplots of path widths in the F (blue) and EF (red) eras, by chronological (a) 12- and (b) 3-yr bins. Boxes
extend from labeled 25th to 75th percentiles around labeledmedian bars. Labeled whiskers extend to 10th and 90th
percentiles. Frequent percentile appearance of seemingly overprecise values such as 91 or 183m results from
conversion from customarily reported imperial-unit equivalents (e.g., 100 or 200 yd, respectively). Sample sizes for
these bins are given in Table 1.
FIG. 7. Average path widths (m; ordinate) in the F (blue) and EF
(red) eras by damage rating (abscissa). Overhead percentages
represent EF increases over F values. Sample sizes by rating are in
Table 1.
OCTOBER 2021 EDWARDS ET AL . 1471
Brought to you by NOAA Central Library | Unauthenticated | Downloaded 10/09/21 06:47 AM UTC
the peak value in the historically upper-echelon (Doswell
et al. 2012) tornado year of 2011.1
Factors contributing to this relative decline are unclear,
and a matter of speculation, given the lack of metadata
noted above. Still, the trend indicates strong bulk secular
influence on damage ratings that is temporally coincident
with nationwide retrofitting of dual-polarization capabil-
ities to the WSR-88D network—specifically, the ability to
detect tornadic debris signatures (TDSs; Ryzhkov et al.
2005), whose plume characteristics have been related sta-
tistically to damage rating (Bodine et al. 2013). The extent
to which TDSs may influence subsequent rating is undocu-
mented, and no causal linkage is either quantifiable or
posited here. Still, at a minimum, TDS appearance invokes
near-certainty of a tornado in real-time operations, reveals
target areas for damage surveys, and offers presurvey
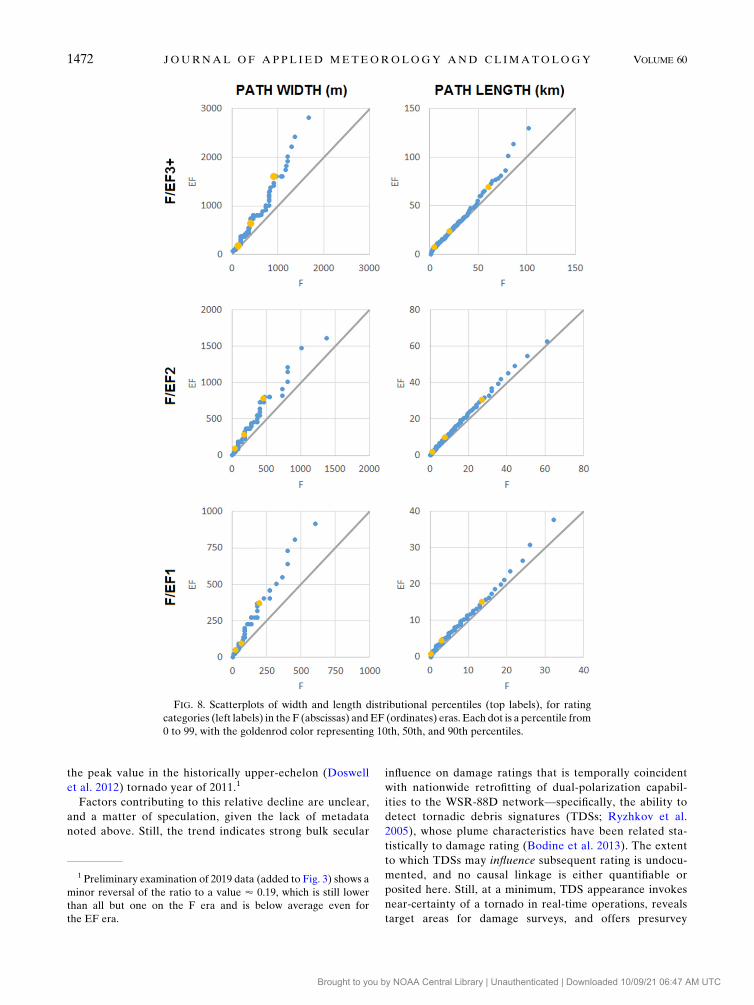
FIG. 8. Scatterplots of width and length distributional percentiles (top labels), for rating
categories (left labels) in the F (abscissas) andEF (ordinates) eras. Each dot is a percentile from
0 to 99, with the goldenrod color representing 10th, 50th, and 90th percentiles.
1 Preliminary examination of 2019 data (added to Fig. 3) shows a
minor reversal of the ratio to a value ’ 0.19, which is still lower
than all but one on the F era and is below average even for
the EF era.
1472 JOURNAL OF APPL IED METEOROLOGY AND CL IMATOLOGY VOLUME 60
Brought to you by NOAA Central Library | Unauthenticated | Downloaded 10/09/21 06:47 AM UTC
information on potential damage intensity, as does opera-
tional recognition of other radar signatures in concert with
environmental parameters (Smith et al. 2015).
b. Path characteristics
1) WIDTH
Following an increase in the WSR-88D era related to the
1995 change to max width (as discussed above), another tran-
sitional jump in path width appeared in the late 2000s
significant-tornado subset of the Agee and Childs (2014) ana-
lyses (Fig. 4). That increase was noticed and described as ‘‘a
recent uptick toward wider tornadoes.’’ However, they did not
associate the phenomenon explicitly with contemporaneous
EF usage.
In our analyses, path widths similarly have increased in
the larger sampling of the EF era for weak (EF0–1) as well
as significant tornadoes. Mean F to EF path width for all
tornadoes increased from 89 to 151 m, a 170% increase.
Though quite strongly apparent when plotting yearly means
(not shown), the 3-yr bins, which smooth away natural year-
to-year variability, reveal that this change also was relatively
sudden, appearing essentially stepwise in character from the
F to EF eras (Fig. 5) across all tornadoes, as well as weak and
significant tornadoes. Within the EF era, weak-tornado path
widths (Fig. 5b) markedly increased again in the last bin
(2016–18), comparable to those from F to EF; their 123-m
average was 241% of that during 1995–97.
Distributions of both 12-yr and 3-yr path-width subsam-
ples (Fig. 6) also illustrate the marked increase in reported
width in the EF era, especially at median and larger values.
Path widths in the EF data skewed upward by about half a
quartile relative to F-scale tornadoes, for the middle quar-
tiles. Though widths increased abruptly across the F to EF
transition, they have enlarged within the EF era also.
Recorded tornado widths for 2016–18 were over twice
those of 1995–97 at every percentile sampled: 10th, 25th,
50th, 75th, and 90th, across similar counts of ’3500 torna-
does. The 90th percentile (whisker tip) value of every 3-yr
F bin—183m (200 yd)—matched the 75th percentile of each
bin in the last 9 yr of the EF data.
Average path widths by rating increased across all bins,
by 40%–68% from F to EF, with the largest percentage growth
in EF1s. Path-width expansion in absolute terms has been
especially pronounced between the F and EF eras for strong
to violent tornadoes, as suggested by Figs. 5c and 7, with
reported widths for EF31 tornadoes nearly 300m larger
than for F31. The widest year for average path of significant
tornadoes (568m) was 2011—the aforementioned, anoma-
lously outbreak-driven year, while the narrowest was 282m
in 1999 (despite already having filtered out an inexplicably
large number of zero-width tornado-entry errors that year,
including 27 that were significant). Strikingly, in none of the
F years sampled did the yearly mean of significant-tornado
widths reach that for the EF year with the narrowest mean of
width (386 m in 2012; not shown).
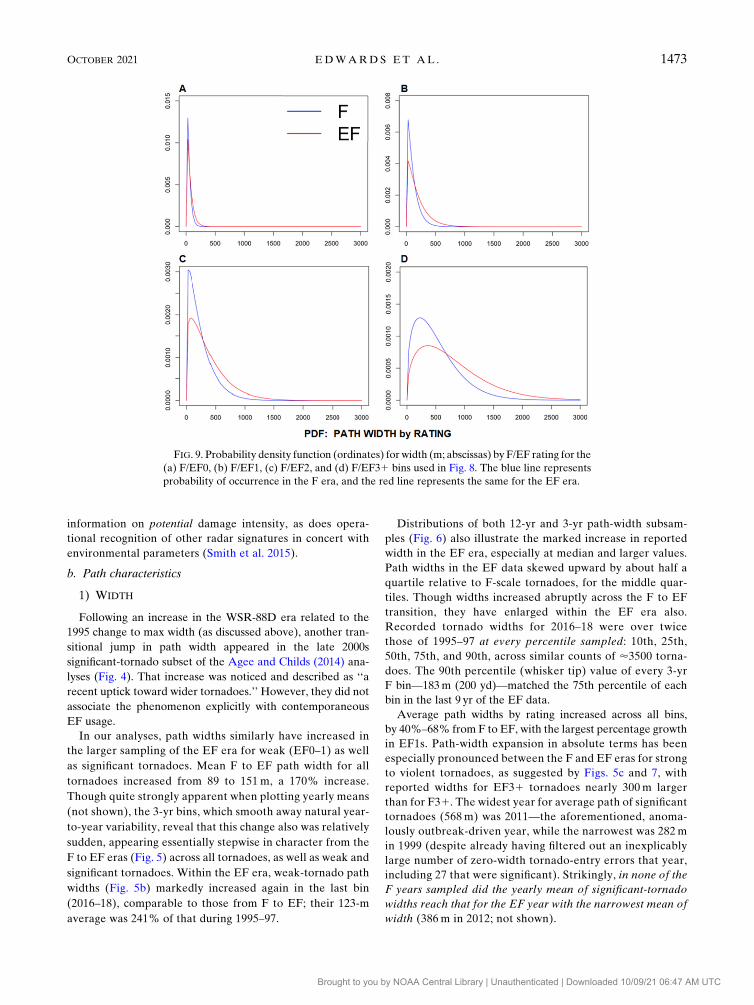
FIG. 9. Probability density function (ordinates) for width (m; abscissas) by F/EF rating for the
(a) F/EF0, (b) F/EF1, (c) F/EF2, and (d) F/EF31 bins used in Fig. 8. The blue line represents
probability of occurrence in the F era, and the red line represents the same for the EF era.
OCTOBER 2021 EDWARDS ET AL . 1473
Brought to you by NOAA Central Library | Unauthenticated | Downloaded 10/09/21 06:47 AM UTC
A comparison of 100 F and EF path-width percentiles for
F/EF31 events (Fig. 8), taken at whole integers, shows that the
EF expansion of recorded tornado width systemically strayed
farther from the ideal ‘‘no change’’ line as percentiles enlarged
and approached 100. Subsampling of the EF era indicates a
marked jump occurred in weak-tornado widths during the final
period, 2016–18 (Fig. 5b), which presently defies evidential
explanation. Monitoring over several more years will be
needed to determine if the 2016–18 weak-width jump is a
‘‘shock’’ within the EF era, or an anomaly confined to that
3-yr period.
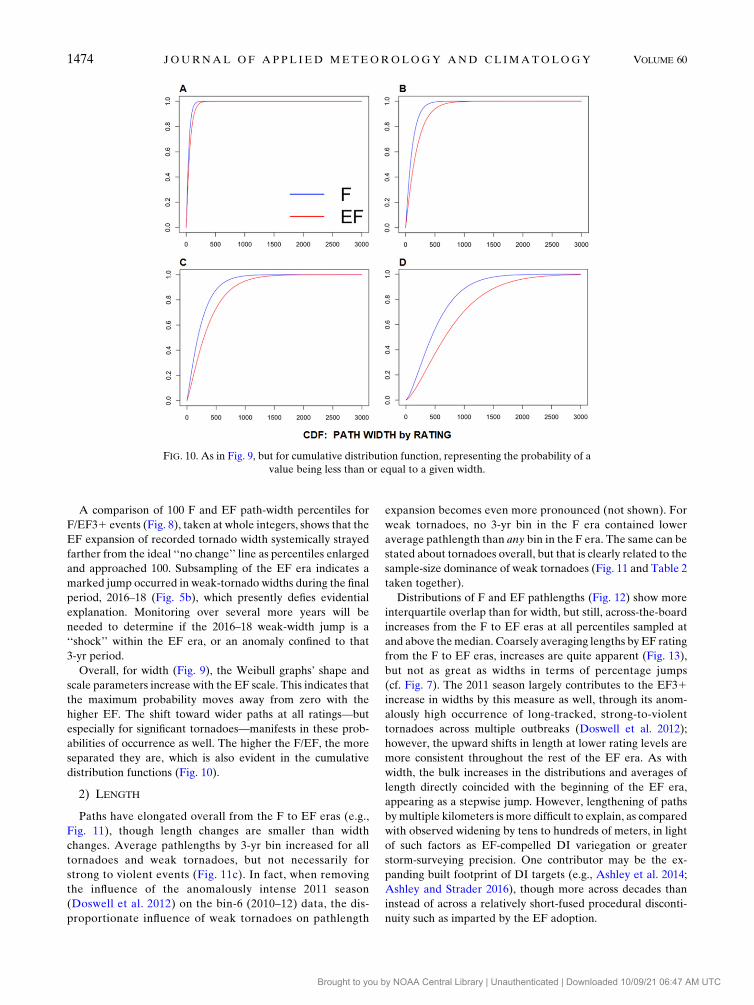
Overall, for width (Fig. 9), the Weibull graphs’ shape and
scale parameters increase with the EF scale. This indicates that
the maximum probability moves away from zero with the
higher EF. The shift toward wider paths at all ratings—but
especially for significant tornadoes—manifests in these prob-
abilities of occurrence as well. The higher the F/EF, the more
separated they are, which is also evident in the cumulative
distribution functions (Fig. 10).
2) LENGTH
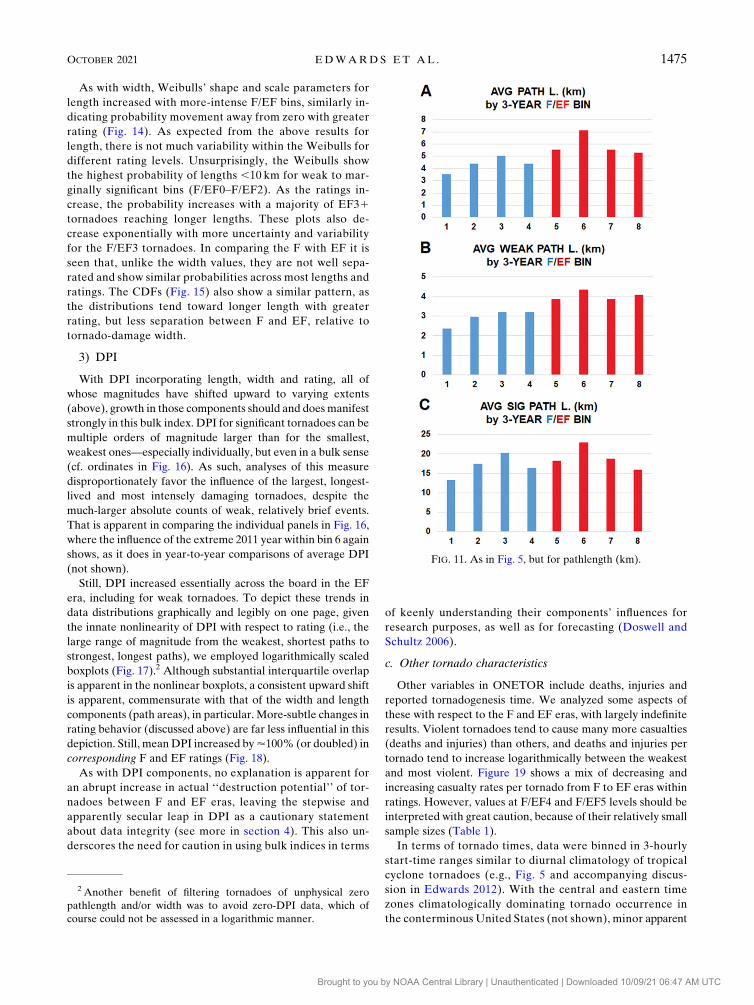
Paths have elongated overall from the F to EF eras (e.g.,
Fig. 11), though length changes are smaller than width
changes. Average pathlengths by 3-yr bin increased for all
tornadoes and weak tornadoes, but not necessarily for
strong to violent events (Fig. 11c). In fact, when removing
the influence of the anomalously intense 2011 season
(Doswell et al. 2012) on the bin-6 (2010–12) data, the dis-
proportionate influence of weak tornadoes on pathlength
expansion becomes even more pronounced (not shown). For
weak tornadoes, no 3-yr bin in the F era contained lower
average pathlength than any bin in the F era. The same can be
stated about tornadoes overall, but that is clearly related to the
sample-size dominance of weak tornadoes (Fig. 11 and Table 2
taken together).
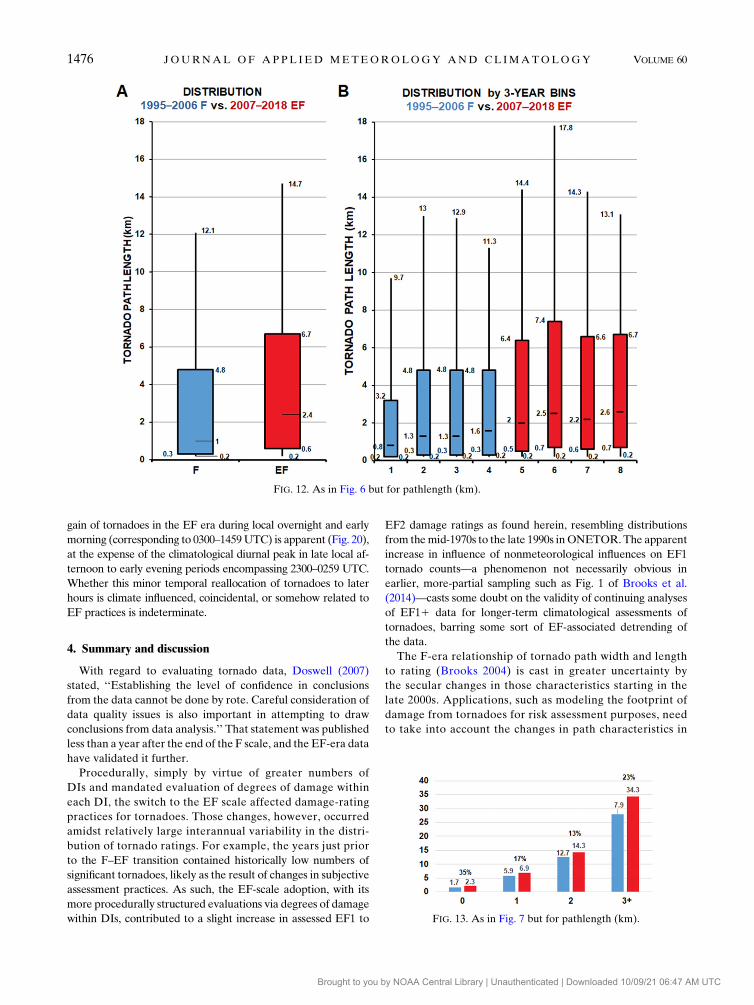
Distributions of F and EF pathlengths (Fig. 12) show more
interquartile overlap than for width, but still, across-the-board
increases from the F to EF eras at all percentiles sampled at
and above themedian. Coarsely averaging lengths by EF rating
from the F to EF eras, increases are quite apparent (Fig. 13),
but not as great as widths in terms of percentage jumps
(cf. Fig. 7). The 2011 season largely contributes to the EF31increase in widths by this measure as well, through its anom-
alously high occurrence of long-tracked, strong-to-violent
tornadoes across multiple outbreaks (Doswell et al. 2012);
however, the upward shifts in length at lower rating levels are
more consistent throughout the rest of the EF era. As with
width, the bulk increases in the distributions and averages of
length directly coincided with the beginning of the EF era,
appearing as a stepwise jump. However, lengthening of paths
by multiple kilometers is more difficult to explain, as compared
with observed widening by tens to hundreds of meters, in light
of such factors as EF-compelled DI variegation or greater
storm-surveying precision. One contributor may be the ex-
panding built footprint of DI targets (e.g., Ashley et al. 2014;
Ashley and Strader 2016), though more across decades than
instead of across a relatively short-fused procedural disconti-
nuity such as imparted by the EF adoption.
FIG. 10. As in Fig. 9, but for cumulative distribution function, representing the probability of a
value being less than or equal to a given width.
1474 JOURNAL OF APPL IED METEOROLOGY AND CL IMATOLOGY VOLUME 60
Brought to you by NOAA Central Library | Unauthenticated | Downloaded 10/09/21 06:47 AM UTC
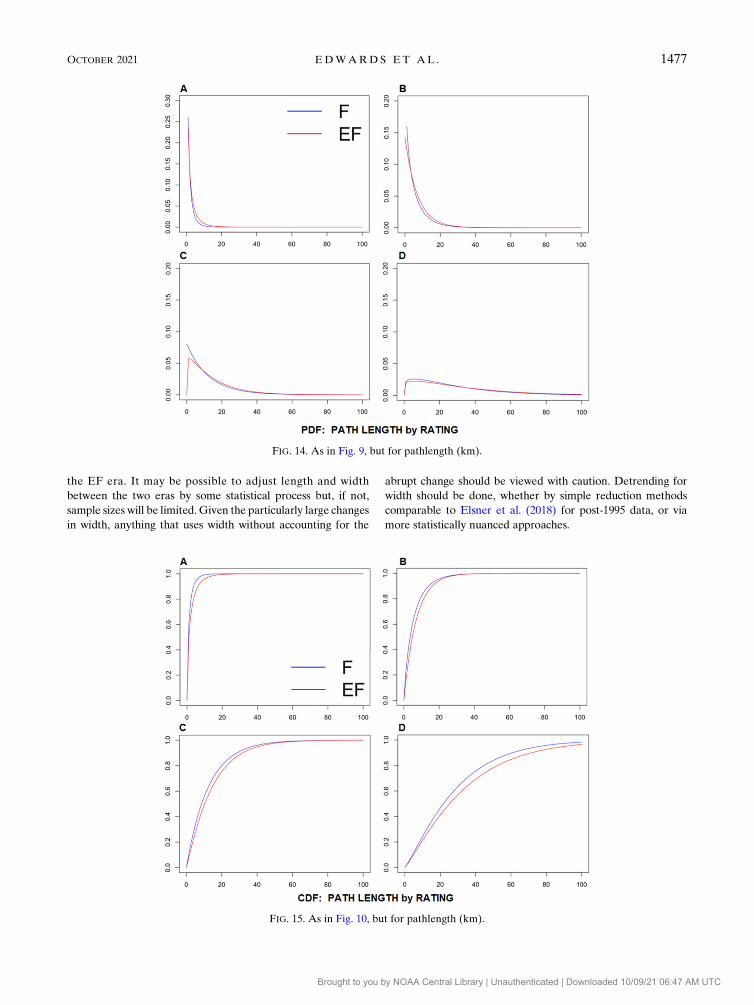
As with width, Weibulls’ shape and scale parameters for
length increased with more-intense F/EF bins, similarly in-
dicating probability movement away from zero with greater
rating (Fig. 14). As expected from the above results for
length, there is not much variability within the Weibulls for
different rating levels. Unsurprisingly, the Weibulls show
the highest probability of lengths ,10 km for weak to mar-
ginally significant bins (F/EF0–F/EF2). As the ratings in-
crease, the probability increases with a majority of EF31tornadoes reaching longer lengths. These plots also de-
crease exponentially with more uncertainty and variability
for the F/EF3 tornadoes. In comparing the F with EF it is
seen that, unlike the width values, they are not well sepa-
rated and show similar probabilities across most lengths and
ratings. The CDFs (Fig. 15) also show a similar pattern, as
the distributions tend toward longer length with greater
rating, but less separation between F and EF, relative to
tornado-damage width.
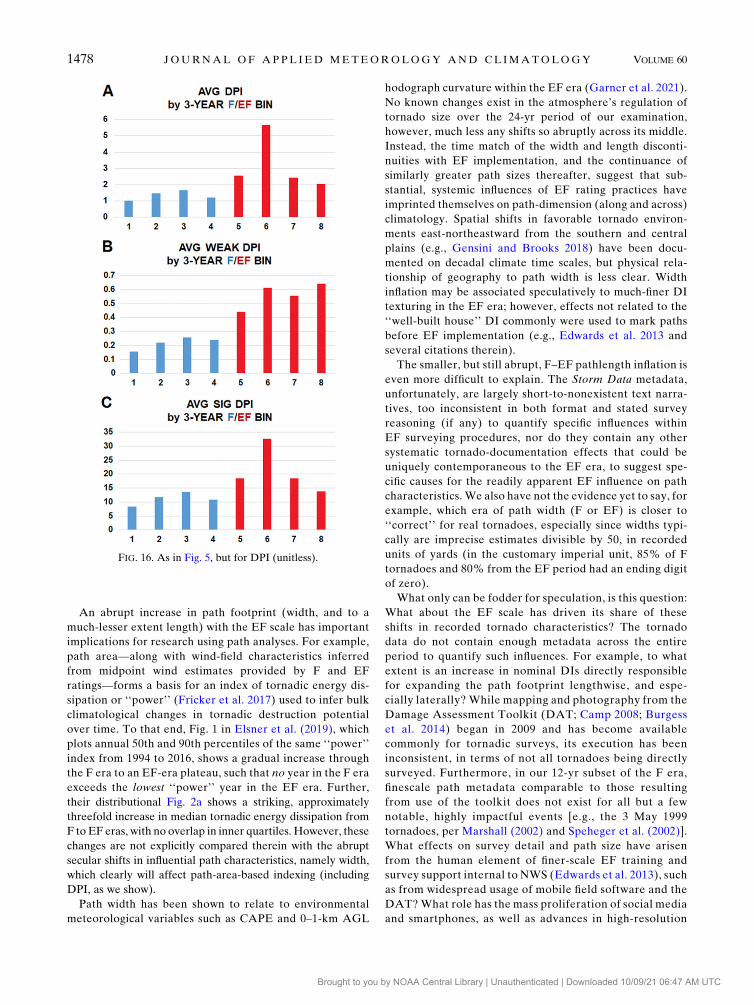
3) DPI
With DPI incorporating length, width and rating, all of
whose magnitudes have shifted upward to varying extents
(above), growth in those components should and does manifest
strongly in this bulk index. DPI for significant tornadoes can be
multiple orders of magnitude larger than for the smallest,
weakest ones—especially individually, but even in a bulk sense
(cf. ordinates in Fig. 16). As such, analyses of this measure
disproportionately favor the influence of the largest, longest-
lived and most intensely damaging tornadoes, despite the
much-larger absolute counts of weak, relatively brief events.
That is apparent in comparing the individual panels in Fig. 16,
where the influence of the extreme 2011 year within bin 6 again
shows, as it does in year-to-year comparisons of average DPI
(not shown).
Still, DPI increased essentially across the board in the EF
era, including for weak tornadoes. To depict these trends in
data distributions graphically and legibly on one page, given
the innate nonlinearity of DPI with respect to rating (i.e., the
large range of magnitude from the weakest, shortest paths to
strongest, longest paths), we employed logarithmically scaled
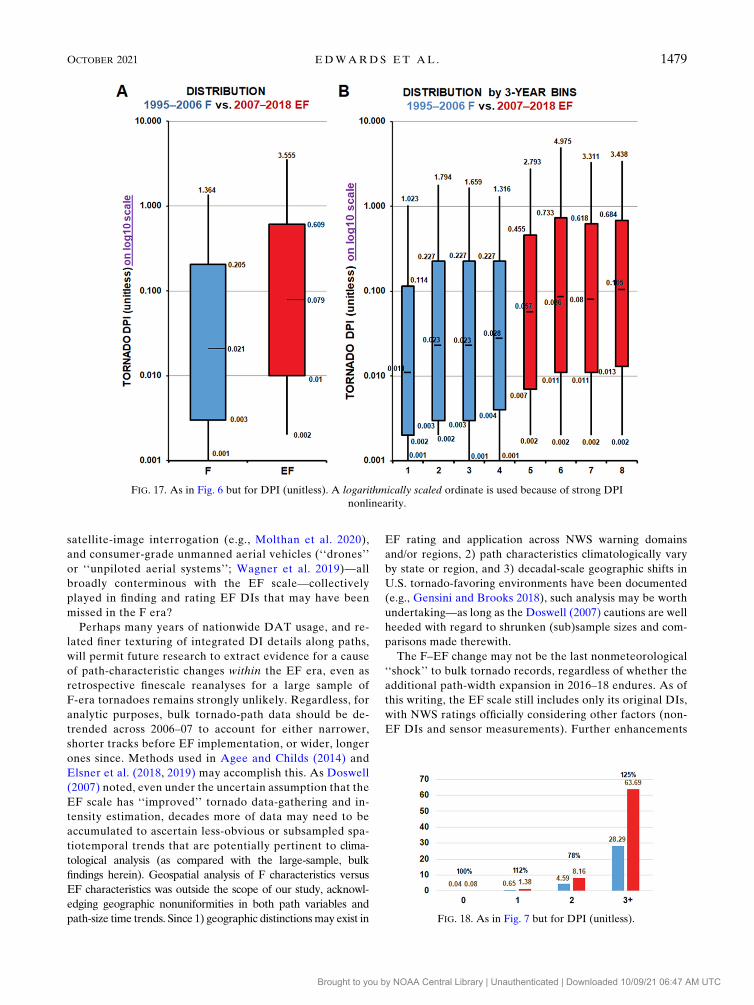
boxplots (Fig. 17).2 Although substantial interquartile overlap
is apparent in the nonlinear boxplots, a consistent upward shift
is apparent, commensurate with that of the width and length
components (path areas), in particular. More-subtle changes in
rating behavior (discussed above) are far less influential in this
depiction. Still, meanDPI increased by’100% (or doubled) in
corresponding F and EF ratings (Fig. 18).
As with DPI components, no explanation is apparent for
an abrupt increase in actual ‘‘destruction potential’’ of tor-
nadoes between F and EF eras, leaving the stepwise and
apparently secular leap in DPI as a cautionary statement
about data integrity (see more in section 4). This also un-
derscores the need for caution in using bulk indices in terms
of keenly understanding their components’ influences for
research purposes, as well as for forecasting (Doswell and
Schultz 2006).
c. Other tornado characteristics
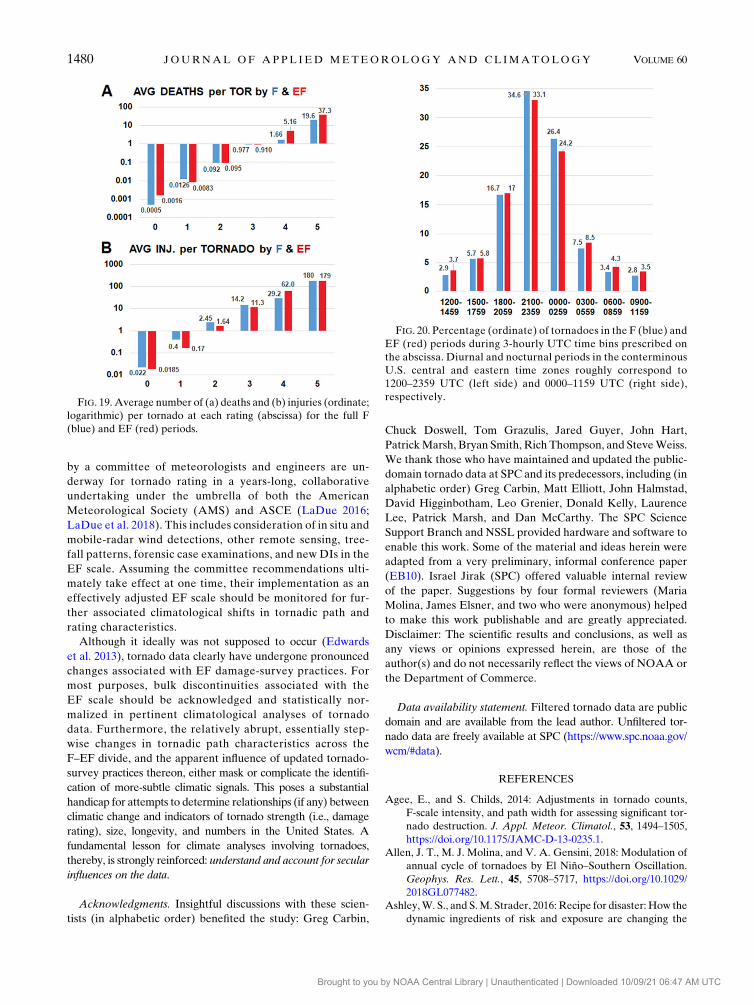
Other variables in ONETOR include deaths, injuries and
reported tornadogenesis time. We analyzed some aspects of
these with respect to the F and EF eras, with largely indefinite
results. Violent tornadoes tend to cause many more casualties
(deaths and injuries) than others, and deaths and injuries per
tornado tend to increase logarithmically between the weakest
and most violent. Figure 19 shows a mix of decreasing and
increasing casualty rates per tornado from F to EF eras within
ratings. However, values at F/EF4 and F/EF5 levels should be
interpreted with great caution, because of their relatively small
sample sizes (Table 1).
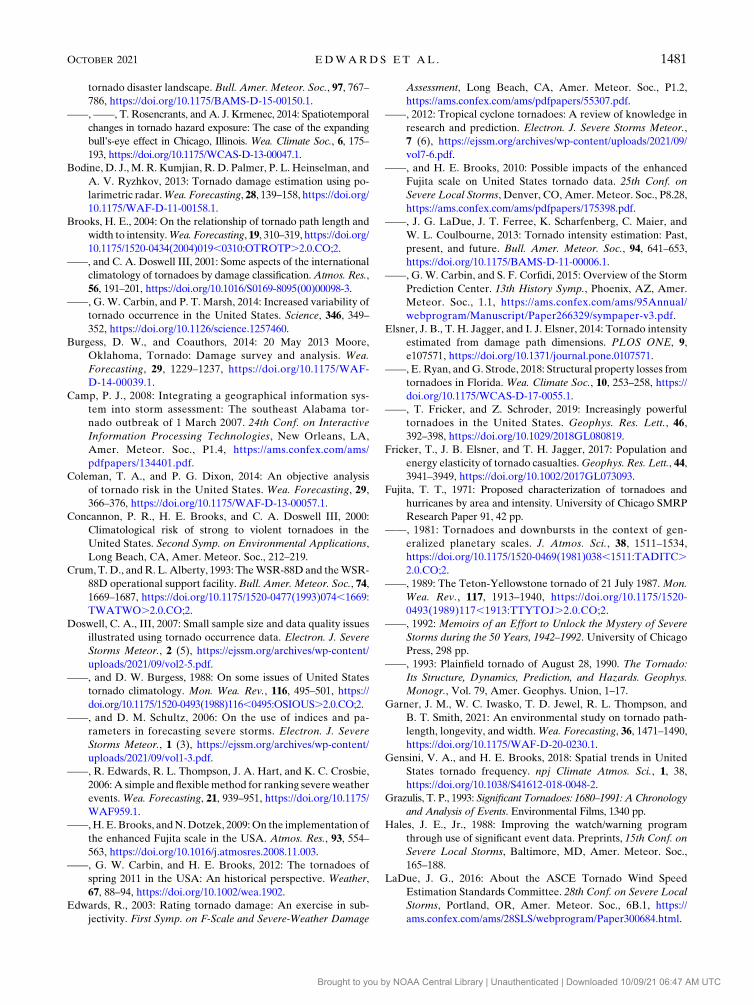
In terms of tornado times, data were binned in 3-hourly
start-time ranges similar to diurnal climatology of tropical
cyclone tornadoes (e.g., Fig. 5 and accompanying discus-
sion in Edwards 2012). With the central and eastern time
zones climatologically dominating tornado occurrence in
the conterminous United States (not shown), minor apparent
FIG. 11. As in Fig. 5, but for pathlength (km).
2 Another benefit of filtering tornadoes of unphysical zero
pathlength and/or width was to avoid zero-DPI data, which of
course could not be assessed in a logarithmic manner.
OCTOBER 2021 EDWARDS ET AL . 1475
Brought to you by NOAA Central Library | Unauthenticated | Downloaded 10/09/21 06:47 AM UTC
gain of tornadoes in the EF era during local overnight and early
morning (corresponding to 0300–1459UTC) is apparent (Fig. 20),
at the expense of the climatological diurnal peak in late local af-
ternoon to early evening periods encompassing 2300–0259 UTC.
Whether this minor temporal reallocation of tornadoes to later
hours is climate influenced, coincidental, or somehow related to
EF practices is indeterminate.
4. Summary and discussion
With regard to evaluating tornado data, Doswell (2007)
stated, ‘‘Establishing the level of confidence in conclusions
from the data cannot be done by rote. Careful consideration of
data quality issues is also important in attempting to draw
conclusions from data analysis.’’ That statement was published
less than a year after the end of the F scale, and the EF-era data
have validated it further.
Procedurally, simply by virtue of greater numbers of
DIs and mandated evaluation of degrees of damage within
each DI, the switch to the EF scale affected damage-rating
practices for tornadoes. Those changes, however, occurred
amidst relatively large interannual variability in the distri-
bution of tornado ratings. For example, the years just prior
to the F–EF transition contained historically low numbers of
significant tornadoes, likely as the result of changes in subjective
assessment practices. As such, the EF-scale adoption, with its
more procedurally structured evaluations via degrees of damage
within DIs, contributed to a slight increase in assessed EF1 to
EF2 damage ratings as found herein, resembling distributions
from themid-1970s to the late 1990s inONETOR.The apparent
increase in influence of nonmeteorological influences on EF1
tornado counts—a phenomenon not necessarily obvious in
earlier, more-partial sampling such as Fig. 1 of Brooks et al.
(2014)—casts some doubt on the validity of continuing analyses
of EF11 data for longer-term climatological assessments of
tornadoes, barring some sort of EF-associated detrending of
the data.
The F-era relationship of tornado path width and length
to rating (Brooks 2004) is cast in greater uncertainty by
the secular changes in those characteristics starting in the
late 2000s. Applications, such as modeling the footprint of
damage from tornadoes for risk assessment purposes, need
to take into account the changes in path characteristics in
FIG. 12. As in Fig. 6 but for pathlength (km).
FIG. 13. As in Fig. 7 but for pathlength (km).
1476 JOURNAL OF APPL IED METEOROLOGY AND CL IMATOLOGY VOLUME 60
Brought to you by NOAA Central Library | Unauthenticated | Downloaded 10/09/21 06:47 AM UTC
the EF era. It may be possible to adjust length and width
between the two eras by some statistical process but, if not,
sample sizes will be limited. Given the particularly large changes
in width, anything that uses width without accounting for the
abrupt change should be viewed with caution. Detrending for
width should be done, whether by simple reduction methods
comparable to Elsner et al. (2018) for post-1995 data, or via
more statistically nuanced approaches.
FIG. 14. As in Fig. 9, but for pathlength (km).
FIG. 15. As in Fig. 10, but for pathlength (km).
OCTOBER 2021 EDWARDS ET AL . 1477
Brought to you by NOAA Central Library | Unauthenticated | Downloaded 10/09/21 06:47 AM UTC
An abrupt increase in path footprint (width, and to a
much-lesser extent length) with the EF scale has important
implications for research using path analyses. For example,
path area—along with wind-field characteristics inferred
from midpoint wind estimates provided by F and EF
ratings—forms a basis for an index of tornadic energy dis-
sipation or ‘‘power’’ (Fricker et al. 2017) used to infer bulk
climatological changes in tornadic destruction potential
over time. To that end, Fig. 1 in Elsner et al. (2019), which
plots annual 50th and 90th percentiles of the same ‘‘power’’
index from 1994 to 2016, shows a gradual increase through
the F era to an EF-era plateau, such that no year in the F era
exceeds the lowest ‘‘power’’ year in the EF era. Further,
their distributional Fig. 2a shows a striking, approximately
threefold increase in median tornadic energy dissipation from
F to EF eras, with no overlap in inner quartiles. However, these
changes are not explicitly compared therein with the abrupt
secular shifts in influential path characteristics, namely width,
which clearly will affect path-area-based indexing (including
DPI, as we show).
Path width has been shown to relate to environmental
meteorological variables such as CAPE and 0–1-km AGL
hodograph curvature within the EF era (Garner et al. 2021).
No known changes exist in the atmosphere’s regulation of
tornado size over the 24-yr period of our examination,
however, much less any shifts so abruptly across its middle.
Instead, the time match of the width and length disconti-
nuities with EF implementation, and the continuance of
similarly greater path sizes thereafter, suggest that sub-
stantial, systemic influences of EF rating practices have
imprinted themselves on path-dimension (along and across)
climatology. Spatial shifts in favorable tornado environ-
ments east-northeastward from the southern and central
plains (e.g., Gensini and Brooks 2018) have been docu-
mented on decadal climate time scales, but physical rela-
tionship of geography to path width is less clear. Width
inflation may be associated speculatively to much-finer DI
texturing in the EF era; however, effects not related to the
‘‘well-built house’’ DI commonly were used to mark paths
before EF implementation (e.g., Edwards et al. 2013 and
several citations therein).
The smaller, but still abrupt, F–EF pathlength inflation is
even more difficult to explain. The Storm Data metadata,
unfortunately, are largely short-to-nonexistent text narra-
tives, too inconsistent in both format and stated survey
reasoning (if any) to quantify specific influences within
EF surveying procedures, nor do they contain any other
systematic tornado-documentation effects that could be
uniquely contemporaneous to the EF era, to suggest spe-
cific causes for the readily apparent EF influence on path
characteristics. We also have not the evidence yet to say, for
example, which era of path width (F or EF) is closer to
‘‘correct’’ for real tornadoes, especially since widths typi-
cally are imprecise estimates divisible by 50, in recorded
units of yards (in the customary imperial unit, 85% of F
tornadoes and 80% from the EF period had an ending digit
of zero).
What only can be fodder for speculation, is this question:
What about the EF scale has driven its share of these
shifts in recorded tornado characteristics? The tornado
data do not contain enough metadata across the entire
period to quantify such influences. For example, to what
extent is an increase in nominal DIs directly responsible
for expanding the path footprint lengthwise, and espe-
cially laterally? While mapping and photography from the
Damage Assessment Toolkit (DAT; Camp 2008; Burgess
et al. 2014) began in 2009 and has become available
commonly for tornadic surveys, its execution has been
inconsistent, in terms of not all tornadoes being directly
surveyed. Furthermore, in our 12-yr subset of the F era,
finescale path metadata comparable to those resulting
from use of the toolkit does not exist for all but a few
notable, highly impactful events [e.g., the 3 May 1999
tornadoes, per Marshall (2002) and Speheger et al. (2002)].
What effects on survey detail and path size have arisen
from the human element of finer-scale EF training and
survey support internal to NWS (Edwards et al. 2013), such
as from widespread usage of mobile field software and the
DAT?What role has the mass proliferation of social media
and smartphones, as well as advances in high-resolution
FIG. 16. As in Fig. 5, but for DPI (unitless).
1478 JOURNAL OF APPL IED METEOROLOGY AND CL IMATOLOGY VOLUME 60
Brought to you by NOAA Central Library | Unauthenticated | Downloaded 10/09/21 06:47 AM UTC
satellite-image interrogation (e.g., Molthan et al. 2020),
and consumer-grade unmanned aerial vehicles (‘‘drones’’
or ‘‘unpiloted aerial systems’’; Wagner et al. 2019)—all
broadly conterminous with the EF scale—collectively
played in finding and rating EF DIs that may have been
missed in the F era?
Perhaps many years of nationwide DAT usage, and re-
lated finer texturing of integrated DI details along paths,
will permit future research to extract evidence for a cause
of path-characteristic changes within the EF era, even as
retrospective finescale reanalyses for a large sample of
F-era tornadoes remains strongly unlikely. Regardless, for
analytic purposes, bulk tornado-path data should be de-
trended across 2006–07 to account for either narrower,
shorter tracks before EF implementation, or wider, longer
ones since. Methods used in Agee and Childs (2014) and
Elsner et al. (2018, 2019) may accomplish this. As Doswell
(2007) noted, even under the uncertain assumption that the
EF scale has ‘‘improved’’ tornado data-gathering and in-
tensity estimation, decades more of data may need to be
accumulated to ascertain less-obvious or subsampled spa-
tiotemporal trends that are potentially pertinent to clima-
tological analysis (as compared with the large-sample, bulk
findings herein). Geospatial analysis of F characteristics versus
EF characteristics was outside the scope of our study, acknowl-
edging geographic nonuniformities in both path variables and
path-size time trends. Since 1) geographic distinctionsmay exist in
EF rating and application across NWS warning domains
and/or regions, 2) path characteristics climatologically vary
by state or region, and 3) decadal-scale geographic shifts in
U.S. tornado-favoring environments have been documented
(e.g., Gensini and Brooks 2018), such analysis may be worth
undertaking—as long as the Doswell (2007) cautions are well
heeded with regard to shrunken (sub)sample sizes and com-
parisons made therewith.
The F–EF change may not be the last nonmeteorological
‘‘shock’’ to bulk tornado records, regardless of whether the
additional path-width expansion in 2016–18 endures. As of
this writing, the EF scale still includes only its original DIs,
with NWS ratings officially considering other factors (non-
EF DIs and sensor measurements). Further enhancements
FIG. 17. As in Fig. 6 but for DPI (unitless). A logarithmically scaled ordinate is used because of strong DPI
nonlinearity.
FIG. 18. As in Fig. 7 but for DPI (unitless).
OCTOBER 2021 EDWARDS ET AL . 1479
Brought to you by NOAA Central Library | Unauthenticated | Downloaded 10/09/21 06:47 AM UTC
by a committee of meteorologists and engineers are un-
derway for tornado rating in a years-long, collaborative
undertaking under the umbrella of both the American
Meteorological Society (AMS) and ASCE (LaDue 2016;
LaDue et al. 2018). This includes consideration of in situ and
mobile-radar wind detections, other remote sensing, tree-
fall patterns, forensic case examinations, and new DIs in the
EF scale. Assuming the committee recommendations ulti-
mately take effect at one time, their implementation as an
effectively adjusted EF scale should be monitored for fur-
ther associated climatological shifts in tornadic path and
rating characteristics.
Although it ideally was not supposed to occur (Edwards
et al. 2013), tornado data clearly have undergone pronounced
changes associated with EF damage-survey practices. For
most purposes, bulk discontinuities associated with the
EF scale should be acknowledged and statistically nor-
malized in pertinent climatological analyses of tornado
data. Furthermore, the relatively abrupt, essentially step-
wise changes in tornadic path characteristics across the
F–EF divide, and the apparent influence of updated tornado-
survey practices thereon, either mask or complicate the identifi-
cation of more-subtle climatic signals. This poses a substantial
handicap for attempts to determine relationships (if any) between
climatic change and indicators of tornado strength (i.e., damage
rating), size, longevity, and numbers in the United States. A
fundamental lesson for climate analyses involving tornadoes,
thereby, is strongly reinforced: understand and account for secular
influences on the data.
Acknowledgments. Insightful discussions with these scien-
tists (in alphabetic order) benefited the study: Greg Carbin,
Chuck Doswell, Tom Grazulis, Jared Guyer, John Hart,
PatrickMarsh, Bryan Smith, Rich Thompson, and SteveWeiss.
We thank those who have maintained and updated the public-
domain tornado data at SPC and its predecessors, including (in
alphabetic order) Greg Carbin, Matt Elliott, John Halmstad,
David Higginbotham, Leo Grenier, Donald Kelly, Laurence
Lee, Patrick Marsh, and Dan McCarthy. The SPC Science
Support Branch and NSSL provided hardware and software to
enable this work. Some of the material and ideas herein were
adapted from a very preliminary, informal conference paper
(EB10). Israel Jirak (SPC) offered valuable internal review
of the paper. Suggestions by four formal reviewers (Maria
Molina, James Elsner, and two who were anonymous) helped
to make this work publishable and are greatly appreciated.
Disclaimer: The scientific results and conclusions, as well as
any views or opinions expressed herein, are those of the
author(s) and do not necessarily reflect the views of NOAA or
the Department of Commerce.
Data availability statement. Filtered tornado data are public
domain and are available from the lead author. Unfiltered tor-
nado data are freely available at SPC (https://www.spc.noaa.gov/
wcm/#data).
REFERENCES
Agee, E., and S. Childs, 2014: Adjustments in tornado counts,
F-scale intensity, and path width for assessing significant tor-
nado destruction. J. Appl. Meteor. Climatol., 53, 1494–1505,
https://doi.org/10.1175/JAMC-D-13-0235.1.
Allen, J. T., M. J. Molina, and V. A. Gensini, 2018: Modulation of
annual cycle of tornadoes by El Niño–Southern Oscillation.
Geophys. Res. Lett., 45, 5708–5717, https://doi.org/10.1029/
2018GL077482.
Ashley,W. S., and S.M. Strader, 2016: Recipe for disaster: How the
dynamic ingredients of risk and exposure are changing the
FIG. 20. Percentage (ordinate) of tornadoes in the F (blue) and
EF (red) periods during 3-hourly UTC time bins prescribed on
the abscissa. Diurnal and nocturnal periods in the conterminous
U.S. central and eastern time zones roughly correspond to
1200–2359 UTC (left side) and 0000–1159 UTC (right side),
respectively.FIG. 19. Average number of (a) deaths and (b) injuries (ordinate;
logarithmic) per tornado at each rating (abscissa) for the full F
(blue) and EF (red) periods.
1480 JOURNAL OF APPL IED METEOROLOGY AND CL IMATOLOGY VOLUME 60
Brought to you by NOAA Central Library | Unauthenticated | Downloaded 10/09/21 06:47 AM UTC
tornado disaster landscape. Bull. Amer. Meteor. Soc., 97, 767–
786, https://doi.org/10.1175/BAMS-D-15-00150.1.
——,——, T. Rosencrants, and A. J. Krmenec, 2014: Spatiotemporal
changes in tornado hazard exposure: The case of the expanding
bull’s-eye effect in Chicago, Illinois. Wea. Climate Soc., 6, 175–
193, https://doi.org/10.1175/WCAS-D-13-00047.1.
Bodine, D. J., M. R. Kumjian, R. D. Palmer, P. L. Heinselman, and
A. V. Ryzhkov, 2013: Tornado damage estimation using po-
larimetric radar.Wea. Forecasting, 28, 139–158, https://doi.org/
10.1175/WAF-D-11-00158.1.
Brooks, H. E., 2004: On the relationship of tornado path length and
width to intensity.Wea. Forecasting, 19, 310–319, https://doi.org/
10.1175/1520-0434(2004)019,0310:OTROTP.2.0.CO;2.
——, and C. A. Doswell III, 2001: Some aspects of the international
climatology of tornadoes by damage classification.Atmos. Res.,
56, 191–201, https://doi.org/10.1016/S0169-8095(00)00098-3.
——, G. W. Carbin, and P. T. Marsh, 2014: Increased variability of
tornado occurrence in the United States. Science, 346, 349–
352, https://doi.org/10.1126/science.1257460.
Burgess, D. W., and Coauthors, 2014: 20 May 2013 Moore,
Oklahoma, Tornado: Damage survey and analysis. Wea.
Forecasting, 29, 1229–1237, https://doi.org/10.1175/WAF-
D-14-00039.1.
Camp, P. J., 2008: Integrating a geographical information sys-
tem into storm assessment: The southeast Alabama tor-
nado outbreak of 1 March 2007. 24th Conf. on Interactive
Information Processing Technologies, New Orleans, LA,
Amer. Meteor. Soc., P1.4, https://ams.confex.com/ams/
pdfpapers/134401.pdf.
Coleman, T. A., and P. G. Dixon, 2014: An objective analysis
of tornado risk in the United States. Wea. Forecasting, 29,
366–376, https://doi.org/10.1175/WAF-D-13-00057.1.
Concannon, P. R., H. E. Brooks, and C. A. Doswell III, 2000:
Climatological risk of strong to violent tornadoes in the
United States. Second Symp. on Environmental Applications,
Long Beach, CA, Amer. Meteor. Soc., 212–219.
Crum, T. D., andR. L. Alberty, 1993: TheWSR-88Dand theWSR-
88D operational support facility. Bull. Amer. Meteor. Soc., 74,
1669–1687, https://doi.org/10.1175/1520-0477(1993)074,1669:
TWATWO.2.0.CO;2.
Doswell, C. A., III, 2007: Small sample size and data quality issues
illustrated using tornado occurrence data. Electron. J. Severe
Storms Meteor., 2 (5), https://ejssm.org/archives/wp-content/
uploads/2021/09/vol2-5.pdf.
——, and D. W. Burgess, 1988: On some issues of United States
tornado climatology. Mon. Wea. Rev., 116, 495–501, https://
doi.org/10.1175/1520-0493(1988)116,0495:OSIOUS.2.0.CO;2.
——, and D. M. Schultz, 2006: On the use of indices and pa-
rameters in forecasting severe storms. Electron. J. Severe
Storms Meteor., 1 (3), https://ejssm.org/archives/wp-content/
uploads/2021/09/vol1-3.pdf.
——, R. Edwards, R. L. Thompson, J. A. Hart, and K. C. Crosbie,
2006: A simple and flexiblemethod for ranking severe weather
events. Wea. Forecasting, 21, 939–951, https://doi.org/10.1175/
WAF959.1.
——,H. E. Brooks, andN.Dotzek, 2009:On the implementation of
the enhanced Fujita scale in the USA. Atmos. Res., 93, 554–
563, https://doi.org/10.1016/j.atmosres.2008.11.003.
——, G. W. Carbin, and H. E. Brooks, 2012: The tornadoes of
spring 2011 in the USA: An historical perspective. Weather,
67, 88–94, https://doi.org/10.1002/wea.1902.Edwards, R., 2003: Rating tornado damage: An exercise in sub-
jectivity. First Symp. on F-Scale and Severe-Weather Damage
Assessment, Long Beach, CA, Amer. Meteor. Soc., P1.2,
https://ams.confex.com/ams/pdfpapers/55307.pdf.
——, 2012: Tropical cyclone tornadoes: A review of knowledge in
research and prediction. Electron. J. Severe Storms Meteor.,
7 (6), https://ejssm.org/archives/wp-content/uploads/2021/09/
vol7-6.pdf.
——, and H. E. Brooks, 2010: Possible impacts of the enhanced
Fujita scale on United States tornado data. 25th Conf. on
Severe Local Storms, Denver, CO, Amer. Meteor. Soc., P8.28,
https://ams.confex.com/ams/pdfpapers/175398.pdf.
——, J. G. LaDue, J. T. Ferree, K. Scharfenberg, C. Maier, and
W. L. Coulbourne, 2013: Tornado intensity estimation: Past,
present, and future. Bull. Amer. Meteor. Soc., 94, 641–653,
https://doi.org/10.1175/BAMS-D-11-00006.1.
——, G. W. Carbin, and S. F. Corfidi, 2015: Overview of the Storm
Prediction Center. 13th History Symp., Phoenix, AZ, Amer.
Meteor. Soc., 1.1, https://ams.confex.com/ams/95Annual/
webprogram/Manuscript/Paper266329/sympaper-v3.pdf.
Elsner, J. B., T. H. Jagger, and I. J. Elsner, 2014: Tornado intensity
estimated from damage path dimensions. PLOS ONE, 9,
e107571, https://doi.org/10.1371/journal.pone.0107571.
——, E. Ryan, andG. Strode, 2018: Structural property losses from
tornadoes in Florida. Wea. Climate Soc., 10, 253–258, https://
doi.org/10.1175/WCAS-D-17-0055.1.
——, T. Fricker, and Z. Schroder, 2019: Increasingly powerful
tornadoes in the United States. Geophys. Res. Lett., 46,
392–398, https://doi.org/10.1029/2018GL080819.
Fricker, T., J. B. Elsner, and T. H. Jagger, 2017: Population and
energy elasticity of tornado casualties.Geophys. Res. Lett., 44,
3941–3949, https://doi.org/10.1002/2017GL073093.
Fujita, T. T., 1971: Proposed characterization of tornadoes and
hurricanes by area and intensity. University of Chicago SMRP
Research Paper 91, 42 pp.
——, 1981: Tornadoes and downbursts in the context of gen-
eralized planetary scales. J. Atmos. Sci., 38, 1511–1534,
https://doi.org/10.1175/1520-0469(1981)038,1511:TADITC.2.0.CO;2.
——, 1989: The Teton-Yellowstone tornado of 21 July 1987. Mon.
Wea. Rev., 117, 1913–1940, https://doi.org/10.1175/1520-
0493(1989)117,1913:TTYTOJ.2.0.CO;2.
——, 1992: Memoirs of an Effort to Unlock the Mystery of Severe
Storms during the 50 Years, 1942–1992. University of Chicago
Press, 298 pp.
——, 1993: Plainfield tornado of August 28, 1990. The Tornado:
Its Structure, Dynamics, Prediction, and Hazards. Geophys.
Monogr., Vol. 79, Amer. Geophys. Union, 1–17.
Garner, J. M., W. C. Iwasko, T. D. Jewel, R. L. Thompson, and
B. T. Smith, 2021: An environmental study on tornado path-
length, longevity, and width.Wea. Forecasting, 36, 1471–1490,
https://doi.org/10.1175/WAF-D-20-0230.1.
Gensini, V. A., and H. E. Brooks, 2018: Spatial trends in United
States tornado frequency. npj Climate Atmos. Sci., 1, 38,
https://doi.org/10.1038/S41612-018-0048-2.
Grazulis, T. P., 1993: Significant Tornadoes: 1680–1991: A Chronology
and Analysis of Events. Environmental Films, 1340 pp.
Hales, J. E., Jr., 1988: Improving the watch/warning program
through use of significant event data. Preprints, 15th Conf. on
Severe Local Storms, Baltimore, MD, Amer. Meteor. Soc.,
165–188.
LaDue, J. G., 2016: About the ASCE Tornado Wind Speed
Estimation Standards Committee. 28th Conf. on Severe Local
Storms, Portland, OR, Amer. Meteor. Soc., 6B.1, https://
ams.confex.com/ams/28SLS/webprogram/Paper300684.html.
OCTOBER 2021 EDWARDS ET AL . 1481
Brought to you by NOAA Central Library | Unauthenticated | Downloaded 10/09/21 06:47 AM UTC
——, and K. Ortega, 2008: Experiences in using the EF-scale since
its inception. Preprints, 24th Conf. on Severe Local Storms,
Savannah,GA,Amer.Meteor. Soc., 8B.6, https://ams.confex.com/
ams/pdfpapers/142166.pdf.
——, J. Wurman, M. Levitan, F. T. Lombardo, C. D. Karstens,
J. Robinson, and W. Coulbourne, 2018: Advances in develop-
ment of the ASCE/SEI/AMS standard for wind speed estima-
tion in tornadoes and other windstorms. 29th Conf. on Severe
Local Storms, Stowe, VT, Amer. Meteor. Soc., 29, https://
ams.confex.com/ams/29SLS/webprogram/Paper348726.html.
Long, J. A., and P. C. Stoy, 2014: Peak tornado activity is occurring
earlier in the heart of ‘‘Tornado Alley.’’ Geophys. Res. Lett.,
41, 6259–6264, https://doi.org/10.1002/2014GL061385.
——, ——, and T. Gerken, 2018: Tornado seasonality in the
southeasternUnited States.Wea. Climate Extremes, 20, 81–91,https://doi.org/10.1016/j.wace.2018.03.002.
Lu, M., M. Tippett, and U. Lall, 2015: Changes in the seasonality of
tornado and favorable genesis conditions in the central United
States. Geophys. Res. Lett., 42, 4224–4231, https://doi.org/
10.1002/2015GL063968.
Marshall, T. P., 2002: Tornado damage survey at Moore, Oklahoma.
Wea. Forecasting, 17, 582–598, https://doi.org/10.1175/1520-
0434(2002)017,0582:TDSAMO.2.0.CO;2.
McDonald, J. R., 2001: T. Theodore Fujita: His contribution
to tornado knowledge through damage documentation
and the Fujita scale. Bull. Amer. Meteor. Soc., 82, 63–72,https://doi.org/10.1175/1520-0477(2001)000,0063:TTFHCT.2.3.CO;2.
Minor, J. E., J. R. McDonald, and K. C. Mehta, 1977: The tornado:
An engineering-oriented perspective. NOAA Tech. Memo.
ERL NSSL-82, 196 pp., NTIS PB-281860/AS.
Molthan, A. L., L. A. Schultz, K. M. McGrath, J. E. Burks, J. P.
Camp, K. Angle, and G. J. Jedlovec, 2020: Incorporation and
use of Earth remote sensing imagery within the NOAA/NWS
damage assessment toolkit. Bull. Amer. Meteor. Soc., 101,
E323–E340, https://doi.org/10.1175/BAMS-D-19-0097.1.
Ryzhkov, A., T. J. Schuur, D. W. Burgess, and D. S. Zrnic, 2005:
Polarimetric tornado detection. J. Appl. Meteor., 44, 557–570,
https://doi.org/10.1175/JAM2235.1.
Schaefer, J. T., and R. Edwards, 1999: The SPC tornado/severe
thunderstorm database. Preprints, 11th Conf. on Applied
Climatology, Dallas, TX, Amer. Meteor. Soc., 215–220.
Shafer, C. M., and C. A. Doswell III, 2010: Amultivariate index for
ranking and classifying severe weather outbreaks. Electron.
J. Severe Storms Meteor., 5 (1), https://ejssm.org/archives/wp-
content/uploads/2021/09/vol5-1.pdf.
Smith, B. T., R. L. Thompson, A. R. Dean, and P. T. Marsh, 2015:
Diagnosing the conditional probability of tornado damage rating
using environmental and radar attributes. Wea. Forecasting, 30,914–932, https://doi.org/10.1175/WAF-D-14-00122.1.
——, ——, D. A. Speheger, A. R. Dean, C. D. Karstens, and A. K.
Anderson-Frey, 2020a: WSR-88D tornado intensity estimates.
Part I: Real-time probabilities of peak tornado wind speeds.
Wea. Forecasting, 35, 2479–2492, https://doi.org/10.1175/WAF-
D-20-0010.1.
——, ——, ——, ——, ——, and ——, 2020b: WSR-88D tornado
intensity estimates. Part II: Real-time applications to tornado
warning time scales. Wea. Forecasting, 35, 2493–2506, https://doi.org/10.1175/WAF-D-20-0011.1.
Speheger, D. A., C. A. Doswell III, and G. J. Stumpf, 2002: The
tornadoes of 3May 1999: Event verification in central Oklahoma
and related issues. Wea. Forecasting, 17, 362–381, https://doi.org/10.1175/1520-0434(2002)017,0362:TTOMEV.2.0.CO;2.
Strader, S. M., W. S. Ashley, T. J. Pingel, and A. J. Krmenec, 2017:
Projected 21st century changes in tornado exposure, risk, and
disaster potential. Climatic Change, 141, 301–313, https://
doi.org/10.1007/s10584-017-1905-4.
Thom, H. C. S., 1963: Tornado probabilities. Mon. Wea. Rev.,
91, 730–736, https://doi.org/10.1175/1520-0493(1963)091,0730:
TP.2.3.CO;2.
Thompson, R. L., and M. D. Vescio, 1998: The destruction
potential index—A method for comparing tornado days.
Preprints, 19th Conf. on Severe Local Storms, Minneapolis,
MN, Amer. Meteor. Soc., 280–282.
Thorne, P. W., and R. S. Vose, 2010: Reanalysis suitable for
characterizing long-term trends. Bull. Amer. Meteor. Soc., 91,353–361, https://doi.org/10.1175/2009BAMS2858.1.
Verbout, S.M., H. E. Brooks, L.M. Leslie, andD.M. Schultz, 2006:
Evolution of the U.S. tornado database: 1954–2003. Wea.
Forecasting, 21, 86–93, https://doi.org/10.1175/WAF910.1.
Wagner, M. R., K. Doe, A. Johnson, Z. Chen, J. Das, and R. S.
Cerveny, 2019: Unpiloted aerial systems (UASs) application
for tornado damage surveys: Benefits and procedures. Bull.
Amer. Meteor. Soc., 100, 2405–2409, https://doi.org/10.1175/BAMS-D-19-0124.1.
Weiss, S. J., and M. D. Vescio, 1998: Severe local storm cli-
matology 1955–1996: Analysis of reporting trends and
implications for NWS operations. Preprints, 18th Conf. on
Severe Local Storms, Minneapolis, MN, Amer. Meteor.
Soc., 536–539.
Wilks, D. S., 1995: Statistical Methods in the Atmospheric Sciences:
An Introduction. Academic Press, 467 pp.
Wind Science and Engineering Center, 2006: A recommendation
for an enhanced Fujita scale (EF-scale), revision 2. Texas Tech
University Publ., 95 pp., http://www.depts.ttu.edu/nwi/pubs/
fscale/efscale.pdf.
Wurman, J., and C. R. Alexander, 2005: The 30 May 1998 Spencer,
South Dakota, storm. Part II: Comparison of observed dam-
age and radar-derivedwinds in the tornadoes.Mon.Wea. Rev.,
133, 97–119, https://doi.org/10.1175/MWR-2856.1.
1482 JOURNAL OF APPL IED METEOROLOGY AND CL IMATOLOGY VOLUME 60
Brought to you by NOAA Central Library | Unauthenticated | Downloaded 10/09/21 06:47 AM UTC