Embed Size (px)
Citation preview

M O N I T O R I N G B U I L D I N G P E R F O R M A N C EBy Arpit Jain & Anubhav Rastogi

“A HOUSE IS A MACHINE FOR LIVING IN…”By Le Corbusier
M O N I T O R I N G B U I L D I N G P E R F O R M A N C EBy Arpit Jain & Anubhav Rastogi

M O N I T O R I N G B U I L D I N G P E R F O R M A N C EBy Arpit Jain & Anubhav Rastogi
V I L L A S A V O Y E : By Le Corbusier

M O N I T O R I N G B U I L D I N G P E R F O R M A N C EBy Arpit Jain & Anubhav Rastogi
J O H N S O N ’ S W A X T O W E R : By Frank Lloyd Wright

M O N I T O R I N G B U I L D I N G P E R F O R M A N C EBy Arpit Jain & Anubhav Rastogi
S Y D N E Y O P E R A H O U S E : By Jorn Utzon

M O N I T O R I N G B U I L D I N G P E R F O R M A N C EBy Arpit Jain & Anubhav Rastogi
A I R P O R T A U T H O R I T Y O F I N D I A : A Case Study by Sanjeev Gupta, Mukesh Khare, Radha Goyal

T O O L S R E Q U I R E D F O R T H E M O N I T O R I N G P R O C E S S
M O N I T O R I N G B U I L D I N G P E R F O R M A N C EBy Arpit Jain & Anubhav Rastogi

M O N I T O R I N G B U I L D I N G P E R F O R M A N C EBy Arpit Jain & Anubhav Rastogi
I M A G E I N S T R U M E N T C O S T(Rs.) D E S C R I P T I O N
DIGITAL HOT WIRE ANEMOMETER 3,500/-
THE ANEMOMETER USES ATEMPERATURE-COMPENSATEDHOT WIRE TO MEASURE AIRVELOCITIES OVER A 0 TO 10M/S RANGE.
TELAIRE CO2 MONITOR46,500/-
PROVIDES REAL TIMECONTINUOUSLY UPDATEDREADINGS OF CO2CONCENTRATION WITHIN THERANGE OF 100 TO 2000 PPMFOR BETTER VENTILATIONEFFECTIVENESS.
BOROZIN SMOKE GUN 9,350/-
HELPS IN THE VISUAL TRACKINGOF THE AIR FLOW PATTERNS.THIS TECHNIQUE WORKS WELLIN THE RELATIVELY LOW AIRVELOCITIES ENCOUNTERED INARCHITECTURAL SPACES.

M O N I T O R I N G B U I L D I N G P E R F O R M A N C EBy Arpit Jain & Anubhav Rastogi
I M A G E I N S T R U M E N T C O S T D E S C R I P T I O N
ECO SENSORS VOC &OZONE MONITORS
20,000/- & 35,000/-RESPECTIVELY
PROVIDE CONCENTRATIONSOF VOCs & OZONE IN AIR.
RAYTEK RANGER PORTABLE INFRARED PYROMETER
66,500/-
MAKES NON-CONTACT MEASUREMENTS OF SURFACE TEMPERATURE BASED ON AN ASSUMED SURFACE EMISSIVITY.
MANUAL SLING PSYCHROMETER 6,500/-PROVIDES AN OLD FASHIONEDBUT RELIABLE, MEANS FORDETERMINING RELATIVEHUMIDITY(DBT, WBT, RH)
M O N I T O R I N G B U I L D I N G P E R F O R M A N C EBy Arpit Jain & Anubhav Rastogi
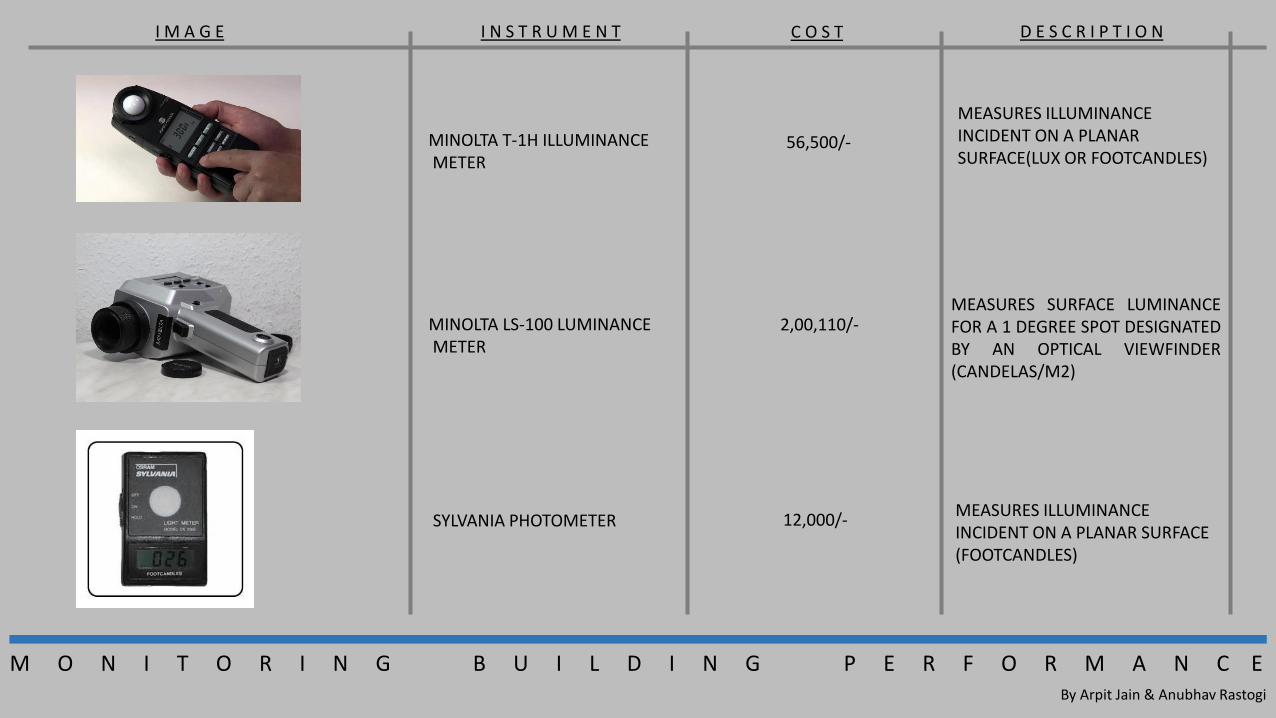
I M A G E I N S T R U M E N T C O S T D E S C R I P T I O N
MINOLTA T-1H ILLUMINANCEMETER
56,500/-
MEASURES ILLUMINANCE INCIDENT ON A PLANAR SURFACE(LUX OR FOOTCANDLES)
MINOLTA LS-100 LUMINANCEMETER
2,00,110/-MEASURES SURFACE LUMINANCEFOR A 1 DEGREE SPOT DESIGNATEDBY AN OPTICAL VIEWFINDER(CANDELAS/M2)
SYLVANIA PHOTOMETER 12,000/-MEASURES ILLUMINANCE INCIDENT ON A PLANAR SURFACE (FOOTCANDLES)

M O N I T O R I N G B U I L D I N G P E R F O R M A N C EBy Arpit Jain & Anubhav Rastogi
I M A G E I N S T R U M E N T C O S T D E S C R I P T I O N
FLUKE 87 RMS MULTIMETER 22,500/-
MEASURES A HOST OF ELECTRICALVARIABLES INCLUDING VOLTAGE,RESISTANCE, CONTINUITY,CAPACITANCE, CURRENT.
SUUNTO HANDHELD CLINOMETER 9,800/-MEASURES THE LOCATION OF HORIZON SHADING OBSTACLES
SCIENTIFIC DATALOGGER 1,88,000/- MEASURES ANALOG & DIGITAL SIGNALS, PROVIDES ANALOG &DIGITAL OUTPUTS

C A S E S T U D Y : A T A L E O F T W O H O U S E S
M O N I T O R I N G B U I L D I N G P E R F O R M A N C EBy Arpit Jain & Anubhav Rastogi

M O N I T O R I N G B U I L D I N G P E R F O R M A N C EBy Arpit Jain & Anubhav Rastogi
THE MONITORING OF THE BUILDING PERFORMANCE CAN BE DONE BY OBTAINING & REVIEWING THE FOLLOWING DATA. THIS DATA CAN BE OBTAINEDWITH THE HELP OF SIMPLE BUT PRECISE SCIENTIFIC EQUIPMENTS:
1. WHOLE BUILDING ENERGY USE.
2. TAKING A BUILDING’S TEMPERATURE : MEASUREMENT & DISPLAY OF A BUILDING’S THERMAL PERFORMANCE
3. THERMAL MASS IN PASSIVE SOLAR & ENERGY CONSERVING BUILDINGS
4. INTERIOR ILLUMINANCE, DAYLIGHT CONTROLS & OCCUPANTS RESPONSE
5. HVAC COMPONENTS & SYSTEMS
6. OBSERVING AIR FLOW IN BUILDINGS
7. THE DYNAMICS PATTERN OF SHADING & SOLAR HEAT GAIN THROUGH WINDOWS
8. GLAZING PERFORMANCE
H O W T O M O N I T O R T H E B U I L D I N G P E R F O R M A N C E:
M O N I T O R I N G B U I L D I N G P E R F O R M A N C EBy Arpit Jain & Anubhav Rastogi
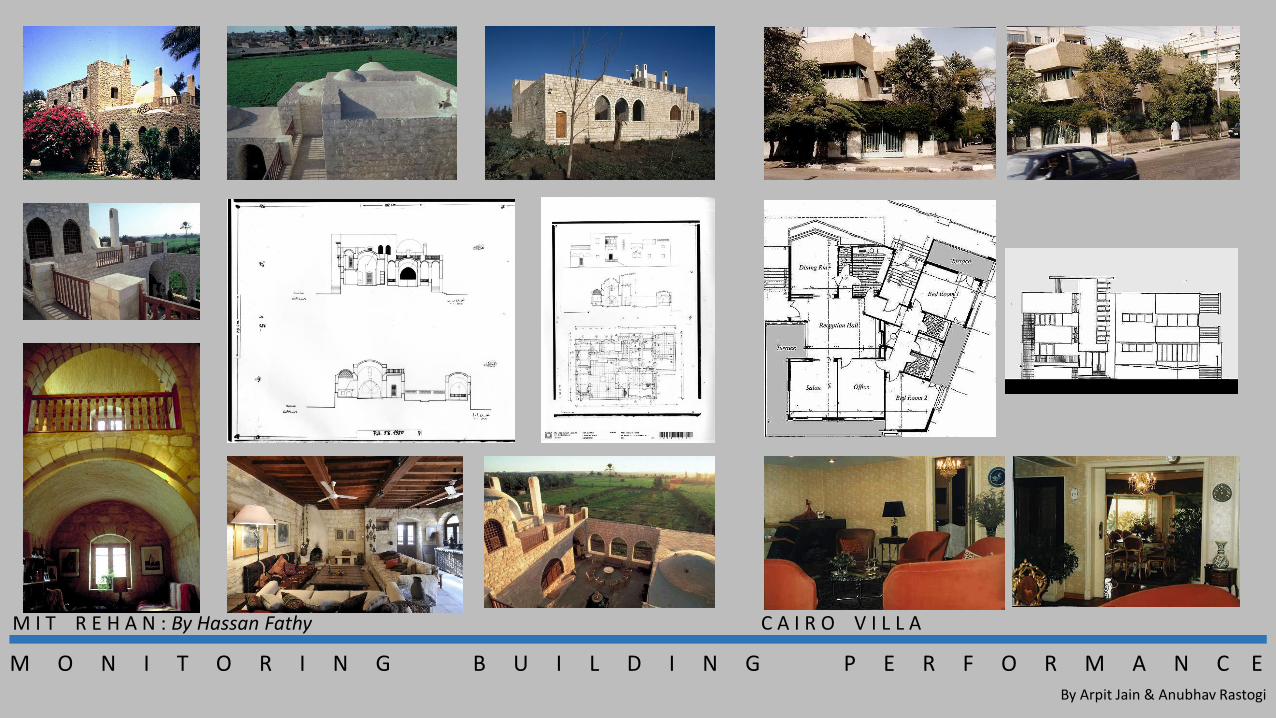
M I T R E H A N : By Hassan Fathy C A I R O V I L L A

M O N I T O R I N G B U I L D I N G P E R F O R M A N C EBy Arpit Jain & Anubhav Rastogi
CASE STUDY WAS DONE BASED ON THE FOLLOWING THREE HYPOTHESES :
1. Mit Rehan would have better thermal performance as compared to contemporary modern architecture.
2. Due to Mit Rehan’s material selection & sustainable construction methodology it would have reduced energy levels due to natural heating & cooling, while maintaining satisfactory comfort levels of its occupants.
3. Also Mit Rehan would produce an architectural language that satisfies the user’s needs & wants while maintaining the traditional heritage of the region.
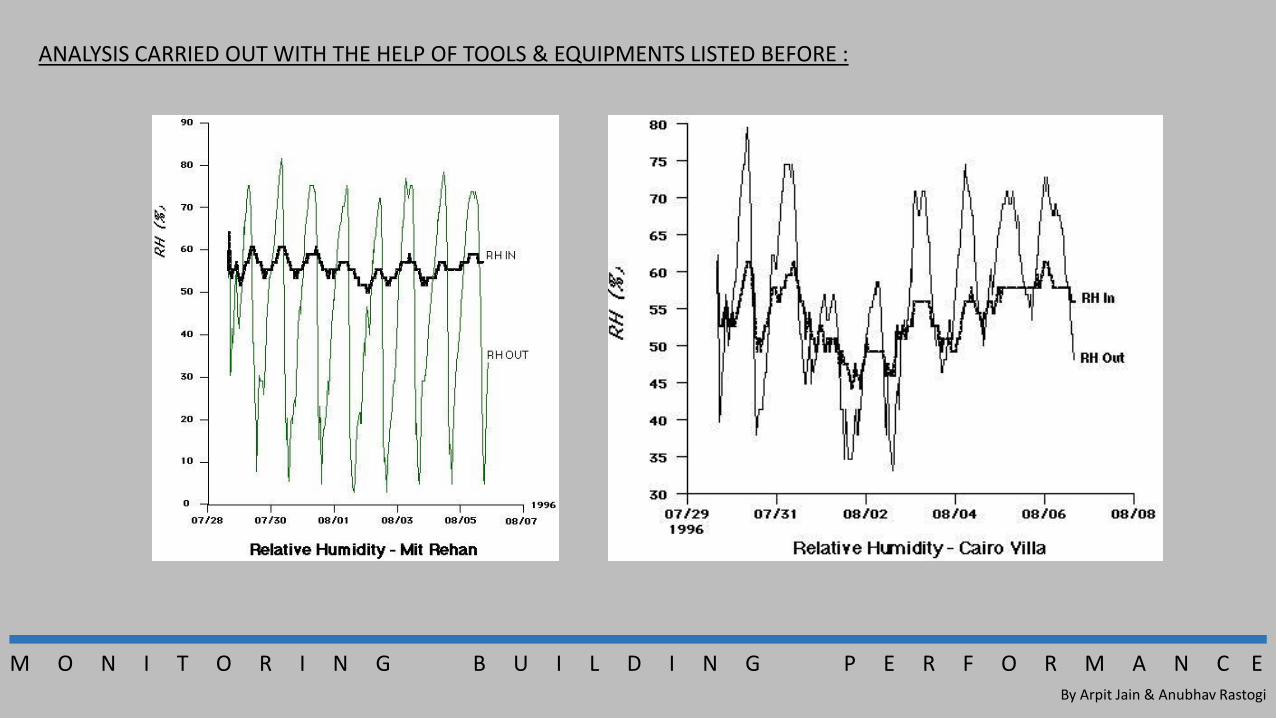
ANALYSIS CARRIED OUT WITH THE HELP OF TOOLS & EQUIPMENTS LISTED BEFORE :
M O N I T O R I N G B U I L D I N G P E R F O R M A N C EBy Arpit Jain & Anubhav Rastogi
ANALYSIS CARRIED OUT WITH THE HELP OF TOOLS & EQUIPMENTS LISTED BEFORE :

M O N I T O R I N G B U I L D I N G P E R F O R M A N C EBy Arpit Jain & Anubhav Rastogi
CONCLUSIONS BASED ON THE STUDY & THE ANALYSIS :
We as professionals tend to have a romantic approach towards the traditional constructions & thus assume that thetraditional constructions are more energy efficient. but by doing this study one reaches to a sparingly different &surprising conclusions which would have not been possible otherwise, the most significant conclusions are :
1. The study confirms our first hypothesis that Hassan Fathy's neo-traditional houses save energy over theircontemporary modern counterparts. However, this energy is not in the daily use of the building. The energyconservation is mostly in the life cycle analysis of the structures and is related to sustainability of energy resourcesconsumed in the building process rather than in the building use. This could shed light on the important role of thedesign and construction strategies employed by Hassan Fathy in the use of simple man-made thick masonry walls ofvery high thermal mass and considerably low thermal resistance. Implications might suggest a broaderconceptualization of environmental sustainability related to the energy levels consumed in producing high technologymaterials that achieve the same results of these simple protocols.
2. Similarly, based on the assumption that traditional and neo-traditional environments are more enclosed with smallerwindow areas, thus as hypothesized, would have a better thermal performance over contemporary villas. Resultsindicated that visual information related to the degree of glazing and openness of modern structures can be adeceiving criteria in judging their performance. Although visually Hassan Fathy's Mit Rehan seemed to have less glazingand openings than the Cairo Villa, the vital statistics showed (Table) that their glazing to floor area percentages aresimilar. Moreover, recessed windows covered with wooden lattice work in Fathy's Mit Rehan have similar thermalperformance as flush windows shaded with overhangs in the Cairo Villa. This might suggest that both strategies arevalid criteria in enhancing the building's thermal performance and should be viewed according to the suitability of thecontext and user's preferences.
3. Users thermal association with the building's form and style as well as their association of thermal comfort to certainarchitectural elements might be an important finding and could be investigated in future research. This could alsointroduce a different conceptualization towards the users perception of thermal comfort as related to context.
Cairo Villa Mit Rehan
Bldg. Type Contemporary Neo-Traditional
Const. Type Beam & Column Bearing Wall
Ground Fl. Area 200 Sq. M. 242 Sq. M.
Ground Fl. Terrace
Area45 Sq. M. 170 Sq. M.
Total Ground Fl. Area 245 Sq. M. 412 Sq. M.
1st Fl. Area 220 Sq. M. 110 Sq. M.
1st Fl. Terrace Area 40 Sq. M. 65 Sq. M.
1st Ground Fl. Area 260 Sq. M. 175 Sq. M.
Total Area 505 Sq. M. 587 Sq. M.
Wall Area 420 Sq. M. 550 Sq. M.
Window Area 90 Sq. M. 70 Sq. M.
Masonry Type Red Brick Sandstone
Masonry Ground Fl. 42 Cu. M. 518 Cu. M.
Masonry 1st Fl. 50 Cu. M. 70 Cu. M.
Total Masonry 92 Cu. M. 588 Cu. M.
Concrete Type Reinforced Ordinary/light reinf.
Concrete Ground Fl. 71 Cu. M. 70 Cu. M.
Concrete 1st Fl. 60 Cu. M. 18 Cu. M.
Total Concrete 131 Cu. M. 88 Cu. M.
Thermal Storage
Mass941 kJ/deg K/Sq M 3,012 kJ/deg K/Sq M
U of Roofs and Floors 0.48 w/Sq M/deg K 1.91 w/Sq M/deg K
U of Walls 1.73 w/Sq M/deg K 1.15 w/Sq M/deg K
U of Roofs and Floors 5.36 w/Sq M/deg K 4.76 w/Sq M/deg K
Building UA 1,574 w/deg K 2763 w/deg K
Ubldg 3.12 w/deg K/Sq M 4.71 w/deg K/Sq M
Pct. Void/T-Area 21% 20%

M O N I T O R I N G B U I L D I N G P E R F O R M A N C EBy Arpit Jain & Anubhav Rastogi
Building Information Modeling for Smart Built Environments
•The rapid advances in information and communication technologies (ICT) haveled to take a central stage in the construction and management of emergingsmart built environments (SBEs).
•“Smart built environment” refers to a built environment that has beenembedded with smart objects, such as sensors and actuators, with computingand communication capabilities.
•Building information modeling (BIM) provides architectural 3D visualization anda standardized way to share and exchange building information. BIM can also beused for the post-construction management of the built facility.
•The Autodesk research group integrated BIM with sensors and meters to provide3D visualization of building performance and life-cycle operation.
•The Virtual Real-time Information System (VRIS) combines an Onuma cloud-basedBIM tool with a real-time sensor engine called the Virtual Real-time OperatingCentre (vROC) to provide building management functions.
•BIM introduces exchangeable information formats ,i.e., International FoundationClasses (IFC), for modeling and visualizing building entities in 3D.

M O N I T O R I N G B U I L D I N G P E R F O R M A N C EBy Arpit Jain & Anubhav Rastogi
CASE STUDY
George Mason University Of Science and Technology, located inFairfax, Virginia
• In order to illustrate relationships between design decisions and building performance analysis using BIM, a case study is discussed.
• Data exchange Format - gbXML• Analysis tools - Ecotect ,Radiance , Green Building
Studio and EnergyPlus• BIM design tool - Revit
Objectives of this study
• Site context and shadow ranges for winter and summer solstices• Addition building: shading devices on the east facade; solar exposure; daylight levels
and glare for selected laboratory spaces• Addition building: shading devices on the west facade; solar exposure; daylight levels
and glare for corridor area• Addition building: solar exposure and daylight for the north and south atrium facades• Renovation building: shading devices on the west facade; solar exposure; daylight levels
for selected computer laboratories and glare analysis• Properties of building envelope (specifically, glass selection) for improving energy
efficiency.

M O N I T O R I N G B U I L D I N G P E R F O R M A N C EBy Arpit Jain & Anubhav Rastogi
•Compares average solar exposure for the west facade without andwith aluminum screen mesh vertical shading devices.•The vertical shading fins significantly reduce solar heat.•The design of shading devices was changed based on this analysis.
•daylight levels in the corridor , which are sufficient for this circulation space.• Therefore, it was concluded that the shading devices along the west facade effectively
block solar radiation without negatively affecting the availability of natural light..
•Initial design for the east facade of Addition building included vertical fins as shading elements.•It was found that the east facade annually receives only a small percentage of incident solar radiation (around 6%), and that on average spends 87% of time in shade.•The results of the analysis were implemented in the final design, and the shading elements were eliminated.

M O N I T O R I N G B U I L D I N G P E R F O R M A N C EBy Arpit Jain & Anubhav Rastogi
•It was found that thedaylight levels wouldnot be too highwithout the shadingelements, and thatvisual comfortconditions would beacceptable.
Conclusion
• Coupling BIM-based analysis with BIM-based design production tools occurs when all design/performance analysis team members work collaboratively withinan iterative process of design decision-making.
• There are both direct (gbXML) and indirect (DXF) routes for exchanging three dimensional BIM models with building performance analysis applications. It isimportant to know what type of design information is needed for a specific analysis.
• BIM-design and BIM-analysis models need to be managed and developed properly. In essence, BIM design models typically have too many architectural andconstruction details, which are not needed for the performance analysis.
Bibliography
• BIM-Based Building Performance Analysis: Evaluation and Simulation of Design Decisions.• Building Information Modeling for Smart Built Environments , Department of Electrical and Electronic Engineering, Auckland University of Technology
M O N I T O R I N G B U I L D I N G P E R F O R M A N C EBy Arpit Jain & Anubhav Rastogi
THAT’S ALL FOLKS !!