Embed Size (px)
Citation preview
Andrew Kading, Portland State University
Other Contributors:Christopher Sobie, NAUEdward Smaglik, NAU
Anuj Sharma, ISUSirisha Kothuri, PSUPeter Koonce, PBOT
Managing User Delay with a Focus on Pedestrian Operations
Presentation from:Transportation Research Board 95th Annual Meeting
January 13th, 2016
Paper #: 16-1487

Agenda
Introduction Background Motivation Objectives Signal Timing 101 Algorithm Development Simulation Development Simulation Results Conclusion
2

Introduction
Increase in walking trips nationally
Walking healthy, livable communities
National Walking TrendsSource: Data from Pucher et al.,(2011)
3

Background
Limited signal control strategies for pedestrians Typically focused on safety Little on efficiency
Leading Pedestrian Interval (LPI)
Exclusive Pedestrian Phase (Barnes Dance)
4
1
2

Motivation
Delays affect pedestrians disproportionately
“Everyone is a pedestrian”
Incr
easi
ng P
riorit
y
How do we translate “pedestrian first” policies into specific operational strategies at intersections?
5

Objectives
Assess the efficiency impacts of various control strategies on all users Free Actuated Coordinated
Veh Ext Timer Sensitivity Analysis
Coordinated Algorithm
Develop and implement a pedestrian priority algorithm based on Vehicle volumes
6

7
Signal Timing 101: Coordinated

8
Signal Timing 101: Coordinated

9
Signal Timing 101: Coordinated

10
Signal Timing 101: Coordinated

?
+3 sec
11
Signal Timing 101: Actuated Coordinated

12
Signal Timing 101: Actuated Coordinated

Actuated Coordinated Operation
13
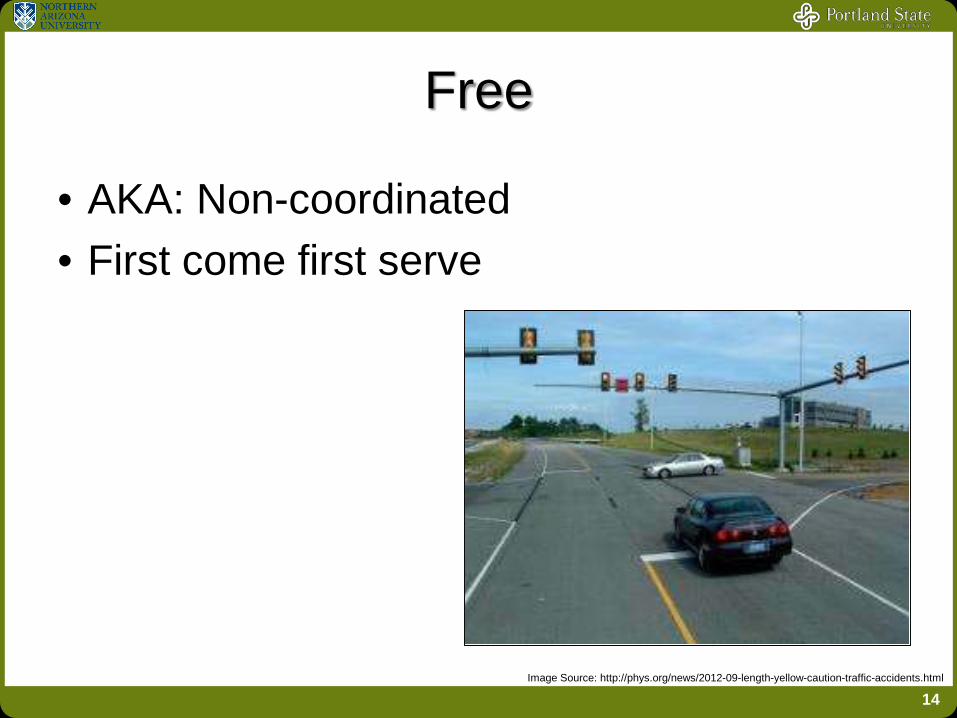
Free
• AKA: Non-coordinated• First come first serve
14Image Source: http://phys.org/news/2012-09-length-yellow-caution-traffic-accidents.html

Algorithm Development
Pedestrian Priority Operational Plan (PPOP) Veh volume < threshold (user defined) for a given time
period Two scenarios analyzed Actuated-coordinated Free
ASC/3 logic processor used for implementation Inputs Veh volume (detectors)
15
Algorithm Enabled

16
ASC/3 Logic Processor

Simulation Development
17

Simulation Results
Scenarios Coordinated-Base Actuated-Coordinated using algorithm Free using algorithm Free
Metrics User delay (veh, ped) Travel time
Vehicle Extension Sensitivity Analysis
18

*Statistically significant at 95% confidence level. For all scenarios, ped call every 4th cycle on P4/8.
Extension Timer Value Sensitivity Analysis
19
Vehicle Extension
Timer(s)
Avg.Overall Delay
(s)
Avg. Veh
Delay (s)
Avg. Ped
Delay 2/6 (s)
Avg. Ped
Delay 4/8 (s)
Avg.TT(s)
(EB)
Avg.TT(s)
(WB)
Avg.TT(s)
(NB)
Avg.TT(s)
(SB)0 26.74 26.14 48.07 38.33 104.89* 89.76 94.69 90.28
0.5 26.73 26.14 48.08 38.33 104.89* 89.76 94.70 90.261.0 26.73 26.91 48.14 38.44 104.86* 89.64 94.63 90.371.5 26.65 26.04 48.08 38.86 104.13* 89.53 94.70 90.332.0 26.70 26.07 48.27 39.59 103.50* 89.44 94.84 90.682.5 26.75 26.11 48.60 41.66 102.92* 89.58 95.09 90.573.0 26.68 26.04 48.64 42.57 101.98 89.19 95.23 90.68
3.5 (Base) 26.57 25.94 48.49 42.19 101.08 89.16 94.99 90.51
*Statistically significant at 95% confidence level. For all scenarios, ped call every 4th cycle on P4/8.
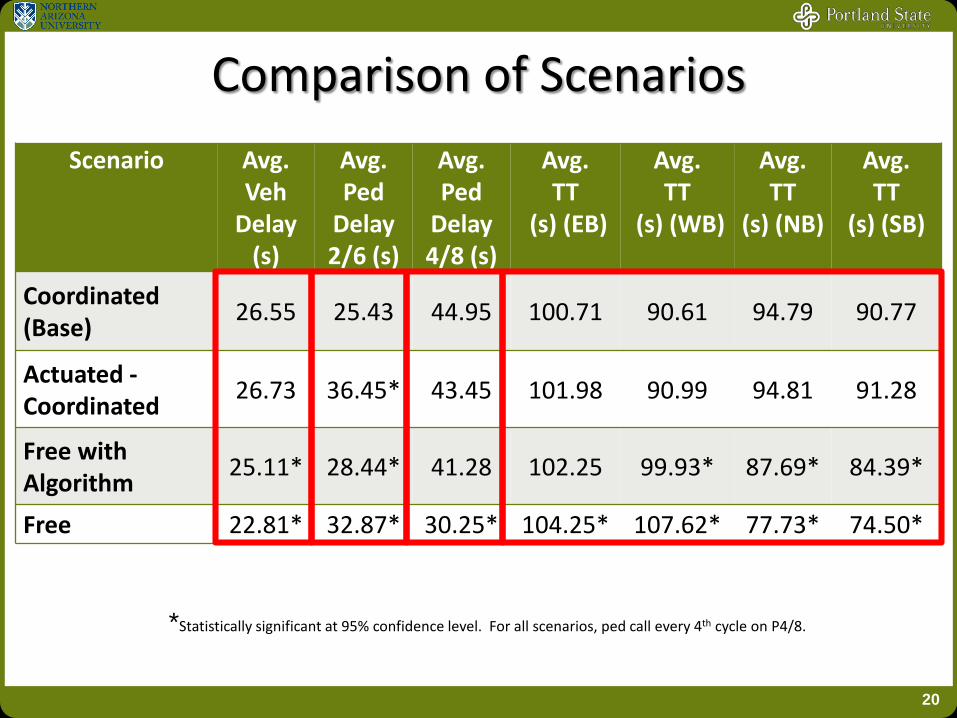
Comparison of ScenariosScenario Avg.
VehDelay
(s)
Avg. Ped
Delay2/6 (s)
Avg. Ped
Delay 4/8 (s)
Avg.TT
(s) (EB)
Avg.TT
(s) (WB)
Avg.TT
(s) (NB)
Avg.TT
(s) (SB)
Coordinated (Base) 26.55 25.43 44.95 100.71 90.61 94.79 90.77
Actuated -Coordinated 26.73 36.45* 43.45 101.98 90.99 94.81 91.28
Free with Algorithm 25.11* 28.44* 41.28 102.25 99.93* 87.69* 84.39*
Free 22.81* 32.87* 30.25* 104.25* 107.62* 77.73* 74.50*
20

Free operation most effective method to reduce delay 5 – 14% reduction in average vehicle delays 8 – 33% reduction in average minor street pedestrian delays
Modifying extension timer of actuated-coordinated phase can: Reduce minor street ped delay (1.3% - 9.1%) with minimal
impact on overall vehicle delay
Key Takeaways
21

Incorporated pedestrian efficiency considerations into signal timing strategies
Developed pedestrian priority algorithm using ASC/3 SITL signal controller
Results show that algorithm can be effective in reducing Overall delay Ped delay
Conclusions
22

Next Steps
Field Deployments ASC/3 controllers
Mesa, AZ Flagstaff, AZ
Type 2070 controllers Portland, OR
Compare efficiency impacts with other pedestrian strategies
Ped Priority Algorithm using pedestrian delay
23

Thank you!
24

Threshold Determination
Exploring Pedestrian Responsive Signal Timing Strategies in Urban Areas
COORDINATEDShort Cycle Lengths
FREE
Ped Act. Frequency (side st.)
V/C
(maj
or st
.)
Low<30%
Medium30%-70%
High>70%
COORDINATEDManage Ped Service Response PED
RECALL
< 0.
50.
5 –
0.8
> 0.
8
25

Platoon Dispersion Modeling
Robertson’s Model:
qi = ith time interval α = platoon dispersion factor β = travel time factor T = average travel time between upstream signal to
downstream signal F = smoothing factor
Where,
26

Platoon Dispersion ModelingRobertson’s platoon dispersion diagram for locations 10 sec and 20 sec away from the point of origin of the platoon assuming α.β value of 0.17.
27

Simulation Development
28

"Loop Intersection Begins Test of 'pedestrian Scramble'" N.p., 31 May 2013. Web. 05 Jan. 2016
"Video Detectors as Loop Replacement - Aldridge Traffic Controllers –SCATS Traffic Management Systems | Traffic Signal Controllers." Video Detectors as Loop Replacement - Aldridge Traffic Controllers – SCATS Traffic Management Systems | Traffic Signal Controllers. N.p., n.d. Web. 05 Jan. 2016.
"VISualising and SIMulating Traffic." PTV COMPASS BLOG. N.p., n.d.Web. 05 Jan. 2016.
"Silhouette of Pedestrians on Bridge in Ront of Münster." Dreamstime. N.p., n.d. Web. 05 Jan. 2016.
"This Dancing Crosswalk Lights Are Made To Make Pedestrians Safe And Happy!" Wereblog. N.p., 03 Nov. 2014. Web. 05 Jan. 2016.
"Western US - The Water Issues." The Water Issues. N.p., n.d. Web. 05 Jan. 2016.
References
29