Embed Size (px)
Citation preview

From (US) financial crisis to eurocrisis: Why are American houses connected to Europe's internal imbalances?
Herman Schwartz University of Virginia 27 September 2013
UNC Chapel Hill / TAM

Everything you need to know…

Euroland: an Op7mal Currency Area?
• Euro only works if Europe is an OCA • OCA needs: – Essen7ally open financial markets (Yes) – Essen7ally open goods markets (Mostly, but…) – High internal labor mobility (No) – High fiscal transfers (No) – And – same ideas about proper policy
• Result: regional instabili7es that are magnified by na7onal poli7cal structures

US Produc7vity growth vs wage growth % change 1948-‐2011
100
150
200
250
300
350
400
1948
1951
1954
1957
1960
1963
1966
1969
1972
1975
1978
1981
1984
1987
1990
1993
1996
1999
2002
2005
2008
2011
Wages* ProducWvity

Produc7vity vs average wage and average income of top 1%, in US, 1979+

Rising US household debt compared to incomes
1:1 ra7o

The 1991-‐2007 US growth cycle
Asia Recycles US Dollars as new Treasury / MBS Debt
Disinfla7on Housing Finance System
More Consump7on
US trade deficits à Global Growth
Faster US Economic Growth
↑ Tax revenue Fed ↓ interest rates

Low interest rates No welfare state
China’s growth cycle, 2000s
Central bank Sterilizes $$ Issuing RMB
State Banks & party elites
More investment for exports
Central Bank buys $$
Trade Surplus
↓ domes7c consump7on

The 1995-‐2000s German growth trap
Slower job crea7on
Wage restraint
Low Domes7c Demand
Less Domes7c Consump7on
Less domes7c investment
Slower rela7ve economic growth
↓ Tax revenue Tight money
policy

Net Exports Contribu7on to each countries’ GDP Growth 1995-‐2009
-‐10
-‐5
0
5
10
15
20
25
30

The 1995-‐2000s German growth trap
Slower job crea7on
Wage restraint
Low Domes7c Demand
Less Domes7c Consump7on
Less domes7c investment
Slower rela7ve economic growth
↓ Tax revenue
Tight money policy
Export surplus
German banks buy PIGS debt
German banks buy US
Mortgage bonds

Germany’s trade surpluses (€ bil)
0
20
40
60
80
100
120
140
Germany to EU27
Germanyto ROW

RelaWve Unit Labor Costs (wage in euros * produc7vity) 2000=100
80
90
100
110
120
130
140
2000 2001 2002 2003 2004 2005 2006 2007 2008 2009 2010 2011
Germany
France
Italy
Spain
Netherlands

Germany produces but does not consume – final consump7on expenditure growth as
% of German growth (Germany = 100)
80%
100%
120%
140%
160%
180%
200%
220%
240%
2001 2002 2003 2004 2005 2006 2007 2008 2009 2010 2011 2012
Ireland Greece Spain Italy Portugal

Cumula7ve growth in GDP pc, PPP 1999-‐2009

EU member interest rates 1995 -‐ 2011
EURO introduced
Lehman crash

EU internal trade balances, € mils More imports = rising “foreign” debt
-‐200,000
-‐150,000
-‐100,000
-‐50,000
0
50,000
100,000
150,000
200,000
250,000
300,000
1999 2000 2001 2002 2003 2004 2005 2006 2007
Netherlands
Germany
France
Greece
United Kingdom Italy
Spain
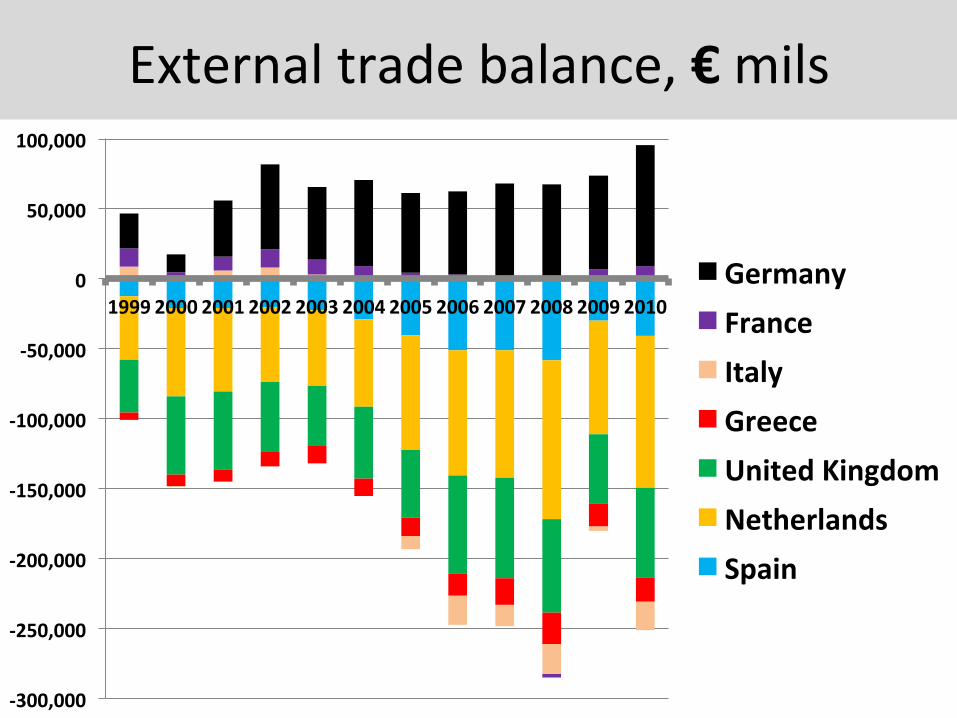
External trade balance, € mils
-‐300,000
-‐250,000
-‐200,000
-‐150,000
-‐100,000
-‐50,000
0
50,000
100,000
1999 2000 2001 2002 2003 2004 2005 2006 2007 2008 2009 2010 Germany France Italy Greece United Kingdom Netherlands Spain

US trade deficit (goods only, disaggregated, $bil.)
-‐700
-‐600
-‐500
-‐400
-‐300
-‐200
-‐100
0
100
200
EU x Germany
Lat. America
Canada
Rest of world
Germany
Japan
Middle East
China

EU member interest rates 1995 -‐ 2011
EURO introduced
Lehman crash

Fiscal (welfare state) excess? (budget balance as % of GDP)
-‐6.0
-‐4.0
-‐2.0
0.0
2.0
4.0
6.0 Denmark Germany Sweden

Fiscal (welfare state) excess? (budget balance % of GDP)
-‐30.0
-‐25.0
-‐20.0
-‐15.0
-‐10.0
-‐5.0
0.0
5.0
Germany Greece Ireland Italy Portugal Spain

It’s financial debt, not sovereign
Topics: US equity markets holding in despite poor economic data; which fiscal cliff is worse; European Credit Divorce; will China respond to economic CPR; After 50
3
July 17, 2012
Sometimes a Great Notion (1971): how did the US dig itself out of wartime debt levels after WWII? I find that there is a lot of misreporting about how US debt levels were halved during the 1950’s. As shown in the table below, government spending was not cut sharply; there was no radical increase in tax collections, either from businesses or from households; and the Fed did not engineer negative long-term real interest rates to jumpstart growth. In addition to the competitive advantage the US had over recovering Axis Powers, the US of the 1950’s benefited from pro-business policies that resulted in over 4% annualized GDP growth throughout the decade. This approach is not in play now, raising questions about how the US will deal with 80% net debt to GDP for only the second time in its 200+ year history.
A brief detour: The 1971 film chosen above is about rugged individualism, the power of small business and the lack of reliance on government or organized labor to solve problems. It’s actually hard to find a pro-business or pro-capitalist film. According to Larry Ribstein at the University of Illinois College of Law (see page 6 for details), US filmmakers have a long history of disliking profit-maximization, and have generated a huge volume of work depicting evil, soulless corporations and heartless capitalists. He quotes Joseph Schumpeter and theorizes that filmmakers are an intelligentsia over-produced by the bounties of capitalism which directs its resentment at a society that refuses to value what they do. Ouch! Scenes from a Marriage (1973): the European Credit Divorce keeps getting more worse A decade of European monetary integration continues to unravel. As shown below, Eurozone banks are cutting their cross-border credit exposure as fast as they can. Unsurprisingly, the rest of the world is not any more anxious to lend to the European Periphery, and is cutting its exposures as well. The ECB is providing the stop-gap to finance all of this capital flight, which helps prevent an outright Depression. But to be more optimistic on Europe, we need to see some improved economic conditions in the Periphery, and evidence that structural reforms are paying off. As things stand now, there are still serious questions about how the ECB and the EU will come up with the money to finance all the maturing Peripheral sovereign and bank debt that investors no longer want to hold. Total Periphery sovereign and bank debt: almost 7 trillion Euros.
Net debt (% of GDP)
Net debt (bn)
Nominal GDP (bn)
Real GDP (bn 1950 USD)
Outlays (% of GDP)
Receipts (% of GDP)
Average real 10-year rate
1950 80% $219 $273 $273 16% 14% 1.3%1951 67% $214 $320 $302 14% 16% -5.3%1952 62% $215 $349 $322 19% 19% 0.5%1953 59% $218 $373 $341 21% 19% 2.0%1954 60% $224 $377 $343 19% 19% 2.1%1955 57% $227 $396 $354 17% 17% 3.1%1956 52% $222 $427 $368 17% 18% 1.7%1957 49% $219 $451 $377 17% 18% 0.3%1958 49% $226 $460 $377 18% 17% 0.6%1959 48% $235 $490 $398 19% 16% 3.3%1960 46% $237 $519 $415 18% 18% 2.7%
Comp. ann'l gr: 0.8% 6.6% 4.3%Source: OMB, BEA, Robert Shiller data set, Bureau of Labor Statistics.
0.4
0.5
0.6
0.7
0.8
0.9
1.0
1.1
2004 2005 2006 2007 2008 2009 2010 20112.5
3
3.5
4
4.5
5
5.5
6
6.5
7
Source: BIS. Data as of Q4 2011.
Flight of the BumblebeeTrillions, USD
Cross-borderlending within the Euro zone
Non-Euro zone lending to the Periphery
0
1
2
3
4
5
6
7
2002 2003 2004 2005 2006 2007 2008 2009 2010 2011Source: J.P. Morgan Securities LLC.
Peripheral sovereign and financial debtTrillions, Euros
Sovereign
Financial
1950’s time capsule: taxes were regarded as a greater cause for small business failures than tight money. Eisenhower championed legislation which eased tax burdens on small business and which culminated in a bill eliminating double-taxation (Subchapter S); he also eliminated wage and price controls. In the 1950’s, the private sector accounted for a post-war peak of 86% of all employment, a level not seen since.

What if Greece (Spain, Italy) defaulted?
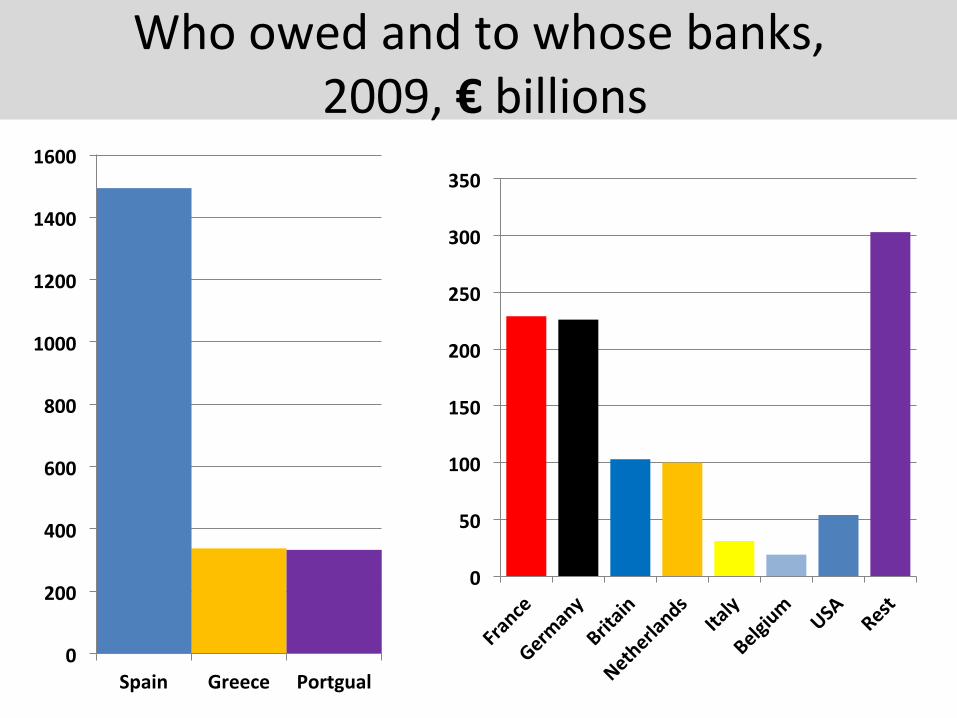
Who owed and to whose banks, 2009, € billions
0
200
400
600
800
1000
1200
1400
1600
Spain Greece Portgual
0
50
100
150
200
250
300
350

Private capital ounlows, public inflows…
as % of GDP of Spain, Greece, Italy, Portugal, Ireland

The ECB reacts
C H A P T E R 1 G LO B A L F I N A N C I A L S TA B I L I T Y A S S E S S M E N T
International Monetary Fund | October 2012 5
–12–10
–8–6–4–2
02468
Jan-10 Apr-10 Jul-10 Oct-10 Jan-11 Apr-11 Jul-11 Oct-11 Jan-12
CorePeriphery
Sources: Haver Analytics; and IMF staff estimates.Note: To estimate the autonomous, private-sector-driven component of total flows,
flows are calculated as the sum of net portfolio and other investment flows, excluding changes in TARGET2 balances at the central bank. Core = Belgium, France, Germany, and the Netherlands; periphery = Greece, Ireland, Italy, Portugal, and Spain.
Figure 1.5. Portfolio and Other Investment Capital Flows in the Euro Area, Excluding Central Banks(Cumulative from December 2009, in percent of GDP in preceding year)
Capital "ight from the periphery to the core…
3
4
5
6
7
Spain (foreign share)Italy (foreign share)
Spain yield (right scale)Italy yield (right scale)
0
10
1997
1998
1999
2000
2001
2002
2003
2004
2005
2006
2007
2008
2009
Jan-
10Ap
r-10
Jul-1
0Oc
t-10
Jan-
11Ap
r-11
Jul-1
1Oc
t-11
Jan-
12Ap
r-12
Jul-1
2
20
30
40
50
60
Introductionof euro
Source: Bloomberg L.P.Note: Share of nonresident investors in total debt stock, and generic yield of 10‐year
government bond. Yields are 3-month moving averages.
Figure 1.6. Spain and Italy: Changes in Foreign Investor Shares and Yields(In percent)
…is widening sovereign spreads as foreign holdings of periphery debt fall…
Bankingsector
Publicsector
0
500
1,000
1,500
2,000
2,500
ECB borrowing
Borrowing from
private banks
EFSF/EFSMSMP
ECB borrowing
Borrowing from
private banks
Sources: Bank for International Settlements (BIS); Bloomberg L.P.; European Financial Stability Fund; Haver Analytics; national central banks; and IMF staff estimates.
Note: Current exposures of the rest of the euro area to the periphery (Greece, Ireland, Italy, Portugal, and Spain) amount to €2.2 trillion; including cross‐border lending by euro area banks reporting to the BIS on an ultimate risk basis (end‐March 2012); periphery banks' borrowing from the Eurosystem, excluding emergency liquidity assistance; ECB purchases of periphery government bonds through its SMP; and EFSF and EFSM contributions to programs with Greece, Ireland, Portugal, and Spain. ECB = European Central Bank; EFSF = European Financial Stability Facility; EFSM = European Financial Stabilisation Mechanism; SMP = Securities Market Programme.
Figure 1.7. Euro Area Exposures to Greece, Ireland, Italy, Portugal, and Spain(In billions of euros)
Dec-09 Current
…and private borrowing is being replaced by public sector "ows…
0
100
200
300
400
500
Jan-11 Apr-11 Jul-11 Oct-11 Jan-12 Apr-12 Jul-12
SovereignsBanksNon!nancial !rms
Growing divergencebetween periphery
and core
Sources: Bloomberg L.P.; Thomson Reuters Datastream; and IMF staff estimates.Note: Data for sovereigns are weighted by GDP; for banks, by assets; and for
nonfinancial firms, by outstanding bonds. Corporate spreads are calculated via option-adjusted bond spreads. Core = Austria, Belgium, Finland, Germany, and the Netherlands; periphery = Greece, Ireland, Italy, Portugal, and Spain.
Figure 1.8. Periphery Minus Core Credit Default Swap Spreads(In basis points)
…resulting in a growing divergence in periphery-core funding costs and spreads…

Wolfgang Schauble (FRG Fin Minister) “Nobody in Europe sees this contradic7on between fiscal policy consolida7on and growth. We have a growth-‐friendly process of consolida7on, and we have sustainable growth, however you want to word it.”
Washington Post 10 April 2013
Eurozone 2012 GDP growth: -‐ 0.6% 2013: -‐ 0.4% Eurozone Q2 unemployment rate: 12.1% Eurozone total employment = level of Q2 2005

The eurozone is a straw house

QUESTIONS?