Embed Size (px)
Citation preview

PHC215
By Dr. Khaled Ouanes Ph.D.
E-mail: [email protected]
Twitter: @khaled_ouanes
INTRODUCTION TO
HEALTHCARE RESEARCH
METHODS

Case-Control Studies

Case-control studies are often used to
identify factors that may contribute to a
medical condition by comparing subjects
who have that disease (the cases) with
other individual patients who do not have
the condition/disease but are otherwise
similar (the controls).

Individual participants in a case-control studyare selected for inclusion in the study based on their disease status
Cases = participants with the disease of interest
Controls = participants without the disease
Both cases and controls are asked the same set of questions about past exposures.

Framework for a Case-Control Study

Use
A case-control study is often the best study
approach when the disease or the
condition is relatively uncommon and
infrequent where a study of the general
population is unlikely to yield more than a
few cases.

Finding Cases
A key initial step is identifying an appropriate
and accessible source of individuals with the
disease of interest
Hospitals, specialty clinics, physicians’ offices,
public health agencies, disease registries, and
disease support groups may be able to assist
researchers in identifying individuals who are
likely to meet the study’s case definition

Case Definition
All cases must have the same disease,
disability, or other health-related condition
A case definition should specify exactly what
characteristics must be present or absent for a
person to be deemed a case

Finding Controls
Controls must be reasonably similar to
cases except for their disease status
The inclusion and exclusion criteria for
cases that do not specifically relate to
the disease should also apply to controls For example, if cases must be males between older than 60 years of
age, controls must also be males in this age group.

Finding Controls
Controls may be recruited from, among other
sources:
Friends and relatives of cases
Hospital or clinic patients without the disease of
interest
The general population

Matching
There are 3 basic options for matching
cases and controls:
no matching
frequency (group) matching
matched-pairs (individual) matching

Many case-control studies use no matching.
They assume that similar inclusion and
exclusion criteria for cases and controls will
result in case and control populations that
have similar distributions according to age
group, gender, socioeconomic status, and
other characteristics.
Matching

The goal of frequency (group) is to recruit a
control population that is similar to the case
population.
Individual cases are not tied to individual
controls during analysis.
Matching
Example: For each hospital case a
researcher identifies select one control from
the hospital registration files who was
admitted the same week as the case, who is
the same gender as the case, and who is
within ± 0-3 years of the age of the case.
Matching
In matched-pairs (individual) matching, each case
is personally linked to a particular individual
control.
This approach is fairly common in genetic studies,
in which a case is linked to a genetic sibling or
other close genetic relative for analysis.
This kind of matched-pairs approach requires a
special type of analysis.
Matching
Limitations of Matching
The variables used as matching criteria
cannot be considered as exposures during
analysis. Example: If cases and controls are matched based age, then the cases
and controls in the study will have the same mean age, even if in the
general population cases tend to be older than non-cases.
It can be difficult to find controls who meet
all of the matching criteria when there are
many matching characteristics.

Misclassification Bias
All participants must be asked questions that confirm whether each is a case, a control, or neither of them
Adhering to strict definitions for what constitutes a case and what constitutes a control minimizes the risk of misclassification bias

Recall Bias
Recall bias occurs when cases and controls systematically have different memories of the
past
Cases may have more vivid memories than
controls of participation or lack of participation
in activities perceived to be risky or beneficial
because they are searching for explanations for
their illnesses

Analysis: Odds
Odds are the most familiar from their
connection with betting
A horse with an equal chance of winning a
race (50% likely to win) or of losing a race
(50% likely to lose) is said to have “even
odds,” or odds of 1 (50%/50%)

A case-control study compares the chance of having
had a particular exposure to not having had it
If 50% of the participants in a study report a history of
exposure and 50% report no exposure history, then the
odds of exposure are 50%/50%, or 1
If 25% report having the exposure and 75% do not, then
the odds are 25%/75%, or 0.33
If 2% report being exposed in the past and 98% report
no exposure, then the odds are 2%/98%, or 0.02
Analysis: Odds

Analysis: Odds
Odds ratio (OR) = the ratio of the odds of exposure in cases to the
odds of exposure in controls
Analysis: Odds

Analysis:
Odds
Ratios

OR = 1: the odds of exposure are the same
for cases and controls
OR > 1: cases have higher odds of exposure
than controls, implying that the exposure
was risky
OR < 1: cases have lower odds of exposure
than controls, implying that the exposure
was protective
Analysis: Odds

Analysis: OR & 95% CI
If the entire 95% confidence interval is less than 1,
then the OR is statistically significant, and the
exposure is deemed protective “Cases had greater odds of exposure than controls”
If the entire 95% confidence interval is greater than
1, then the OR is statistically significant, and the
exposure is deemed risky “Cases had lesser odds of exposure than controls.”

95% confidence interval (95% CI) overlaps
OR = 1 The lower end of the confidence interval is less than 1, suggesting
protection
The higher end of the confidence interval is greater than 1, suggesting risk
Conclusion: The OR is not statistically significant, and the exposure and
disease are deemed to have no association
Analysis: OR & 95% CI

Interpretation of the Odds Ratio Based on Its
95% Confidence Interval

Examples of Odds Ratio Calculations

Matched Case-Control Studies
Individually-matched case-control studies require the calculation of a matched-pairs odds ratio that uses a special kind of 22 table
A ratio of the number of times the case in a pair was exposed and the control was not to the number of times the control in a pair was exposed and the case was not provides an estimate for a special type of odds ratio

Matched-
Pairs Odds
Ratio

Key Characteristics of Case-
Control Studies

Case-Control Studies

Cohort Studies

a cohort is a group of individuals or subjects who have shared a
particular event together during a particular time span.
So, for a research project, a Cohort is going to be any group of similar people followed through time together.
A cohort study follows participants through time to calculate the rate at which new (incident) disease occurs and to identify risk factors for the disease

All cohort studies have at least 2 measurement
times:
An initial survey that determines the baseline
exposure and disease status of all participants
One or more follow-up assessments thatdetermine how many participants have
developed a new (incident) disease since the
initial examination

Framework for
a Cohort Study

Types of Cohort Studies
Cohort studies take many forms.
The 3 most important categories are:
Retrospective cohort
Prospective cohort
Longitudinal cohort

Retrospective & Prospective
Both retrospective and prospective cohort
studies recruit participants based on their exposure status
1st group of participants is recruited because
they are known to have had a given exposure
2nd group is recruited because they are
known not to have been exposed

Retrospective cohort studies use baseline information collected at some point in the pastand follow the cohort to another point in the past or to the present
Prospective cohort studies collect baseline data about exposures and outcomes in the present and follow the cohort to some point in the future
Retrospective & Prospective

Times of Baseline and Follow-Up
Data Collection for Cohort
Studies

Recruiting based on exposure status makes
retrospective and prospective cohort studies the
optimal study approaches for uncommon exposures.
Indeed, the goal of cohort studies is to examine
incident disease, retrospective and prospective
cohort studies must be able to demonstrate that the
outcome of interest was not present in any members
of the cohort at baseline.
Retrospective & Prospective

The members of the two comparison groups
for both prospective and retrospective of
studies should be similar except for their exposure status.
Retrospective & Prospective

Examples:
Recruit industrial workers exposed to a certain
chemical and similar workers in a plant that does
not use that chemical
Recruit children with high blood lead levels and
low blood lead levels who attend the same
elementary school
Retrospective & Prospective

Longitudinal Studies
Longitudinal cohort studies recruit participants based on their membership in a well-defined source population, then follow them forward in time
Individual participants are assessed at baseline for several exposures and diseases.
Then they are followed forward in time to determine the incidence rate for one or more outcomes of interest.

Examples of populations for a longitudinal study:
All the residents of one town
A representative sample of members of one professional organization
A representative group of students recruited from the same university
Longitudinal Studies
In a longitudinal study with a fixed population, all participants start the study at the same time and
no one is allowed to join later
In a study with a dynamic population, participants
are recruited using rolling admission and
replacement of dropouts For dynamic populations, the time to follow up is usually based on individual
participants’ dates of enrollment rather than on a fixed calendar date
Longitudinal Studies

Longitudinal Studies

Retention
For prospective and longitudinal studies, loss of participants to follow-up before the end of the study period is a major concern.
Researchers must develop strategies that minimize the burden of participation and that maximize interest in continuing to participate.

Information Bias
All participants must complete the same assessments of exposure and disease at
baseline and follow-up to prevent the information bias that might result when
exposed participants are more thoroughly examined for disease than unexposed
participants.

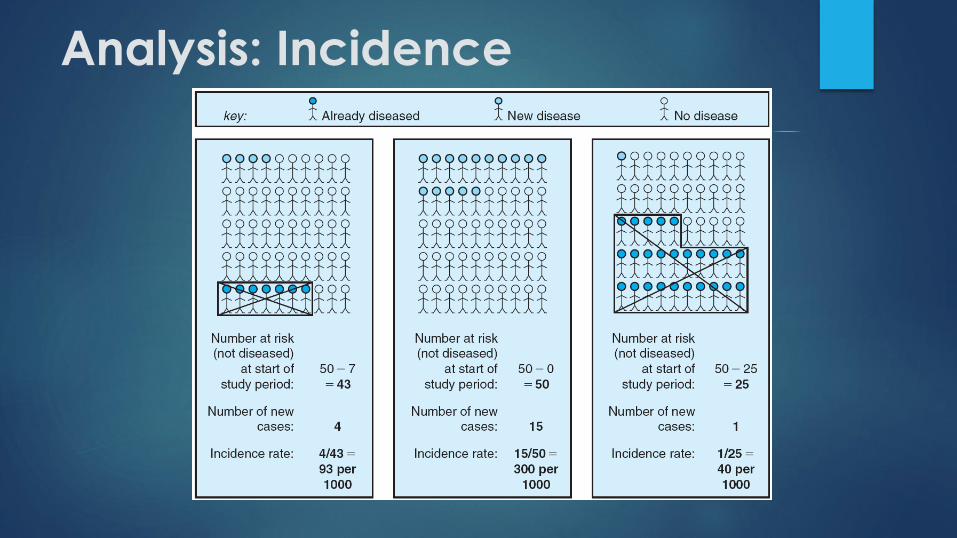
Analysis: Incidence
Incidence rate = the number of new cases of disease in a population during a specified period of time divided by the total number of persons in the population who were at risk during that period
Individuals who already have the disease of interest at the start of the study period are not at risk of getting new disease, so they are removed from the denominator
Analysis: Incidence

Analysis: Person-Years
Some cohort studies use person-time as a denominator
rather than simply counting persons
Person-time is a way of accounting for different
individuals in the study population being observed for
different lengths of time
Example: Over 4 years in a dynamic study, 10
participants may contribute 33 person-years of
observation

Person-Year Analysis

Analysis: Attributable Risk
Excess risk = attributable risk (AR) = the absolute difference in the incidence rate between the exposed population and the unexposed population
Example: If 10% of the unexposed and 15% of the exposed became ill during the study period, then the excess risk in the exposed was 15% – 10% = 5%
This number represents the additional risk of disease in the exposed that can be attributed to the exposure

Analysis: AR%
Attributable risk percent (AR%) = the proportion of incident cases among the exposed that are
due to the exposure
Example: If 10% of the unexposed and 15% of
the exposed became ill during the study
period, then the AR% is 5% 15% = 33%
1/3 of the cases of disease in the exposed
could have been prevented if the exposure
was removed

Attributable
(Excess)
Risk
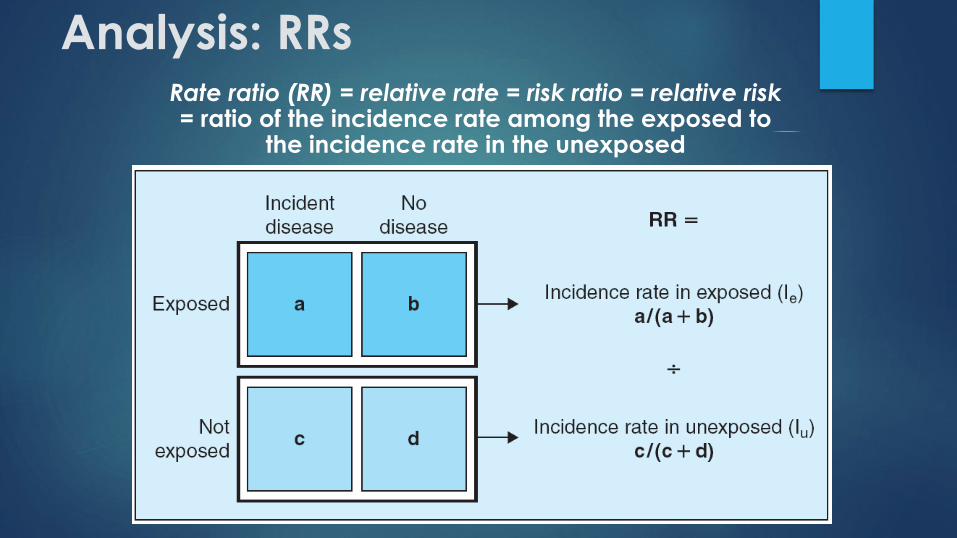
Analysis: RRsRate ratio (RR) = relative rate = risk ratio = relative risk = ratio of the incidence rate among the exposed to
the incidence rate in the unexposed

Analysis: RRs
RR = 1: the incidence rate was the same in the
exposed and in the unexposed, so the exposure is not
associated with the disease
RR > 1: then the incidence rate was higher in the
exposed than in the unexposed, so the exposure was
risky
RR < 1: the incidence rate was lower in the exposed
than in the unexposed, so the exposure was
protective

Analysis: RR & 95% CI
If the entire 95% confidence interval is less
than 1, then the RR is statistically significant,
and the exposure is protective in the study
population
If the entire 95% confidence interval is
greater than 1, then the RR is statistically
significant, and the exposure is a risk factor
for disease in the study population

95% confidence interval (95% CI) overlaps RR = 1 The lower end of the confidence interval is less than 1, suggesting protection
The higher end of the confidence interval is greater than 1, suggesting risk
Conclusion: The RR is not statistically significant, and the exposure and disease are
deemed to have no association
Analysis: RR & 95% CI

Interpretation of the Rate Ratio Based on
Its 95% Confidence Interval

Examples of
Rate Ratio
Calculations
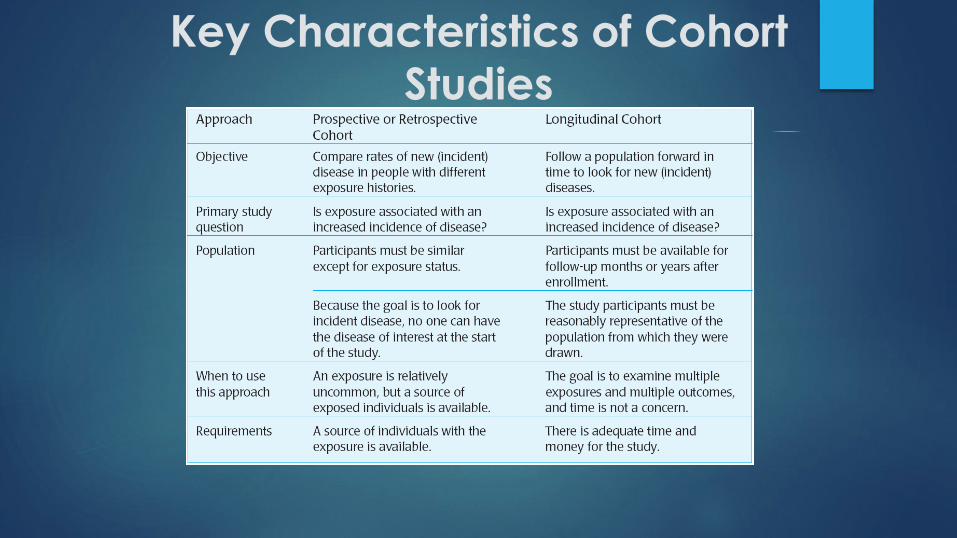
Key Characteristics of Cohort
Studies
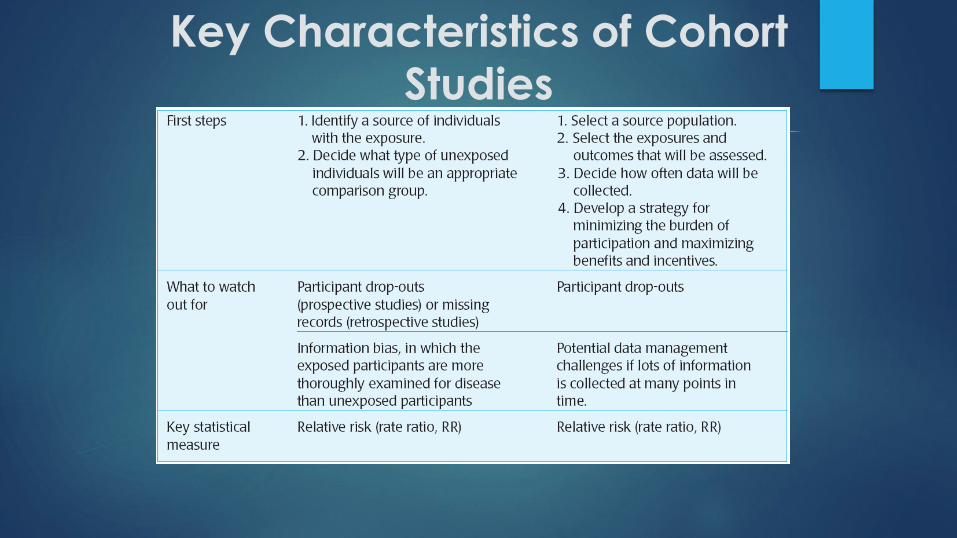
Key Characteristics of Cohort
Studies

PHC215
By Dr. Khaled Ouanes Ph.D.
E-mail: [email protected]
Twitter: @khaled_ouanes
HEALTHCARE RESEARCH METHODS
Based on the textbook of introduction to health research methods – K.H. Jacobsen