Embed Size (px)
Citation preview
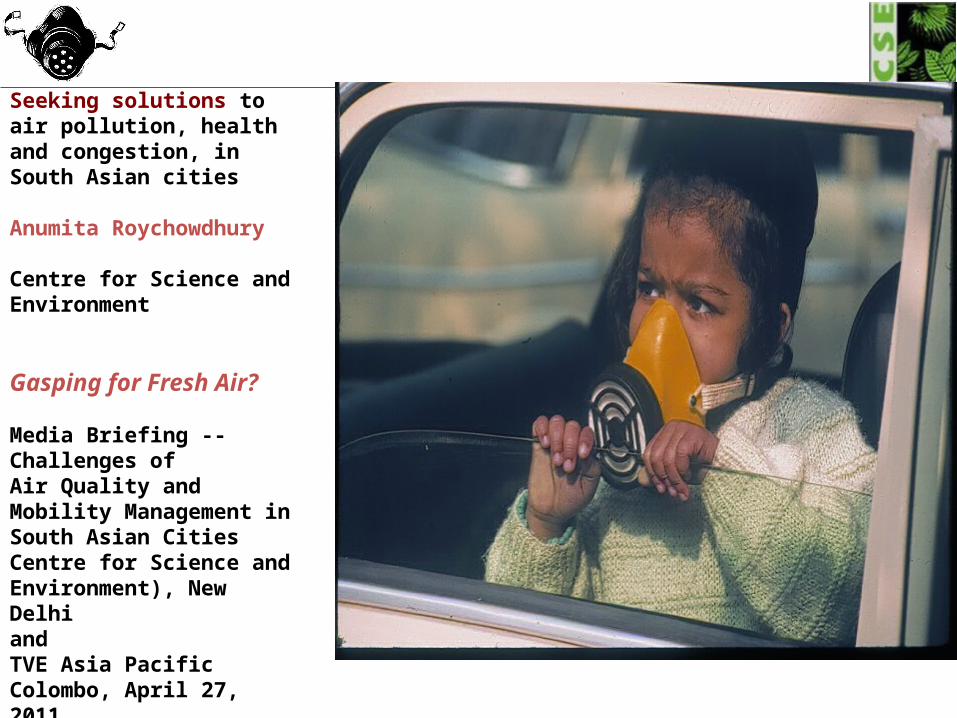
Seeking solutions to air pollution, health and congestion, in South Asian cities
Anumita Roychowdhury
Centre for Science and Environment
Gasping for Fresh Air?
Media Briefing -- Challenges ofAir Quality and Mobility Management in South Asian CitiesCentre for Science and Environment), New DelhiandTVE Asia Pacific Colombo, April 27, 2011
Cities under global spotlight
1950-2006: Urban population of the world has increased from 739 million to 3.2 billion.
By 2025 around 65 per cent of the world’s population is projected to live in cities.
By 2010 more than 75 per cent of the world’s urban population will live in poorer countries (State of the World 2007).
More than 40 per cent of the world children are estimated to be living in polluted cities of developing world (WHO).
A billion more will be added over the next three decades in Asia – almost adding a whole new India. More than half of them will be living in cities
What about South Asia?
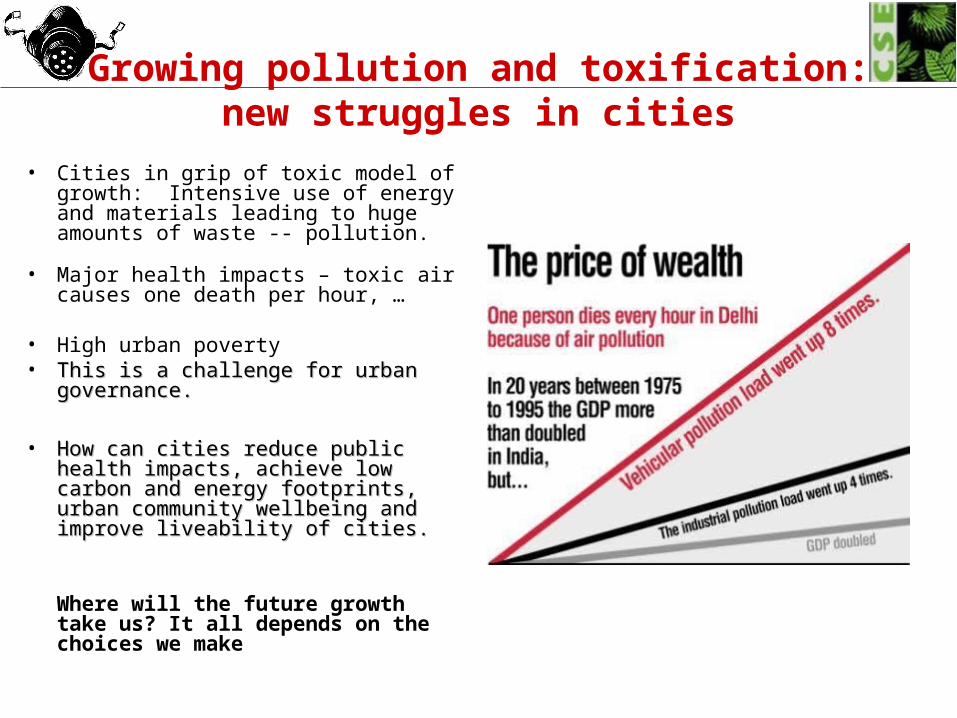
Growing pollution and toxification: new struggles in cities
• Cities in grip of toxic model of growth: Intensive use of energy and materials leading to huge amounts of waste -- pollution.
• Major health impacts – toxic air causes one death per hour, …
• High urban poverty• This is a challenge for urban governance. This is a challenge for urban governance.
• How can cities reduce public health How can cities reduce public health impacts, achieve low carbon and energy impacts, achieve low carbon and energy footprints, urban community wellbeing footprints, urban community wellbeing and improve liveability of cities.and improve liveability of cities.
Where will the future growth take us? It all depends on the choices we make
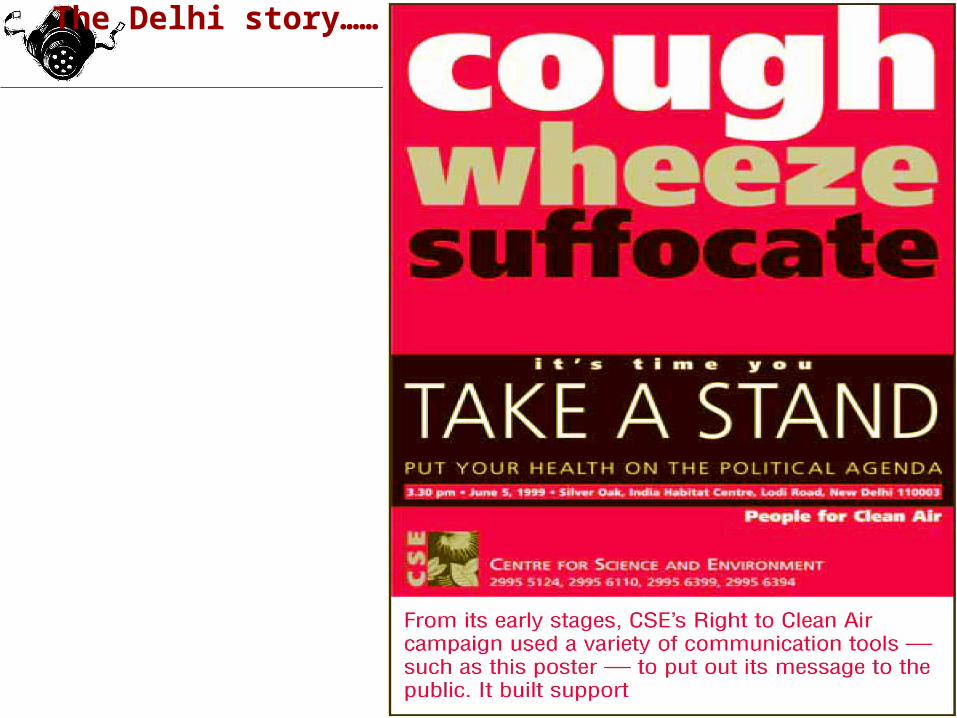
The Delhi story……
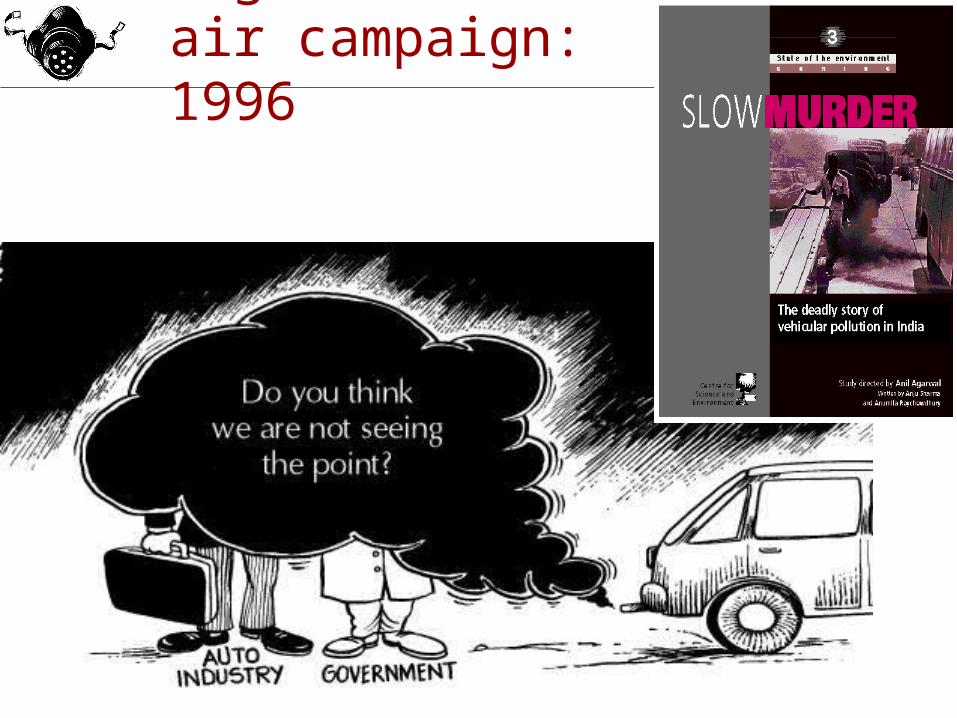
Right to clean air campaign: 1996
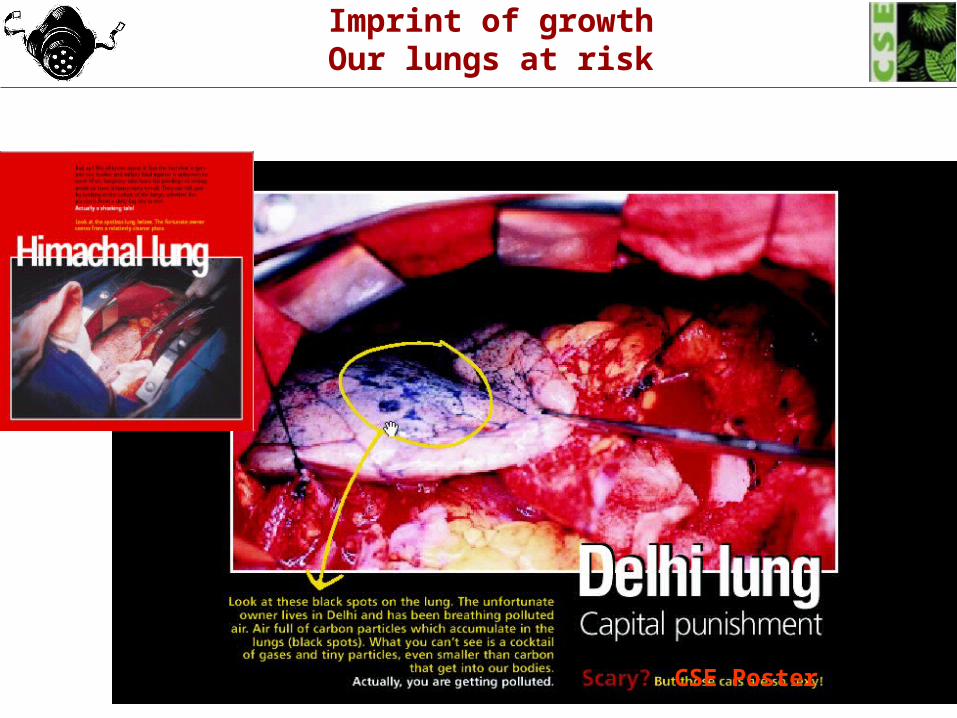
Imprint of growthOur lungs at risk
CSE Poster
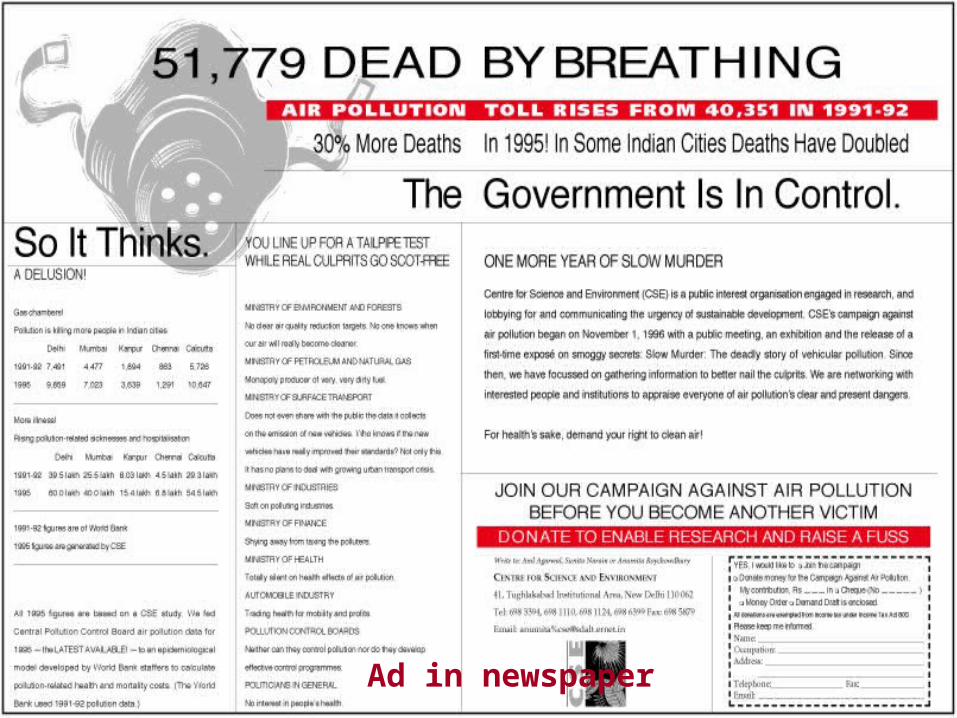
Ad in newspaper
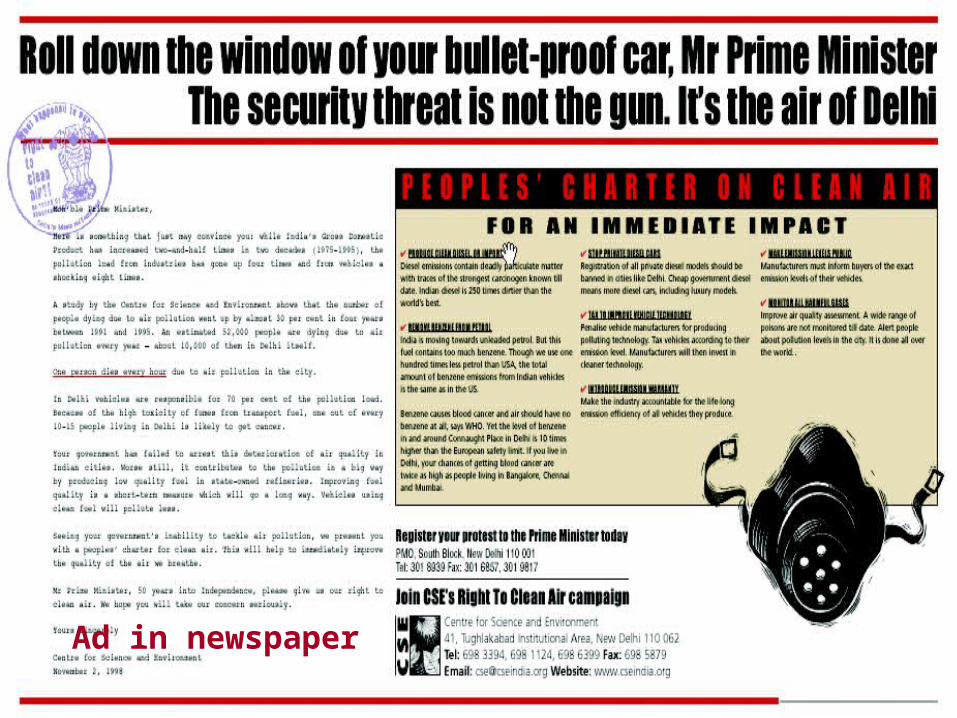
Ad in newspaper
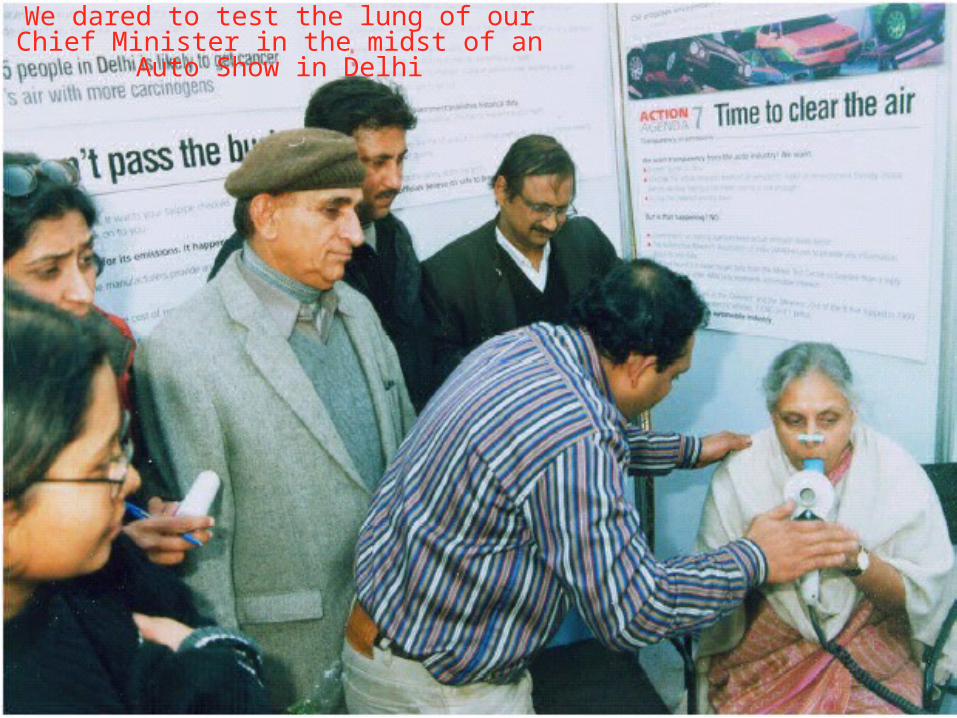
We dared to test the lung of our Chief Minister in the midst of an Auto Show in Delhi
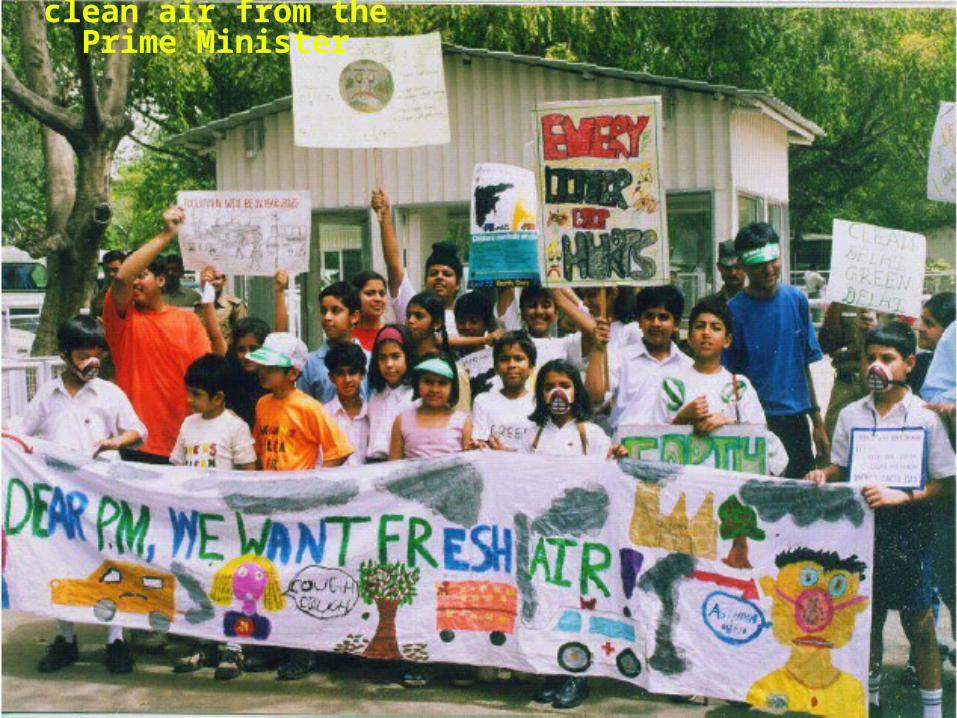
Children demanded clean air from the Prime Minister
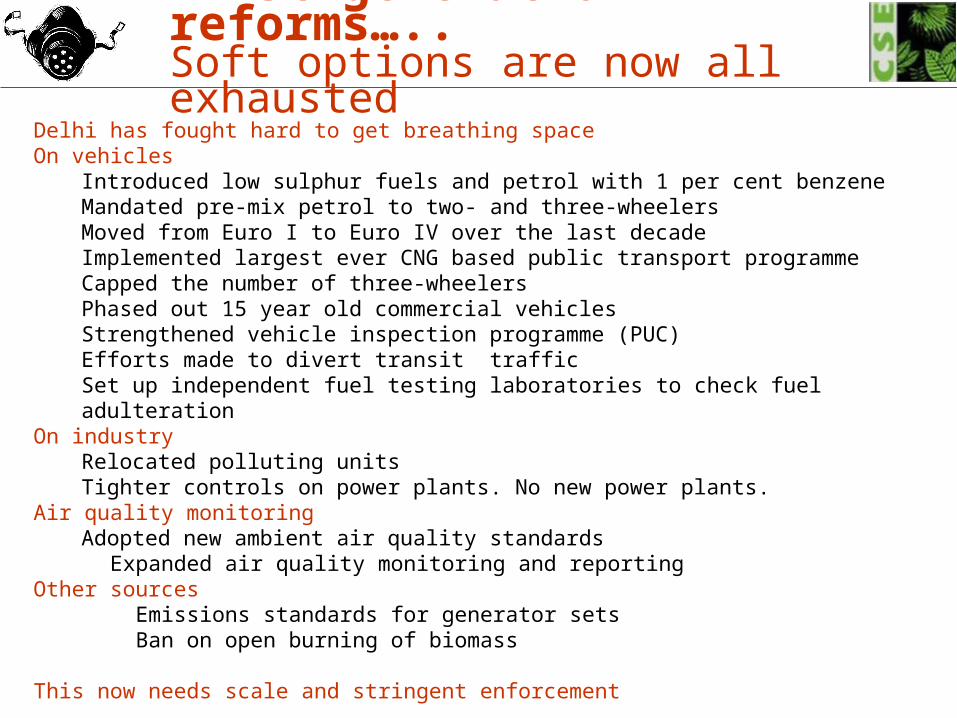
Delhi has fought hard to get breathing spaceOn vehicles
Introduced low sulphur fuels and petrol with 1 per cent benzene Mandated pre-mix petrol to two- and three-wheelers Moved from Euro I to Euro IV over the last decadeImplemented largest ever CNG based public transport programmeCapped the number of three-wheelersPhased out 15 year old commercial vehiclesStrengthened vehicle inspection programme (PUC)Efforts made to divert transit trafficSet up independent fuel testing laboratories to check fuel adulteration
On industryRelocated polluting unitsTighter controls on power plants. No new power plants.
Air quality monitoringAdopted new ambient air quality standards
Expanded air quality monitoring and reportingOther sources Emissions standards for generator sets Ban on open burning of biomass
This now needs scale and stringent enforcement
First generation reforms….. Soft options are now all exhausted
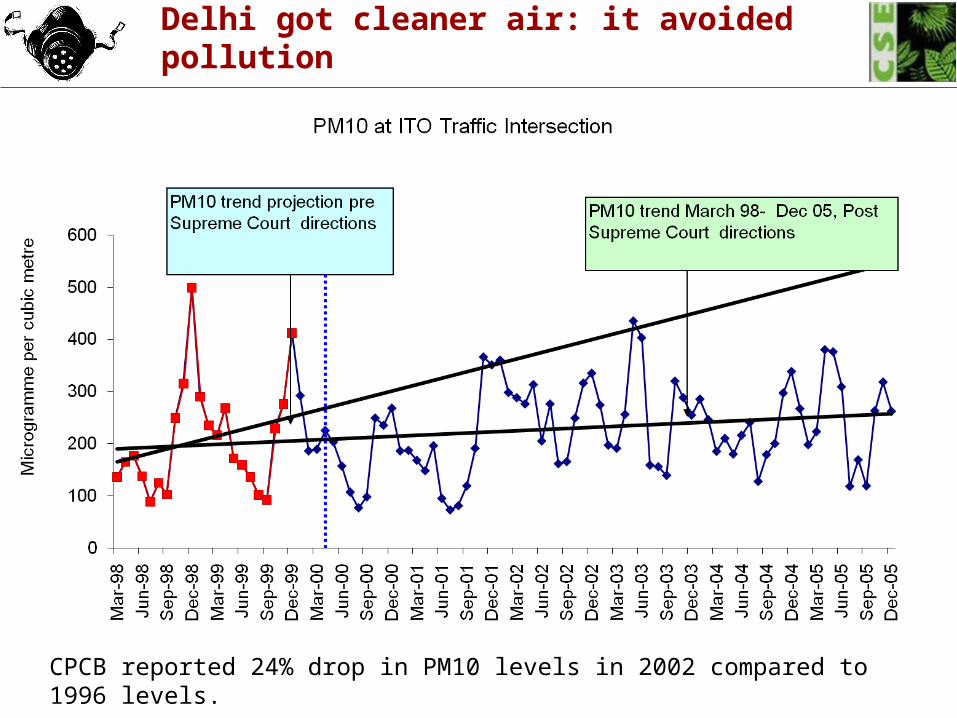
Delhi got cleaner air: it avoided pollution
CPCB reported 24% drop in PM10 levels in 2002 compared to 1996 levels.
Source: CSE: based on NAMP data, CPCB, and World Bank 2004
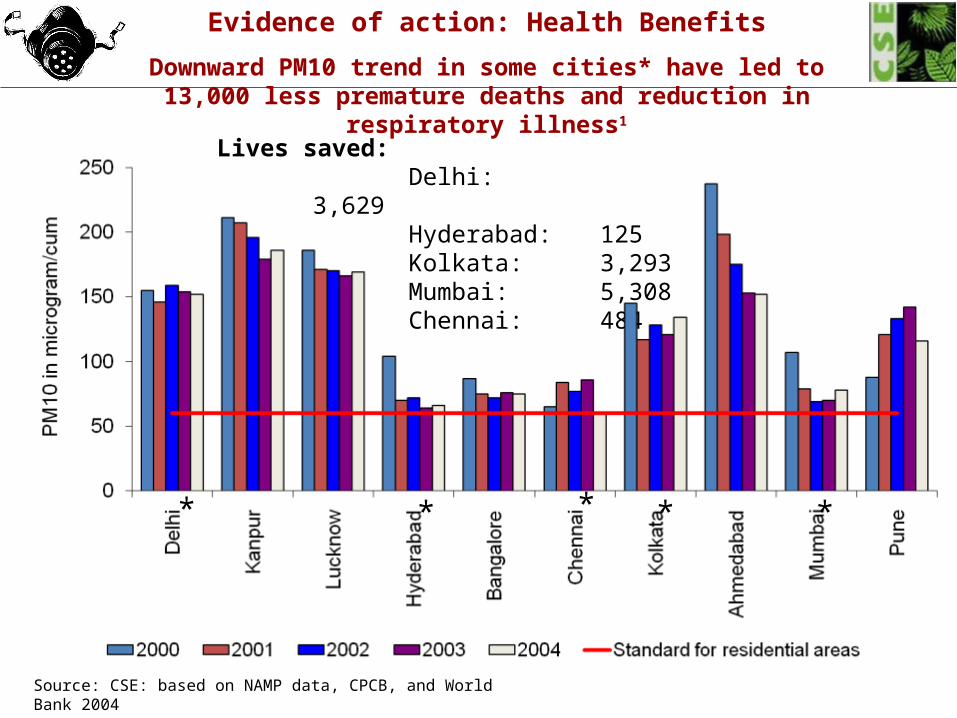
Evidence of action: Health Benefits
Downward PM10 trend in some cities* have led to 13,000 less premature deaths and reduction in
respiratory illness1
* * ** *
Lives saved:Delhi: 3,629Hyderabad: 125Kolkata: 3,293Mumbai: 5,308Chennai: 484
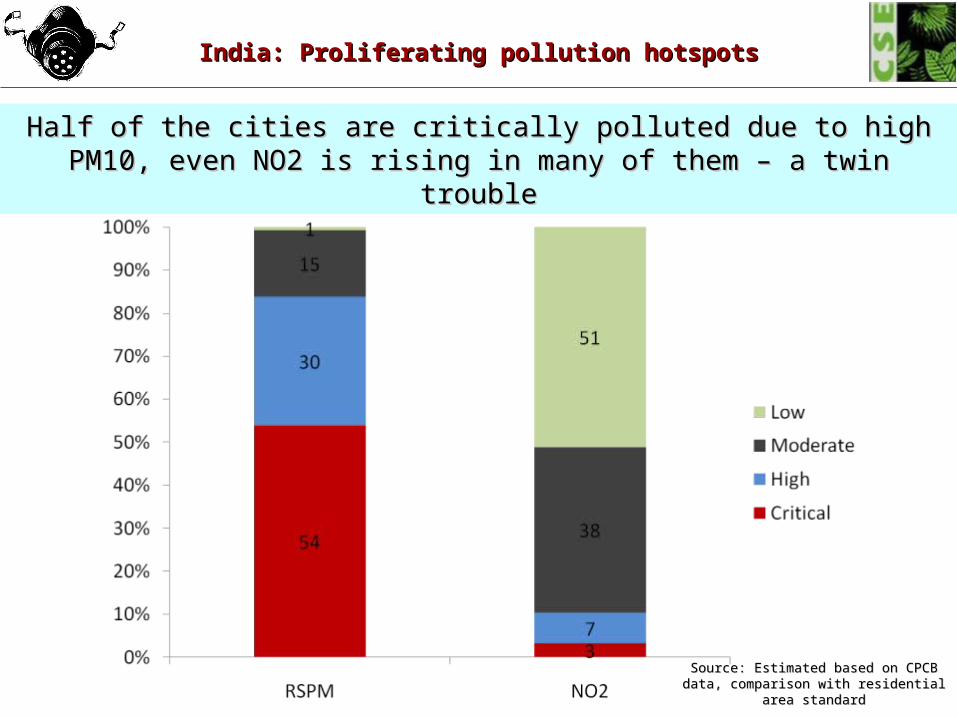
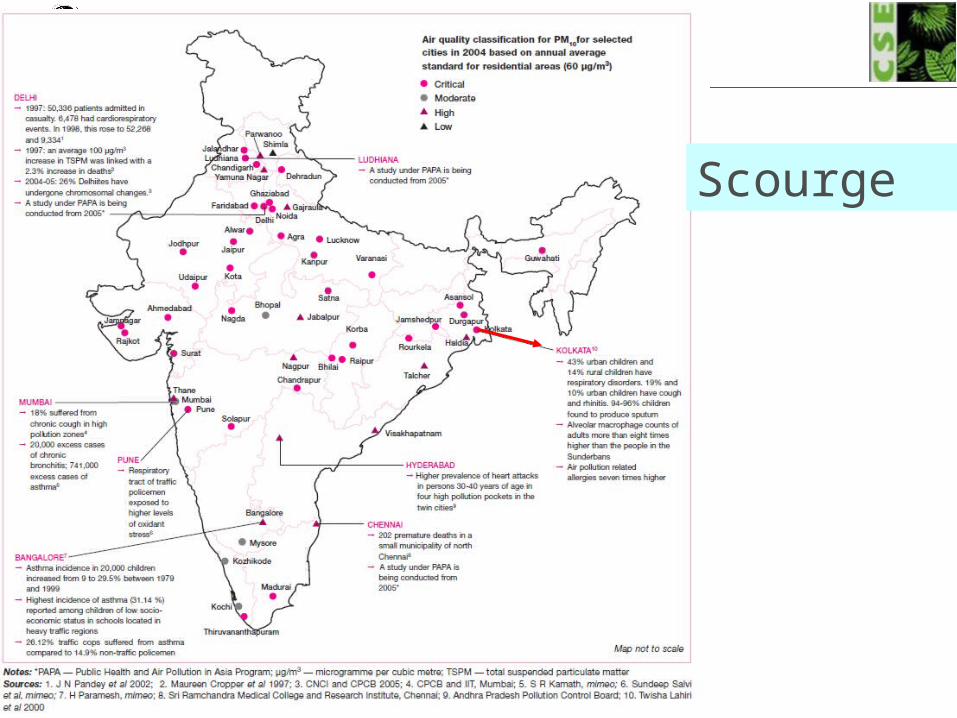
India: Proliferating pollution hotspotsIndia: Proliferating pollution hotspots
Source: Estimated based on CPCB data, Source: Estimated based on CPCB data, comparison with residential area standardcomparison with residential area standard
Half of the cities are critically polluted due to high PM10, even NO2 is rising Half of the cities are critically polluted due to high PM10, even NO2 is rising in many of them – a twin troublein many of them – a twin trouble
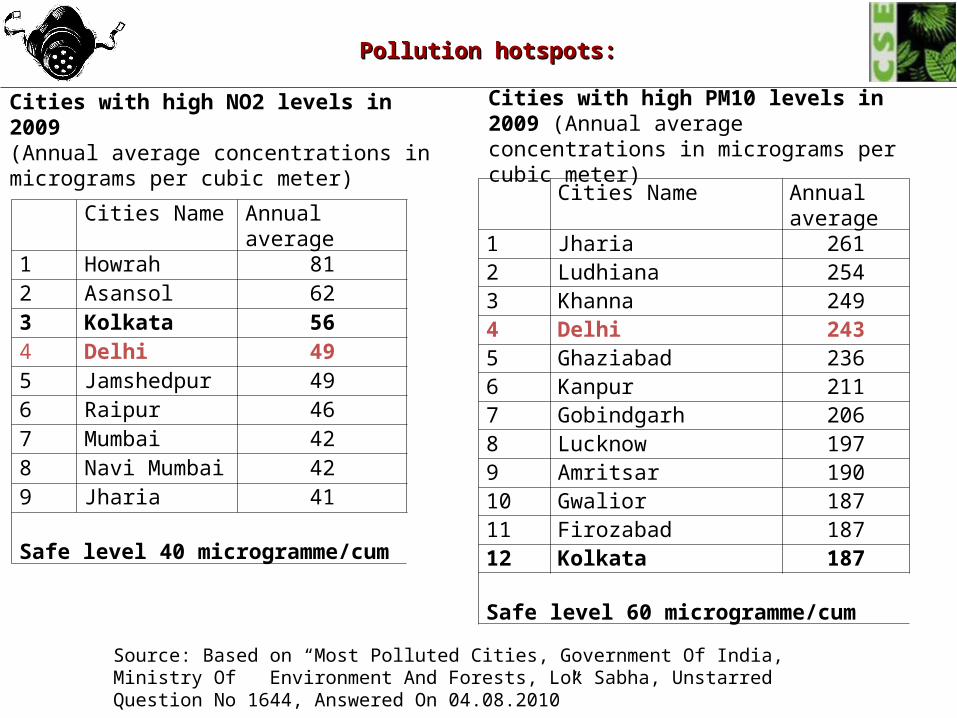
Pollution hotspots: Pollution hotspots:
Cities Name Annual average
1 Howrah 812 Asansol 623 Kolkata 564 Delhi 495 Jamshedpur 496 Raipur 467 Mumbai 428 Navi Mumbai 429 Jharia 41
Safe level 40 microgramme/cum
Cities with high NO2 levels in 2009 (Annual average concentrations in micrograms per cubic meter)
Source: Based on “Most Polluted Cities, Government Of India, Ministry Of Environment And Forests, Lok Sabha, Unstarred Question No 1644, Answered On 04.08.2010”
Cities Name Annual average
1 Jharia 2612 Ludhiana 2543 Khanna 2494 Delhi 2435 Ghaziabad 2366 Kanpur 2117 Gobindgarh 2068 Lucknow 1979 Amritsar 19010 Gwalior 18711 Firozabad 18712 Kolkata 187
Safe level 60 microgramme/cum
Cities with high PM10 levels in 2009 (Annual average concentrations in micrograms per cubic meter)
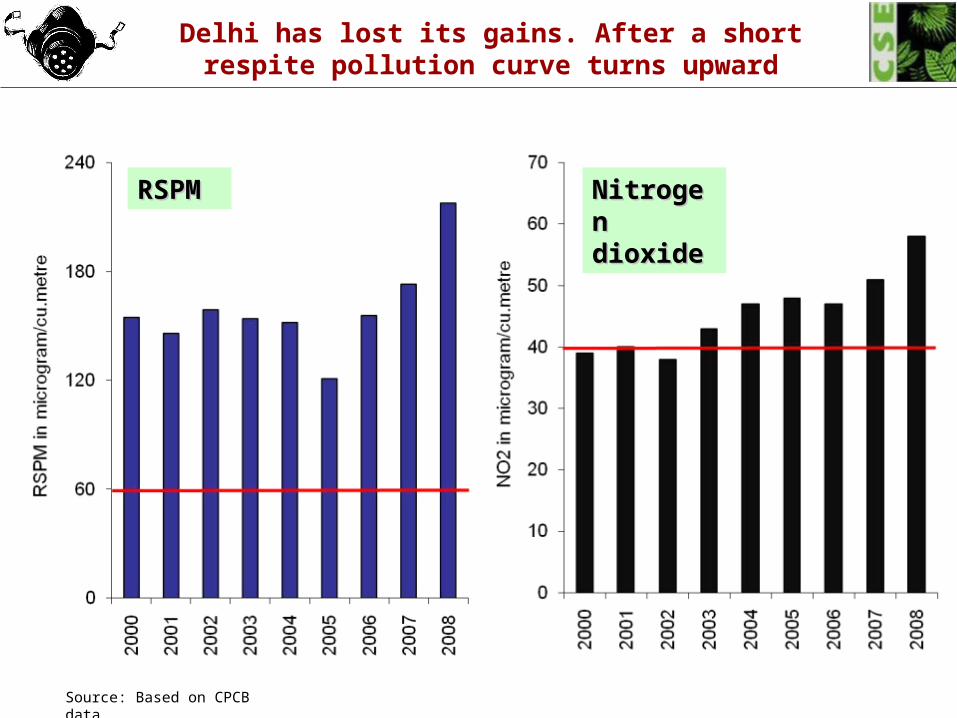
Delhi has lost its gains. After a short respite pollution curve turns upward
RSPMRSPM Nitrogen Nitrogen dioxidedioxide
Source: Based on CPCB data
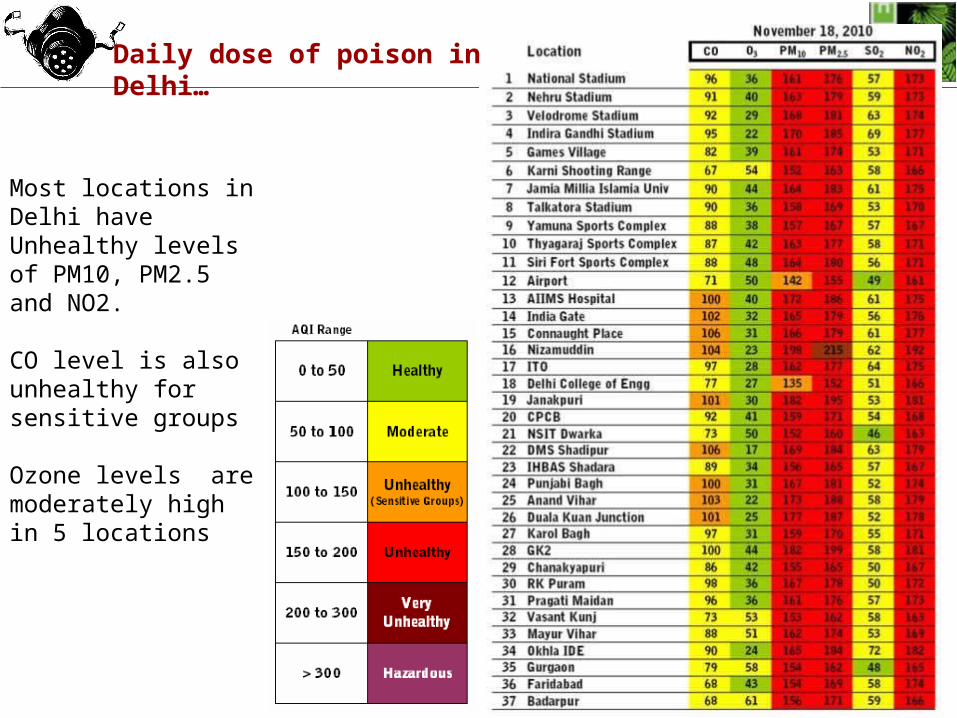
Most locations in Delhi have Unhealthy levels of PM10, PM2.5 and NO2.
CO level is also unhealthy for sensitive groups
Ozone levels are moderately high in 5 locations
Daily dose of poison in Delhi…
First generation action in ColomboColombo has already initiated series of action to clean up its air:
• Introduced Euro I/II standards for vehicles
• Mandatory annual vehicle emission testing programme launched in 2008. 5% of vehicles failed and removed from fleet
• Importation of 2-stroke vehicles banned.
• Conversion of 3-wheelers to LPG/CNG/electric
• Construction of refinery that can produce Euro IV diesel by 2012. Feasibility study being done for expansion of refineries.
• Plans to introduce Euro 4 in 2012
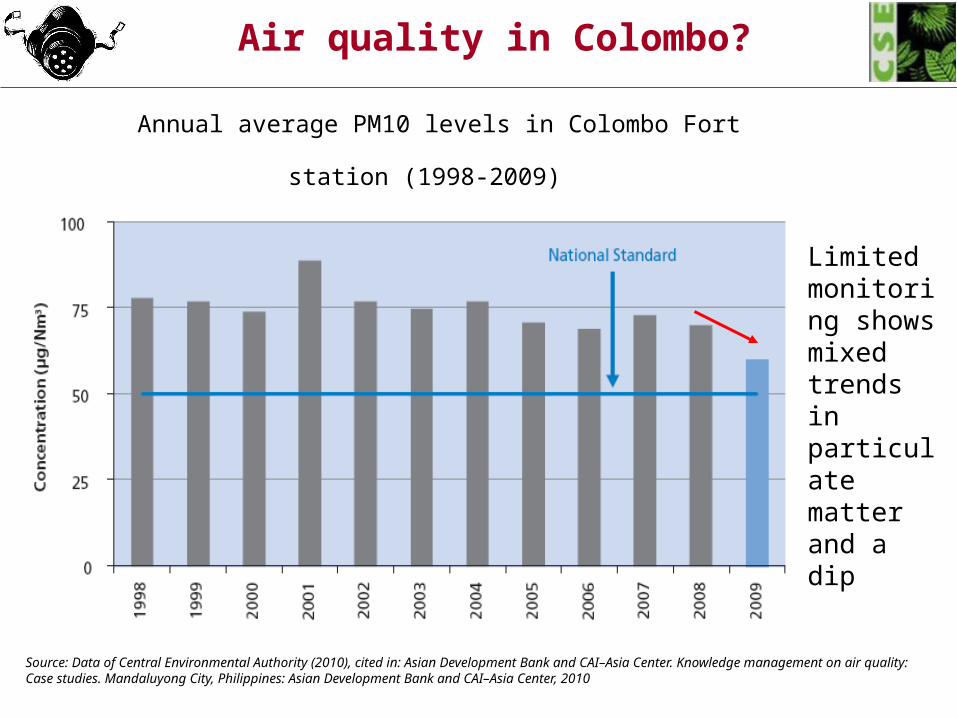
Annual average PM10 levels in Colombo Fort station (1998-2009)
Source: Data of Central Environmental Authority (2010), cited in: Asian Development Bank and CAI–Asia Center. Knowledge management on air quality: Case studies. Mandaluyong City, Philippines: Asian Development Bank and CAI–Asia Center, 2010
Air quality in Colombo?
Limited monitoring shows mixed trends in particulate matter and a dip
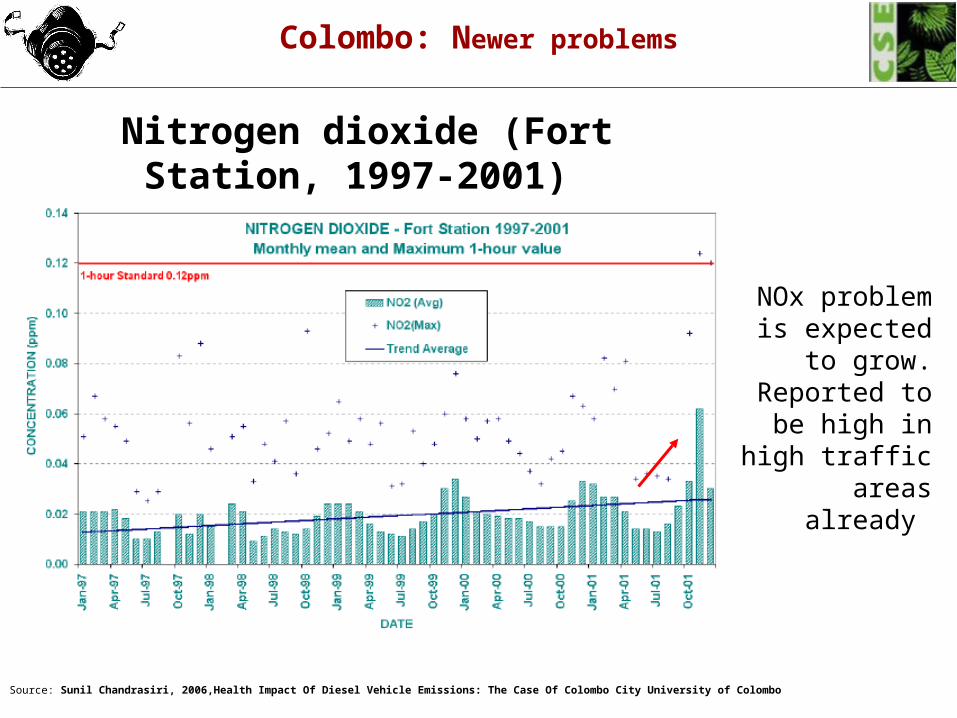
Nitrogen dioxide (Fort Station, 1997-2001)
Source
NOx problem is expected to
grow. Reported to be high in
high traffic areas already
Colombo: Newer problems
Source: Sunil Chandrasiri, 2006,Health Impact Of Diesel Vehicle Emissions: The Case Of Colombo City University of Colombo
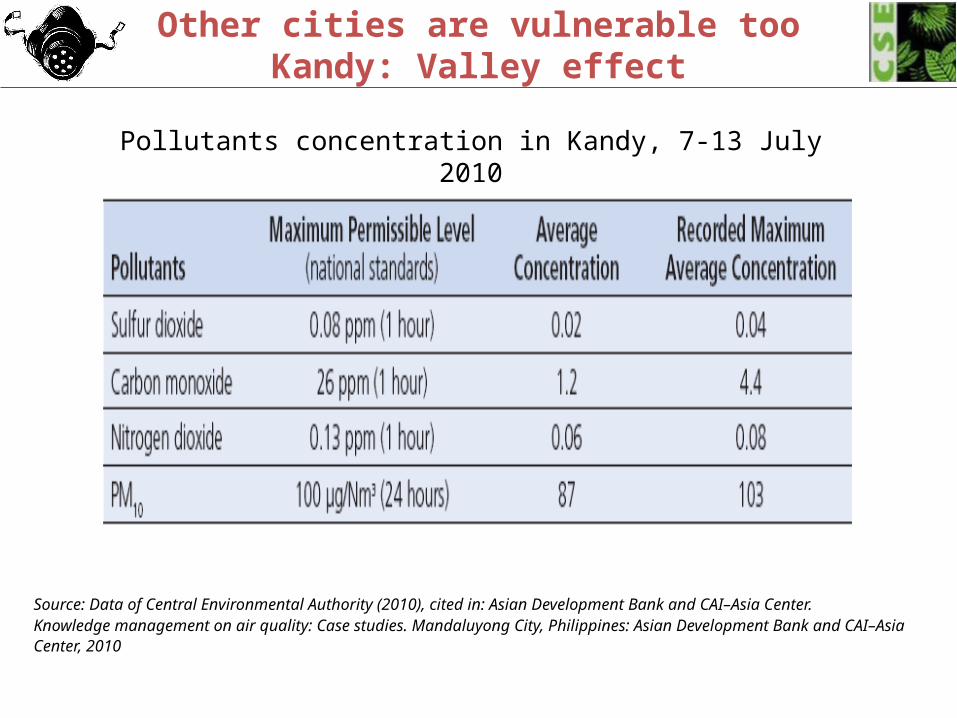
Other cities are vulnerable tooKandy: Valley effect
Source: Data of Central Environmental Authority (2010), cited in: Asian Development Bank and CAI–Asia Center. Knowledge management on air quality: Case studies. Mandaluyong City, Philippines: Asian Development Bank and CAI–AsiaCenter, 2010
Pollutants concentration in Kandy, 7-13 July 2010
As the bar of health protection is raised more locations show up on the critical and highly polluted list
• Sri Lanka has set stringent national ambient air quality standards
• India has tightend the national ambient air quality standards. This has changed the air quality status of locations in India--- – The new PM10 standards have increased the total number of
critically polluted locations from 123 to 176– After the new nitrogen dioxides overall 17 locations are in
critical rank now as opposed to 6 earlier; highly polluted locations have increased from 13 to 41. and highly polluted industrial locations have increased from 3 to 19.
– Critically polluted residential locations for NO2 have increased from none to 8, and highly polluted from 8 to 20.
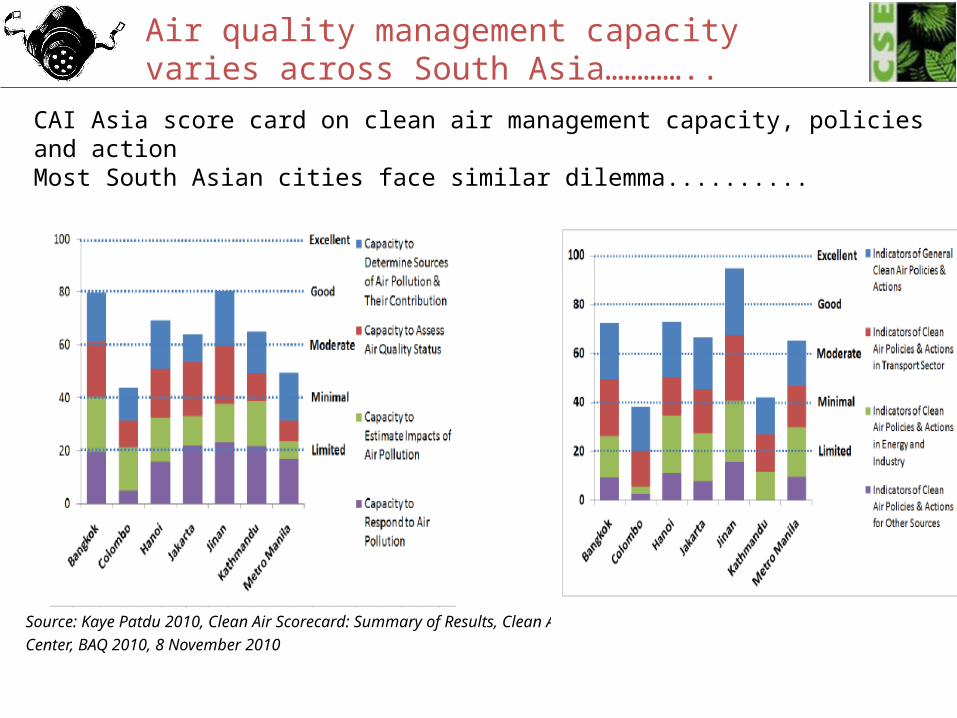
CAI Asia score card on clean air management capacity, policies and action Most South Asian cities face similar dilemma..........
Source: Kaye Patdu 2010, Clean Air Scorecard: Summary of Results, Clean Air Initiative for Asian Cities (CAI-Asia) Center, BAQ 2010, 8 November 2010
Air quality management capacity varies across South Asia…………..
In India no punitive action on state governments for not meeting the ambient air quality norms.
Abatement plans are not designed to meet local air quality targets
Emissions regulations are kept weaker for most of India.
In the US the air quality standards are federally enforceable. EPA impose sanctions if states fail to meet the air quality targets -- such as cut highway funds. Civil society can sue the state governments. “Citizen Court Suits” allowed against EPA for failure to promulgate NAAQS, emissions standards or implement state implementation plans.
In India the eleventh five year plan mandates the central government to set monitorable target of air quality -- achieve the standards of air quality in all major cities by 2011–12
Ensure enforcement of air quality standards, accountability and compliance.
National Air Quality Standards must be made legally enforceable
Evokes principles underlying environmental governance Right to Life The precautionary principle The polluter pay principle
Basis of the court rulingsArticle 21: The right to wholesome environment incorporated into a fundamental right
to life under article 21 of the Constitution.
Article 39: The state shall direct its policy towards securing health …
Article 47: Duty of the state to raise the level of nutrition and standard of living to protect public health…
Article 48: protection and improvement of environment…
In India Courts uphold our rights to clean air and health`

Our health must matter………….
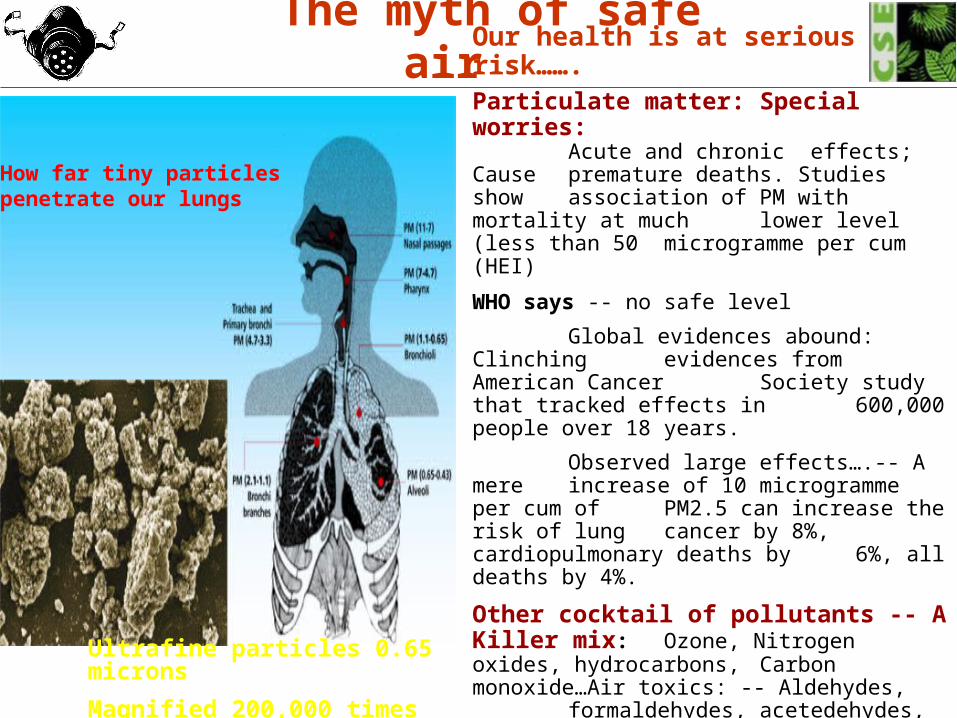
The myth of safe air
Ultrafine particles 0.65 microns
Magnified 200,000 times
How far tiny particles penetrate our lungs
Our health is at serious risk…….Particulate matter: Special worries:
Acute and chronic effects; Cause premature deaths. Studies show
association of PM with mortality at much lower level (less than 50 microgramme per cum (HEI)
WHO says -- no safe level
Global evidences abound: Clinching evidences from American Cancer Society study that tracked effects in 600,000 people over 18 years.
Observed large effects….-- A mere increase of 10 microgramme per cum of PM2.5 can increase the risk of lung cancer by 8%, cardiopulmonary deaths by 6%, all deaths by 4%.
Other cocktail of pollutants -- A Killer mix: Ozone, Nitrogen oxides, hydrocarbons, Carbon monoxide…Air toxics: -- Aldehydes, formaldehydes, acetedehydes, benzene, 1,3 butadiene, metals, PAH
etc……..Dangerous at trace levels
Scourge
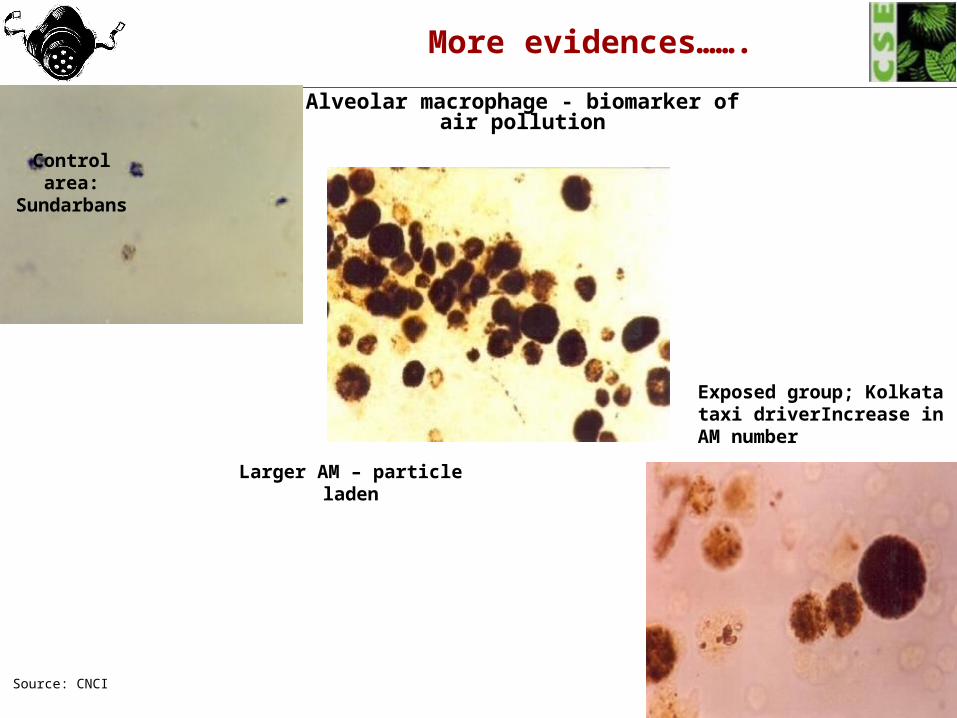
Alveolar macrophage - biomarker of air pollution
Exposed group; Kolkata taxi driverIncrease in AM number
Larger AM – particle laden
Control area: Sundarbans
Source: CNCI
More evidences…….
Emerging evidences in Colombo
• Study by NBRO and the Faculty of Medicine, University of Colombo: Found a significant association between ambient air pollution (SO2 and NOx) and acute childhood wheezing episodes in Colombo. Children experiencing wheezing (and requiring nebulization) were observed and found to be statistically significant (Senanayake et al. 1999)
• Field observations indicate that children require more frequent medical visits than in the past. School absenteeism has become common especially among children.
• Senior citizens often experience difficulties in breathing, coughing and chest tightness. These illnesses become prominent during certain seasons when pollution accumulation takes place in Colombo.
• The application of WHO health impact assessment shows that nearly 20% of Asthma cases recorded at LRH could be attributed to PM10. 4% of total cases for hospital admissions for respiratory diseases and respiratory mortality in general could be attributed to PM10 pollution in Colombo (2005)
• Studies attribute Rs 22- 17 billion to health damage cost owing auto diesel emissions in Colombo. Diesel vehicles are responsible for 96%-89% of SO2 and PM10 from the transportation sector (Sunil Chandrasiri 2006).
India’s unique public health challenge
• The Asiawide review of existing studies show that the estimated health effects are similar to those found in the extensive studies in western countries.
• But the risk in India could be more serious. Science has yet to assess the unique risk factors in Asia
• Extremely high levels of particulates and pollution cocktail -- the problem of exposure to multiple pollutants
• Impact of poverty: Socio economic variables are not included in health studies to influence public policy. Sporadic studies elsewhere show poor are more susceptible
• Understand risk transition
Pollution comes from a variety of sources…… Why are we specially worried about vehicles?
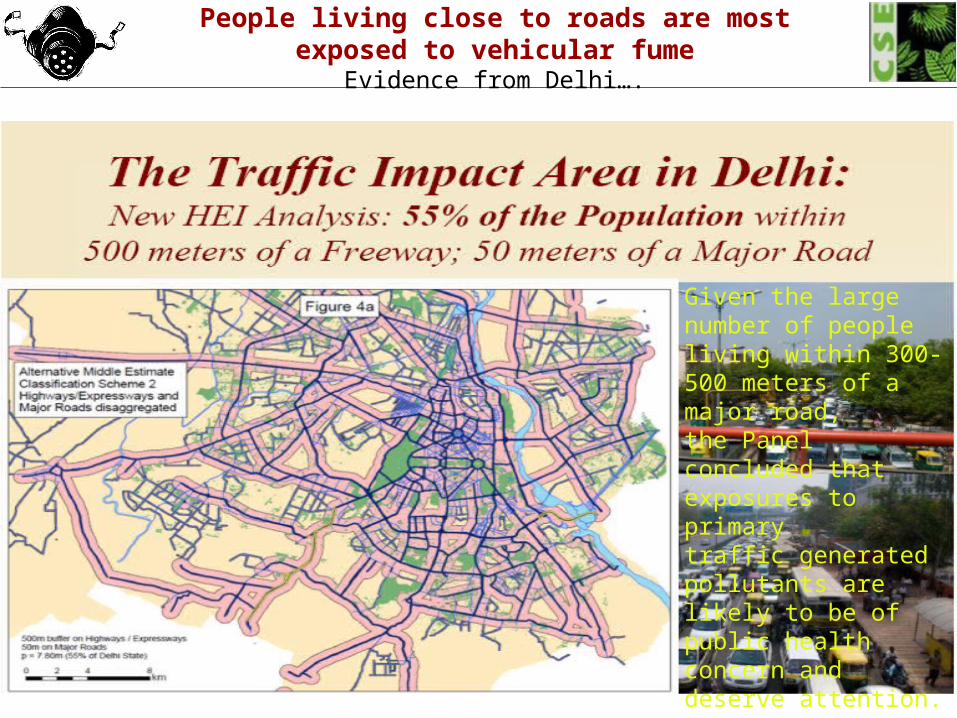
People living close to roads are most exposed to vehicular fumeEvidence from Delhi….
Given the large number of peopleliving within 300- 500 meters of a major road,the Panel concluded that exposures to primarytraffic generated pollutants are likely to be ofpublic health concern and deserve attention.
Chennai
Vehicles83%
domestic and biomass burning
2%
industrial11%
bakeries/hotels4%
Bangalore
Vehicles63%domestic and
biomass burning5%
industrial22%
DG stes10%
Kanpur
Vehicles24%
domestic and biomass burning
22%garbage/agricult
ure/landfill burning
10%
industrial38%
DG stes1%
bakeries/hotels4%
others1%
Pune
Vehicles53%
domestic and biomass burning
21%
industrial4%
others13%
bakeries/hotels9%
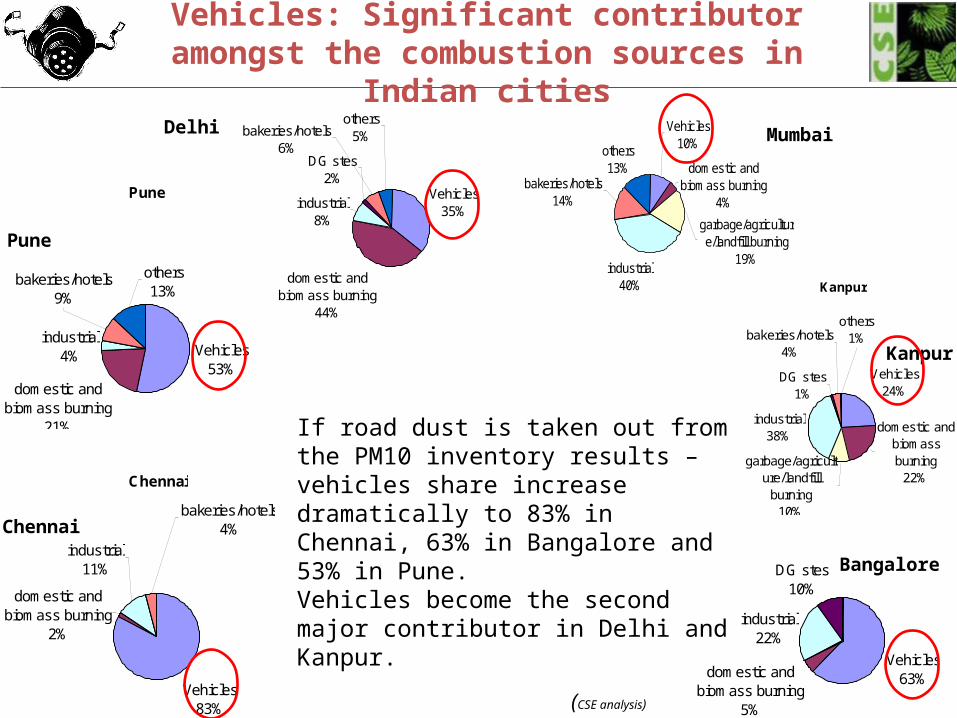
Vehicles: Significant contributor amongst the combustion sources in Indian cities
Vehicles35%
domestic and biomass burning
44%
industrial8%
DG stes2%
others5%bakeries/hotels
6%
Vehicles10%
domestic and biomass burning
4%
industrial40%
others13%
garbage/agriculture/landfill burning
19%
bakeries/hotels14%
(CSE analysis)
Kanpur
Bangalore
Pune
Chennai
Delhi Mumbai
If road dust is taken out from the PM10 inventory results – vehicles share increase dramatically to 83% in Chennai, 63% in Bangalore and 53% in Pune.Vehicles become the second major contributor in Delhi and Kanpur.
Vehicles major source of air pollution in Colombo
• Vehicles contribute overwhelmingly to the air pollution load in Colombo --- Transport sector contributes about 60% to air pollution
• More than industries and power plants emissions
• Air pollution problems have also been reported in other Sri Lanka cities such as Kandy
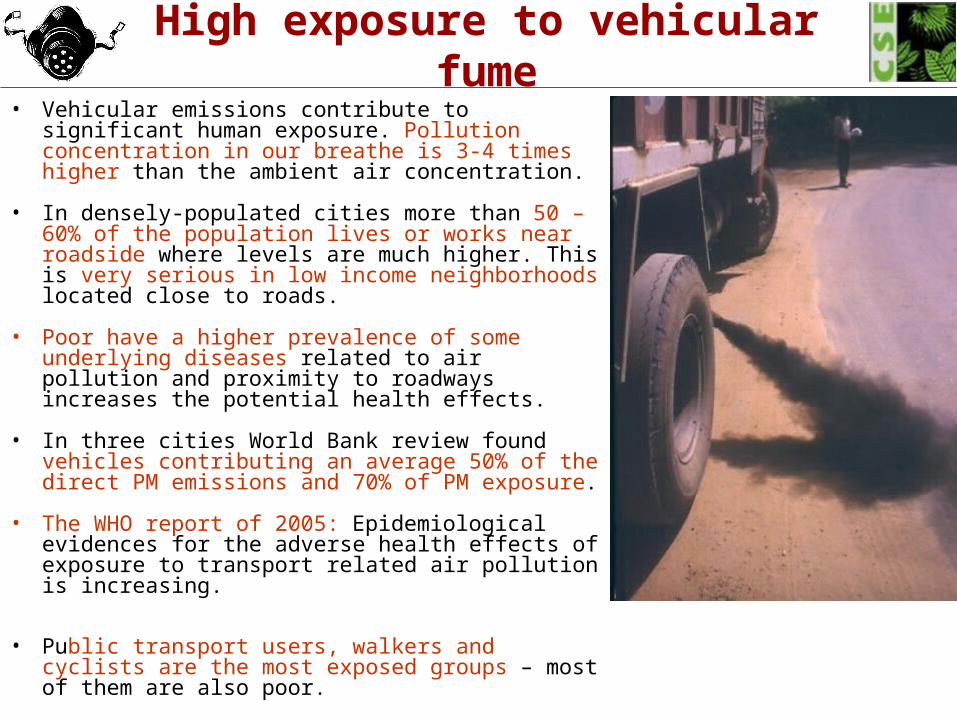
High exposure to vehicular fume• Vehicular emissions contribute to significant human
exposure. Pollution concentration in our breathe is 3-4 times higher than the ambient air concentration.
• In densely-populated cities more than 50 – 60% of the population lives or works near roadside where levels are much higher. This is very serious in low income neighborhoods located close to roads.
• Poor have a higher prevalence of some underlying diseases related to air pollution and proximity to roadways increases the potential health effects.
• In three cities World Bank review found vehicles contributing an average 50% of the direct PM emissions and 70% of PM exposure.
• The WHO report of 2005: Epidemiological evidences for the adverse health effects of exposure to transport related air pollution is increasing.
• Public transport users, walkers and cyclists are the most exposed groups – most of them are also poor.

Technology challenge………..
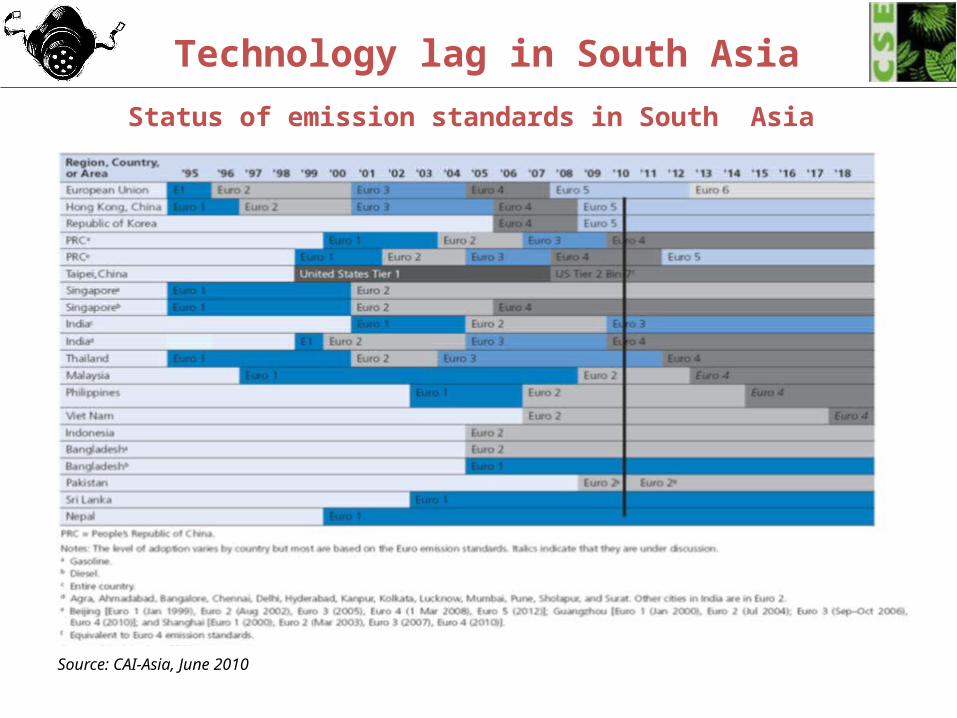
Technology lag in South Asia
Source: CAI-Asia, June 2010
Status of emission standards in South Asia
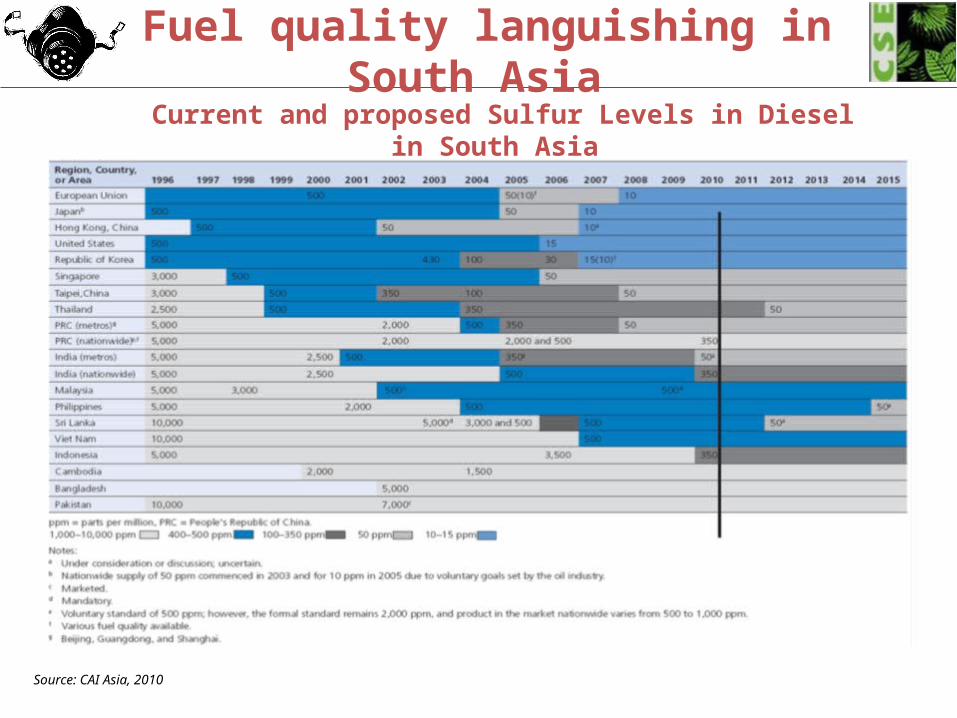
Fuel quality languishing in South Asia
Source: CAI Asia, 2010
Current and proposed Sulfur Levels in Diesel in South Asia
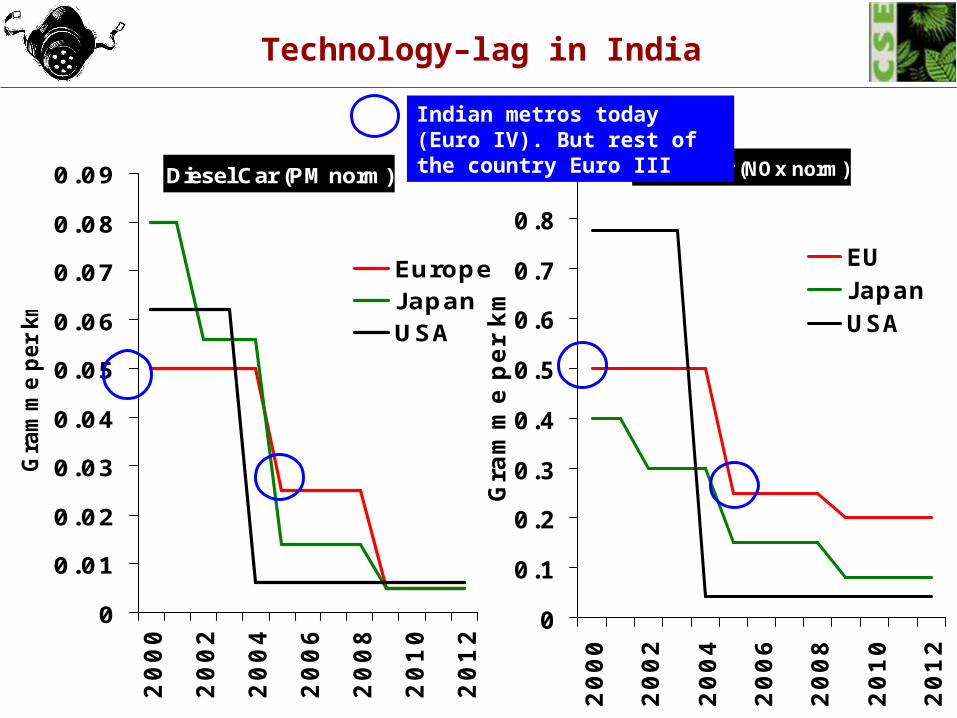
Diesel Car (PM norm)
0
0.01
0.02
0.03
0.04
0.05
0.06
0.07
0.08
0.092
00
0
20
02
20
04
20
06
20
08
20
10
20
12
Gra
mm
e p
er
km
EuropeJapanUSA
Diesel Car (NOx norm)
0
0.1
0.2
0.3
0.4
0.5
0.6
0.7
0.8
0.9
20
00
20
02
20
04
20
06
20
08
20
10
20
12
Gra
mm
e p
er
km
EUJapanUSA
Indian metros today (Euro IV). But rest of the country Euro III
Technology–lag in India
Future roadmap?
• India has enforced Euro IV in 13 cities and Euro III in the rest of the country. As of now there is no emissions standards roadmap
• Sri Lanka plans to achieve the Euro IV quality fuel with 50 ppm sulfur from 2012 onwards
• Both countries need to tighten the in-use emission norm regime and in-use compliance to reduce in-use emissions
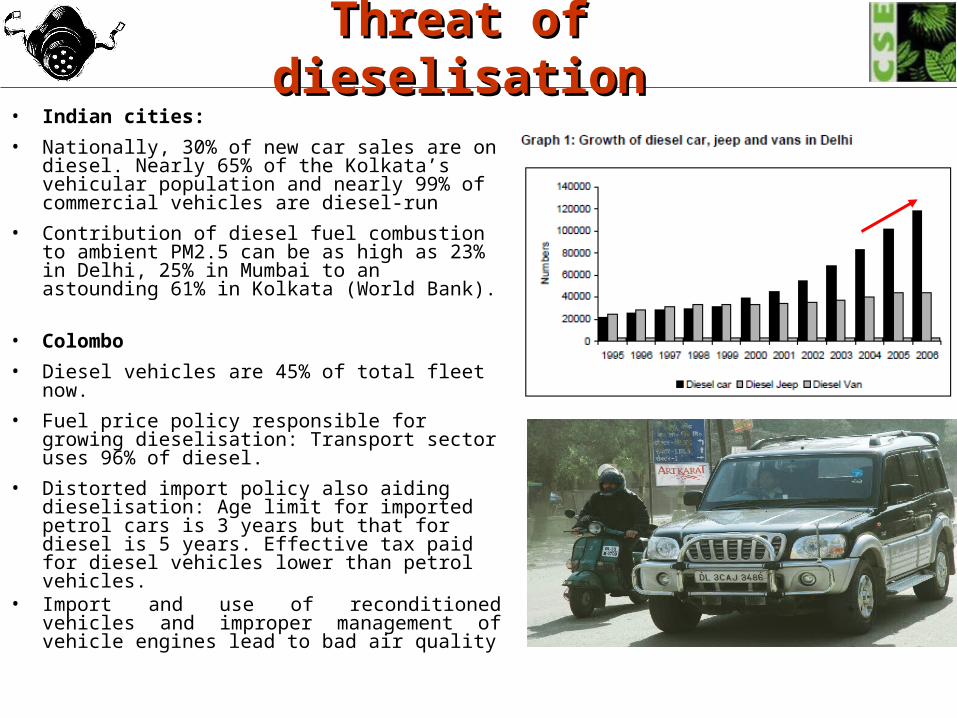
Threat of dieselisationThreat of dieselisation• Indian cities:
• Nationally, 30% of new car sales are on diesel. Nearly 65% of the Kolkata’s vehicular population and nearly 99% of commercial vehicles are diesel-run
• Contribution of diesel fuel combustion to ambient PM2.5 can be as high as 23% in Delhi, 25% in Mumbai to an astounding 61% in Kolkata (World Bank).
• Colombo
• Diesel vehicles are 45% of total fleet now.
• Fuel price policy responsible for growing dieselisation: Transport sector uses 96% of diesel.
• Distorted import policy also aiding dieselisation: Age limit for imported petrol cars is 3 years but that for diesel is 5 years. Effective tax paid for diesel vehicles lower than petrol vehicles.
• Import and use of reconditioned vehicles and improper management of vehicle engines lead to bad air quality
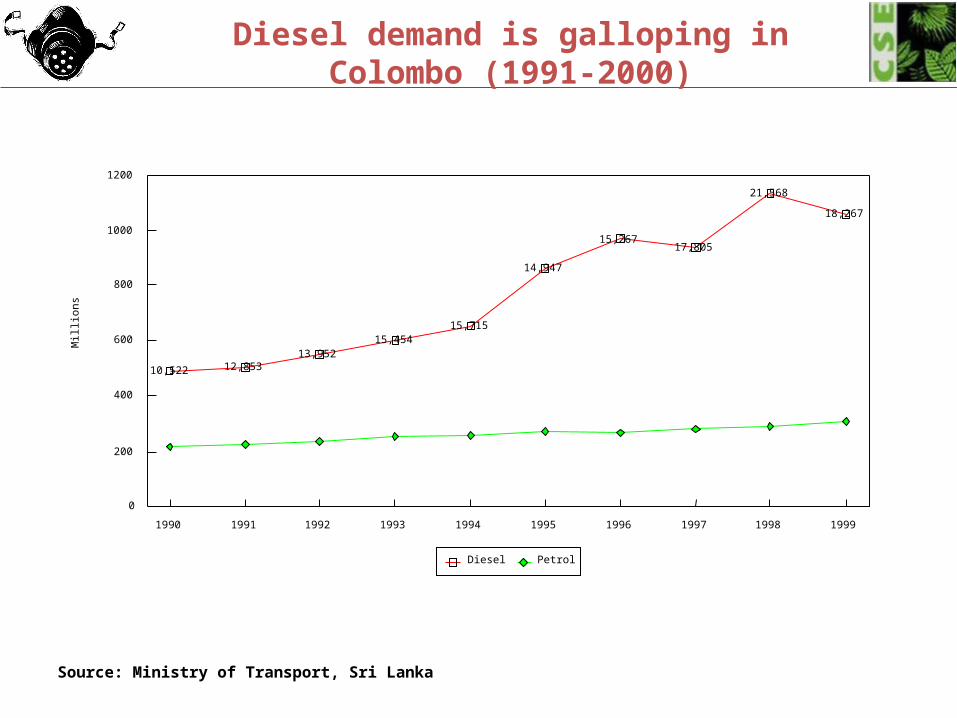
Diesel demand is galloping in Colombo (1991-2000)
Source: Ministry of Transport, Sri Lanka
0
200
400
600
800
1000
1200
10,522 12,85313,952
15,45415,715
14,947
15,26717,805
21,568
18,267
Mill
ions
1990 1991 1992 1993 1994 1995 1996 1997 1998 1999
Diesel Petrol
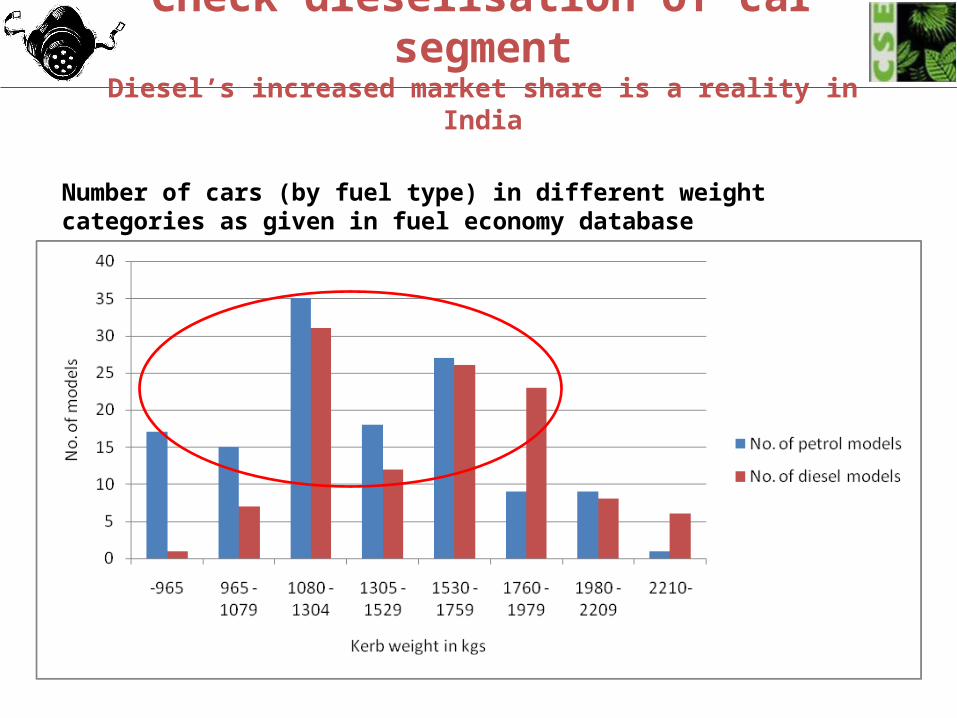
Check dieselisation of car segmentDiesel’s increased market share is a reality in India
Number of cars (by fuel type) in different weight categories as given in fuel economy database
One diesel car emits as much NOx as 3 to 5 petrol cars. PM is several times higher
Source: MP Walsh
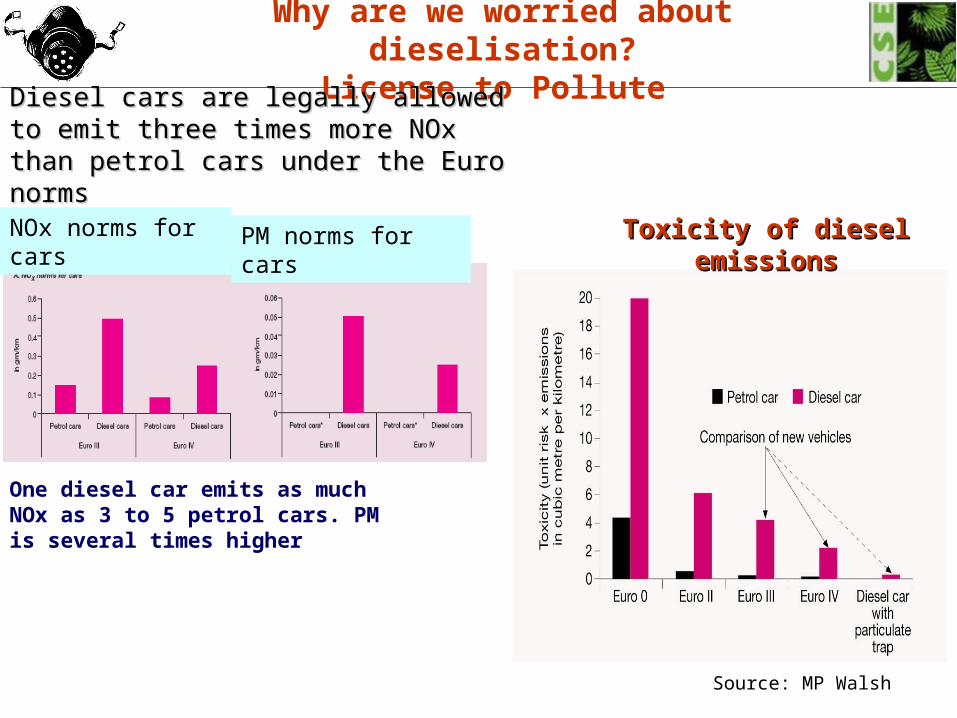
NOx norms for cars PM norms for cars
Why are we worried about dieselisation?License to Pollute
Diesel cars are legally allowed to emit three Diesel cars are legally allowed to emit three times more NOx than petrol cars under the times more NOx than petrol cars under the Euro normsEuro norms
Toxicity of diesel emissionsToxicity of diesel emissions
00.050.1
0.150.2
0.250.3
0.350.4
0.45
Petrol cars (>1400cc) Diesel cars (<1600cc)
Tox
ics
(gm
/km
)
Post 2005 Models NOx emissions
0
0.05
0.1
0.15
0.2
0.25
0.3
Petrol cars (> 1400cc) Diesel cars (< 1600cc)
0
0.005
0.01
0.015
0.02
Petrol cars (> 1400cc) Diesel cars (< 1600cc)
PM (g
m/km
)
135
140
145
150155
160
165
170
175
Petrol cars (> 1400cc) Diesel cars (< 1600cc)
CO
2 (g
m/k
m)
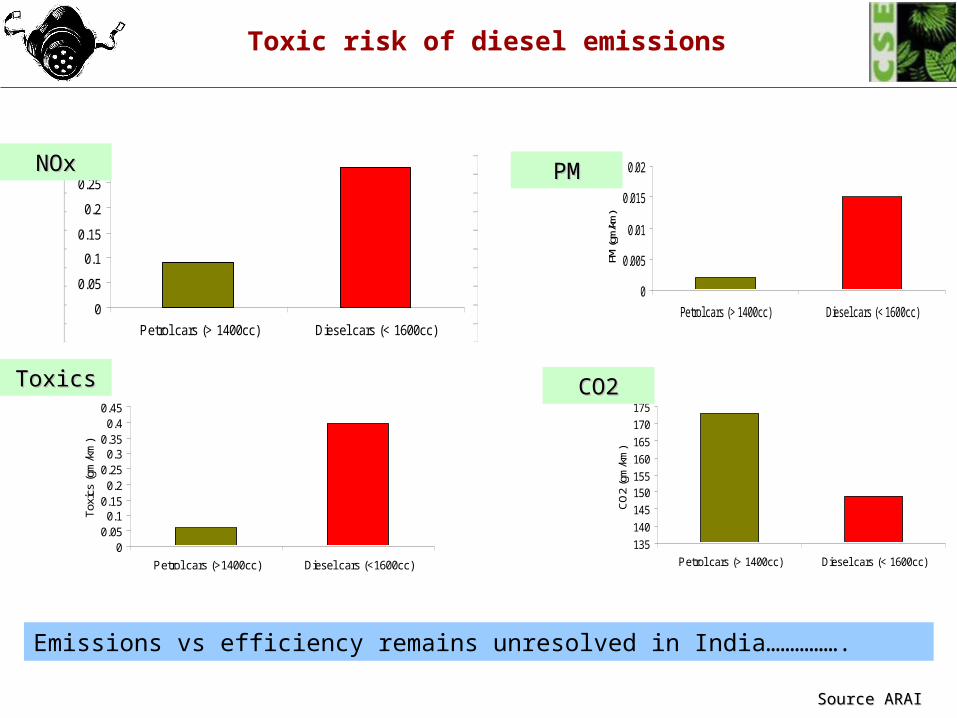
Toxic risk of diesel emissions
NOxNOx PMPM
ToxicsToxics CO2CO2
Emissions vs efficiency remains unresolved in India…………….
Source ARAISource ARAI
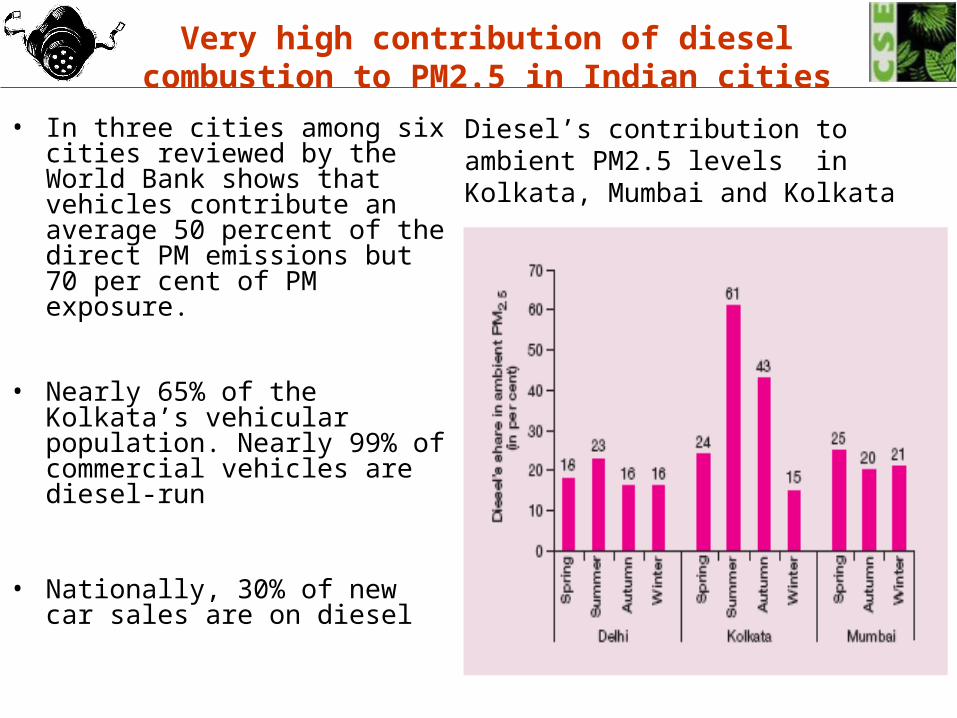
Very high contribution of diesel combustion to PM2.5 in Indian cities
• In three cities among six cities reviewed by the World Bank shows that vehicles contribute an average 50 percent of the direct PM emissions but 70 per cent of PM exposure.
• Nearly 65% of the Kolkata’s vehicular population. Nearly 99% of commercial vehicles are diesel-run
• Nationally, 30% of new car sales are on diesel
Diesel’s contribution to ambient PM2.5 levels in Kolkata, Mumbai and Kolkata
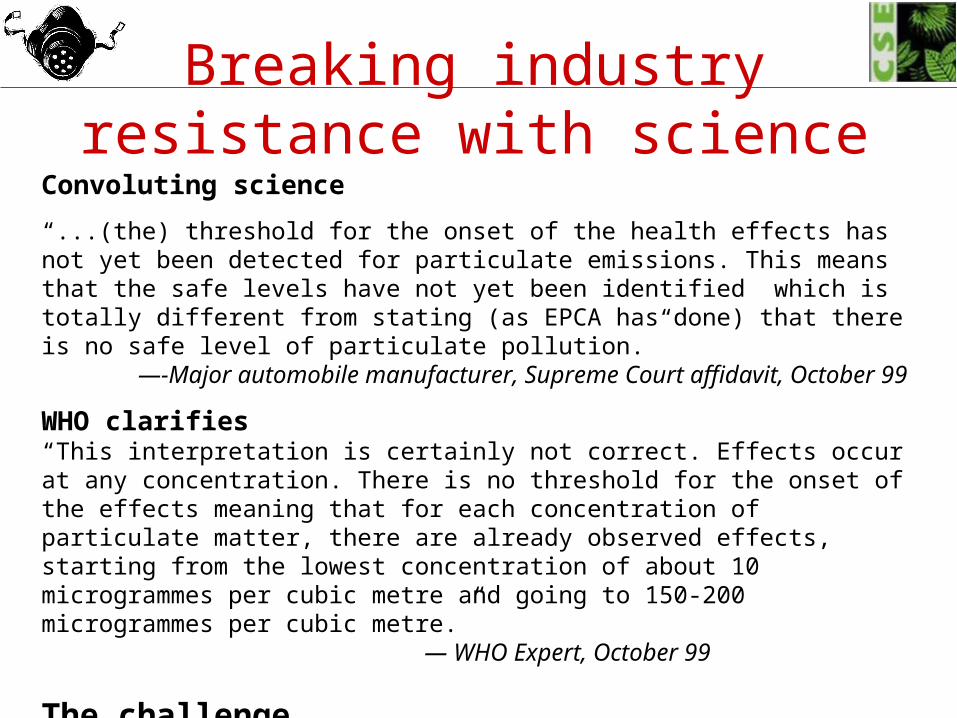
Breaking industry resistance with science
Convoluting science
“...(the) threshold for the onset of the health effects has not yet been detected for particulate emissions. This means that the safe levels have not yet been identified which is totally different from stating (as EPCA has done) that there is no safe level of particulate pollution.”
—-Major automobile manufacturer, Supreme Court affidavit, October 99
WHO clarifies“This interpretation is certainly not correct. Effects occur at any concentration. There is no threshold for the onset of the effects meaning that for each concentration of particulate matter, there are already observed effects, starting from the lowest concentration of about 10 microgrammes per cubic metre and going to 150-200 microgrammes per cubic metre.”
— WHO Expert, October 99
The challengeBe on top of information to counter disinformation.
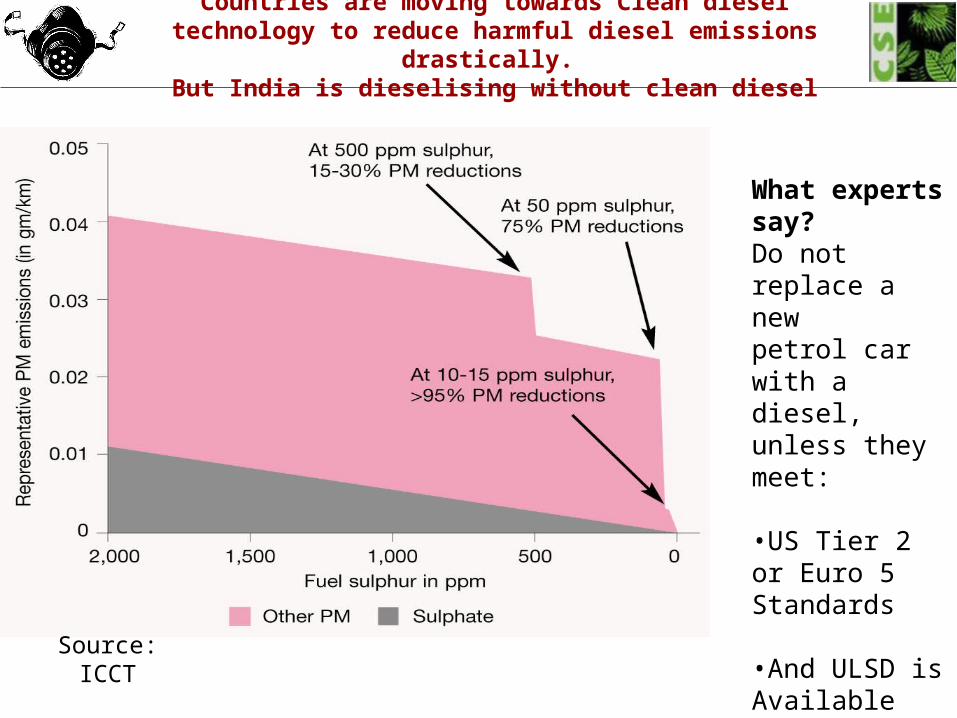
Countries are moving towards Clean diesel technology to reduce harmful diesel emissions drastically. But India is dieselising without clean diesel
Source: ICCT
What experts say?Do not replace a new petrol car with a diesel, unless they meet:
•US Tier 2 or Euro 5 Standards
•And ULSD is Available
Other governments are taking active fiscal measures
• Fiscal measures to discourage conventional diesel.
– In Brazil diesel cars are actively discouraged because of the policy to keep taxes lower on diesel.
– In Denmark, diesel cars are taxed higher to offset the lower prices of diesel fuel.
– In China, taxes do not differentiate between petrol and diesel.
– European Commission has calculated the difference in lifetime pollution costs of Euro IV compliant diesel car and petrol car. The total pollution cost of a Euro IV diesel car is 1195 Euros vis a vis 846 Euros for a petrol car. This nullifies the marginal greenhouse gas reduction benefit of diesel car and costs higher to the society.
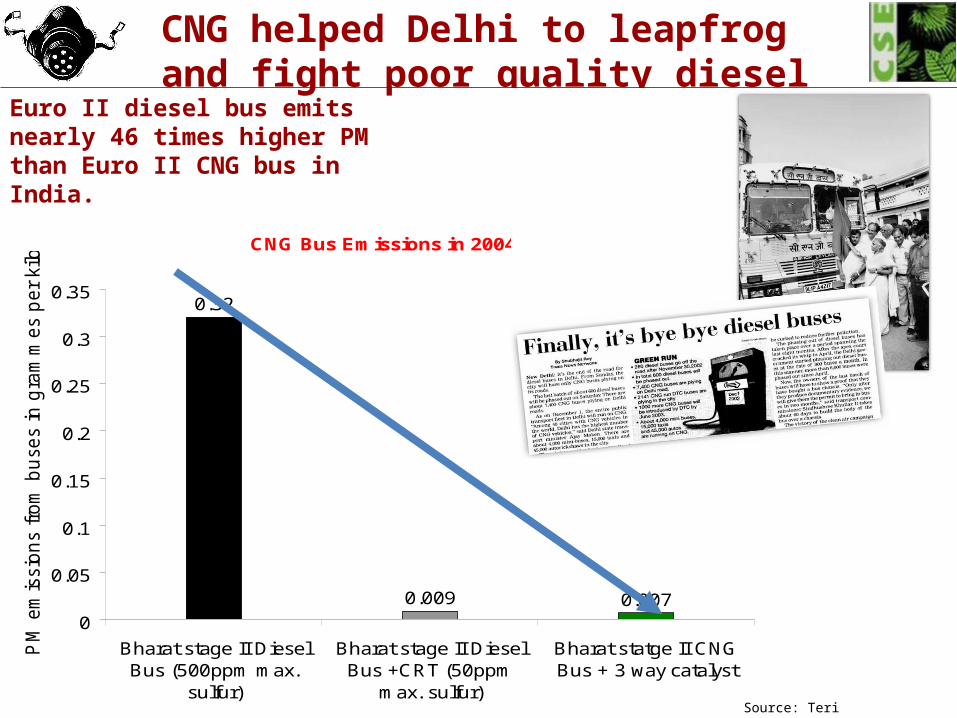
CNG Bus Emissions in 2004
0.32
0.009 0.0070
0.05
0.1
0.15
0.2
0.25
0.3
0.35
Bharat stage II DieselBus (500ppm max.
sulfur)
Bharat stage II DieselBus +CRT (50ppm
max. sulfur)
Bharat statge II CNGBus + 3 way catalyst
PM
em
issio
ns fro
m b
uses in
gra
mm
es p
er
kilo
metr
eCNG helped Delhi to leapfrog and fight poor quality diesel
Source: Teri
Euro II diesel bus emits nearly 46 times higher PM than Euro II CNG bus in India.
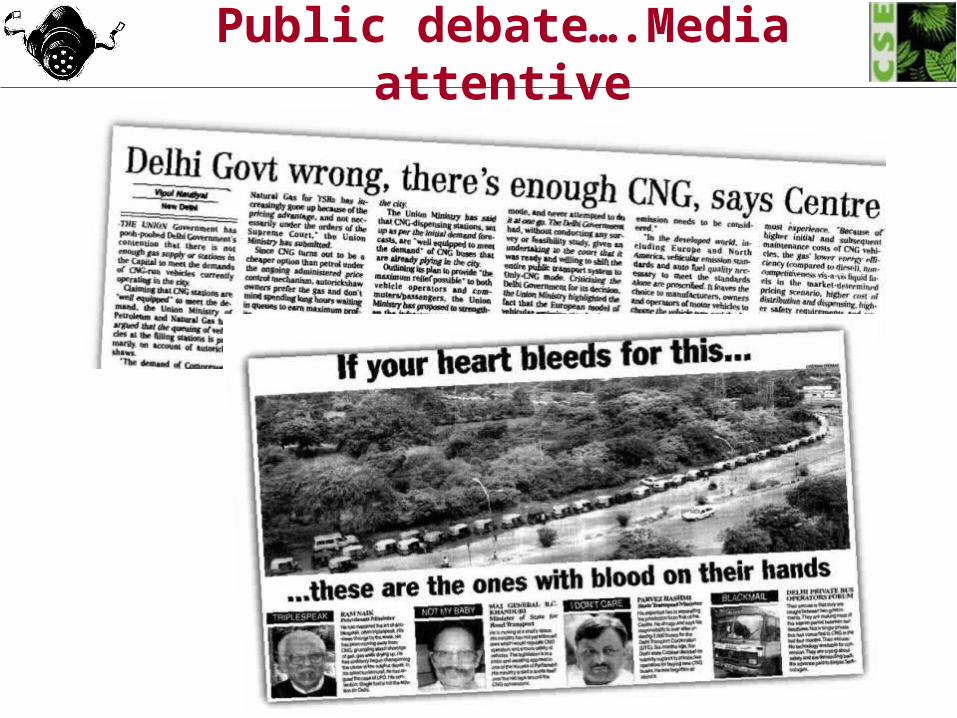
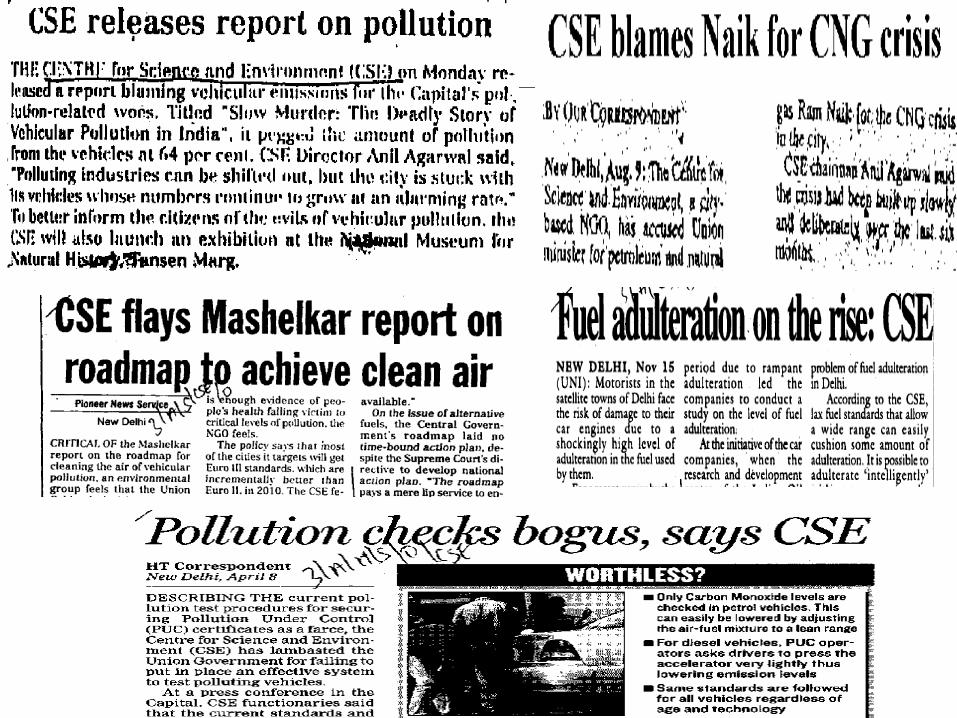
Public debate….Media attentive
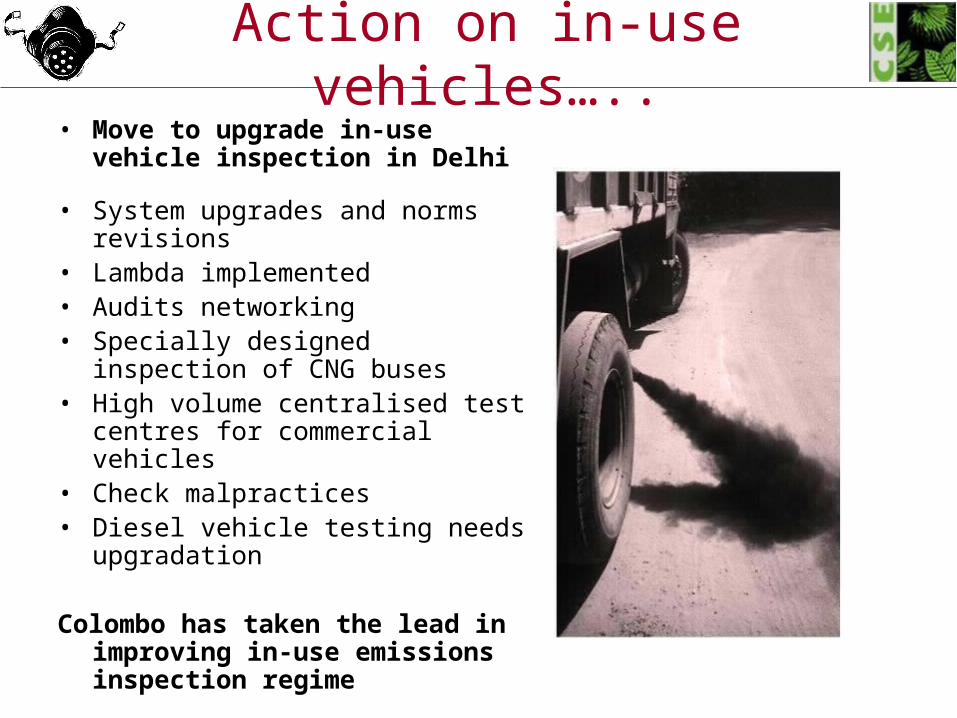
Action on in-use vehicles…..• Move to upgrade in-use vehicle
inspection in Delhi
• System upgrades and norms revisions
• Lambda implemented• Audits networking• Specially designed inspection of CNG
buses• High volume centralised test centres
for commercial vehicles• Check malpractices• Diesel vehicle testing needs
upgradation
Colombo has taken the lead in improving in-use emissions inspection regime

Vehicles make us more energy insecure…. Climate insecure……. Resolve efficiency vs emissions trade-off
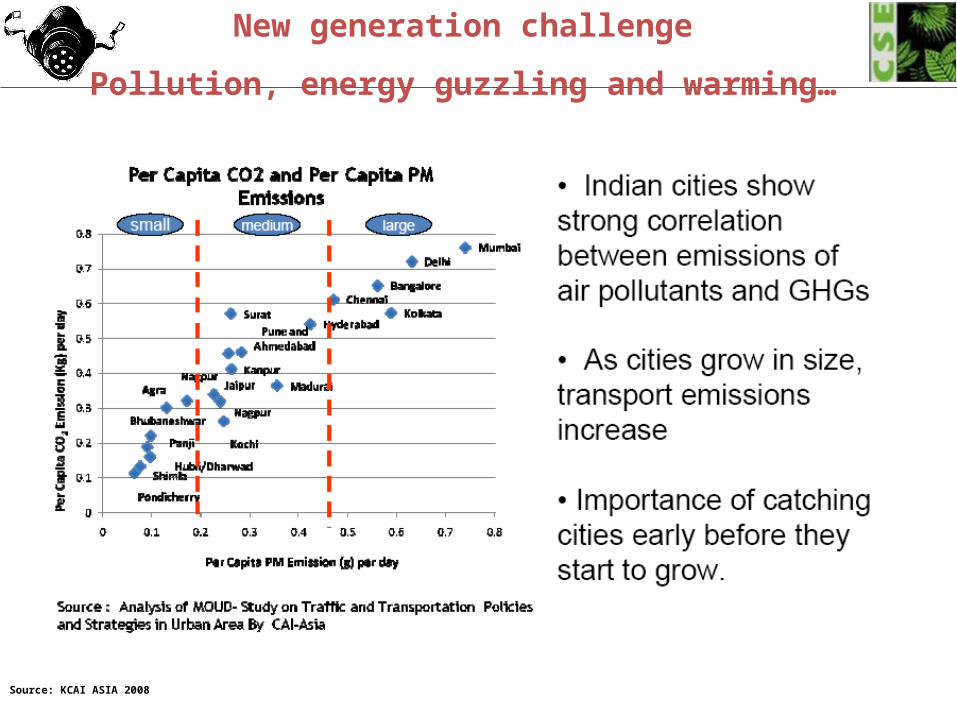
Source: KCAI ASIA 2008
New generation challenge
Pollution, energy guzzling and warming…
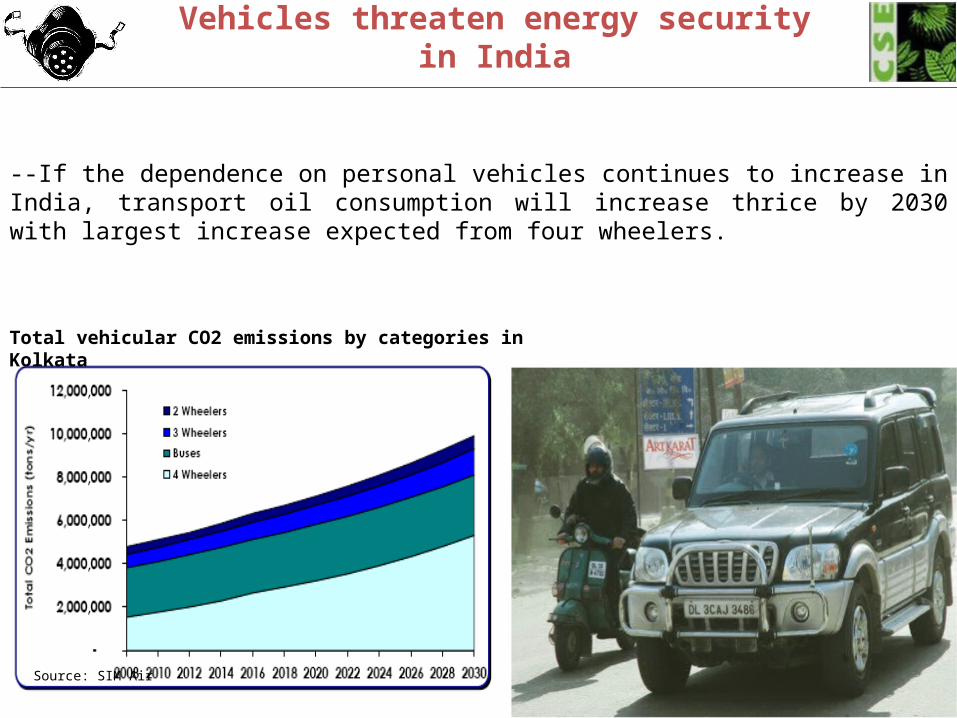
Vehicles threaten energy security in India
Source: SIM Air
Total vehicular CO2 emissions by categories in Kolkata
--If the dependence on personal vehicles continues to increase in India, transport oil consumption will increase thrice by 2030 with largest increase expected from four wheelers.
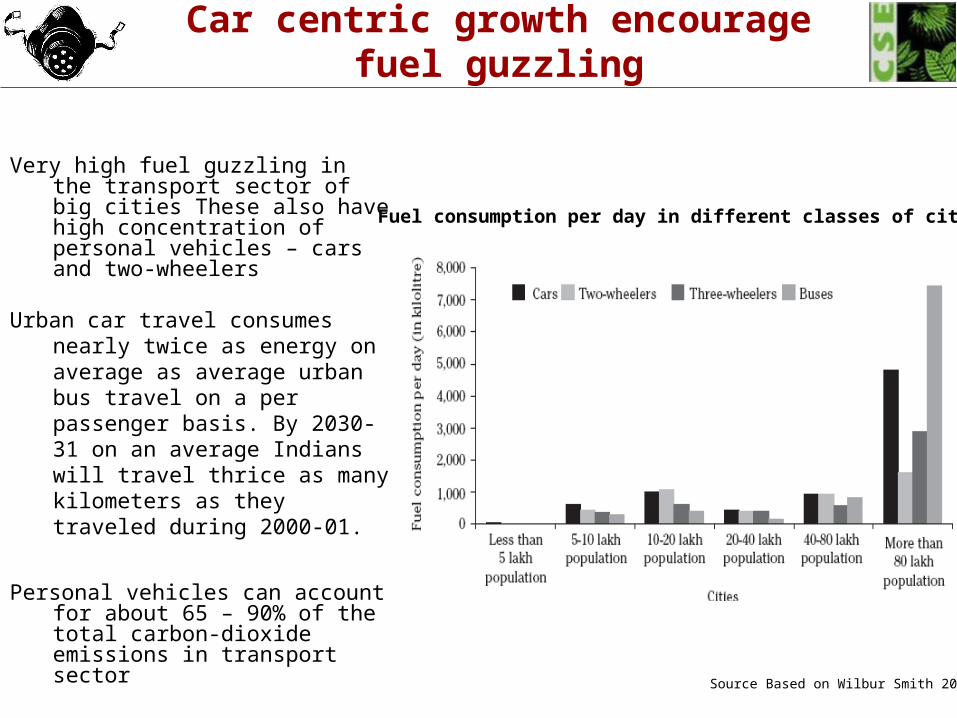
Car centric growth encourage fuel guzzling
Very high fuel guzzling in the transport sector of big cities These also have high concentration of personal vehicles – cars and two-wheelers
Urban car travel consumes nearly twice as energy on average as average urban bus travel on a per passenger basis. By 2030-31 on an average Indians will travel thrice as many kilometers as they traveled during 2000-01.
Personal vehicles can account for about 65 – 90% of the total carbon-dioxide emissions in transport sector
Source Based on Wilbur Smith 2008
Fuel consumption per day in different classes of cities
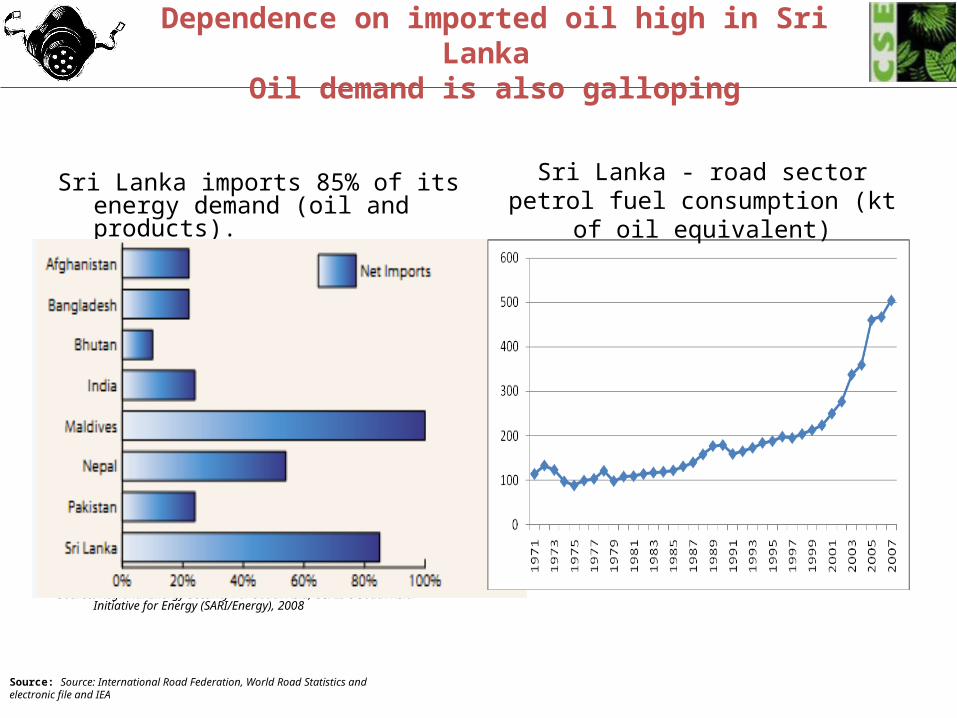
Dependence on imported oil high in Sri Lanka Oil demand is also galloping
Sri Lanka imports 85% of its energy demand (oil and products).
Source: Regional Energy Security For South Asia, USAID’s South Asia Initiative for Energy (SARI/Energy), 2008
Sri Lanka - road sector petrol fuel consumption (kt of oil equivalent)
Source: Source: International Road Federation, World Road Statistics and electronic file and IEA
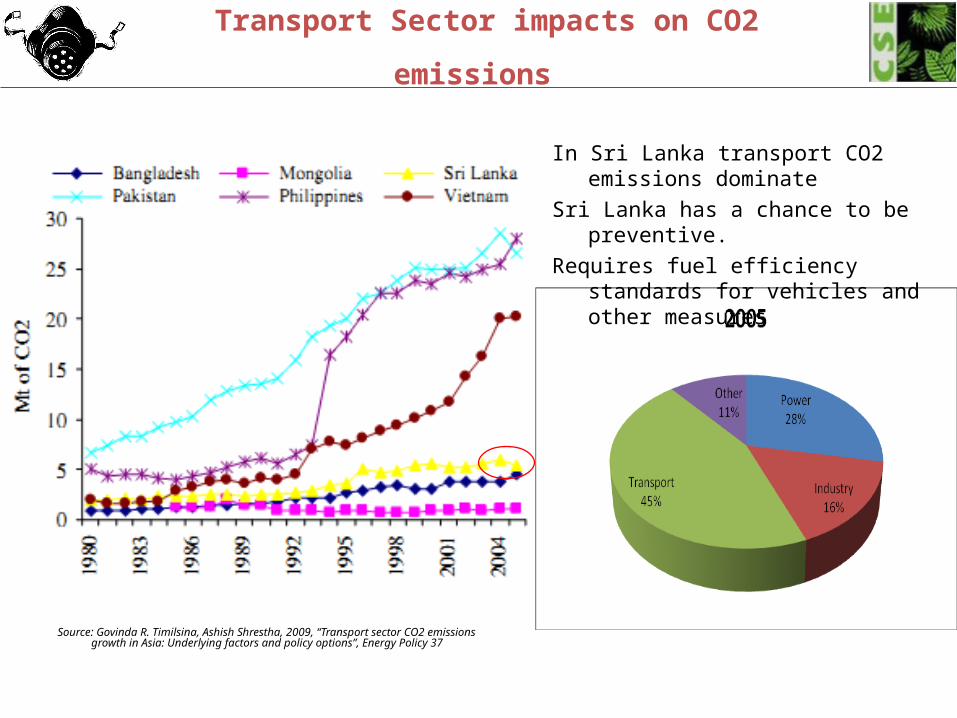
Transport Sector impacts on CO2 emissions
Source: Govinda R. Timilsina, Ashish Shrestha, 2009, “Transport sector CO2 emissions growth in Asia: Underlying factors and policy options”, Energy Policy 37
In Sri Lanka transport CO2 emissions dominate
Sri Lanka has a chance to be preventive.
Requires fuel efficiency standards for vehicles and other measures
The subtle link between local air pollution and warming….
• Local pollution can enhance the warming effects….Eg, HC + NOx lead to regional ozone but also to background hemispheric ozone; CO becomes CO2 but consumes OH radicals along the way increasing CH4; Diesel PM increases PM10 & PM2.5 & ultrafine PM but also black carbon
• Warming can also enhance local public health impacts …Eg, each increase of 1 degree Celsius caused by carbon dioxide, can enhance PM and ozone build up. The resulting air pollution can lead thousands of additional deaths and many more cases of respiratory illness and asthma etc. (Mark Jacobson 2008)
Diesel cars can also make us more energy and climate insecure. How?
• Cheaper diesel fuel encourages bigger and more powerful cars. Eg, --
• Due to higher gasoline prices 85% of the gasoline cars sold in India have less than 1200 cc engines
• But 64 % of diesel cars are just under 1500 cc and the rest above.
• Diesel fuel has higher carbon content than petrol. If more diesel is burnt encouraged by its cheaper prices and more driving, more heat-trapping CO2 will escape.
• Black carbon emissions from diesel vehicles are several times more heat trapping than CO2 and this nullifies fuel efficiency gains.
• Europe has found that with increased demand for diesel energy consuming refining process will expand to increase the share of diesel from each unit of oil refined. CO2 emissions from the upstream refining process will increase. This negates the benefit of shift from petrol to diesel cars.
• European Commission has calculated the difference in lifetime pollution costs of Euro IV compliant diesel car and petrol car. Total pollution cost of a Euro IV diesel car is 1195 Euros vis a vis 846 Euros for a petrol car. This nullifies the marginal greenhouse gas reduction benefit of diesel car and costs higher to the society.
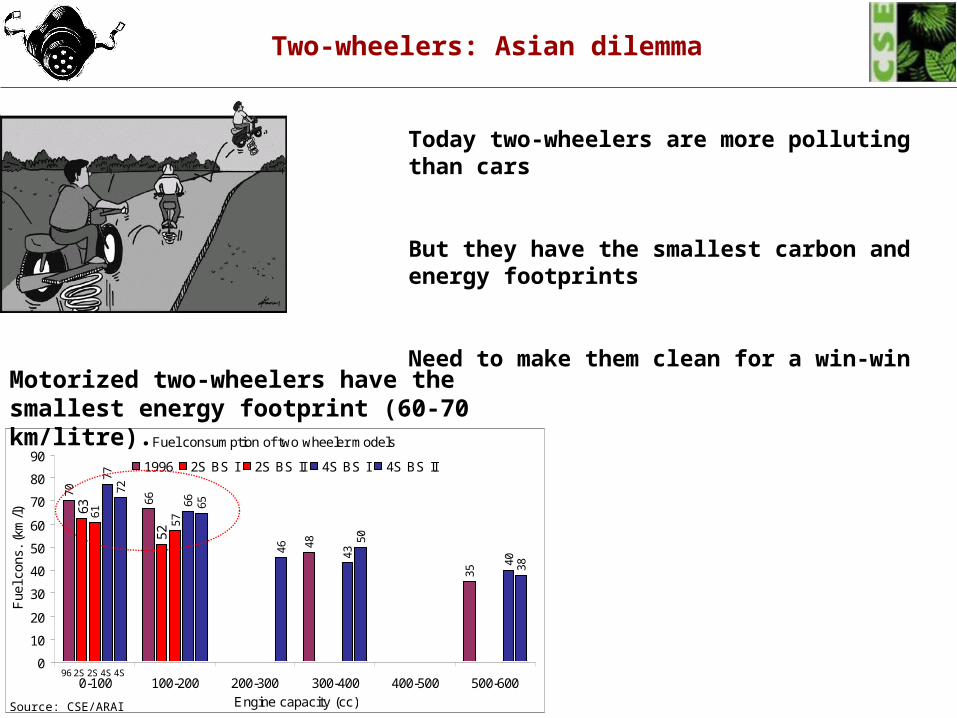
Fuel consumption of two wheeler models
70
66
48
35
63
52
61
57
77
66
43
40
72
65
46
50
38
0
10
20
30
40
50
60
70
80
90
0-100 100-200 200-300 300-400 400-500 500-600Engine capacity (cc)
Fue
l con
s. (
km/l)
1996 2S BS I 2S BS II 4S BS I 4S BS II
96 2S 2S 4S 4S
Source: CSE/ARAI
Two-wheelers: Asian dilemma
Motorized two-wheelers have the smallest energy footprint (60-70 km/litre).
Today two-wheelers are more polluting than cars
But they have the smallest carbon and energy footprints
Need to make them clean for a win-win
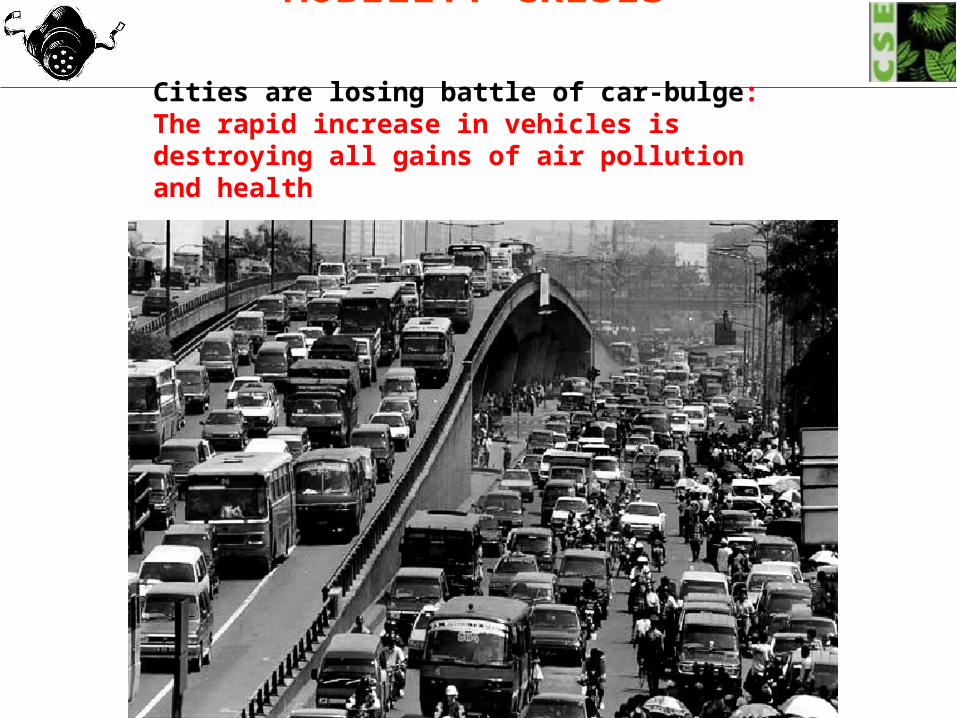
MOBILITY CRISIS
Cities are losing battle of car-bulge: The rapid increase in vehicles is destroying all gains of air pollution and health
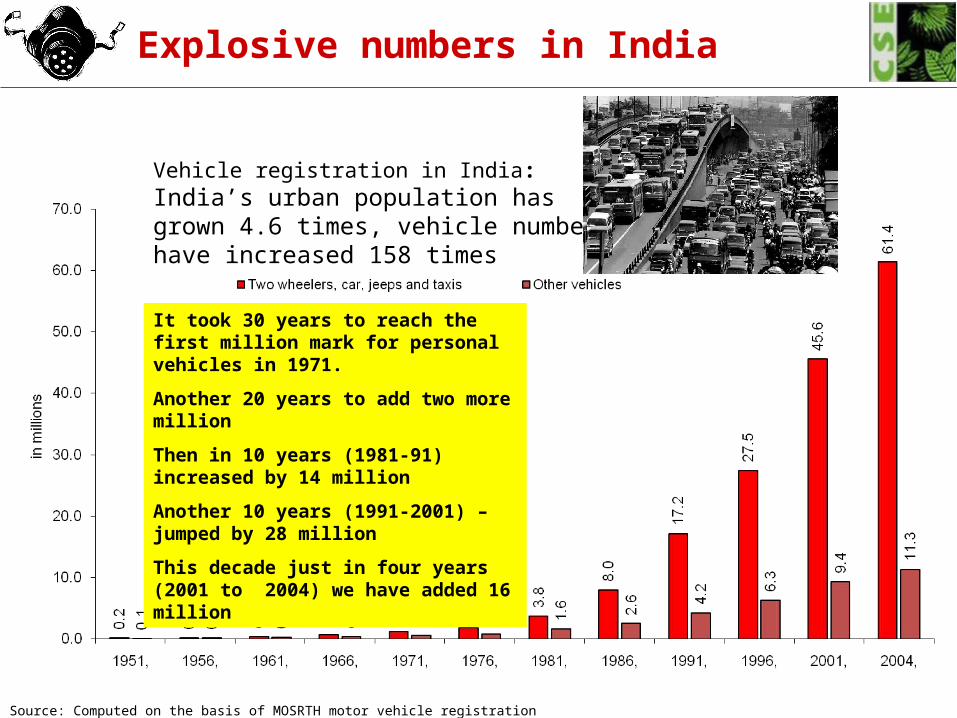
It took 30 years to reach the first million mark for personal vehicles in 1971.
Another 20 years to add two more million
Then in 10 years (1981-91) increased by 14 million
Another 10 years (1991-2001) – jumped by 28 million
This decade just in four years (2001 to 2004) we have added 16 million
Explosive numbers in India
Source: Computed on the basis of MOSRTH motor vehicle registration data
Vehicle registration in India: India’s urban population has grown 4.6 times, vehicle numbers have increased 158 times
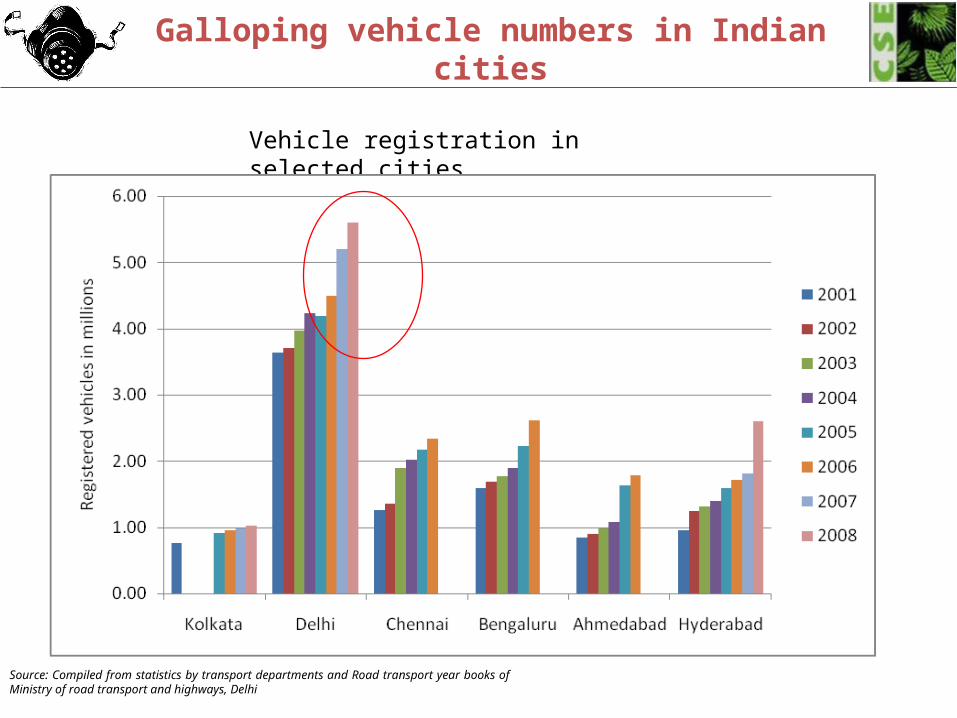
Galloping vehicle numbers in Indian cities
Vehicle registration in selected cities
Source: Compiled from statistics by transport departments and Road transport year books of Ministry of road transport and highways, Delhi
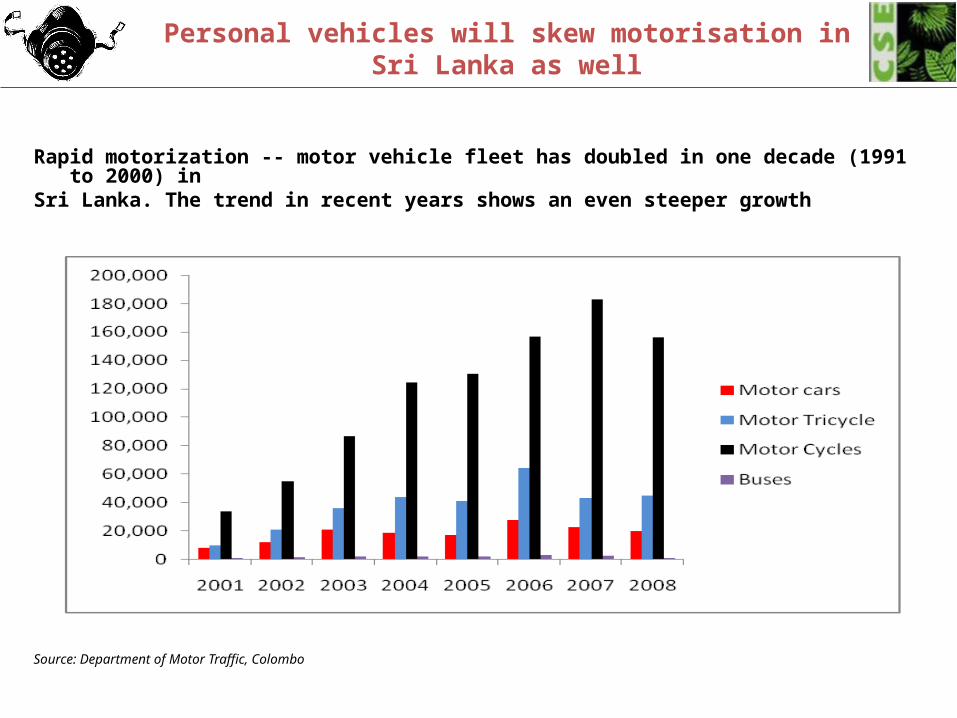
Personal vehicles will skew motorisation in Sri Lanka as well
Rapid motorization -- motor vehicle fleet has doubled in one decade (1991 to 2000) in Sri Lanka. The trend in recent years shows an even steeper growth
Source: Department of Motor Traffic, Colombo
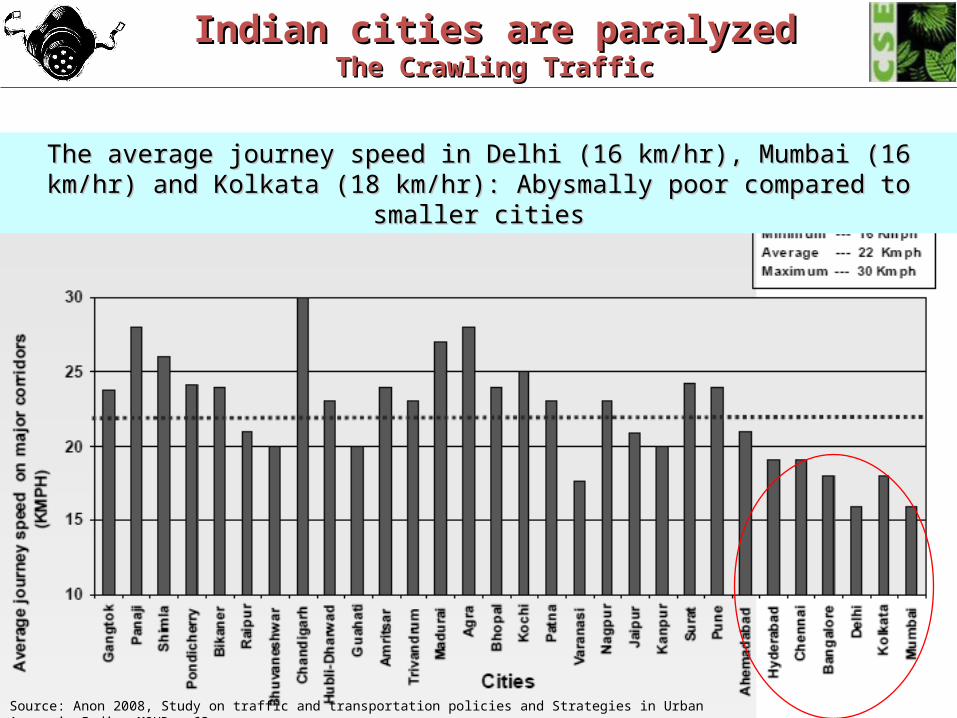
69
Indian cities are paralyzedIndian cities are paralyzedThe Crawling TrafficThe Crawling Traffic
Source: Anon 2008, Study on traffic and transportation policies and Strategies in Urban Areas in India, MOUD, p63
The average journey speed in Delhi (16 km/hr), Mumbai (16 km/hr) and Kolkata (18 The average journey speed in Delhi (16 km/hr), Mumbai (16 km/hr) and Kolkata (18 km/hr): Abysmally poor compared to smaller citieskm/hr): Abysmally poor compared to smaller cities
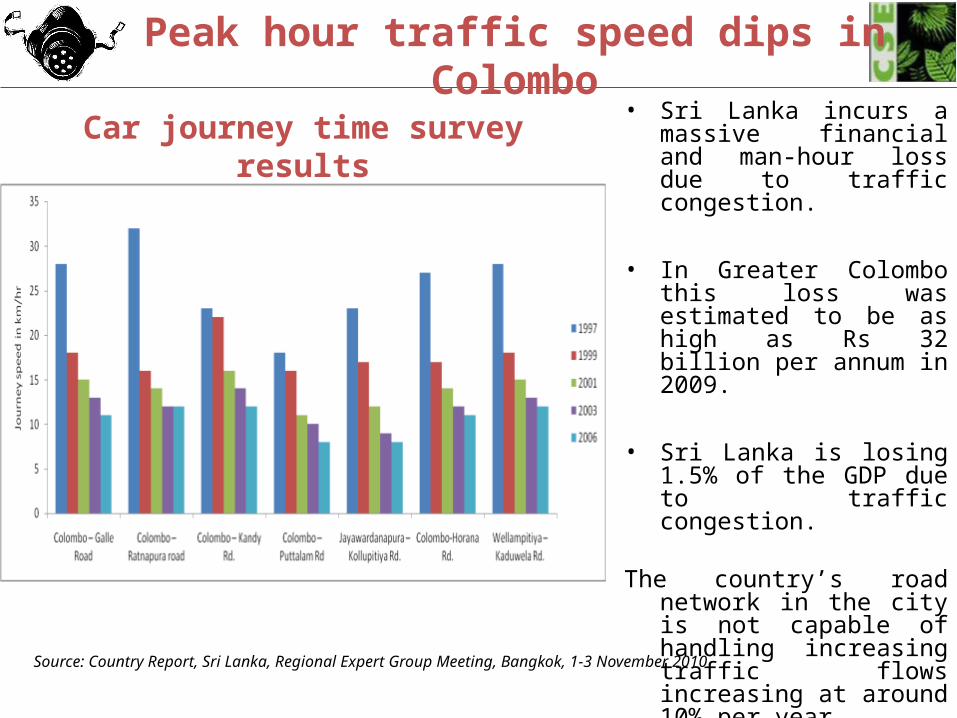
Peak hour traffic speed dips in Colombo
Source: Country Report, Sri Lanka, Regional Expert Group Meeting, Bangkok, 1-3 November 2010
Car journey time survey results• Sri Lanka incurs a massive
financial and man-hour loss due to traffic congestion.
• In Greater Colombo this loss was estimated to be as high as Rs 32 billion per annum in 2009.
• Sri Lanka is losing 1.5% of the GDP due to traffic congestion.
The country’s road network in the city is not capable of handling increasing traffic flows increasing at around 10% per year.
Other costs in Colombo
• Road safety compromised: Fatality: 1 in 50 deaths are due to road accidents
• Cost of Accidents: estimated Rs 30 billion per annum (USD 260Mn)
• Cost of Congestion: estimated Rs 35 billion per annum (USD 304Mn)
• Cost of Lost Time in Public Transport: estimated Rs 20 billion per annum (USD 174Mn
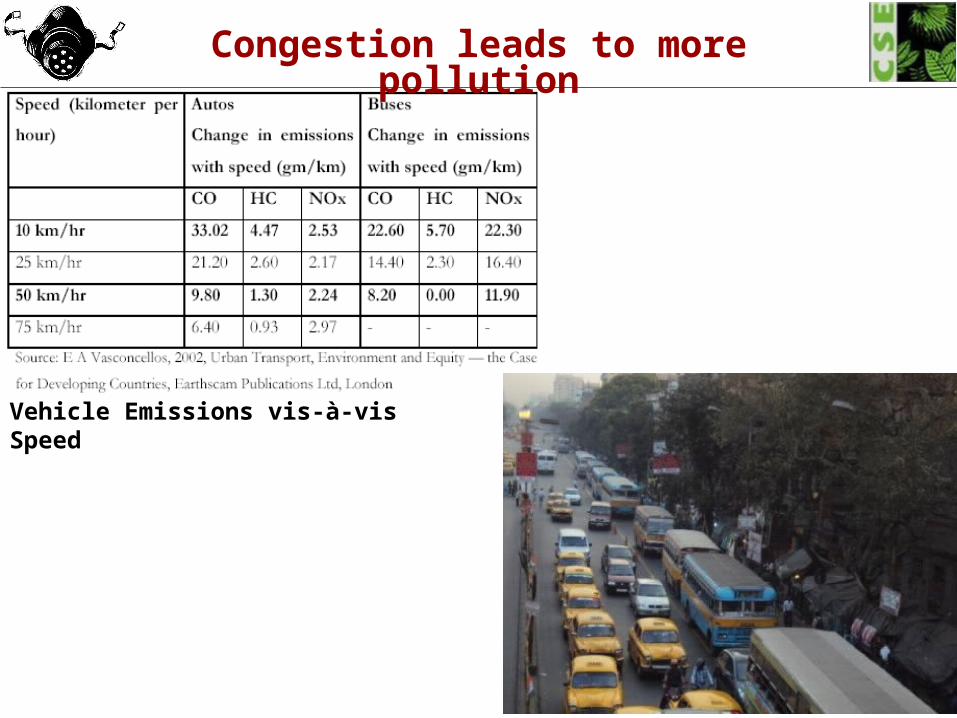
Vehicle Emissions vis-à-vis Speed
Congestion leads to more pollution
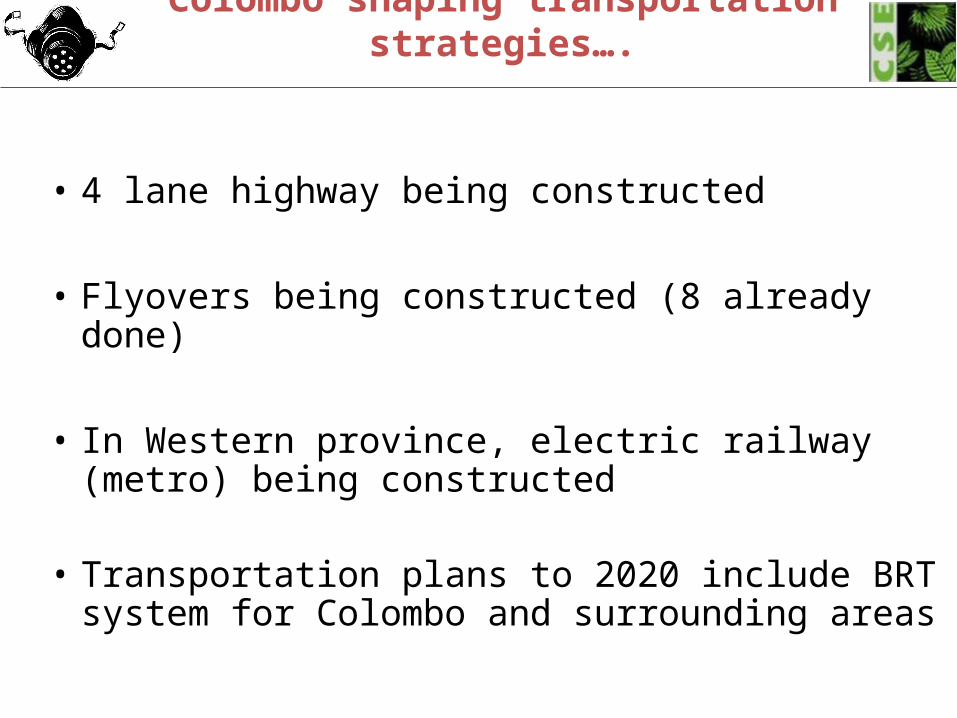
Colombo shaping transportation strategies….
• 4 lane highway being constructed
• Flyovers being constructed (8 already done)
• In Western province, electric railway (metro) being constructed
• Transportation plans to 2020 include BRT system for Colombo and surrounding areas
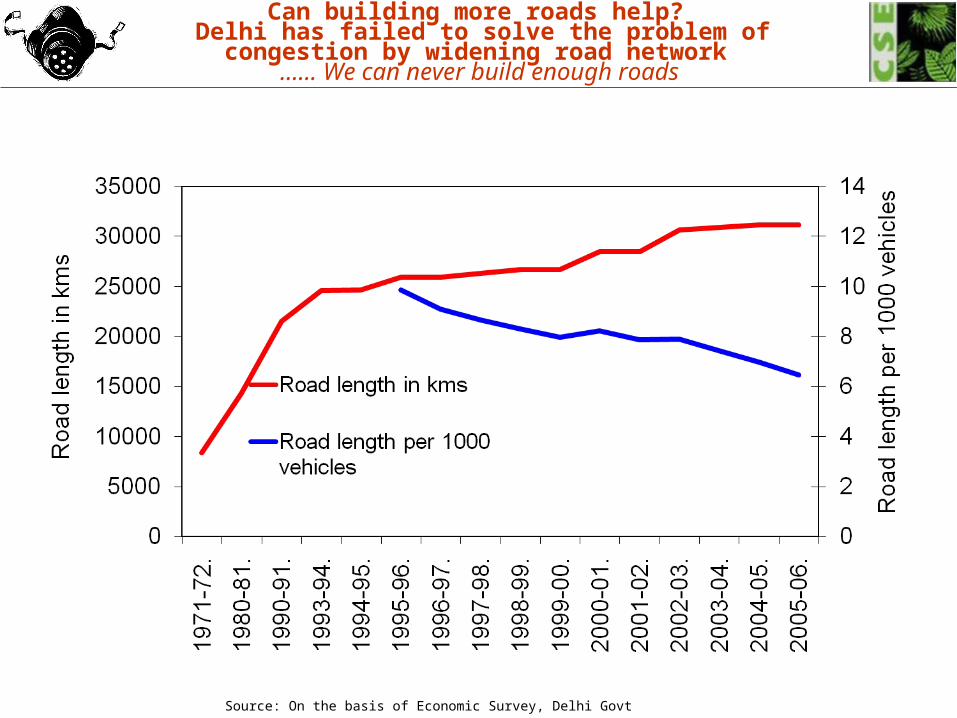
Source: On the basis of Economic Survey, Delhi Govt
Can building more roads help? Delhi has failed to solve the problem of congestion by
widening road network …… We can never build enough roads
The second generation challenge ……
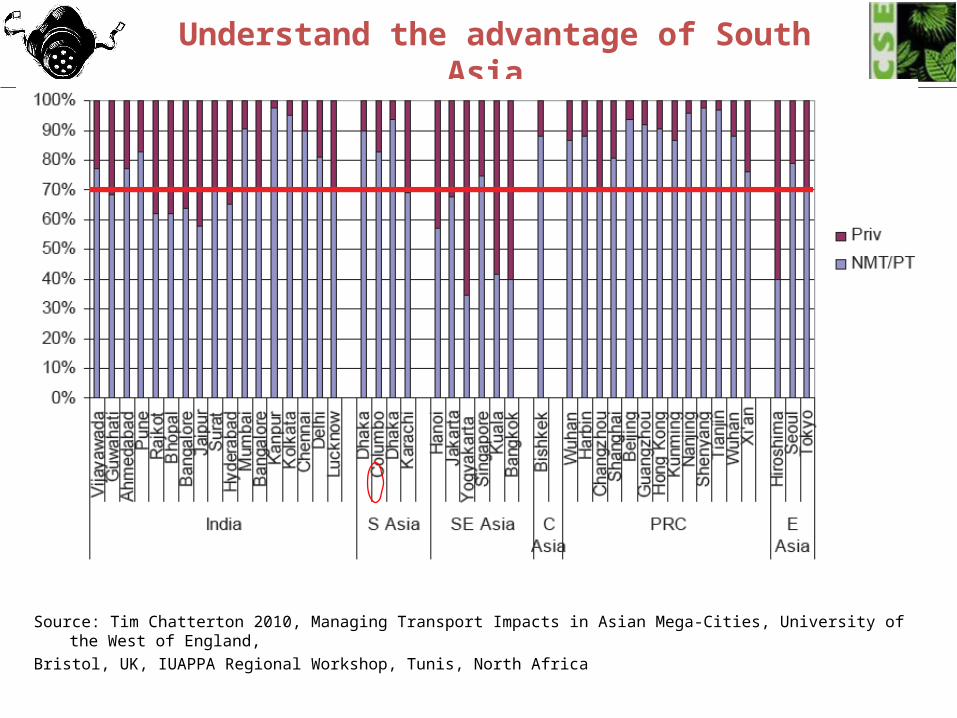
Understand the advantage of South Asia
Source: Tim Chatterton 2010, Managing Transport Impacts in Asian Mega-Cities, University of the West of England, Bristol, UK, IUAPPA Regional Workshop, Tunis, North Africa
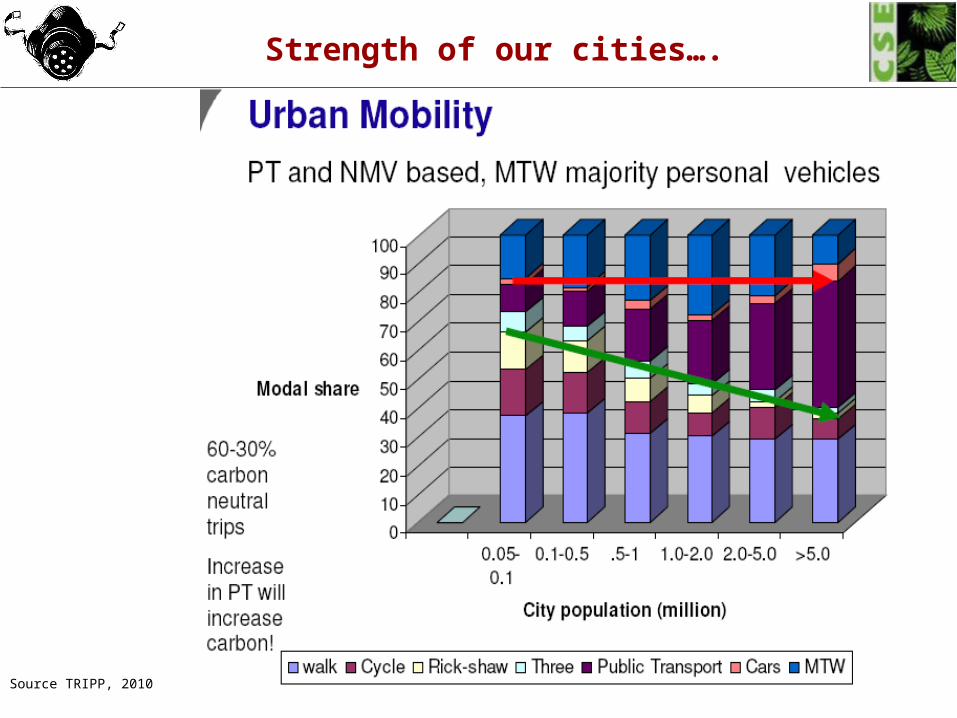
Source TRIPP, 2010
Strength of our cities….
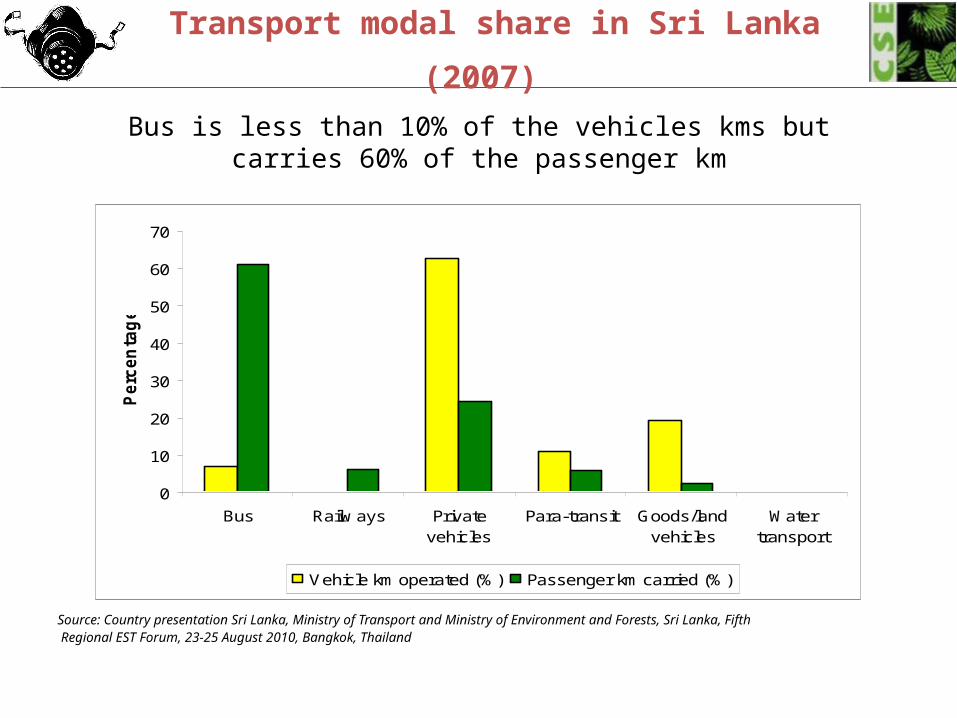
Transport modal share in Sri Lanka (2007)
Source: Country presentation Sri Lanka, Ministry of Transport and Ministry of Environment and Forests, Sri Lanka, Fifth Regional EST Forum, 23-25 August 2010, Bangkok, Thailand
0
10
20
30
40
50
60
70
Bus Railw ays Privatevehicles
Para-transit Goods/landvehicles
Watertransport
Perc
en
tag
e
Vehicle km operated (%) Passenger km carried (%)
Bus is less than 10% of the vehicles kms but carries 60% of the passenger km
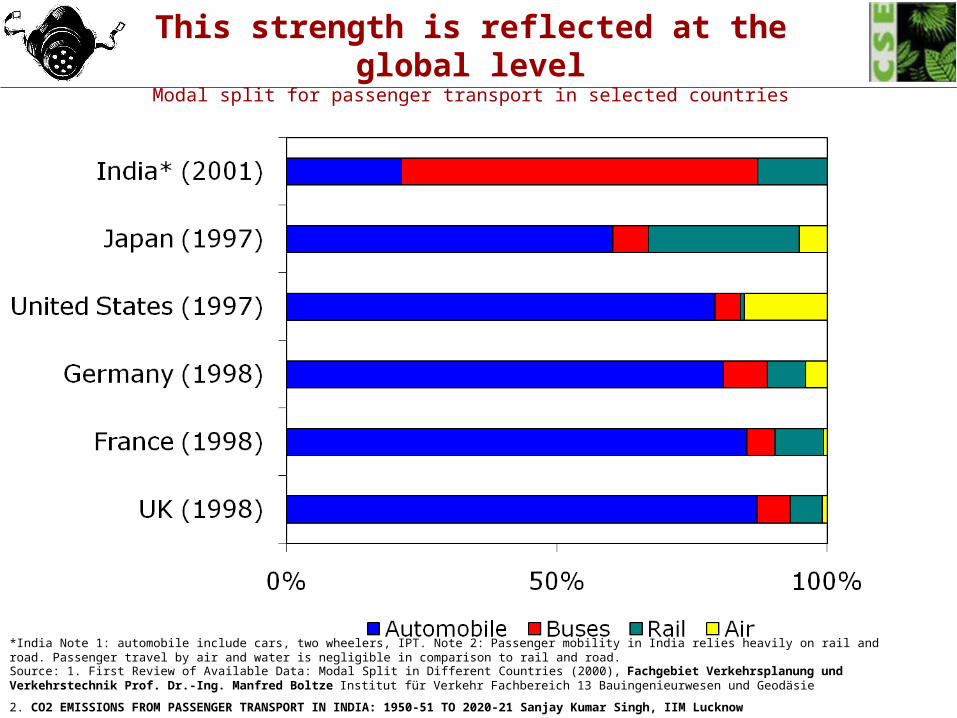
This strength is reflected at the global levelModal split for passenger transport in selected countries
*India Note 1: automobile include cars, two wheelers, IPT. Note 2: Passenger mobility in India relies heavily on rail and road. Passenger travel by air and water is negligible in comparison to rail and road.Source: 1. First Review of Available Data: Modal Split in Different Countries (2000), Fachgebiet Verkehrsplanung und Verkehrstechnik Prof. Dr.-Ing. Manfred Boltze Institut für Verkehr Fachbereich 13 Bauingenieurwesen und Geodäsie
2. CO2 EMISSIONS FROM PASSENGER TRANSPORT IN INDIA: 1950-51 TO 2020-21 Sanjay Kumar Singh, IIM Lucknow
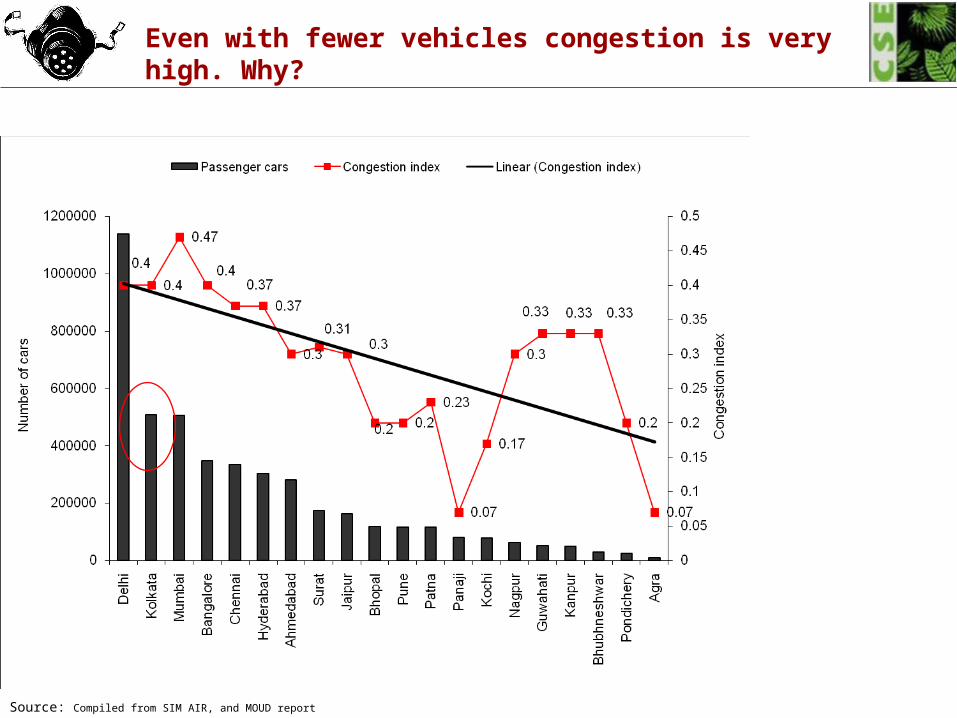
Even with fewer vehicles congestion is very high. Why?
Source: Compiled from SIM AIR, and MOUD report
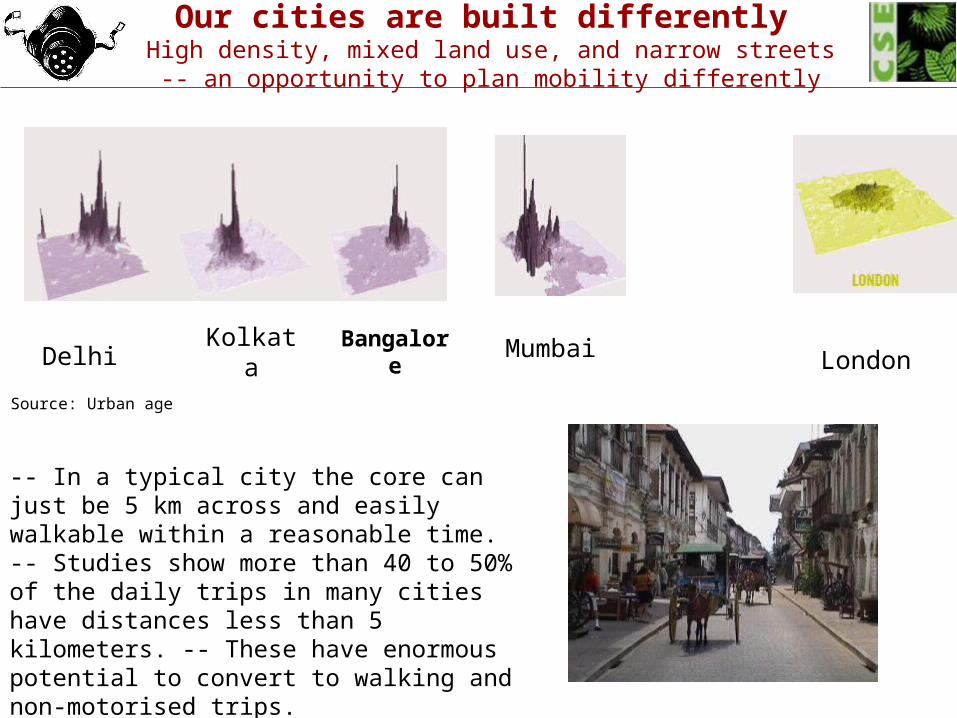
Delhi Kolkata Bangalore Mumbai London
-- In a typical city the core can just be 5 km across and easily walkable within a reasonable time. -- Studies show more than 40 to 50% of the daily trips in many cities have distances less than 5 kilometers. -- These have enormous potential to convert to walking and non-motorised trips.
Source: Urban age
Our cities are built differently High density, mixed land use, and narrow streets -- an opportunity to plan
mobility differently
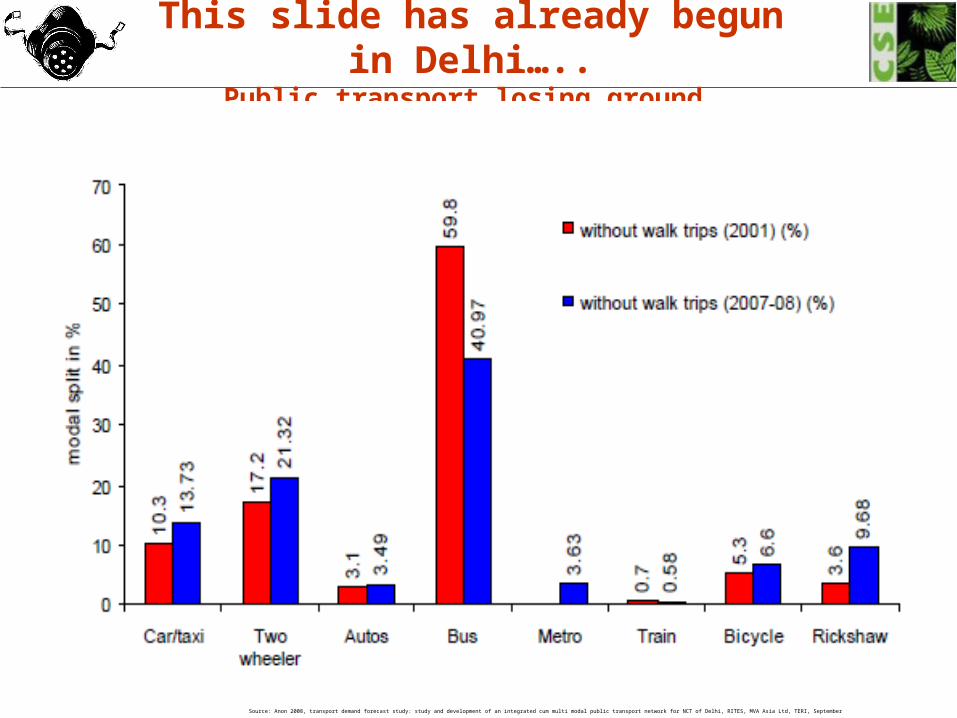
This slide has already begun in Delhi…..Public transport losing ground
Source: Anon 2008, transport demand forecast study: study and development of an integrated cum multi modal public transport network for NCT of Delhi, RITES, MVA Asia Ltd, TERI, September
Challenges of rebuilding public transport
-- Delhi Master Plan has set the target of 80% public transport ridership by 2020……..
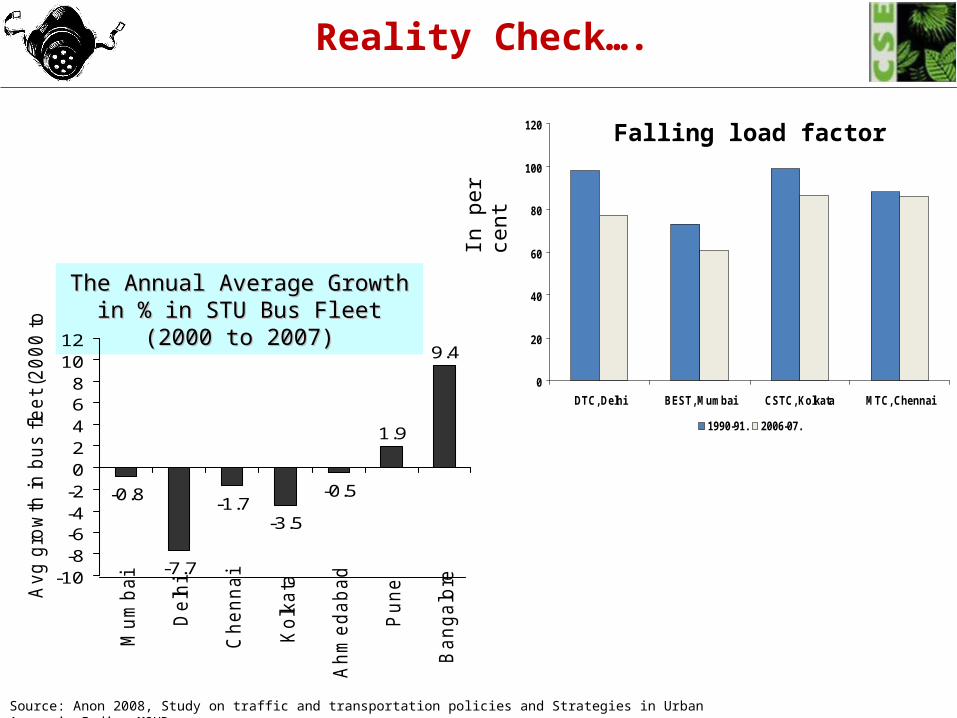
Reality Check….
The Annual Average Growth in % The Annual Average Growth in % in STU Bus Fleet (2000 to 2007)in STU Bus Fleet (2000 to 2007)
-0.8
-7.7
-1.7-3.5
-0.5
1.9
9.4
-10-8-6-4-202468
1012
Mu
mb
ai
De
lhi
Ch
en
na
i
Ko
lka
ta
Ah
me
da
ba
d
Pu
ne
Ba
ng
alo
re
Avg
gro
wth
in
bu
s fle
et (2
00
0 to
20
07
)
Source: Anon 2008, Study on traffic and transportation policies and Strategies in Urban Areas in India, MOUD
0
20
40
60
80
100
120
DTC, Delhi BEST, Mumbai CSTC, Kolkata MTC, Chennai
1990-91. 2006-07.
Falling load factor
In p
er c
ent
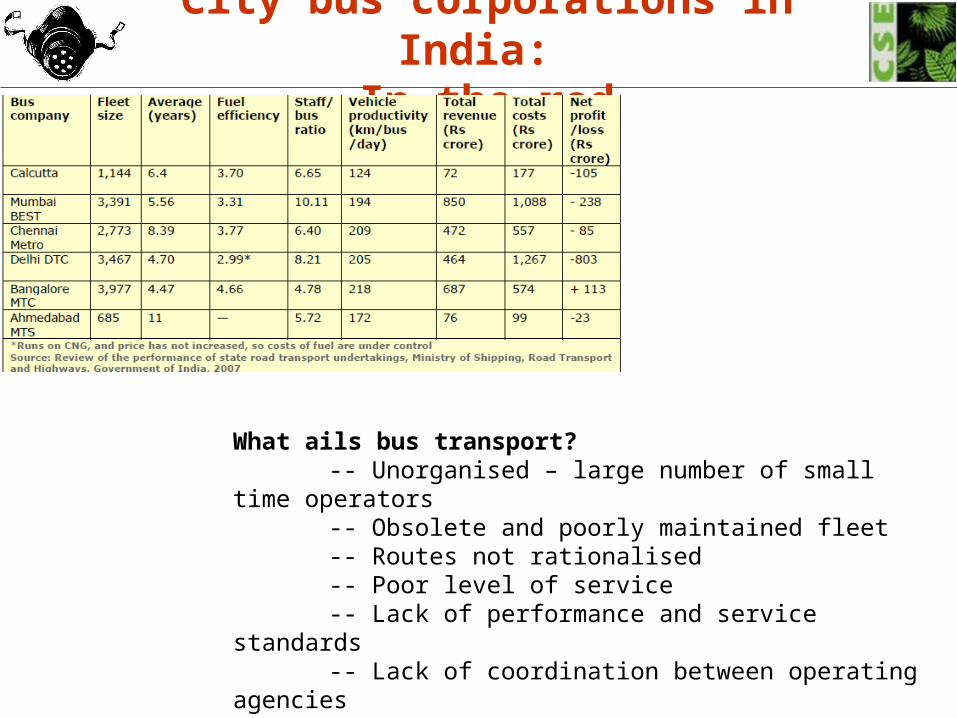
City bus corporations in India: In the red
What ails bus transport?-- Unorganised – large number of small time operators-- Obsolete and poorly maintained fleet-- Routes not rationalised-- Poor level of service-- Lack of performance and service standards-- Lack of coordination between operating agencies
All city governments are under pressure to reform the bus sector
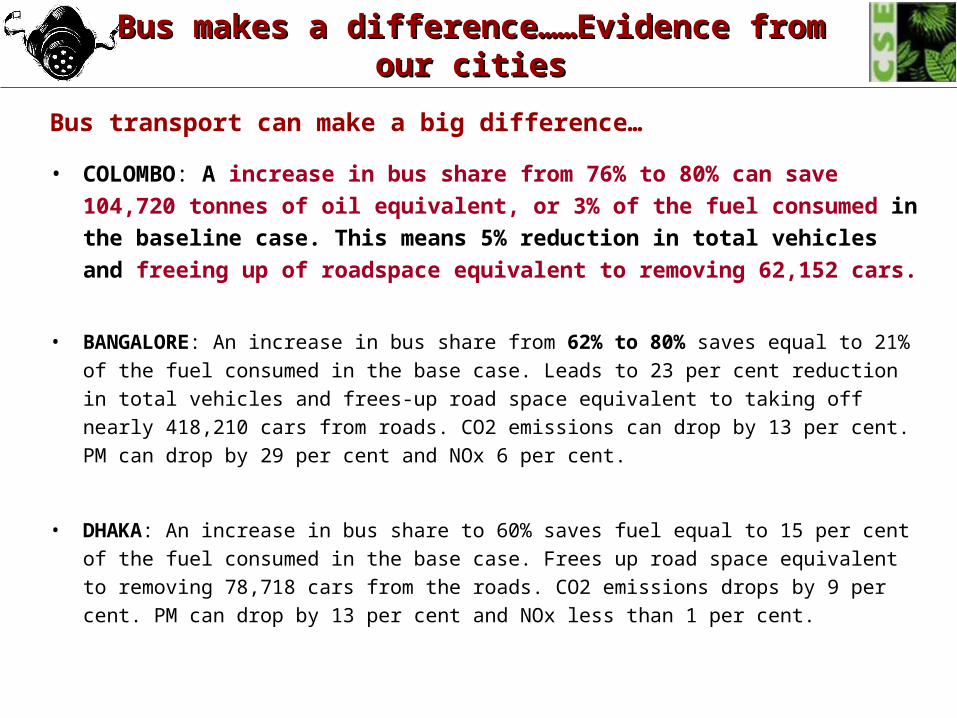
Bus makes a difference……Evidence from our citiesBus makes a difference……Evidence from our cities
Bus transport can make a big difference…
• COLOMBO: A increase in bus share from 76% to 80% can save 104,720
tonnes of oil equivalent, or 3% of the fuel consumed in the baseline case.
This means 5% reduction in total vehicles and freeing up of roadspace
equivalent to removing 62,152 cars.
• BANGALORE: An increase in bus share from 62% to 80% saves equal to 21% of the
fuel consumed in the base case. Leads to 23 per cent reduction in total vehicles and
frees-up road space equivalent to taking off nearly 418,210 cars from roads. CO2
emissions can drop by 13 per cent. PM can drop by 29 per cent and NOx 6 per cent.
• DHAKA: An increase in bus share to 60% saves fuel equal to 15 per cent of the fuel
consumed in the base case. Frees up road space equivalent to removing 78,718 cars
from the roads. CO2 emissions drops by 9 per cent. PM can drop by 13 per cent and
NOx less than 1 per cent.
87
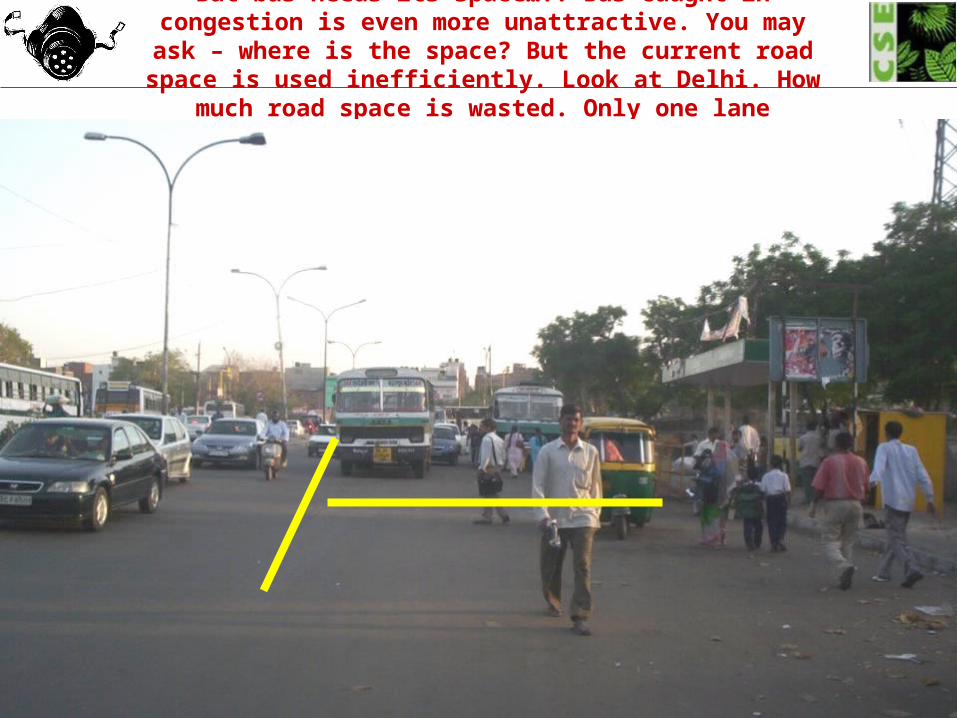
But bus needs its space….. Bus caught in congestion is even more unattractive. You may ask – where is the space? But the current
road space is used inefficiently. Look at Delhi. How much road space is wasted. Only one lane available to motorists.
88
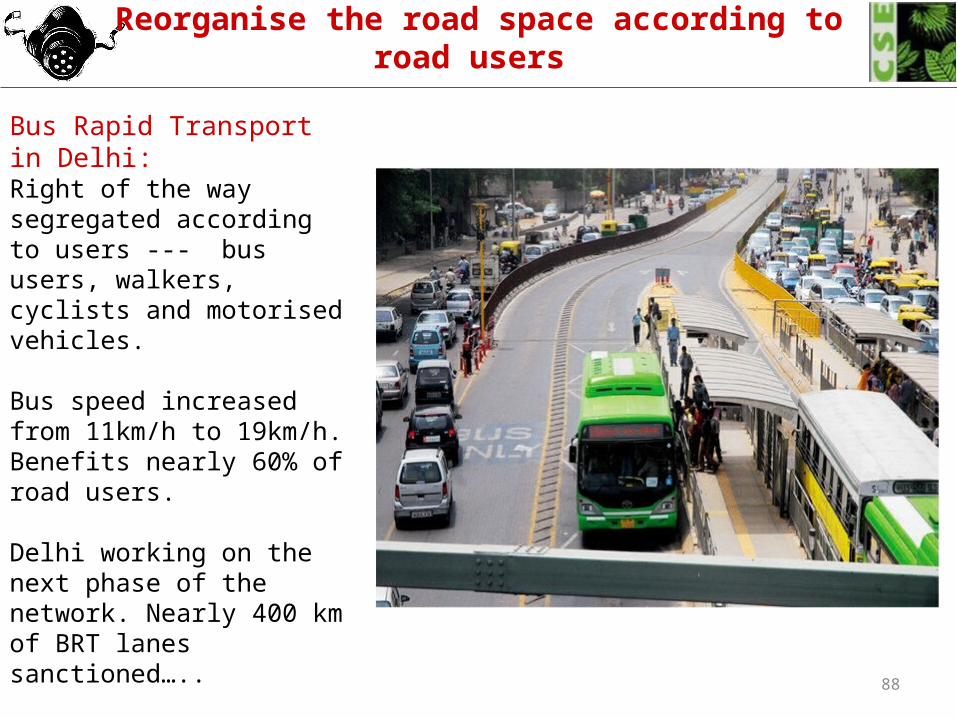
Need equity in the usage of road spaceReorganise the road space according to road users
Bus Rapid Transport in Delhi:Right of the way segregated according to users --- bus users, walkers, cyclists and motorised vehicles.
Bus speed increased from 11km/h to 19km/h. Benefits nearly 60% of road users.
Delhi working on the next phase of the network. Nearly 400 km of BRT lanes sanctioned…..
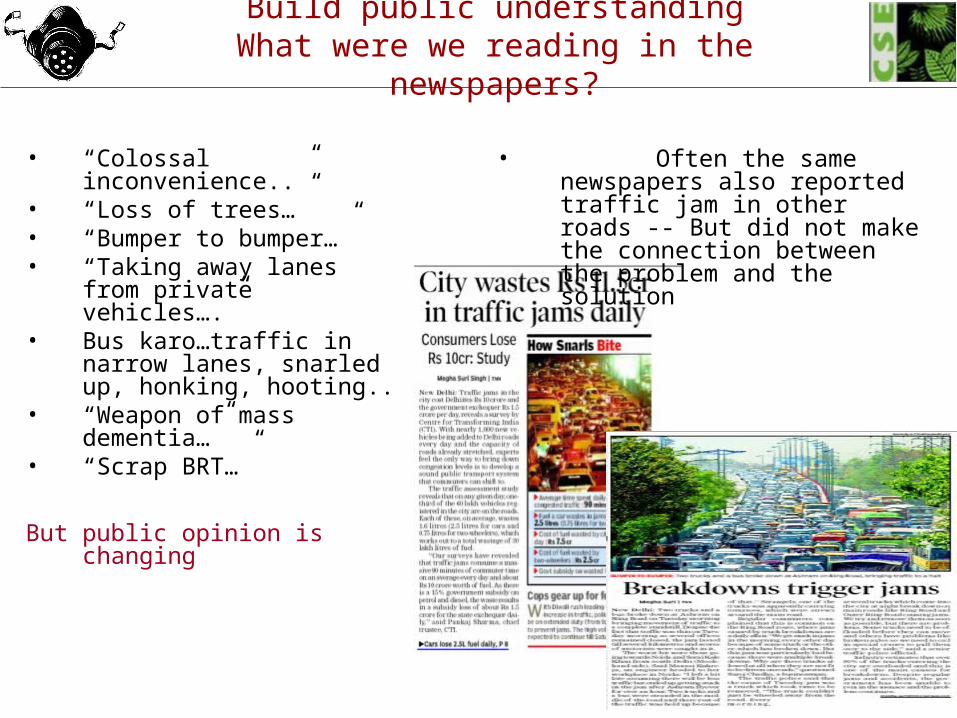
Build public understandingWhat were we reading in the newspapers?
• “Colossal inconvenience..”• “Loss of trees…”• “Bumper to bumper…”• “Taking away lanes from
private vehicles….”• Bus karo…traffic in narrow
lanes, snarled up, honking, hooting..
• “Weapon of mass dementia…”
• “Scrap BRT…”
But public opinion is changing
• Often the same newspapers also reported traffic jam in other roads -- But did not make the connection between the problem and the solution
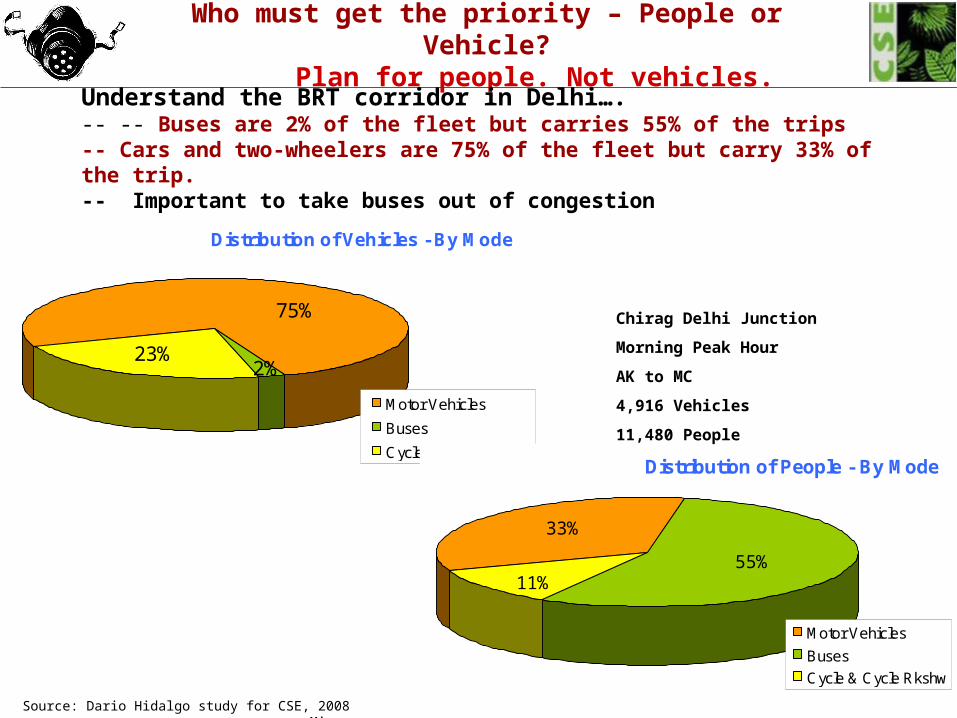
Who must get the priority – People or Vehicle?Plan for people. Not vehicles.
Distribution of Vehicles - By Mode
2%23%
75%
Motor Vehicles
Buses
Cycle & Cycle RkshwDistribution of People - By Mode
55%
33%
11%
Motor Vehicles
Buses
Cycle & Cycle Rkshw
Chirag Delhi Junction
Morning Peak Hour
AK to MC
4,916 Vehicles
11,480 People
Source: Dario Hidalgo study for CSE, 2008 Mimeo
Understand the BRT corridor in Delhi….-- -- Buses are 2% of the fleet but carries 55% of the trips-- Cars and two-wheelers are 75% of the fleet but carry 33% of the trip.-- Important to take buses out of congestion

Other governments are doing this as well…….Taipei
Photos: Jason Chang, 2002

Integrate, integrate integrate……….
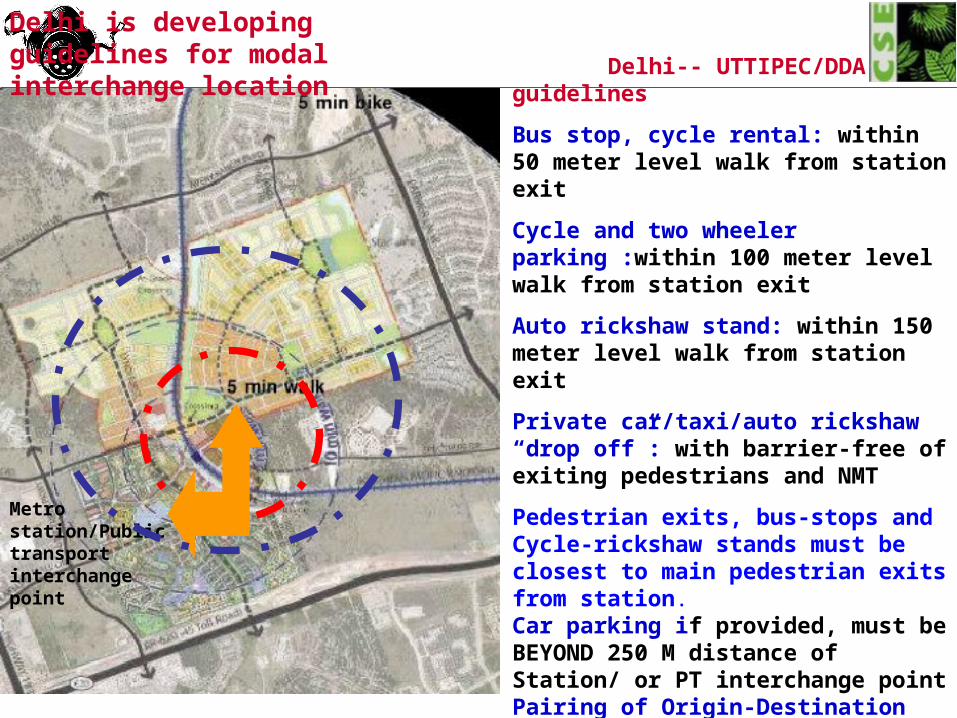
Delhi is developing guidelines for modal interchange location Delhi-- UTTIPEC/DDA guidelines
Bus stop, cycle rental: within 50 meter level walk from station exit
Cycle and two wheeler parking :within 100 meter level walk from station exit
Auto rickshaw stand: within 150 meter level walk from station exit
Private car/taxi/auto rickshaw “drop off”: with barrier-free of exiting pedestrians and NMT
Pedestrian exits, bus-stops and Cycle-rickshaw stands must be closest to main pedestrian exits from station.Car parking if provided, must be BEYOND 250 M distance of Station/ or PT interchange pointPairing of Origin-Destination (O-D) Nodes: Provide cycle/ auto stands at nearby important destinations. Signages at both end locations.Private car parking only at Terminal Stations. Discourage car parking at Stations within inner-city urbanized areas.
Metro station/Public transport interchange point
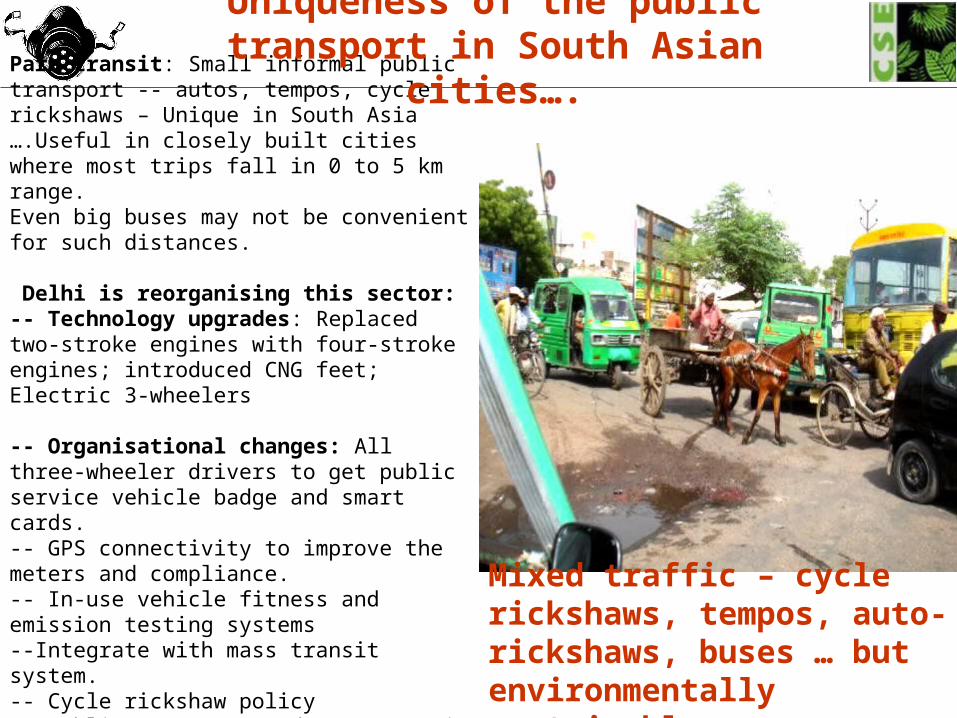
Para transit: Small informal public transport -- autos, tempos, cycle rickshaws – Unique in South Asia ….Useful in closely built cities where most trips fall in 0 to 5 km range. Even big buses may not be convenient for such distances.
Delhi is reorganising this sector:-- Technology upgrades: Replaced two-stroke engines with four-stroke engines; introduced CNG feet; Electric 3-wheelers
-- Organisational changes: All three-wheeler drivers to get public service vehicle badge and smart cards. -- GPS connectivity to improve the meters and compliance. -- In-use vehicle fitness and emission testing systems --Integrate with mass transit system. -- Cycle rickshaw policy-- Public transport and para-transit must integrate not compete
Uniqueness of the public transport in South Asian cities….
Mixed traffic – cycle rickshaws, tempos, auto-rickshaws, buses … but environmentally sustainable.
Public transport cannot work in isolation…..
Need walkways, intermediate public transport, and non-motorised transport…… Why?
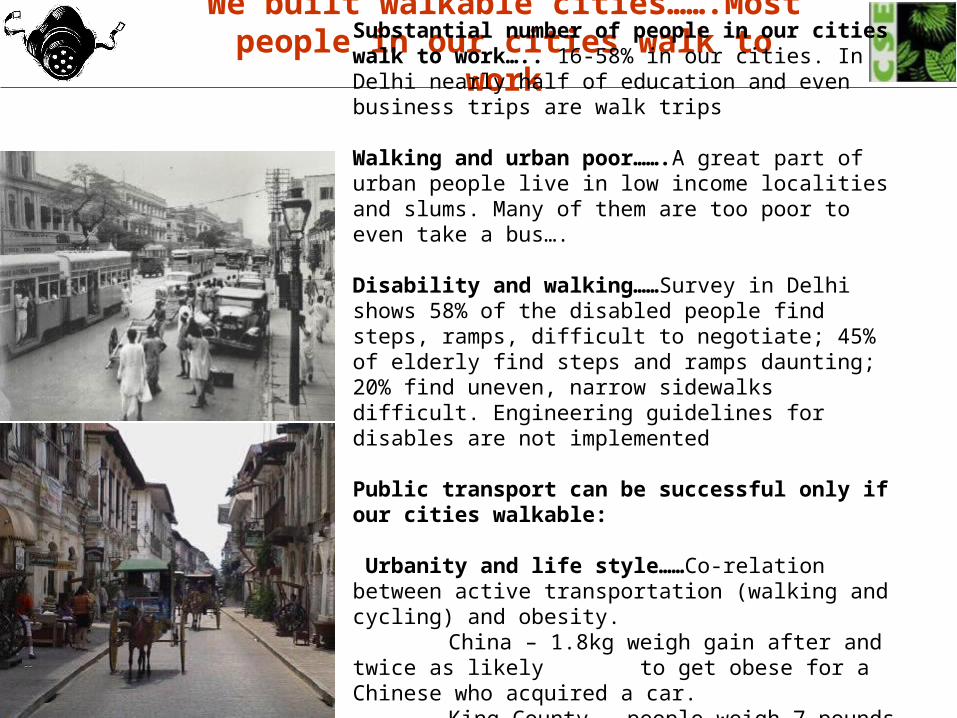
We built walkable cities…….Most people in our cities walk to work
Substantial number of people in our cities walk to work….. 16-58% in our cities. In Delhi nearly half of education and even business trips are walk trips Walking and urban poor…….A great part of urban people live in low income localities and slums. Many of them are too poor to even take a bus….
Disability and walking……Survey in Delhi shows 58% of the disabled people find steps, ramps, difficult to negotiate; 45% of elderly find steps and ramps daunting; 20% find uneven, narrow sidewalks difficult. Engineering guidelines for disables are not implemented
Public transport can be successful only if our cities walkable:
Urbanity and life style……Co-relation between active transportation (walking and cycling) and obesity.
China – 1.8kg weigh gain after and twice as likely to get obese for a Chinese who acquired a car.
King County – people weigh 7 pounds less on an average in walkable neighbourhoods
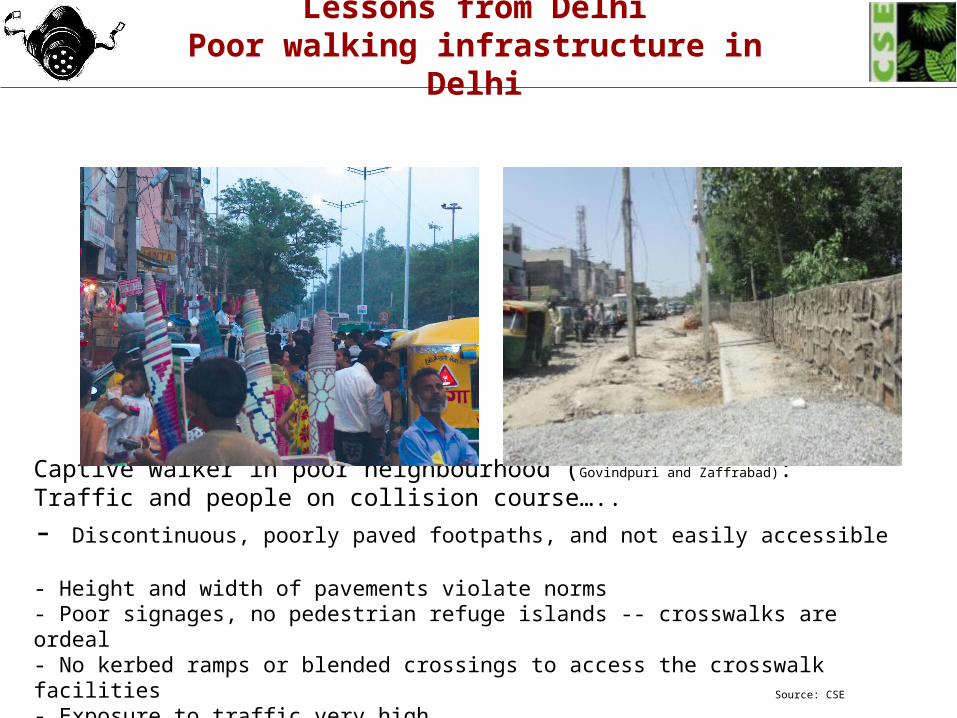
Lessons from DelhiPoor walking infrastructure in Delhi
Captive walker in poor neighbourhood (Govindpuri and Zaffrabad): Traffic and people on collision course…..
- Discontinuous, poorly paved footpaths, and not easily accessible - Height and width of pavements violate norms - Poor signages, no pedestrian refuge islands -- crosswalks are ordeal - No kerbed ramps or blended crossings to access the crosswalk facilities - Exposure to traffic very high.
Source: CSE
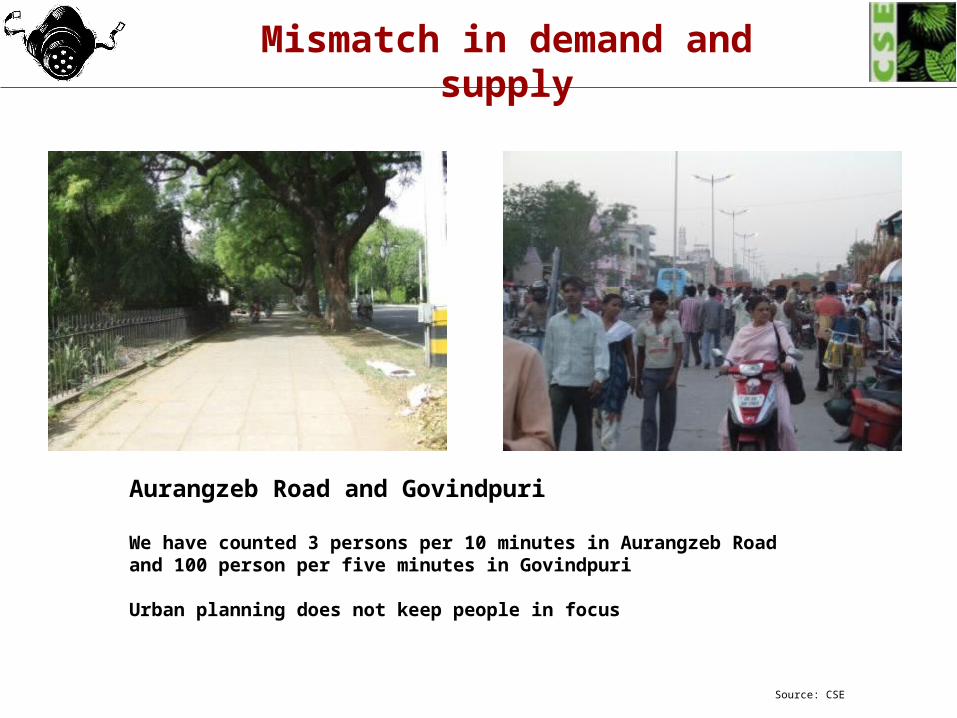
Mismatch in demand and supply
Aurangzeb Road and Govindpuri
We have counted 3 persons per 10 minutes in Aurangzeb Road and 100 person per five minutes in Govindpuri
Urban planning does not keep people in focus
Source: CSE
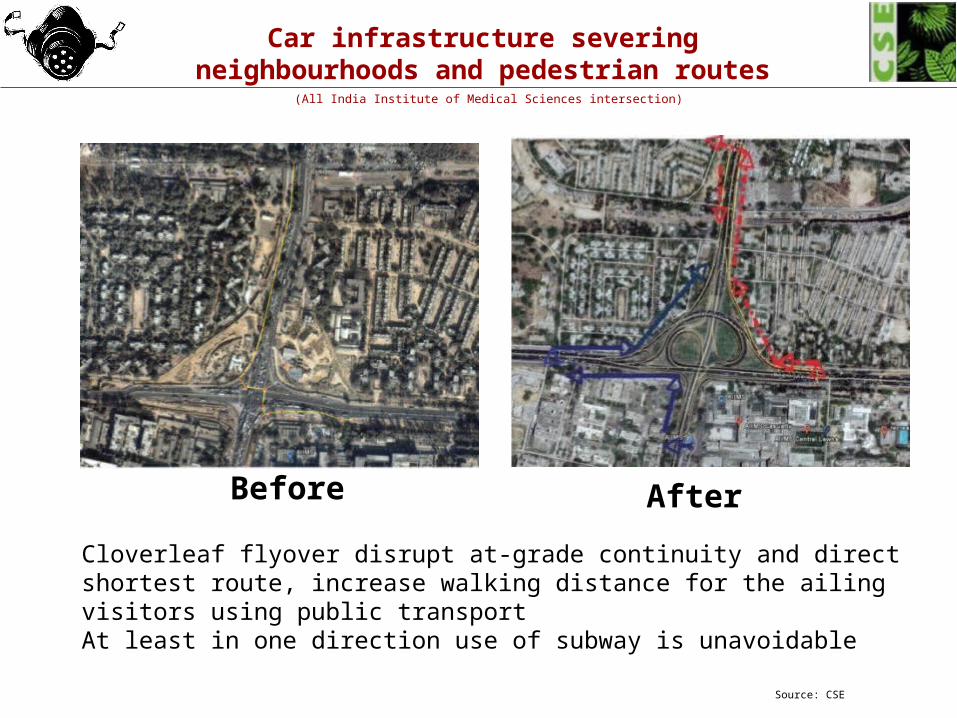
Car infrastructure severing neighbourhoods and pedestrian routes
(All India Institute of Medical Sciences intersection)
Cloverleaf flyover disrupt at-grade continuity and direct shortest route, increase walking distance for the ailing visitors using public transportAt least in one direction use of subway is unavoidable
Before After
Source: CSE
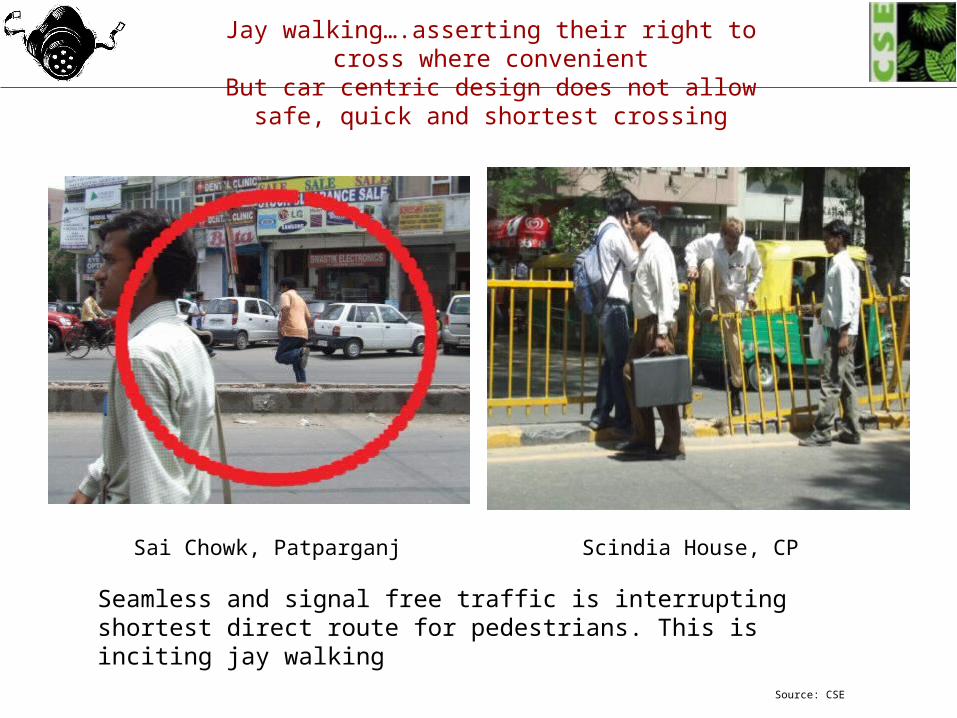
Jay walking….asserting their right to cross where convenientBut car centric design does not allow safe, quick and shortest
crossing
Seamless and signal free traffic is interrupting shortest direct route for pedestrians. This is inciting jay walking
Sai Chowk, Patparganj Scindia House, CP
Source: CSE
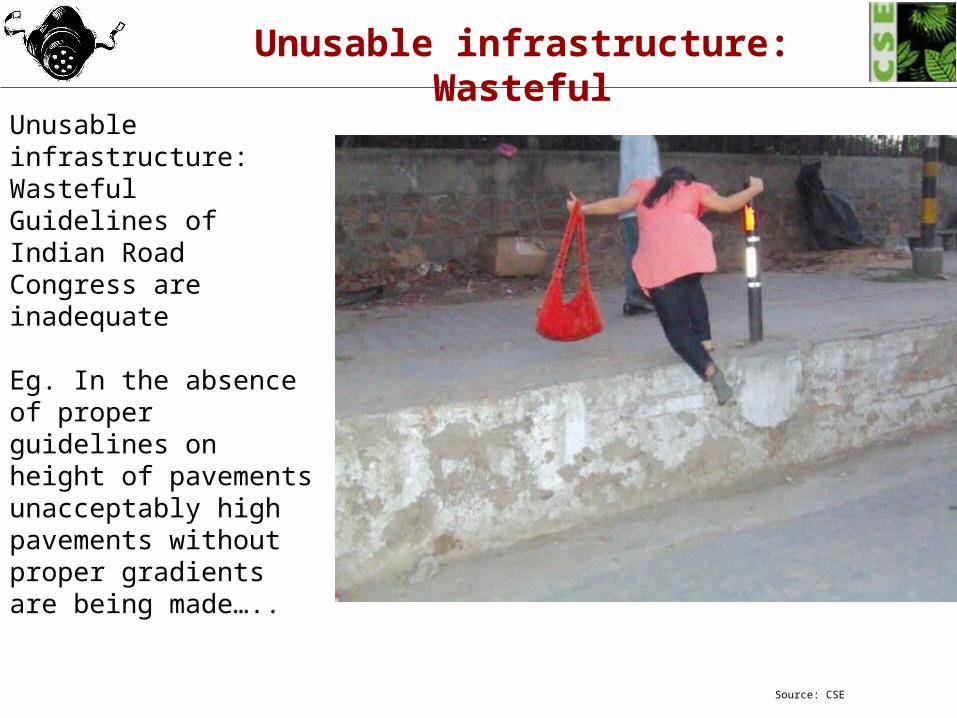
Unusable infrastructure: Wasteful
Unusable infrastructure: WastefulGuidelines of Indian Road Congress are inadequate
Eg. In the absence of proper guidelines on height of pavements unacceptably high pavements without proper gradients are being made…..
Source: CSE
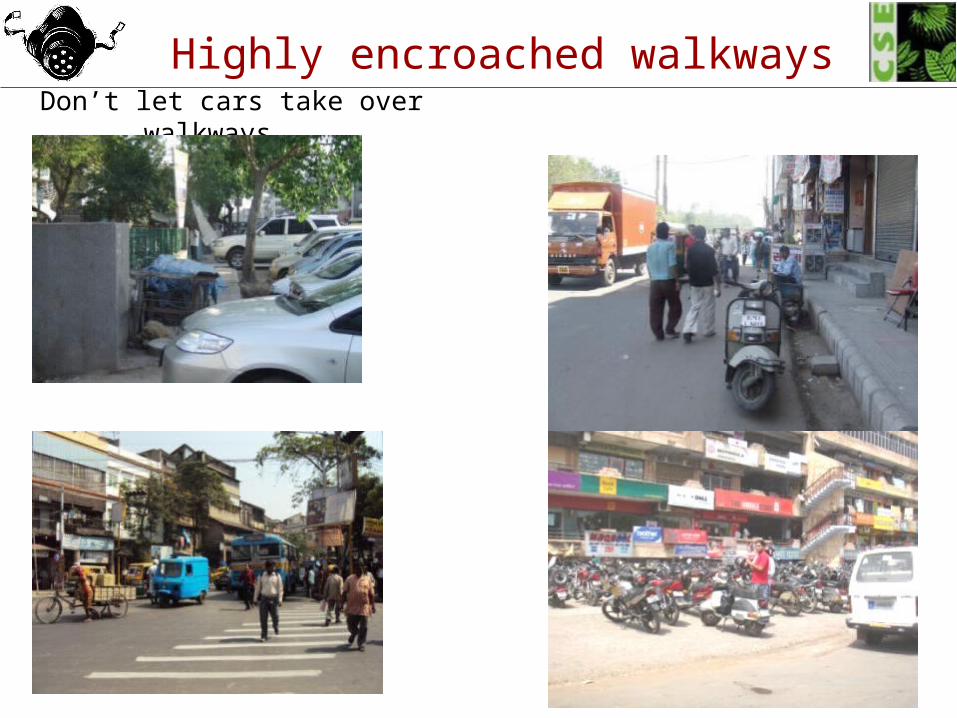
Don’t let cars take over walkways…..
Highly encroached walkways
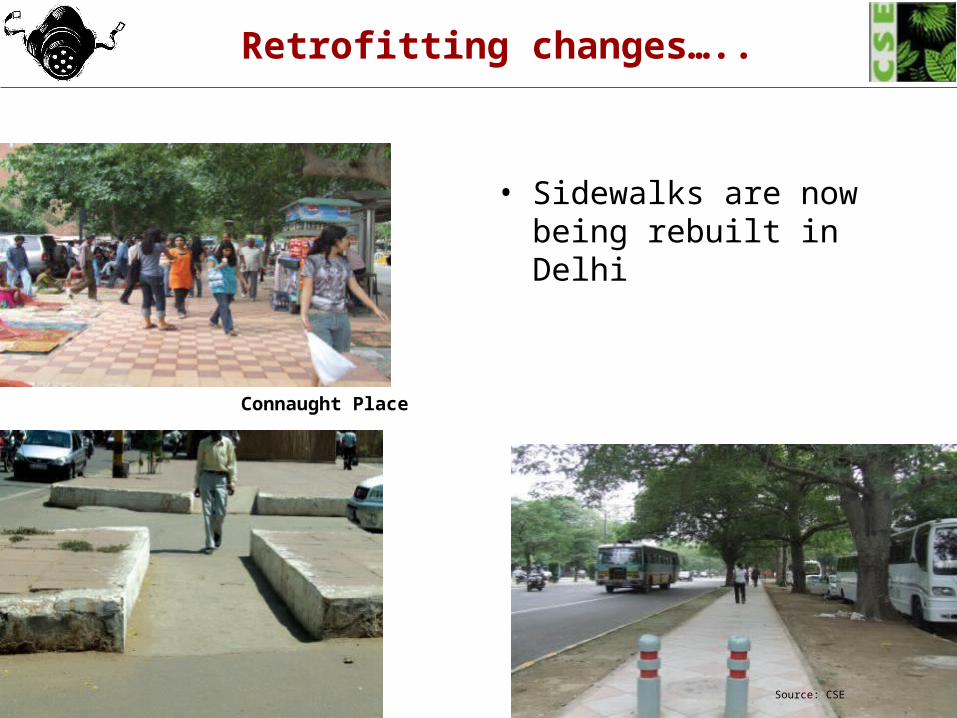
Retrofitting changes…..
Connaught Place
• Sidewalks are now being rebuilt in Delhi
Source: CSE
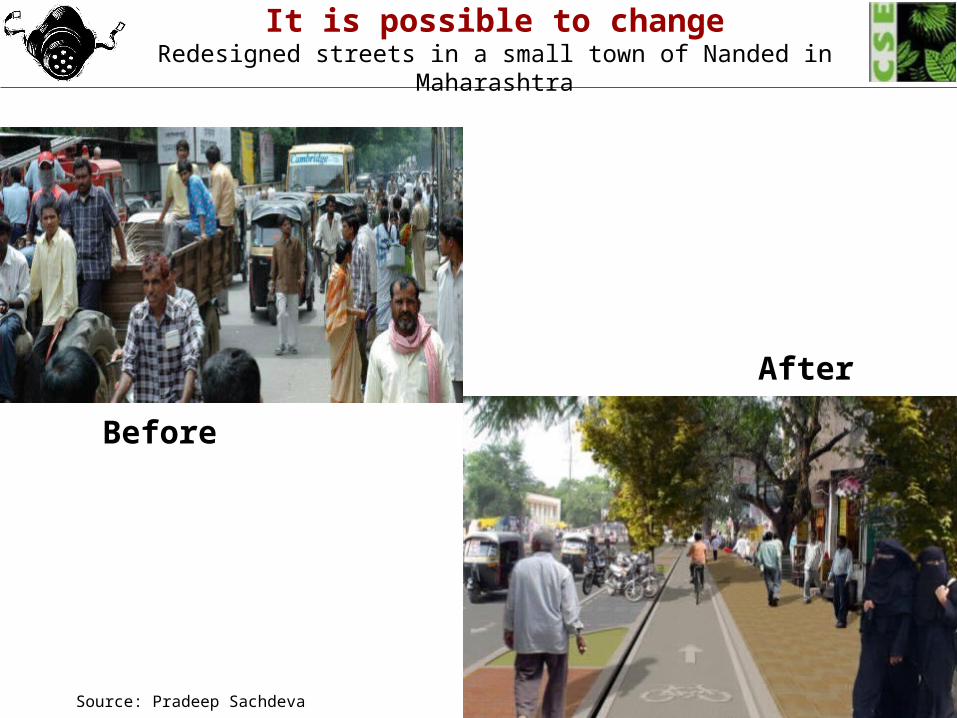
Source: Pradeep Sachdeva
It is possible to changeRedesigned streets in a small town of Nanded in Maharashtra
Before
After
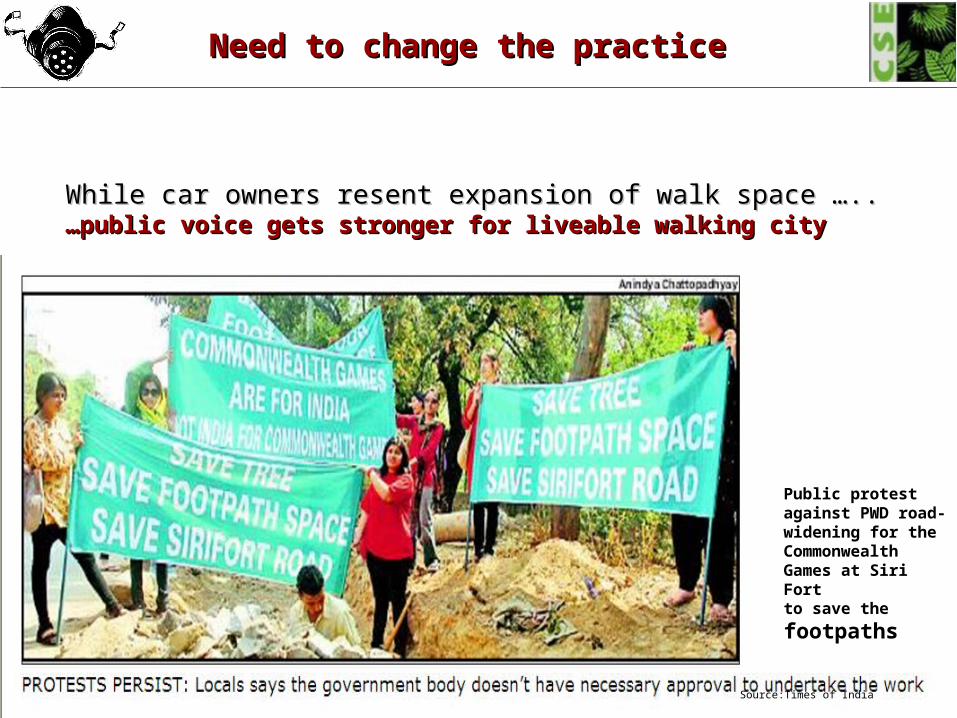
While car owners resent expansion of walk space ….. While car owners resent expansion of walk space ….. …public voice gets …public voice gets stronger for liveable walking citystronger for liveable walking city
Public protest against PWD road-widening for the Commonwealth Games at Siri Fort
to save the footpaths
Need to change the practiceNeed to change the practice
Source:Times of India
Walking needs policy strategy
Reform and enforce mandatory pedestrian guidelines for new roads as well as rebuild, beautification of existing roads – transform the entire city networkDelhi has adopted pedestrian guidelines. These are the basis of approval of road projects infrastructure funding.
Public transport plan needs linkage with pedestrian plan
Urban local bodies must conduct periodic walkability and safety audits
Legislate right to walk: Should we have comprehensive road users act?
Need zero tolerance policy for accidents
Involve communities on decisions on use of road space
Need pedestrian network plan
Adopt traffic volume reduction plan
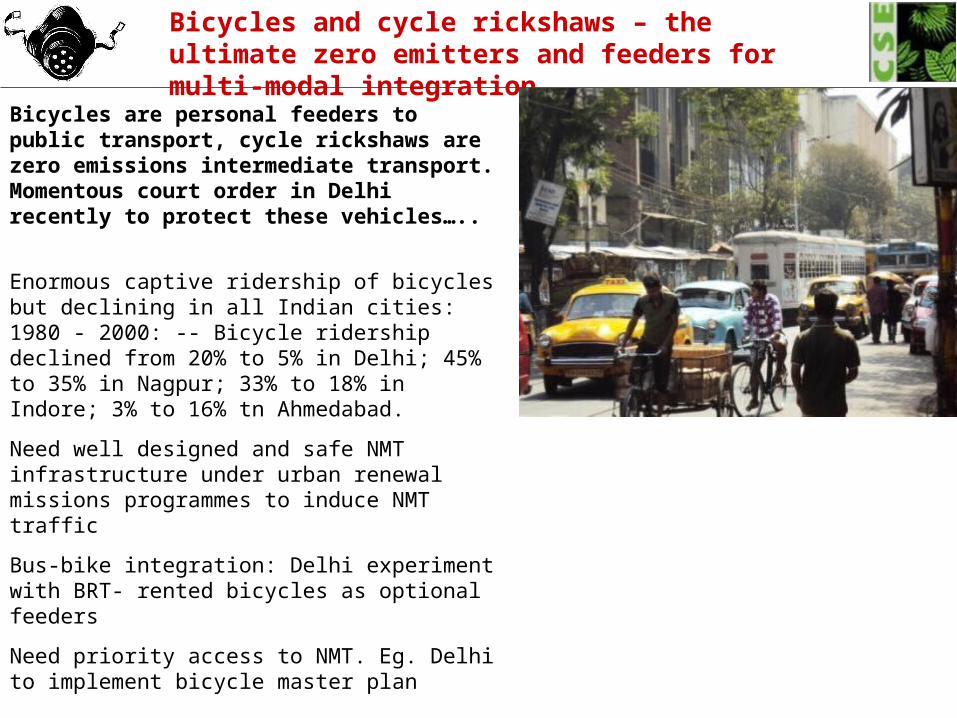
Bicycles and cycle rickshaws – the ultimate zero emitters and feeders for multi-modal integration
Bicycles are personal feeders to public transport, cycle rickshaws are zero emissions intermediate transport. Momentous court order in Delhi recently to protect these vehicles…..
Enormous captive ridership of bicycles but declining in all Indian cities: 1980 - 2000: -- Bicycle ridership declined from 20% to 5% in Delhi; 45% to 35% in Nagpur; 33% to 18% in Indore; 3% to 16% tn Ahmedabad.
Need well designed and safe NMT infrastructure under urban renewal missions programmes to induce NMT traffic
Bus-bike integration: Delhi experiment with BRT- rented bicycles as optional feeders
Need priority access to NMT. Eg. Delhi to implement bicycle master plan
Remove hidden subsidies to cars………..
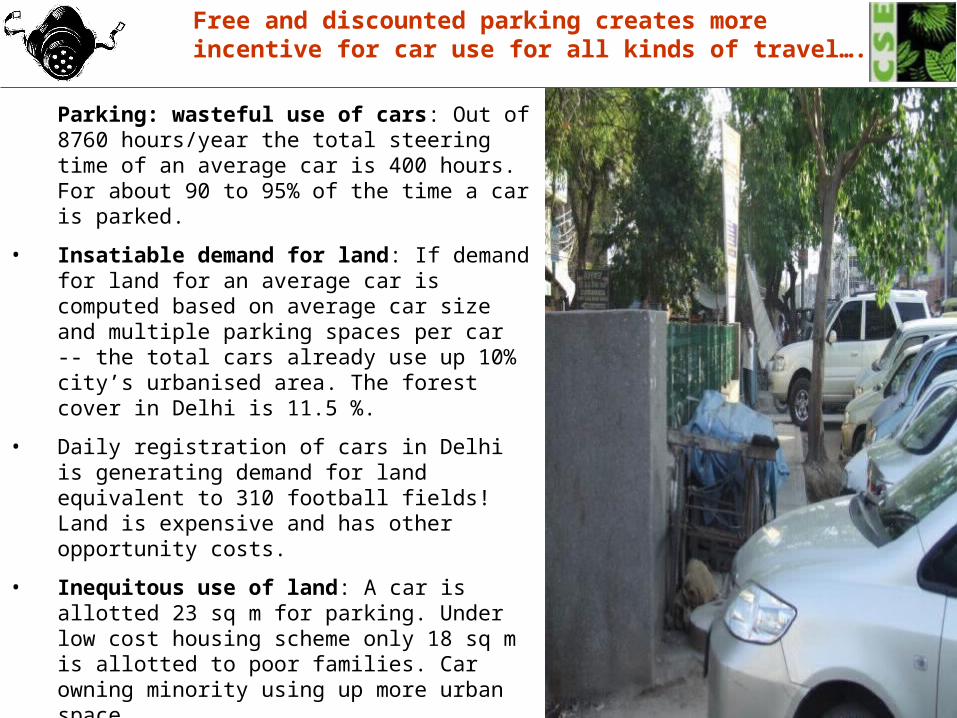
Free and discounted parking creates more incentive for car use for all kinds of travel….
Parking: wasteful use of cars: Out of 8760 hours/year the total steering time of an average car is 400 hours. For about 90 to 95% of the time a car is parked.
• Insatiable demand for land: If demand for land for an average car is computed based on average car size and multiple parking spaces per car -- the total cars already use up 10% city’s urbanised area. The forest cover in Delhi is 11.5 %.
• Daily registration of cars in Delhi is generating demand for land equivalent to 310 football fields! Land is expensive and has other opportunity costs.
• Inequitous use of land: A car is allotted 23 sq m for parking. Under low cost housing scheme only 18 sq m is allotted to poor families. Car owning minority using up more urban space.
• Cars are biggest encroachers in Kolkata: 30-40% of roads in Kolkata are taken up by parking; 50-70% of footpaths reduced due to on-street parking
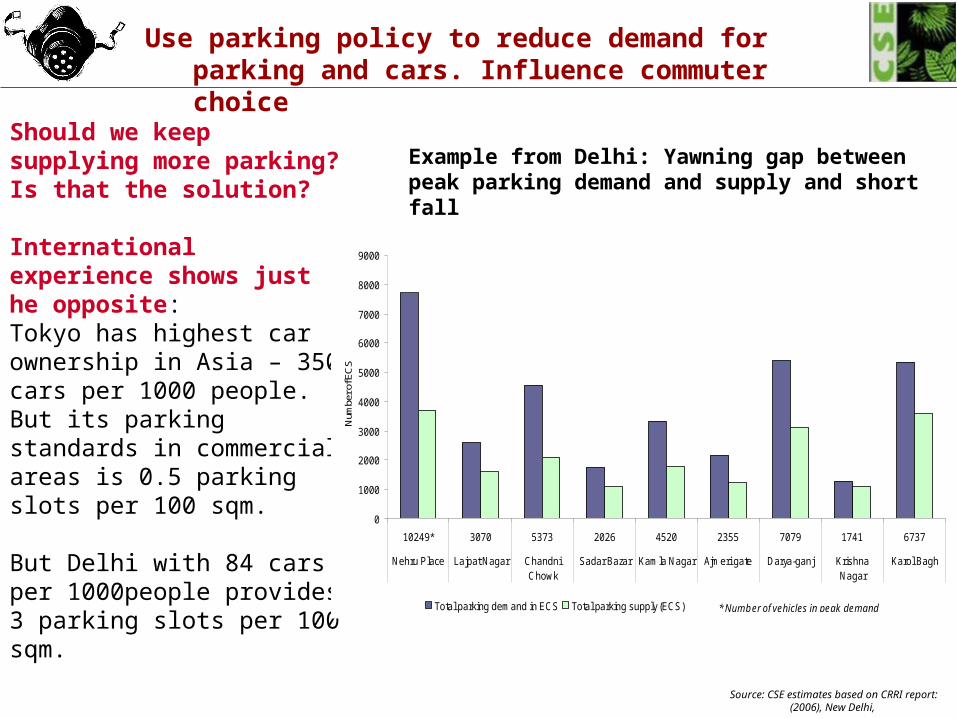
Use parking policy to reduce demand for parking and cars. Influence commuter choice
Source: CSE estimates based on CRRI report: (2006), New Delhi,
Example from Delhi: Yawning gap between peak parking demand and supply and short fall
Should we keep supplying more parking? Is that the solution?
International experience shows just he opposite: Tokyo has highest car ownership in Asia – 350 cars per 1000 people. But its parking standards in commercial areas is 0.5 parking slots per 100 sqm.
But Delhi with 84 cars per 1000people provides 3 parking slots per 100 sqm.
0
1000
2000
3000
4000
5000
6000
7000
8000
9000
10249* 3070 5373 2026 4520 2355 7079 1741 6737
Nehru Place Lajpat Nagar ChandniChowk
Sadar Bazar Kamla Nagar Ajmeri gate Darya-ganj KrishnaNagar
Karol Bagh
Num
ber o
f EC
S
Total parking demand in ECS Total parking supply (ECS) * Number of vehicles in peak demand
BKM multi level parking HT multi level parking
Parking and commercial
Parking only Parking and commercial
Parking only
ECS 941 780 1,209 1,025
Cap. Cost Rs in lakh per ECS
4 4 4 4
Total Cost in lakhs (including cap, working, taxes etc) (Net Present Value)
5,290(Rs 1672 per sq feet)
3,849 7,523 5,310
Revenue in lakhs(NPV)
6,724 4,168 9,352 5,574
IRR in % 12.68 12.67 12.68 12.69
Parking charges Rs 10/h Rs 30.25/h Rs 10/h Rs 39/h
Understanding cost of multi level parking
Example from Delhi
Delhi the cost of providing multi level parking is nearly Rs 4 lakh to 6 lakh per car space. Accordingly parking fee should be Rs 30-39 per hour. But people are used to paying paltry sum. This is a hidden subsidy to rich car owners.
Lesson from Mumbai: Discrepancy in rates can lead to underutilisation of
parking structure
INOX the multiplex in Nariman Point
Before construction of MLP: No. of surface parking spaces: 140, Utilisation: 100% during office hours
After: No. of parking spaces: 540, Utilisation during office hours: 10% Parking rates are Rs 5 per 30 minutes or Rs 10 per hour.
Surface parking rates : Rs 5 per hour and Rs 3 for every additional hour.
Poor utilization of multi level lot
Source: Mumbai Environmental Social Network
Need parity of rates between structured and surface parking
Principles that must guide parking pricing
Graded parking rates according to Peak hour, duration of stay; commercial importance of areas; Weekdays when demand is high and weekends when low. -- Fix parking rates at a level to influence commuter choice-- Higher rates at convenient places than the inconvenient places-- Limit parking duration for short term users. This can lead to higher customer turnover
-- Free parking for cycles and cycle rickshaws and reduced/free rates for battery operated vehicles and public transport vehicles.
-- Parking rates should be higher for big cars and SUVs
Parking policy: Guiding principles….
• Adopt flexible parking standards and review parking standards. Do not create oversupply. Account for improved public transport access and reduction in personal vehicle travel.
• Integrate parking design with multi-modal integration. Priority to NMT and public transport
• More stringent parking controls and enforcement in areas well served by public transport. Phase out on-street parking in targeted areas.
• Parking pricing -- Minimise free parking, restrict on-street parking, use variable parking rates, avoid fixed annual payment, price parity between surface and multi-level parking
• No parking on green spaces, pavement, NMT lanes, and service lanes. Non-negotiable.
• Need parking strategy for residential areas and mixed land use areas.
• Use parking revenue for other congestion reduction strategies and local amenities
• Stringent penalty on parking violations.
• Develop parking strategy for special localities like hospitals, railway station, cinemas, shopping malls, schools, high impact events etc
• Provide parking for public transport vehicles
• Need innovative parking strategies for residential areas for demand management
Policy opportunity: National Urban transport policy provides for parking as a restraint measure; JNNURM reform agenda; Supreme Court directives on parking and congestion.
Other countries are limiting and pricing parking supply
Portland, Oregon set an overall cap of 40,000 parking spaces downtown. This increased public transport usage from 20-25 per cent in the 1970s to 48 per cent in mid 1990s.
Seattle allows a maximum of one parking space per 100 square metres at downtown office
San Francisco limits parking to seven per cent of a downtown building’s floor area
New York: Very high parking fees and limited parking supply lowers car ownership far below the average rates in other US cities.
Boston has frozen parking requirements at 10 per cent higher than the 1973 levels. This has helped Boston to meet the federal clean air standards.
Bogota has removed limit on the fees that private parking companies can charge. The revenue is dedicated to road maintenance and public transit improvement.
Shenzhen: Hike in parking fees during peak hours leads to 30% drop in the parking demand.
Tokyo: Enforcement against parking violations cuts congestion drastically . Private firms allowed to issue tickets for parking violations. This makes on-street parking expensive.
Bremen: No free parking in city centre. Parking charges higher than public transport cost.
Globally, customers agree to pay high parking charges if they get good shopping and pedestrian environment. This also improves business.
The affordability challenges of mobility transition…………..
Are we spending on sustainable options adequately?.....
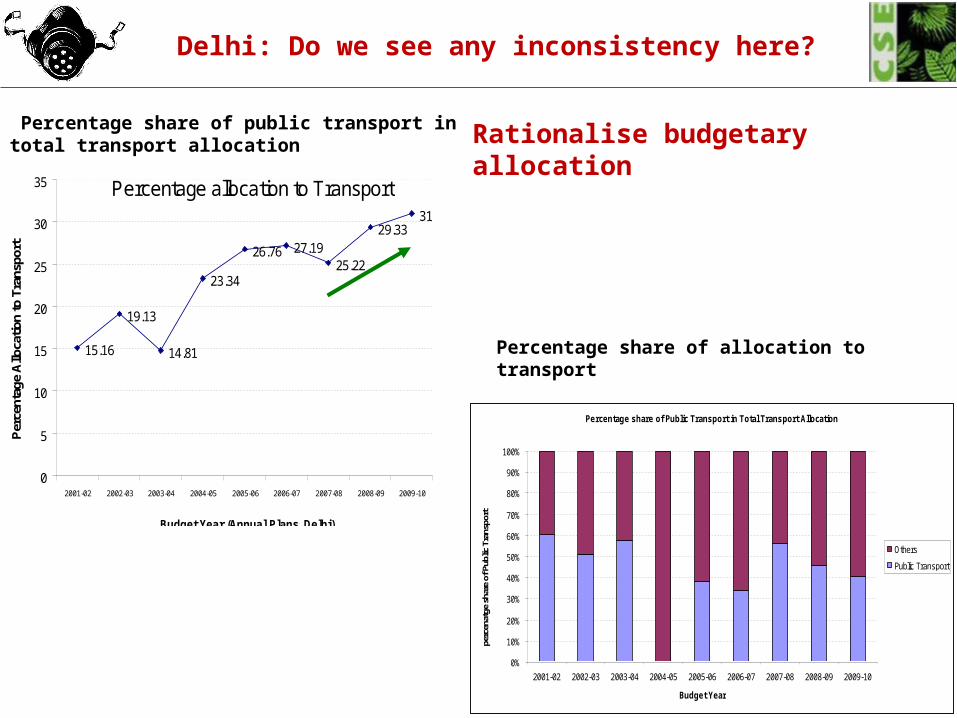
Delhi: Do we see any inconsistency here?
Percentage allocation to Transport
15.16
19.13
14.81
23.34
26.76 27.1925.22
29.3331
0
5
10
15
20
25
30
35
2001-02 2002-03 2003-04 2004-05 2005-06 2006-07 2007-08 2008-09 2009-10
Budget Year (Annual Plans, Delhi)
Per
cent
age
Allo
catio
n to
Tra
nspo
rt
Percentage share of allocation to transport
Percentage share of public transport in total transport allocation
Percentage share of Public Transport in Total Transport Allocation
0%
10%
20%
30%
40%
50%
60%
70%
80%
90%
100%
2001-02 2002-03 2003-04 2004-05 2005-06 2006-07 2007-08 2008-09 2009-10
Budget Year
perc
enat
ge s
hare
of P
ublic
Tra
nspo
rt
Others
Public Transport
Rationalise budgetary allocation
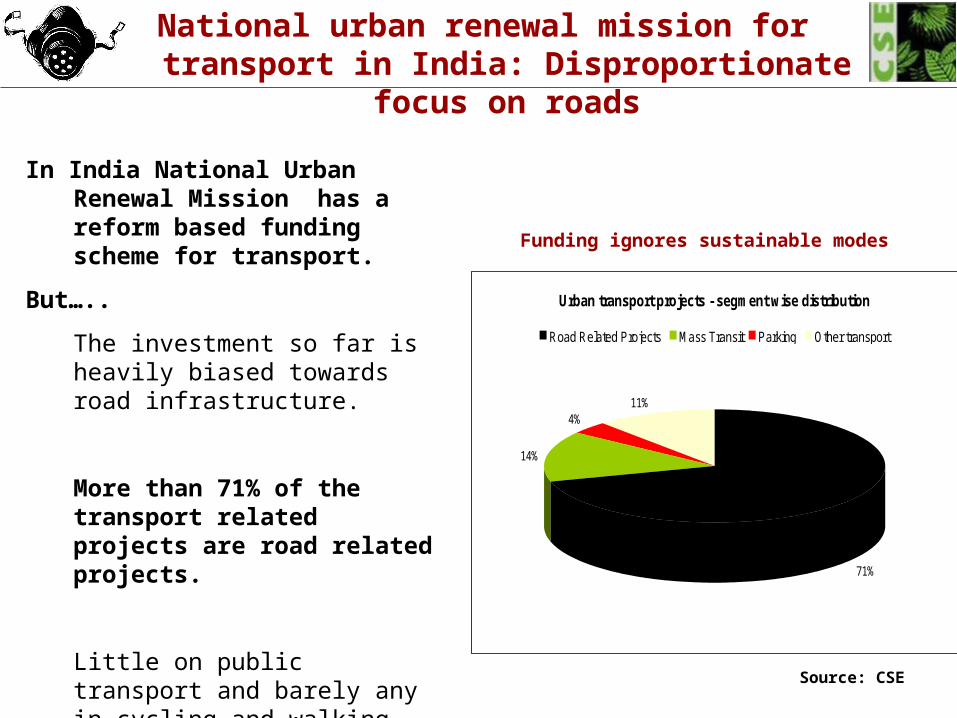
National urban renewal mission for transport in India: Disproportionate focus on roads
In India National Urban Renewal Mission has a reform based funding scheme for transport.
But…..
The investment so far is heavily biased towards road infrastructure.
More than 71% of the transport related projects are road related projects.
Little on public transport and barely any in cycling and walking infrastructure.
Urban transport projects - segment wise distribution
71%
14%
4%11%
Road Related Projects Mass Transit Parking Other transport
Funding ignores sustainable modes
Source: CSE
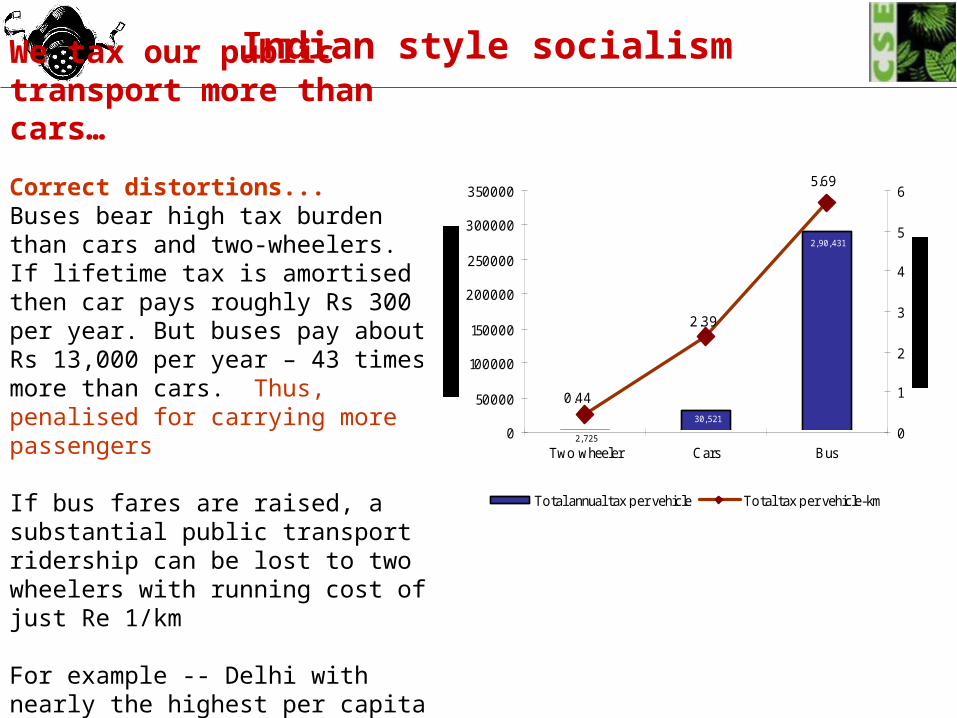
Indian style socialism
We tax our public transport more than cars…
Correct distortions...Buses bear high tax burden than cars and two-wheelers. If lifetime tax is amortised then car pays roughly Rs 300 per year. But buses pay about Rs 13,000 per year – 43 times more than cars. Thus, penalised for carrying more passengers
If bus fares are raised, a substantial public transport ridership can be lost to two wheelers with running cost of just Re 1/km
For example -- Delhi with nearly the highest per capita income and car pays the lowest taxes.
2,90,431
30,521
2,725
5.69
2.39
0.44
0
50000
100000
150000
200000
250000
300000
350000
Two wheeler Cars Bus0
1
2
3
4
5
6
Total annual tax per vehicle Total tax per vehicle-km
Tax per vehicle-km
Annual tax
India setting its reform agenda…..
JNNURM mandates dedicated urban transport fund
Identifies the following as the possible sources of funds that can act as a fiscal brake on car centric growth……
Waive off/reimburse all its taxes on urban buses and city bus service
Need advertisement policy to tap newer source of revenues
Need parking policy as a car restraint measure
Additional cess on automotive fuels
Additional registration fees on cars especially diesel cars and two-wheelers
Annual renewal fee on driving license, vehicle registration
Congestion tax
Nascent beginning…
Indian cities have begun to apply fiscal instruments
Delhi: Air Ambience Fund from environment cess on diesel fuel:Air Ambience fee of 25 paise per litre on sale of diesel fuel has been implemented. Air Ambience Fund used to subsidise battery operated vehicles from the 15 per cent subsidy and 12.5 per cent VAT reimbursement. Also subsidise conversion of old commercial LCVs.
Surat: Dedicated urban transport fund: Its revenue components to include vehicle tax amounting to Rs 8 crore, pay and park charges of Rs. 2 crore and license fee for advertisement rights of all kinds amounting to Rs. 5 crore
Bangalore: Green tax: Bangalore has taken the lead to introduce Green tax that is imposed on the older vehicles.
Fiscal incentive for LPG conversion Comprehensive parking Policy proposed
Hyderabad: Exemption of motor vehicles tax on vehicles running on CNG, battery and solar power
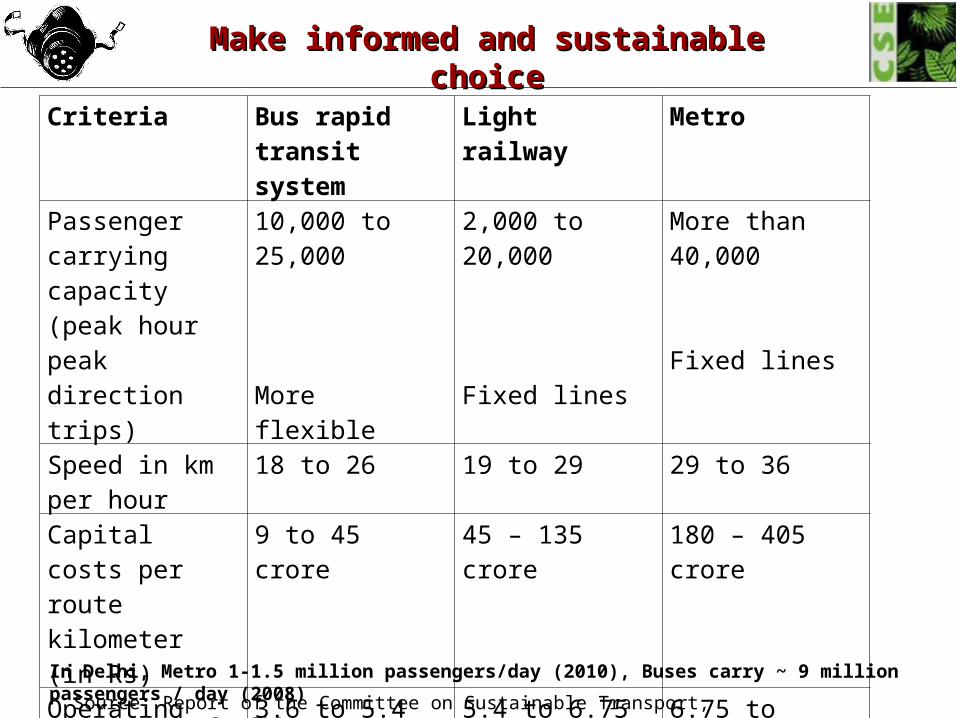
Make informed and sustainable choiceMake informed and sustainable choice
Criteria Bus rapid transit system
Light railway Metro
Passenger carrying capacity (peak hour peak direction trips)
10,000 to 25,000
More flexible
2,000 to 20,000
Fixed lines
More than 40,000
Fixed lines
Speed in km per hour
18 to 26 19 to 29 29 to 36
Capital costs per route kilometer (in Rs)
9 to 45 crore 45 – 135 crore 180 – 405 crore
Operating costs (Rs per passenger km)
3.6 to 5.4 5.4 to 6.75 6.75 to 10.35
Source: Report of the Committee on Sustainable Transport, Government of Delhi, 2002
In Delhi, Metro 1-1.5 million passengers/day (2010), Buses carry ~ 9 million passengers / day (2008)
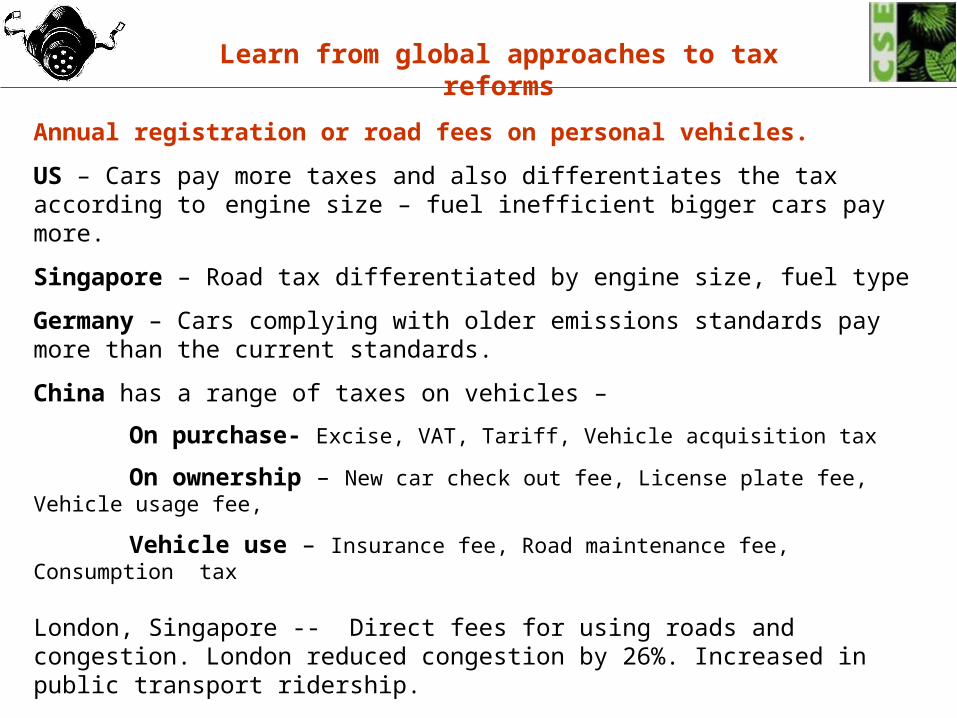
Learn from global approaches to tax reforms
Annual registration or road fees on personal vehicles.
US – Cars pay more taxes and also differentiates the tax according to engine size – fuel inefficient bigger cars pay more.
Singapore – Road tax differentiated by engine size, fuel type
Germany – Cars complying with older emissions standards pay more than the current standards.
China has a range of taxes on vehicles –
On purchase- Excise, VAT, Tariff, Vehicle acquisition tax
On ownership – New car check out fee, License plate fee, Vehicle usage fee,
Vehicle use – Insurance fee, Road maintenance fee, Consumption tax
London, Singapore -- Direct fees for using roads and congestion. London reduced congestion by 26%. Increased in public transport ridership.
There is no one silver bullet. Need a package of fiscal strategy to make the difference
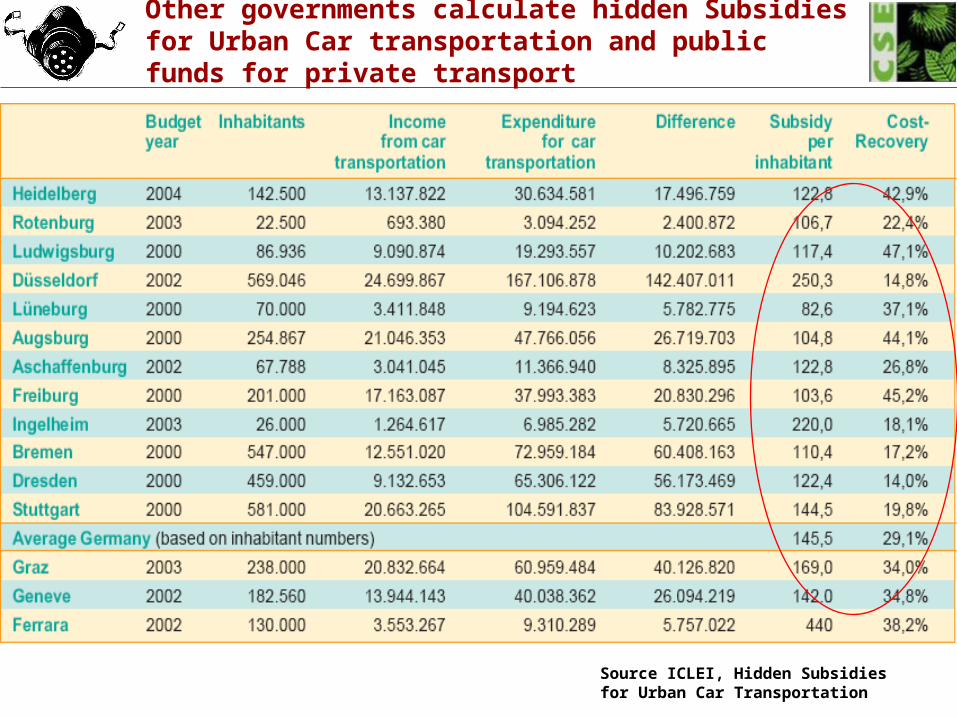
Other governments calculate hidden Subsidies for Urban Car transportation and public funds for private transport
Source ICLEI, Hidden Subsidies for Urban Car Transportation
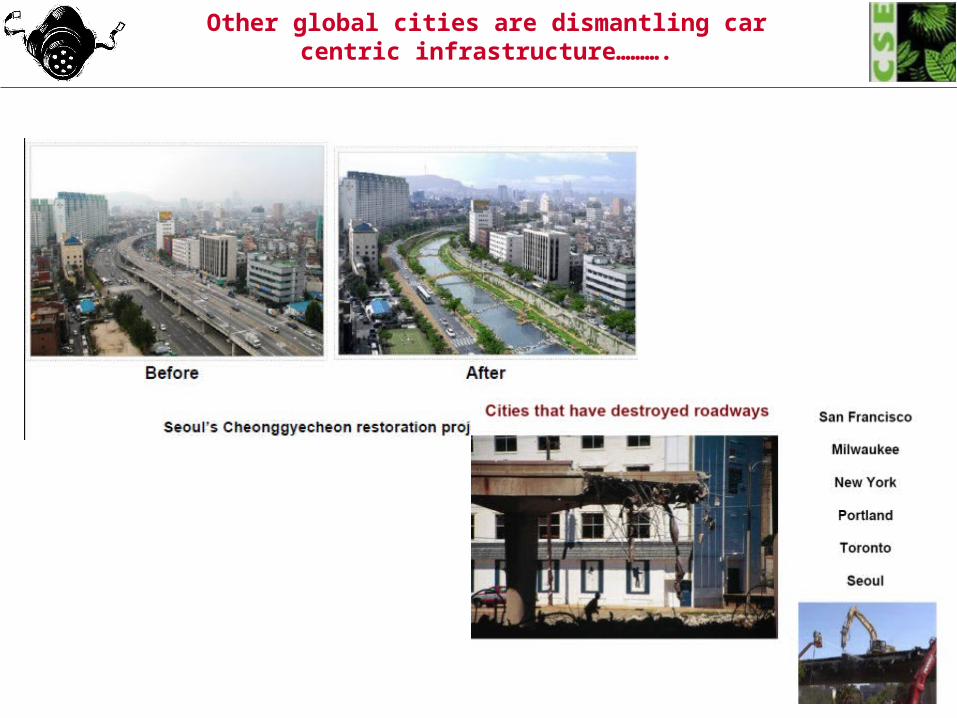
Other global cities are dismantling car centric infrastructure……….
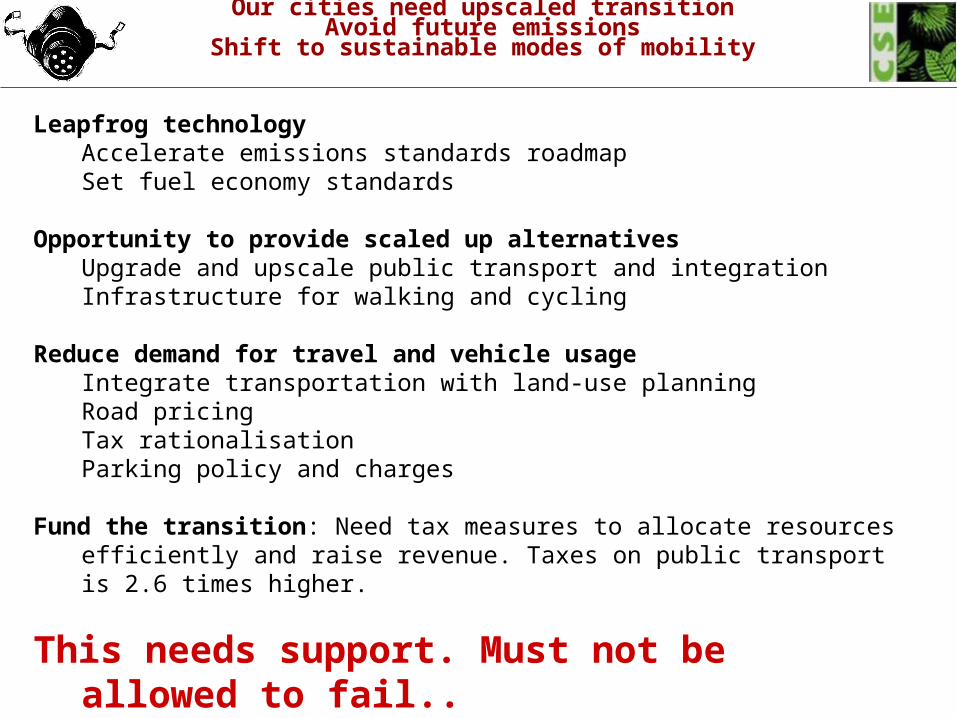
Our cities need upscaled transitionAvoid future emissions
Shift to sustainable modes of mobility
Leapfrog technologyAccelerate emissions standards roadmapSet fuel economy standards
Opportunity to provide scaled up alternativesUpgrade and upscale public transport and integrationInfrastructure for walking and cycling
Reduce demand for travel and vehicle usageIntegrate transportation with land-use planningRoad pricingTax rationalisationParking policy and charges
Fund the transition: Need tax measures to allocate resources efficiently and raise revenue. Taxes on public transport is 2.6 times higher.
This needs support. Must not be allowed to fail..
Otherwise what???
Thank You…