Embed Size (px)
Citation preview

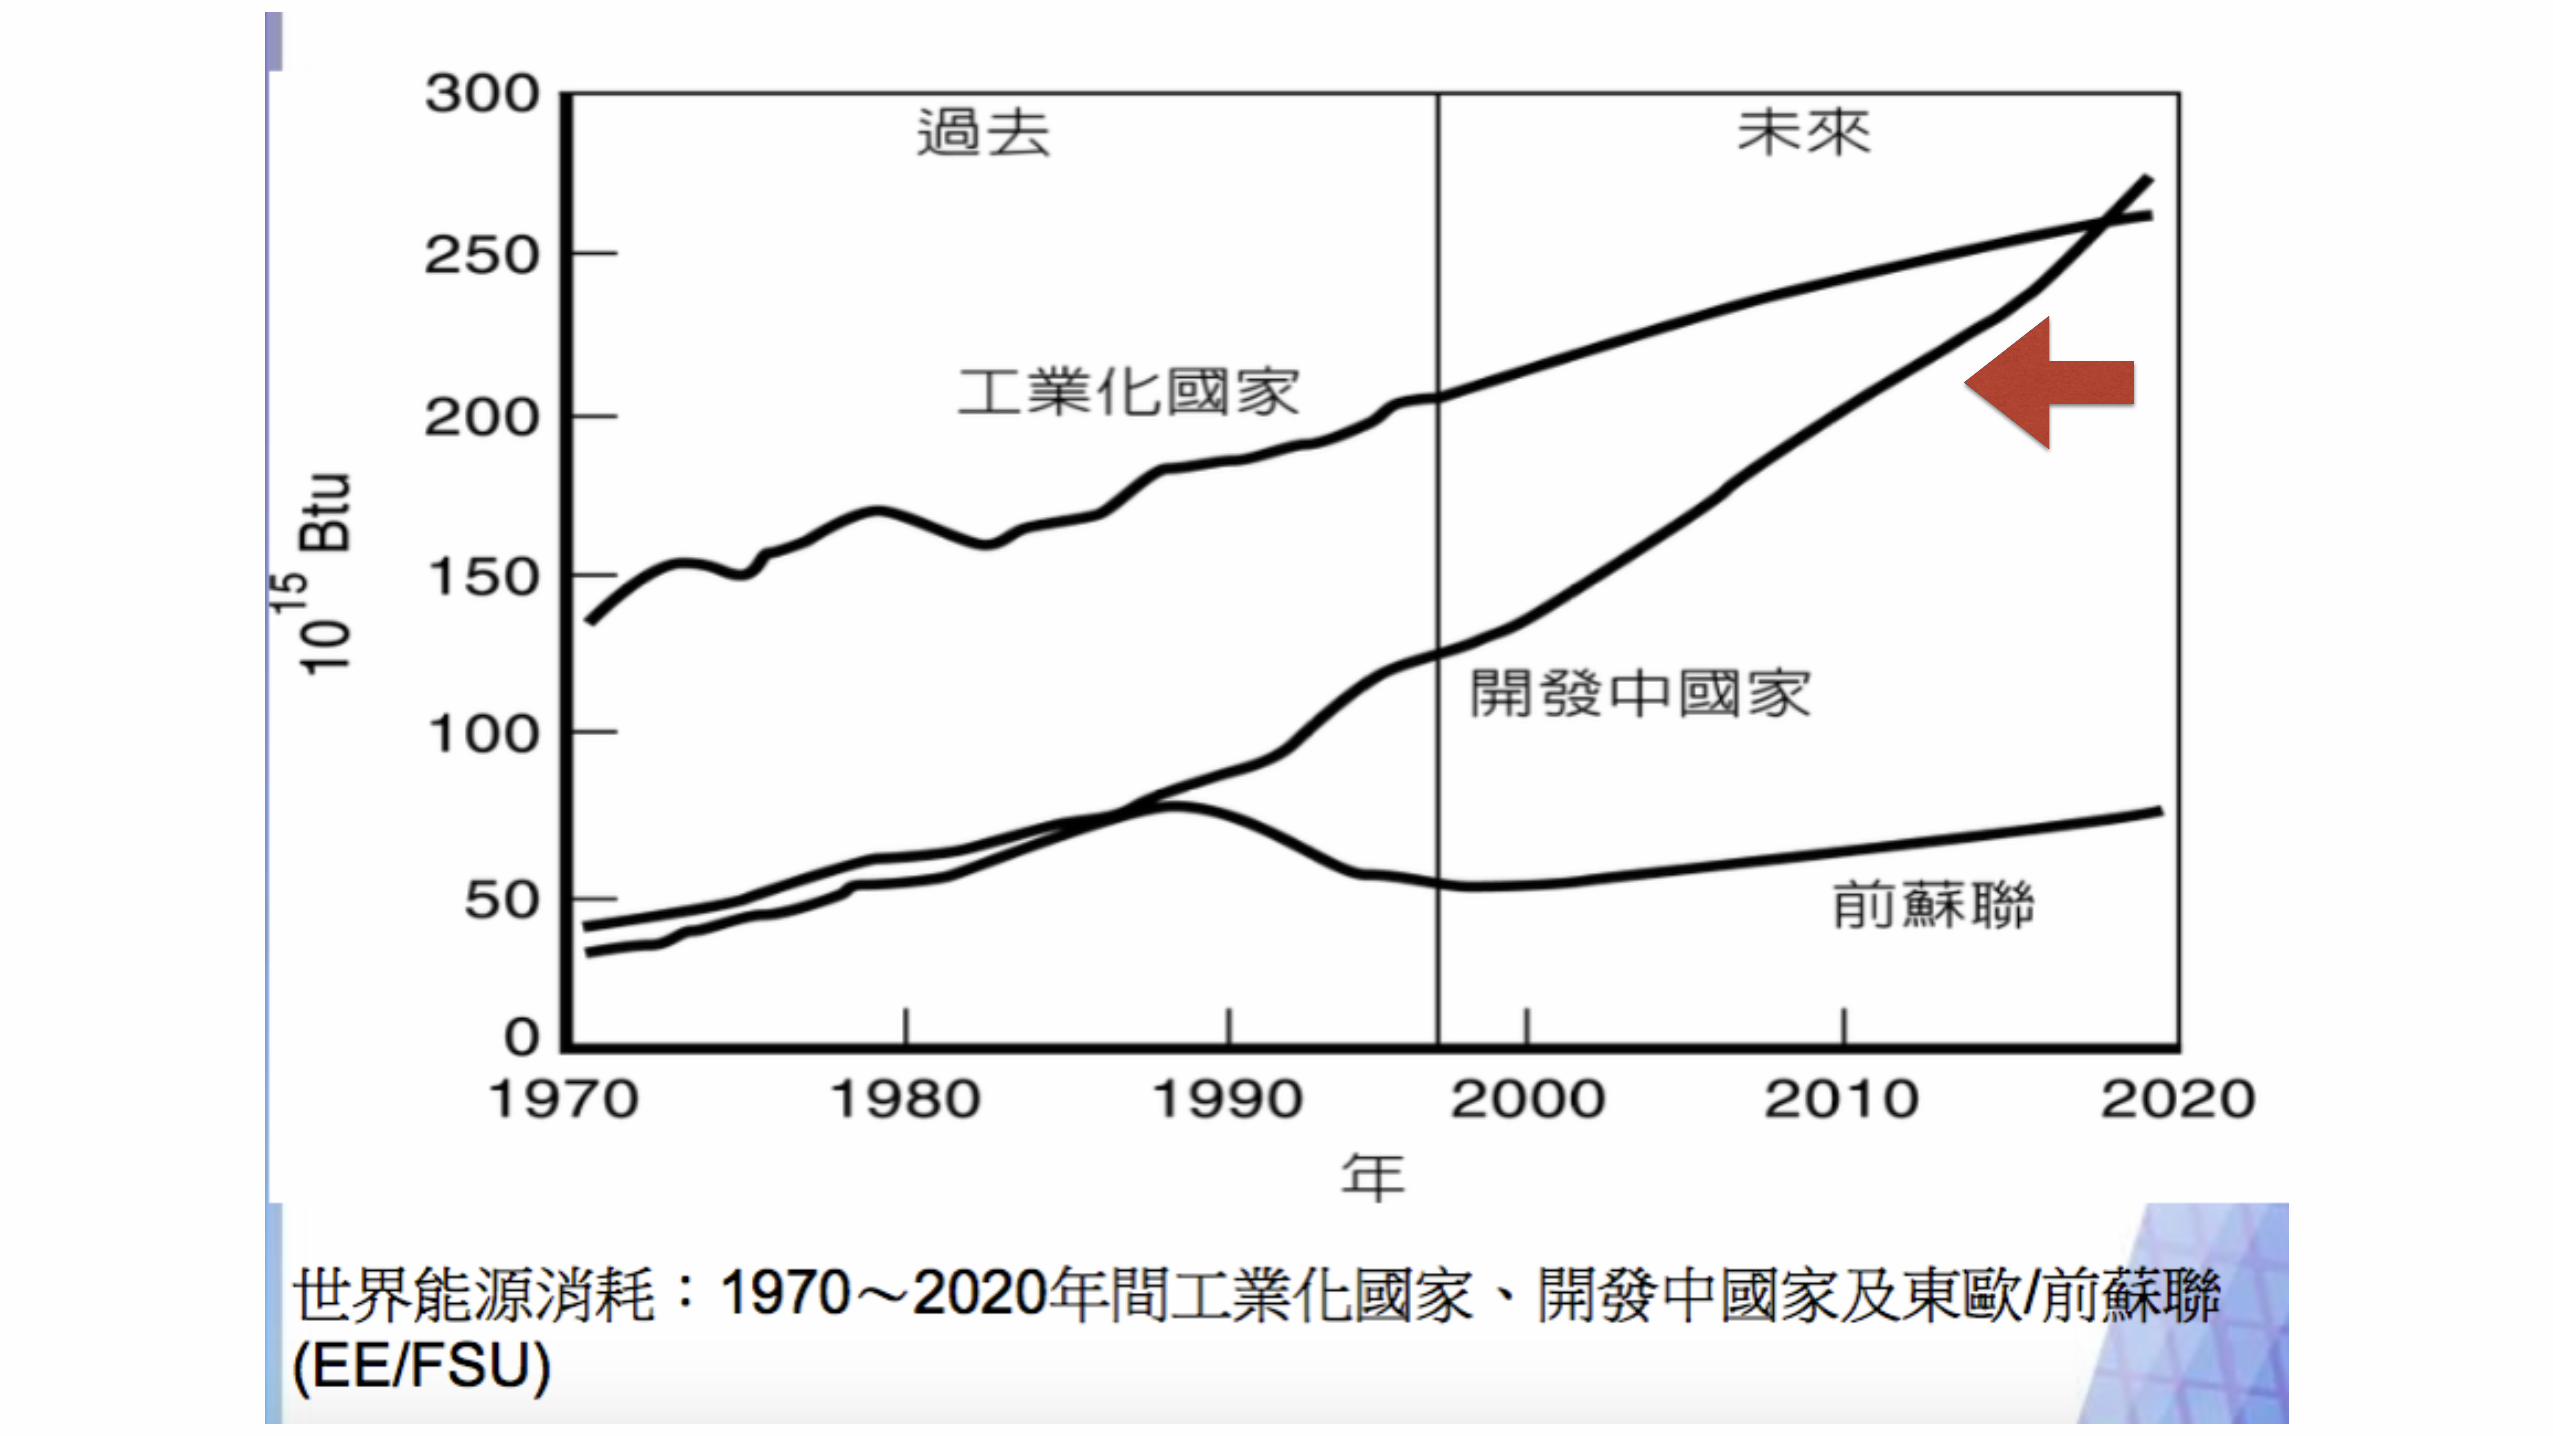
Energy Social Dimension
@FutureLab

10065

1.
2.


•
• 40%
2/3 1/51/3

•
•
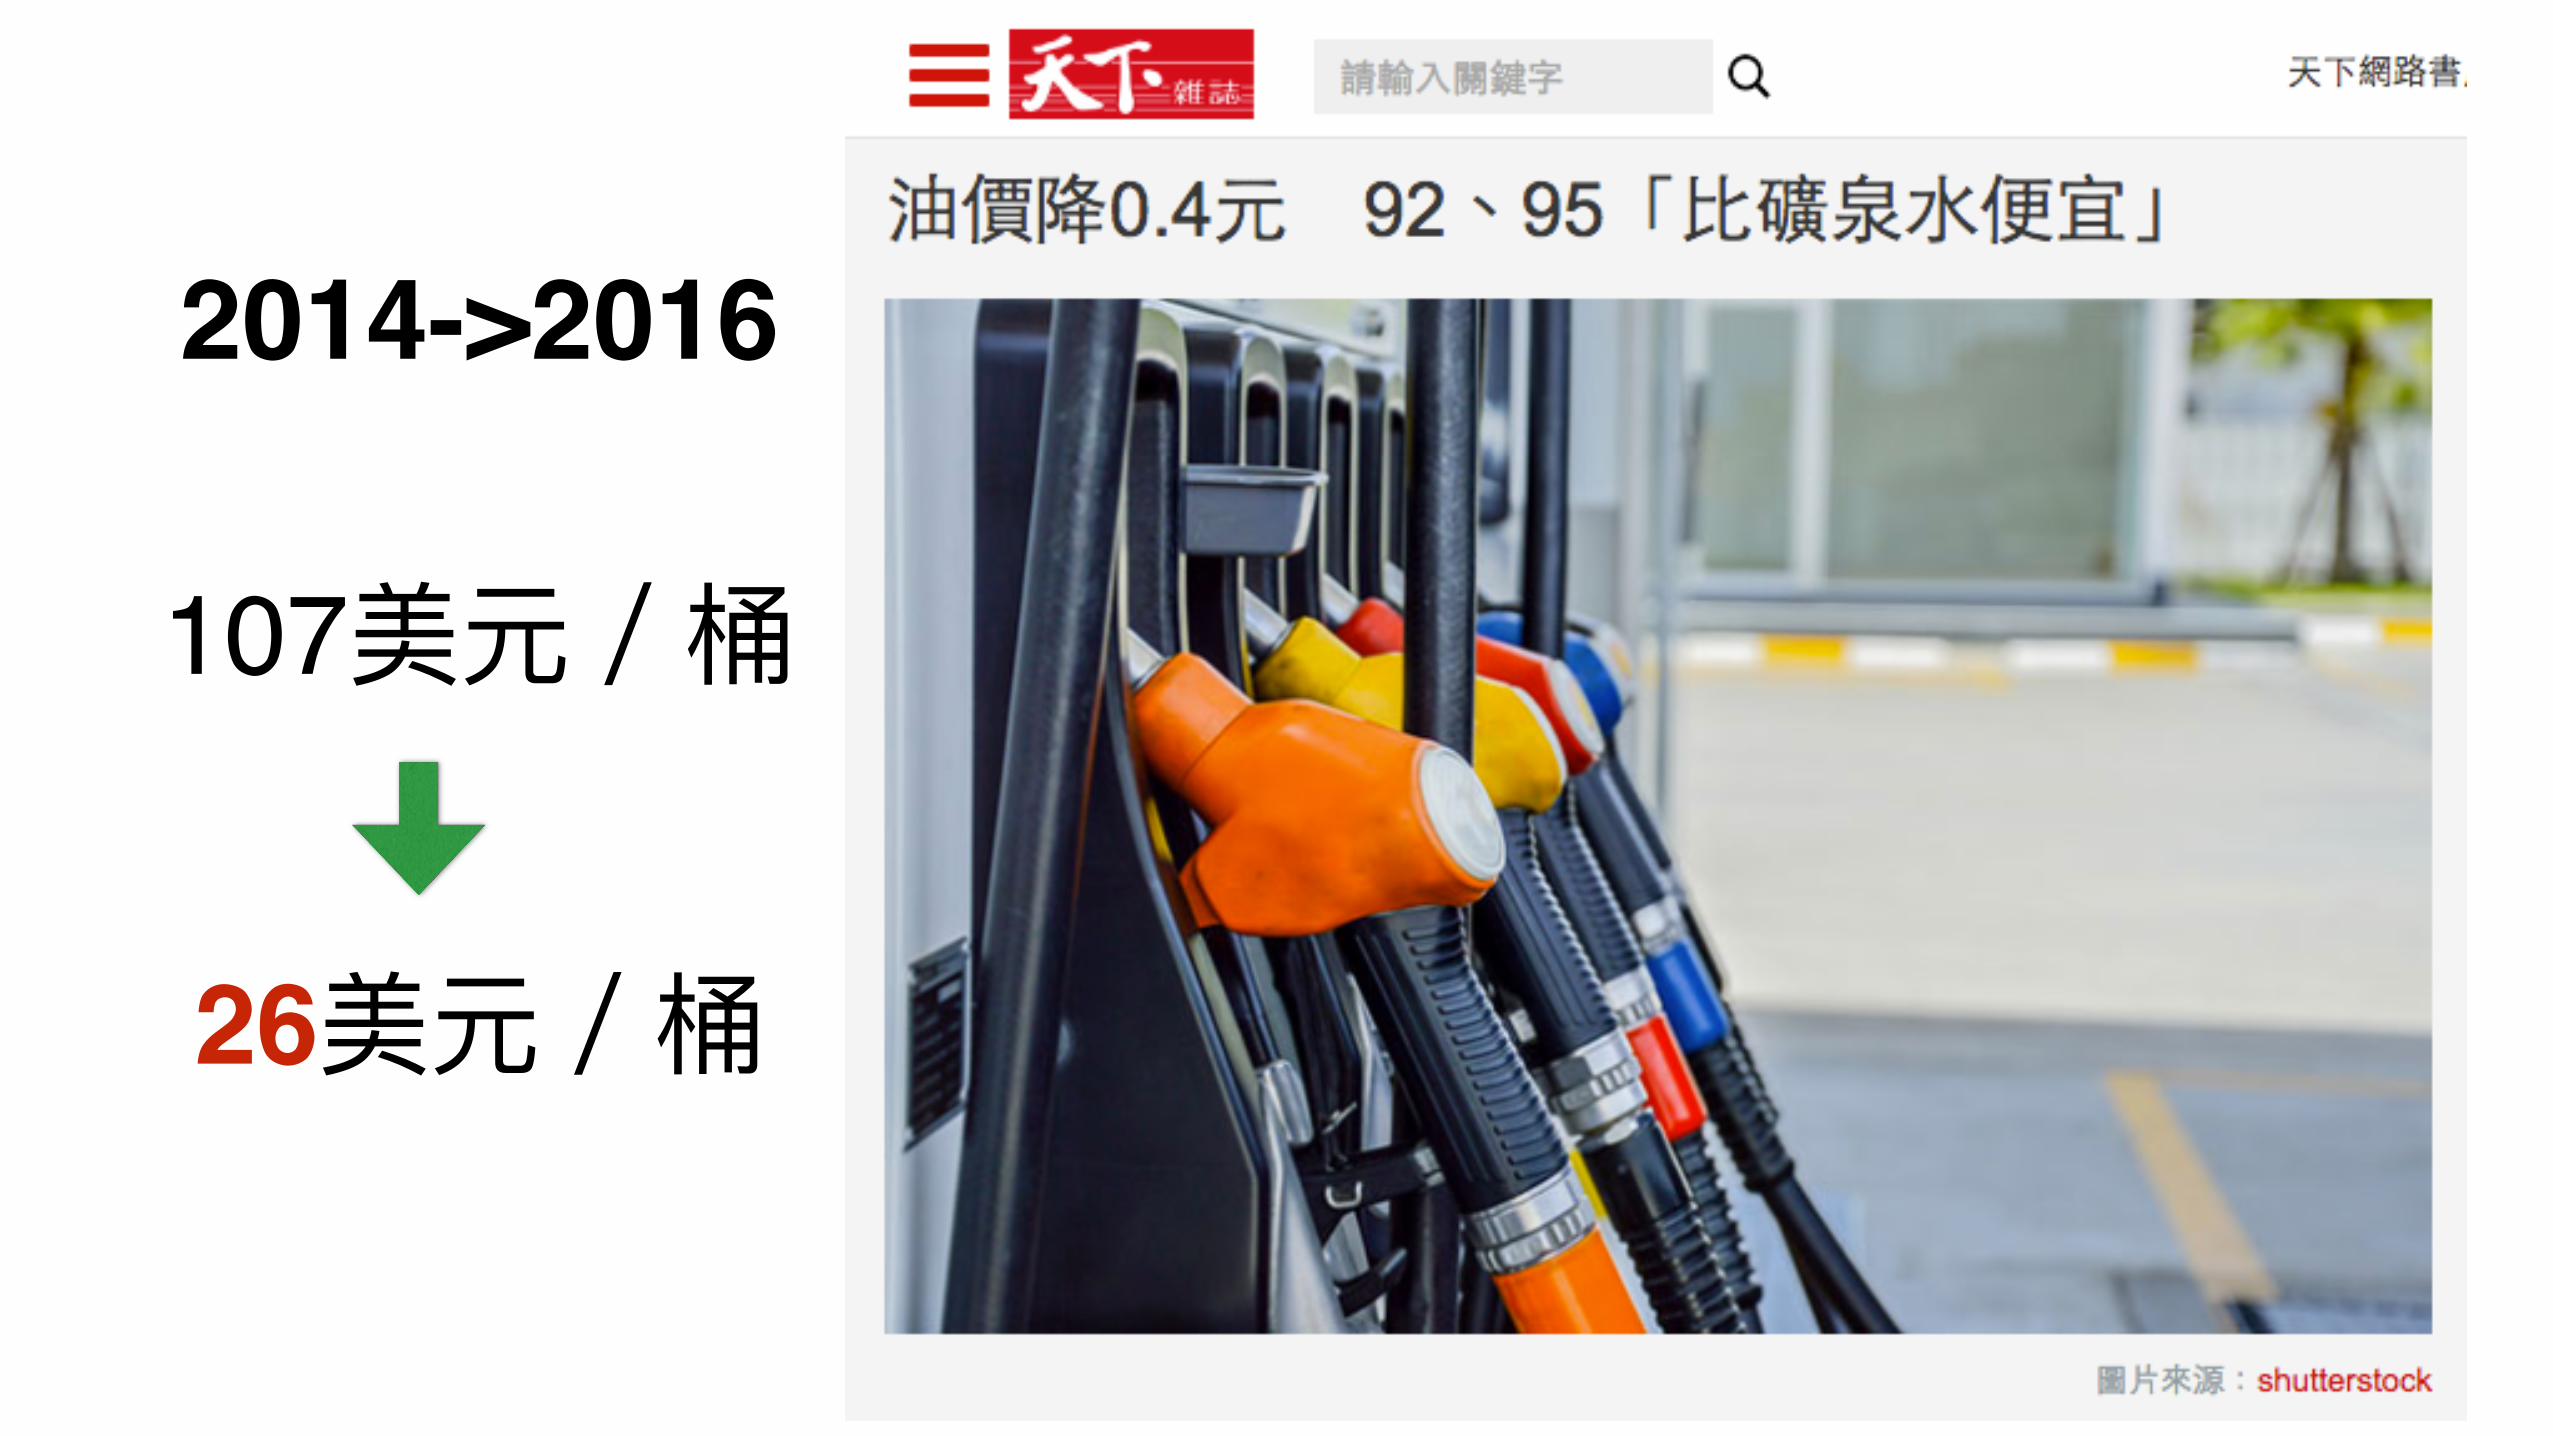
2014->2016
107
26
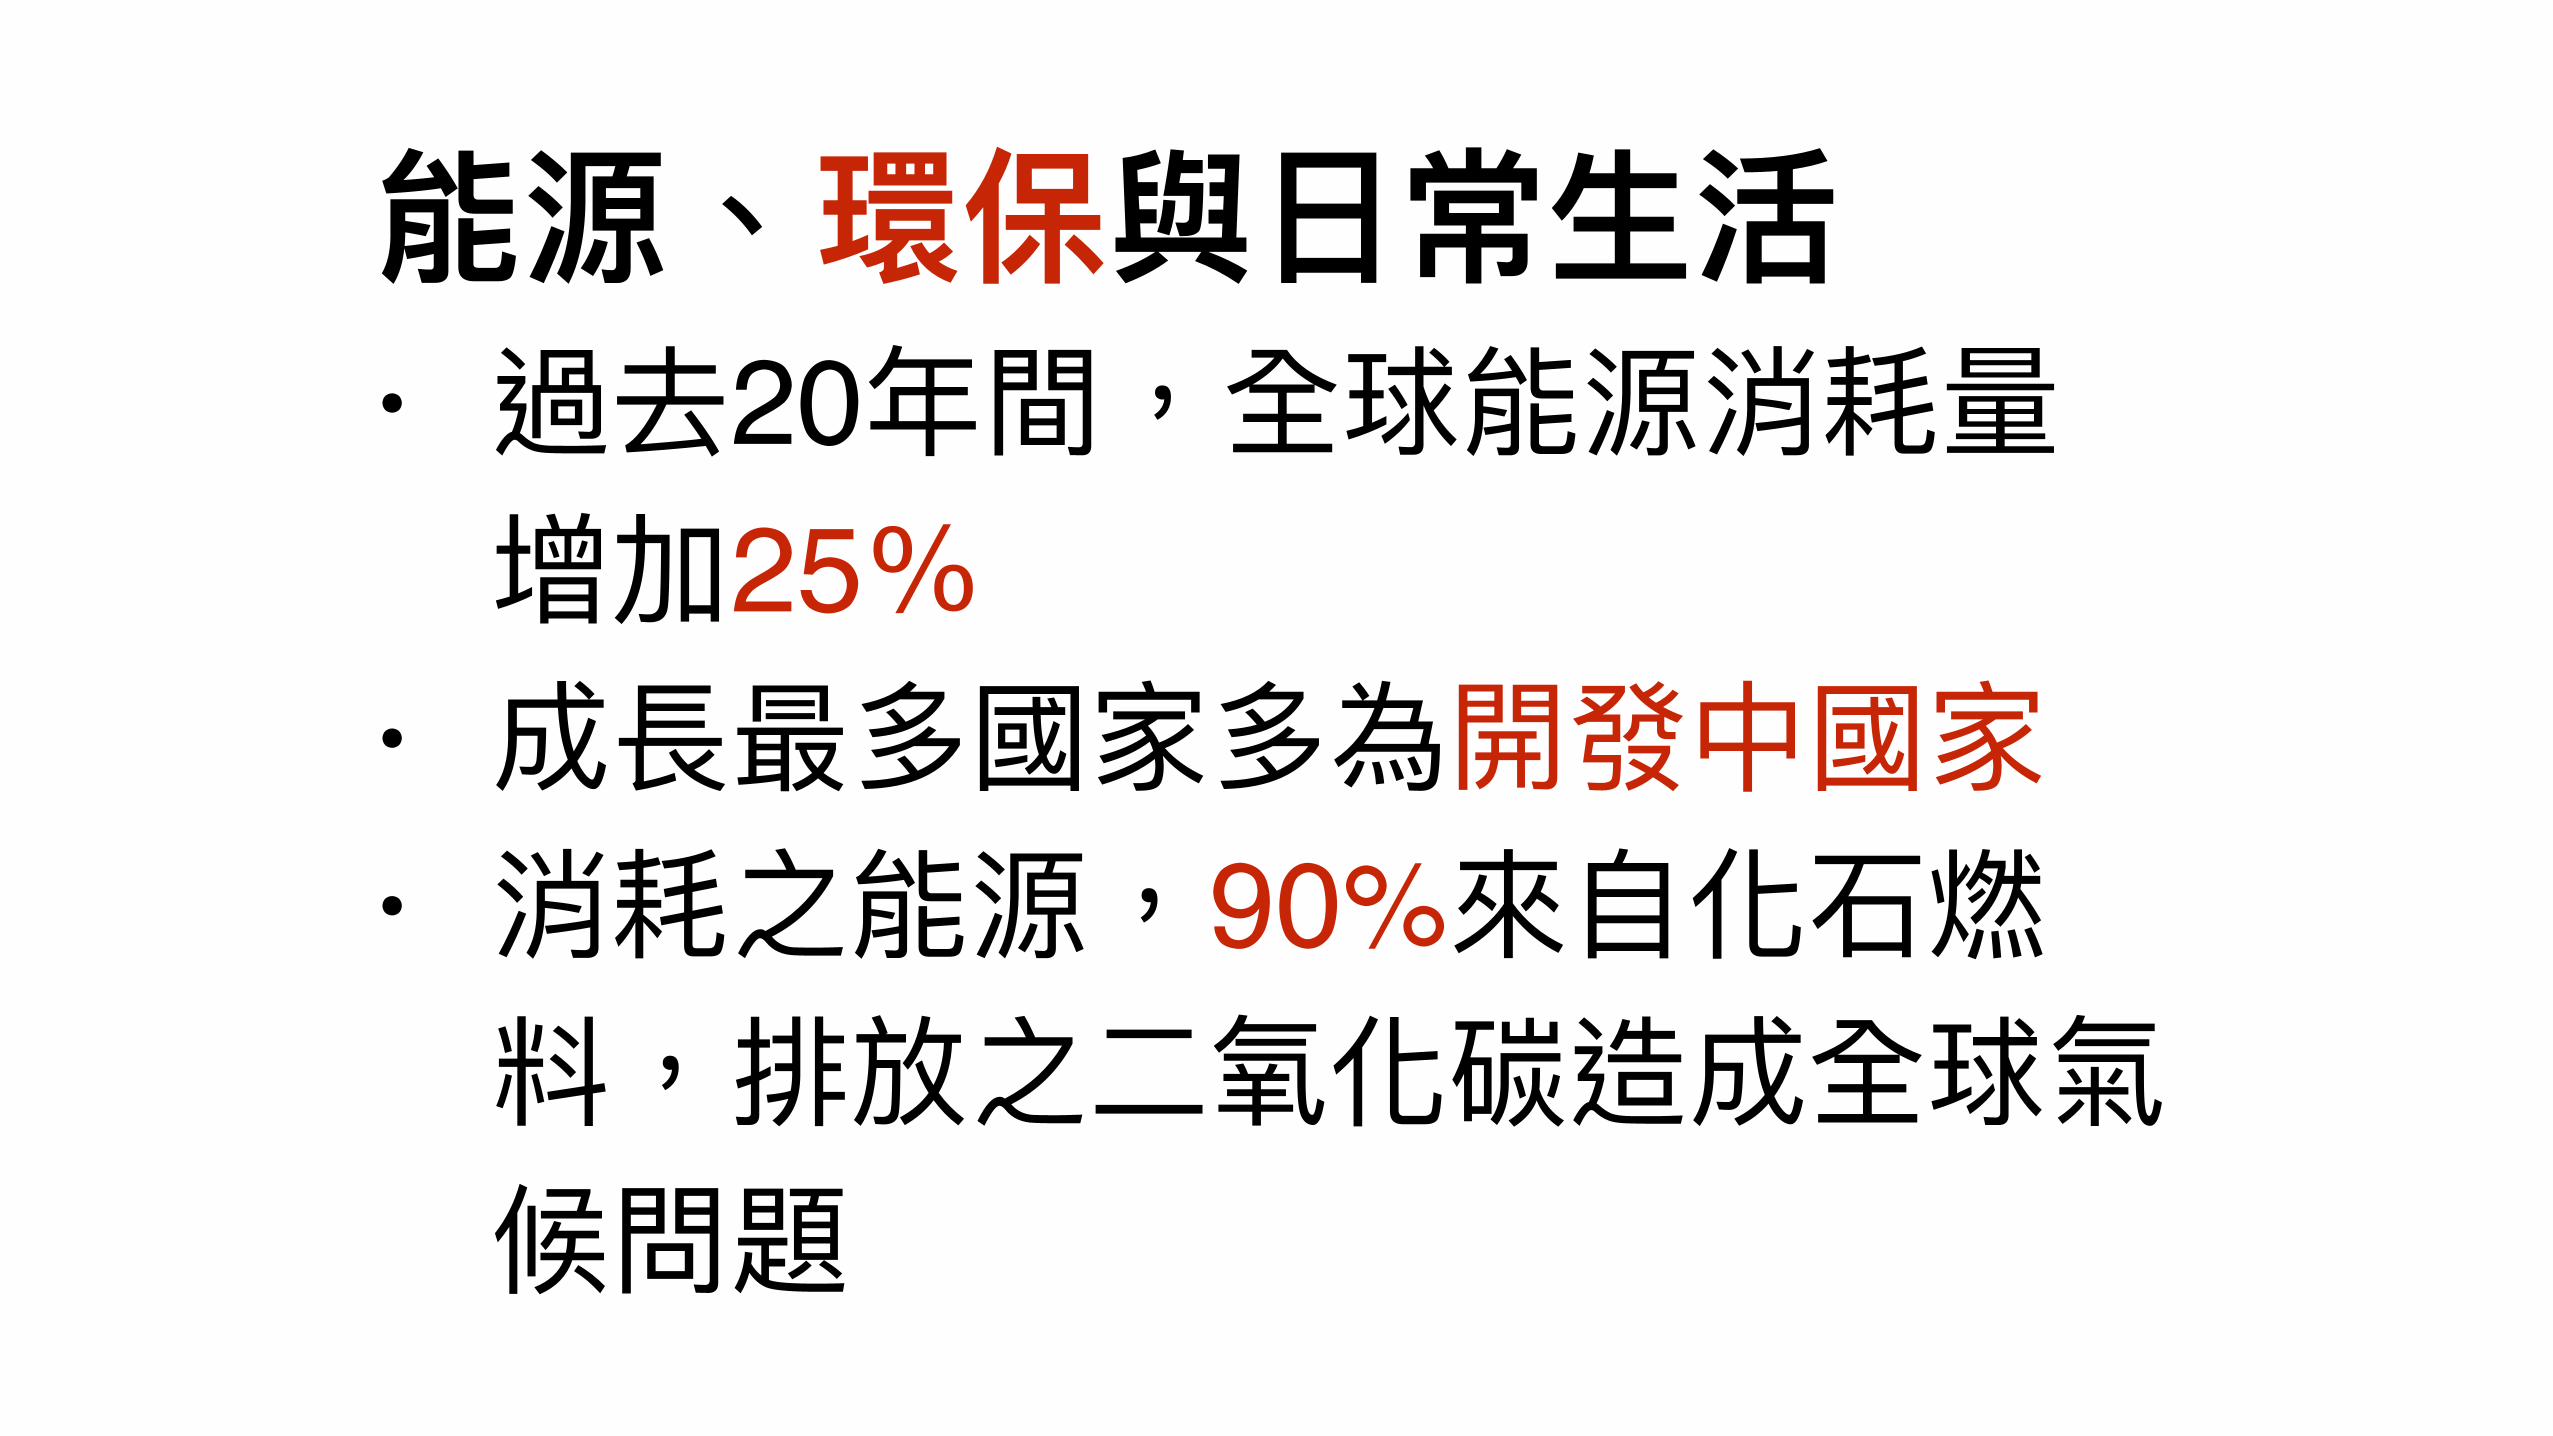
• 2025
•
• 90%
28
CONSUMPTION
28
CONSUMPTION
T O T A L F I N A L C O N S U M P T I O NWorld
Other4
Natural gasBiofuels and waste3Coal2
ElectricityOil
0
2 000
4 000
6 000
8 000
10 000
1971 1975 1980 1985 1990 1995 2000 2005 2010 2013
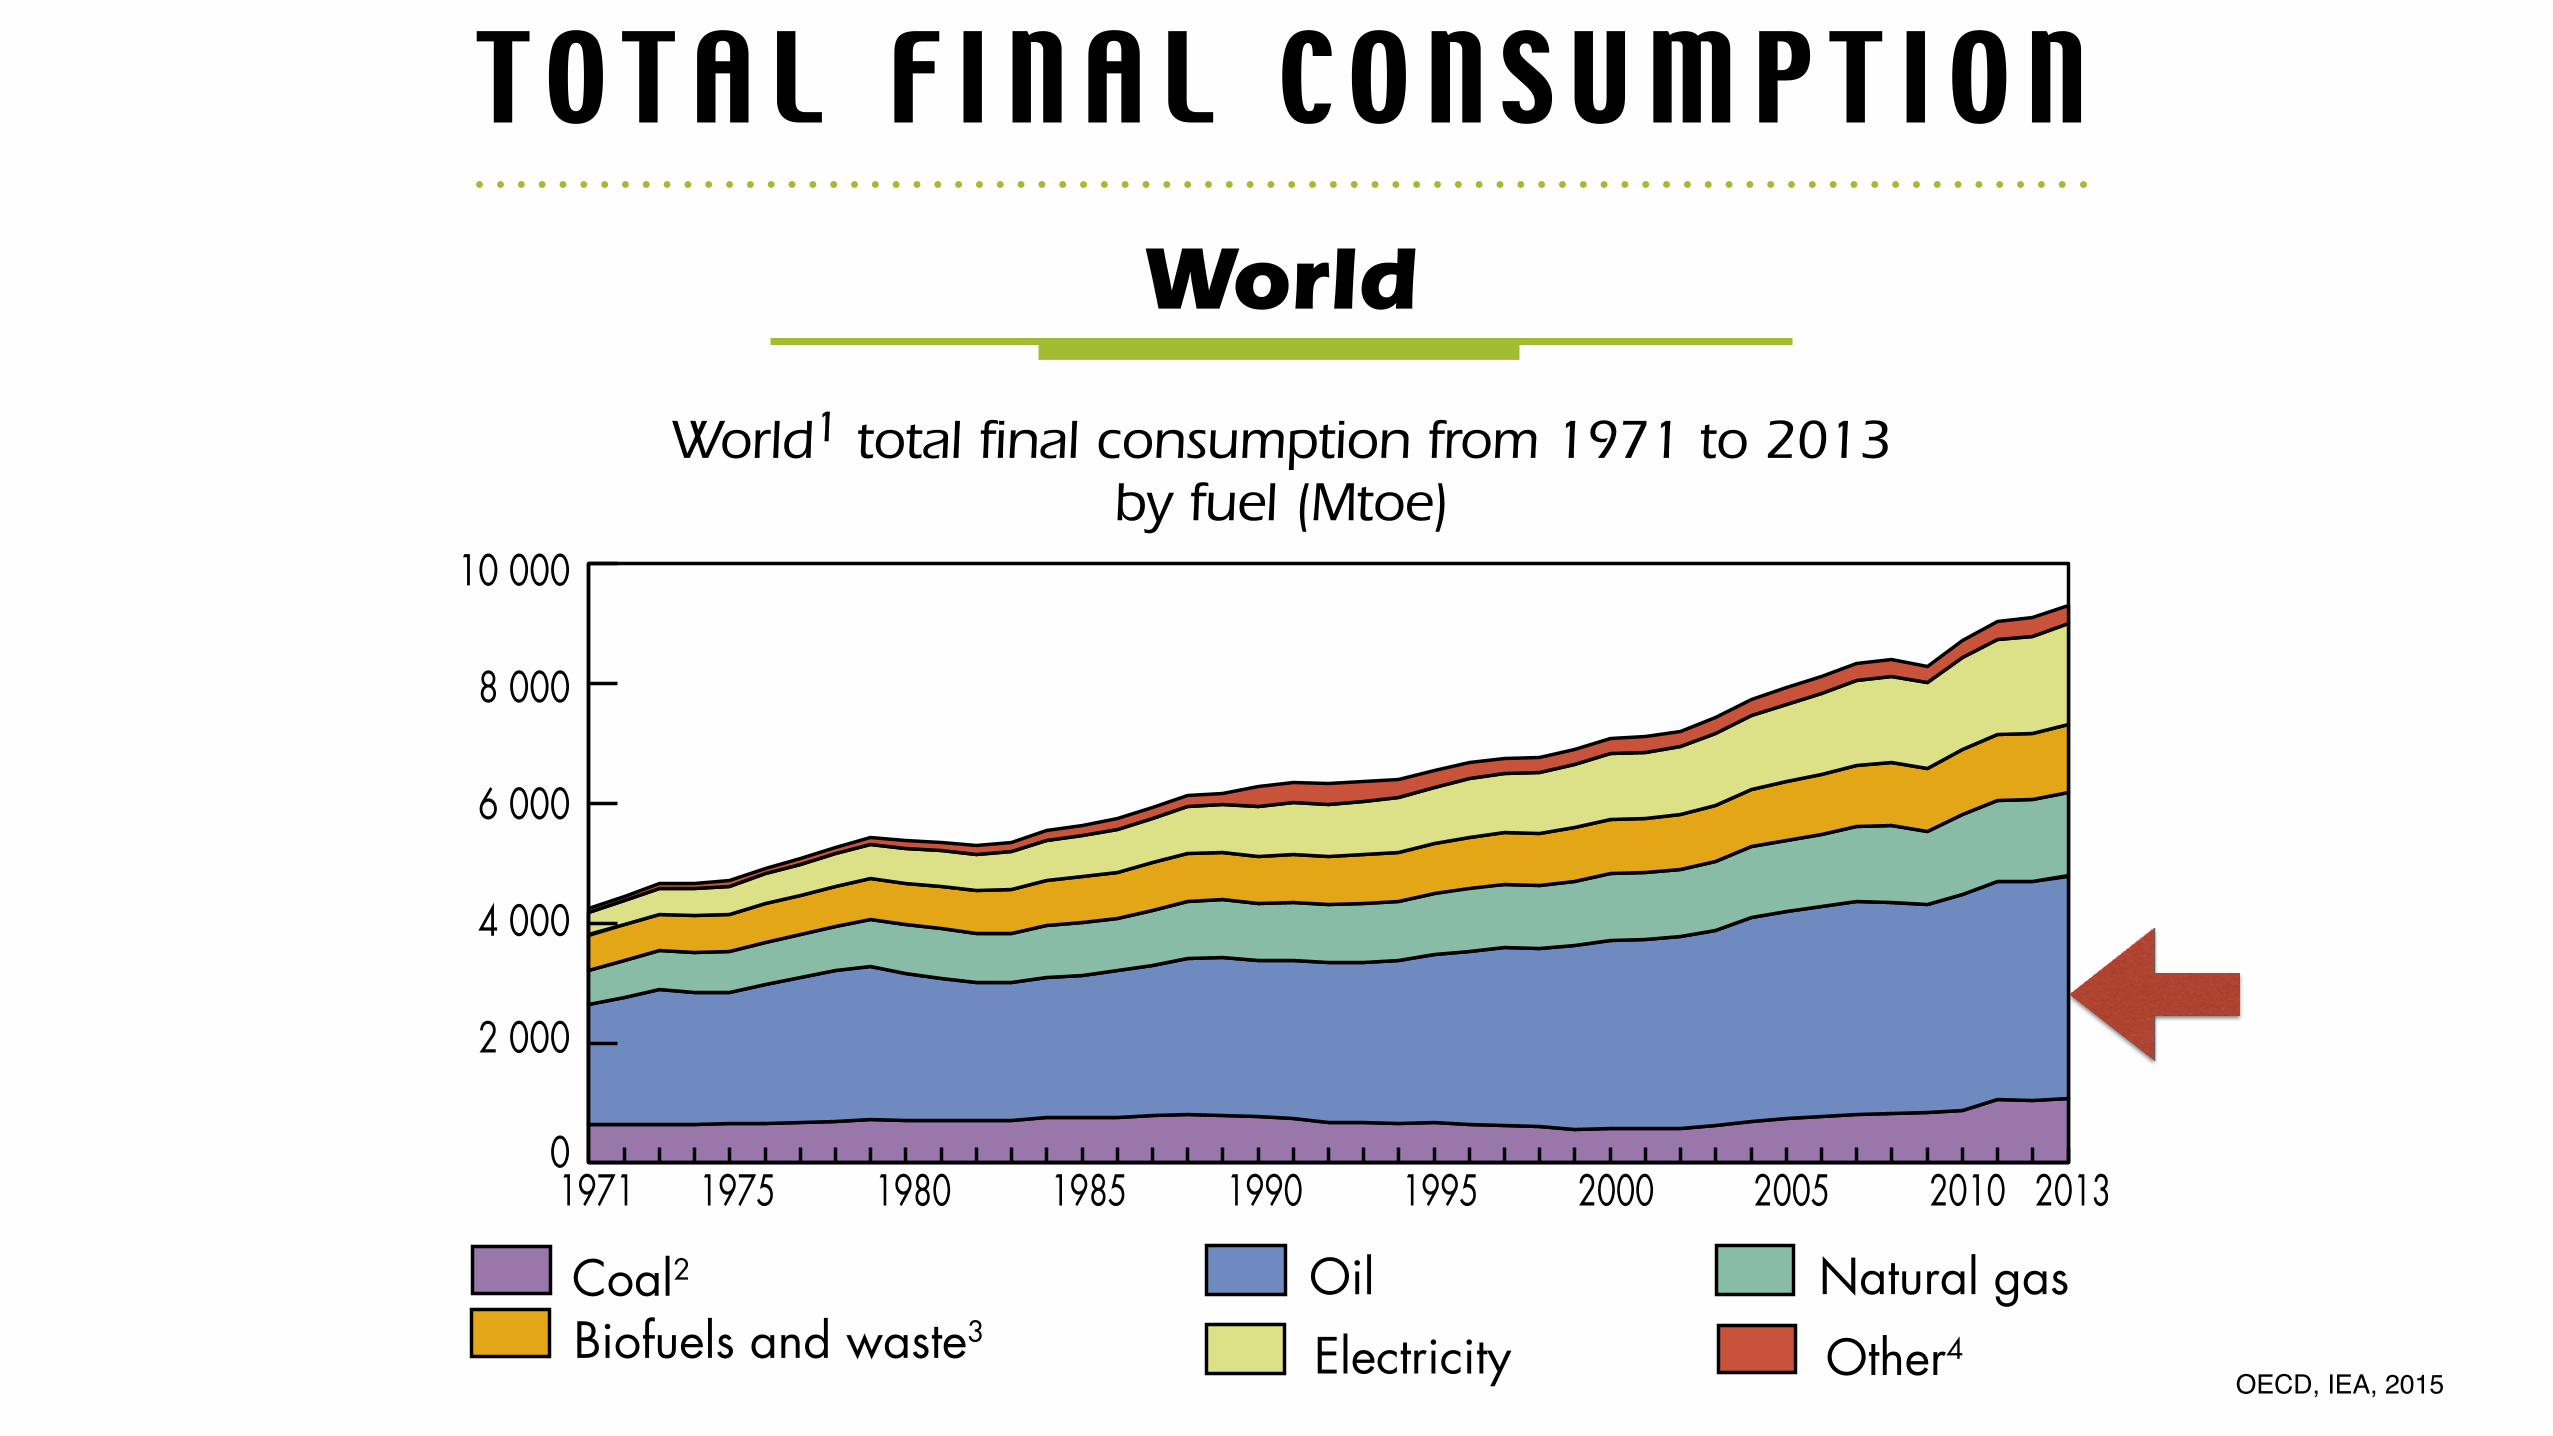
World1 total final consumption from 1971 to 2013 by fuel (Mtoe)
1973 and 2013 fuel shares of total final consumption
1. World includes international aviation and international marine bunkers.2. In these graphs, peat and oil shale are aggregated with coal.
3. Data for biofuels and waste final consumption have been estimated for a number of countries.4. Includes geothermal, solar, wind, heat, etc.
1973 2013
Coal²13.6%
Oil48.3%Natural gas
14.0%
Biofuels andwaste³
13.1%
Electricity9.4%
Other4
1.6%
Biofuels andwaste³
12.2%
Electricity18.0%
Other4
3.3%Coal²11.5%
Oil39.9%
Natural gas15.1%
4 667 Mtoe 9 301 Mtoe
© O
ECD
/IEA
, 201
5
OECD, IEA, 2015
OECD60.3%
Middle East 0.7%
Non-OECD Europe and Eurasia13.6%
China 7.9%
Asia² 6.3%
Non-OECDAmericas 3.6%
Africa 3.7% Bunkers³ 3.9%
Bunkers³ 3.8% Africa 6.0%
Non-OECDAmericas 5.0%
Non-OECD Europe and Eurasia 7.6%
Asia² 12.6%
China21.0%
Middle East4.9%
OECD39.1%
30
CONSUMPTION
World
4 667 Mtoe 9 301 Mtoe
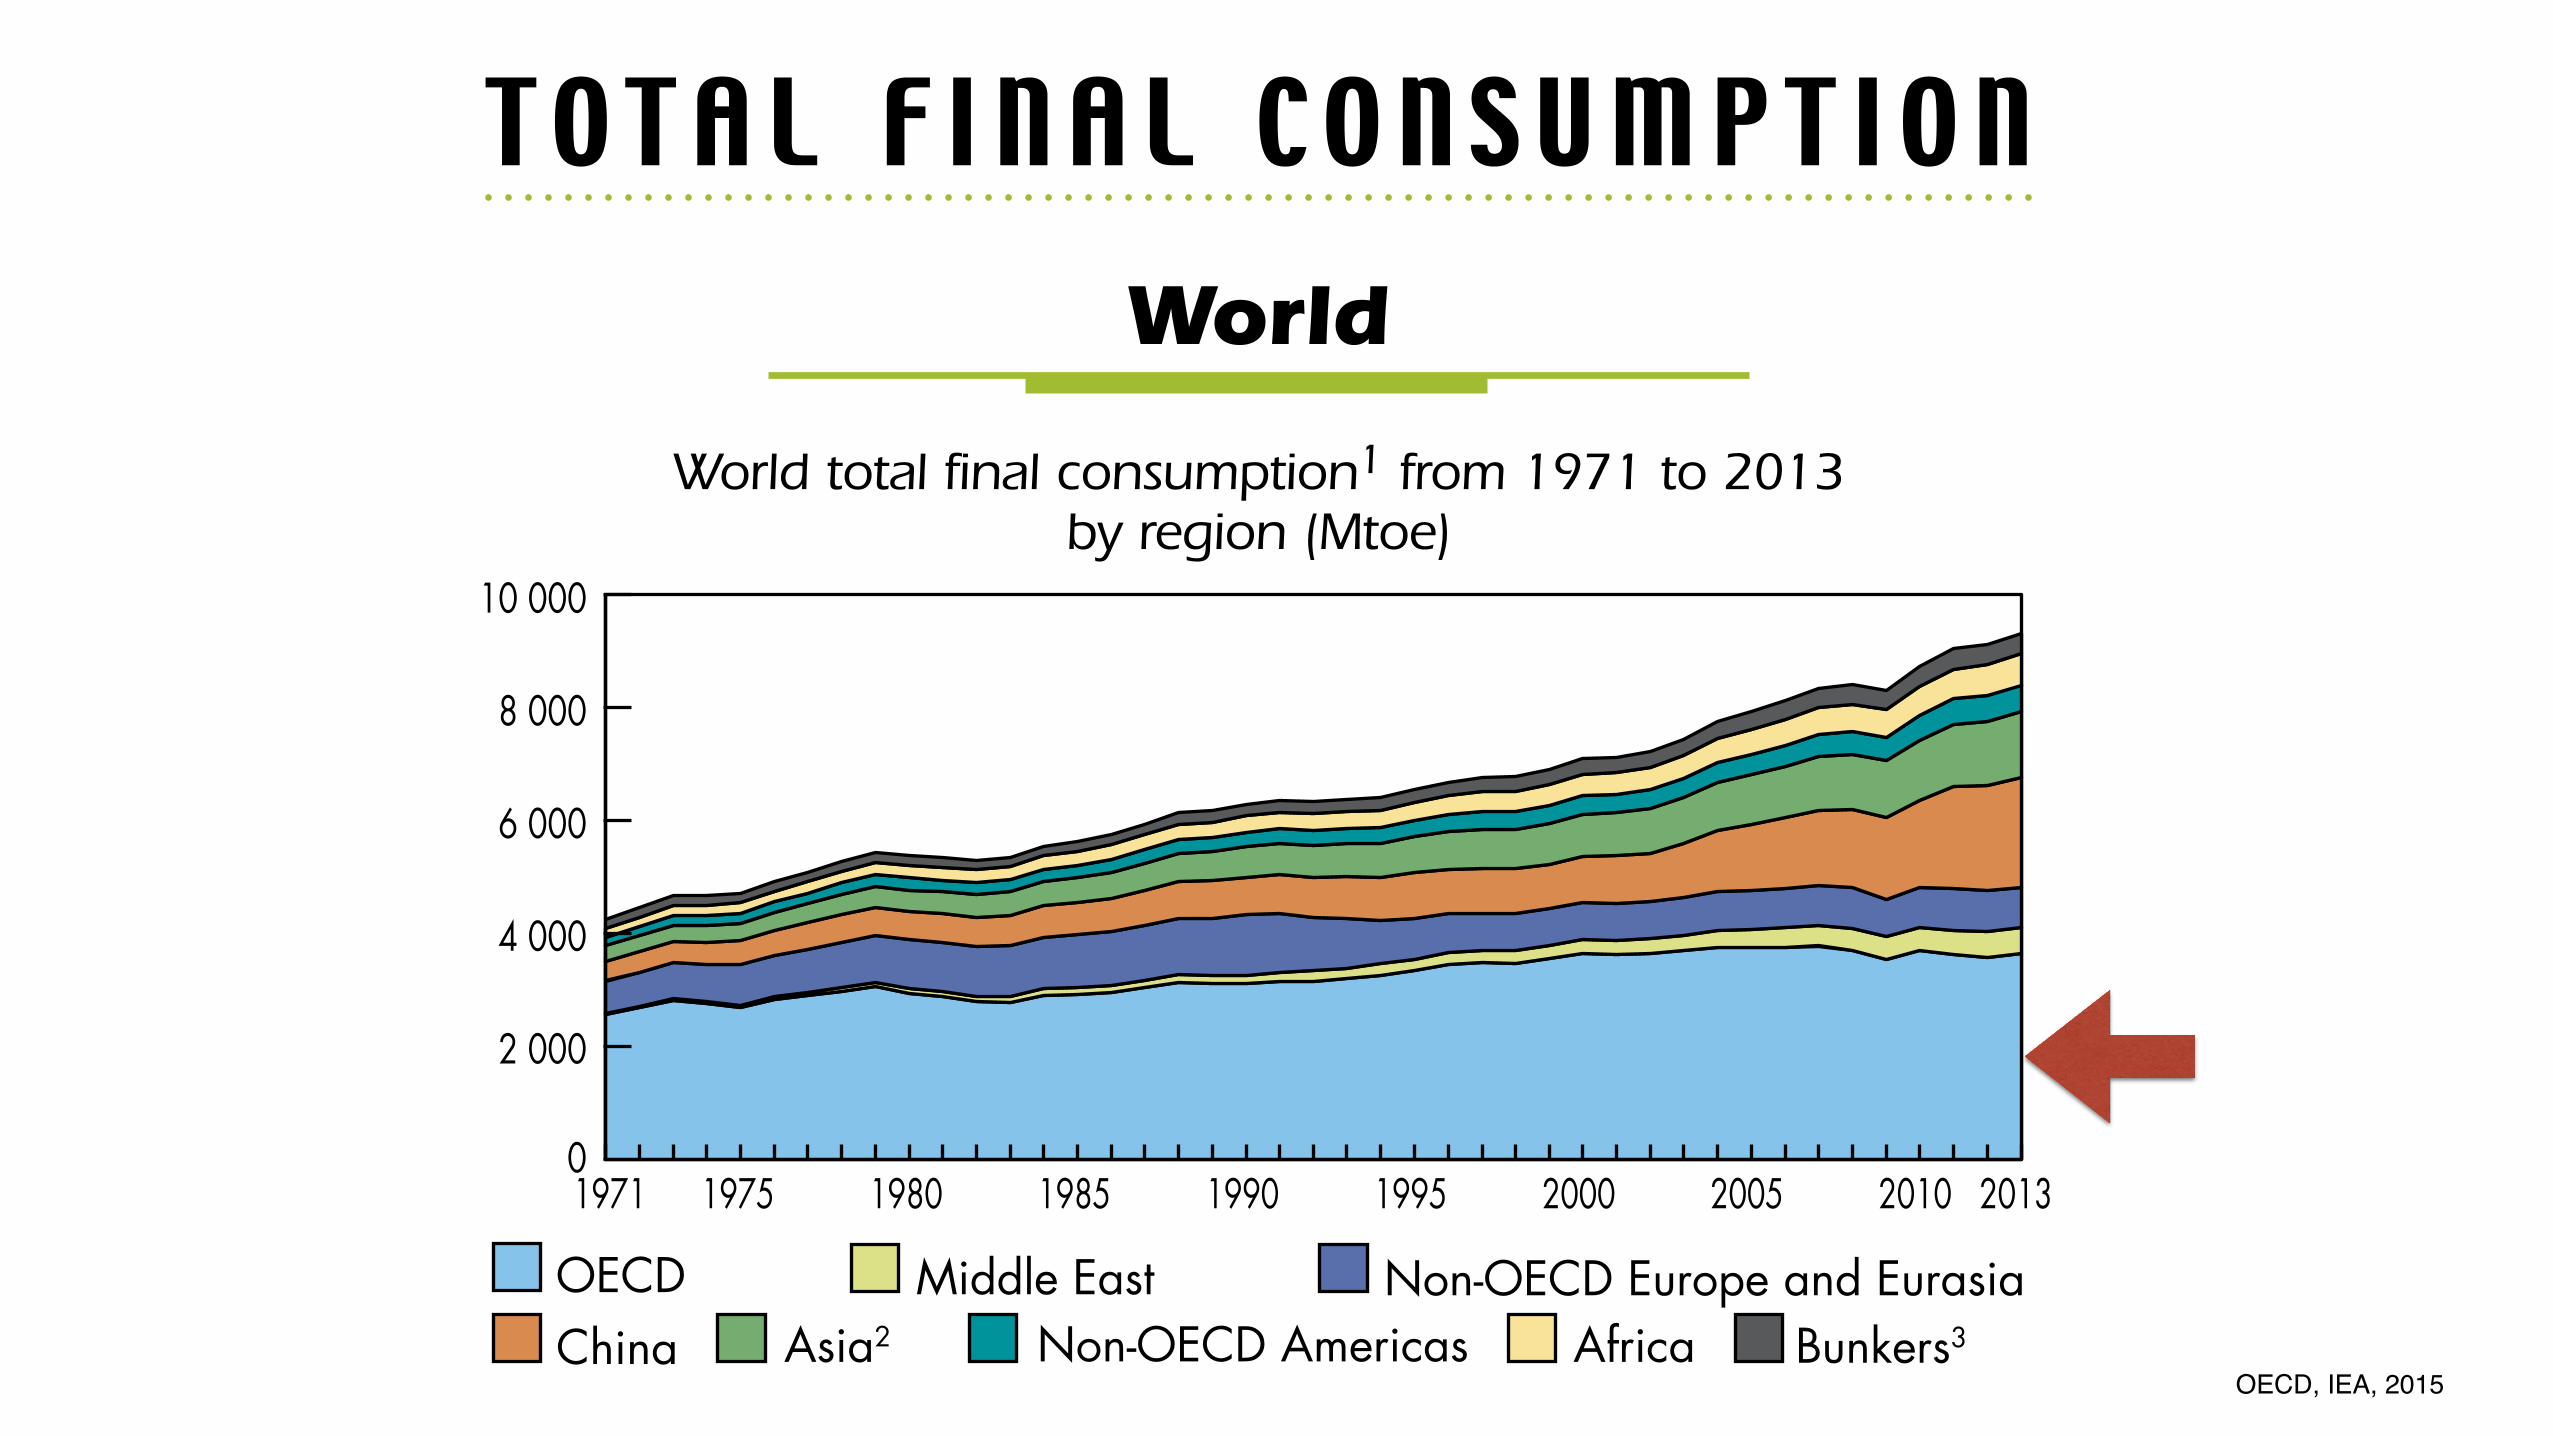
1. Data for biofuels and waste final consumption have been estimated for a number of countries. 2. Asia excludes China.
3. Includes international aviation and international marine bunkers.
1973 2013
T O T A L F I N A L C O N S U M P T I O N
Non-OECD Europe and EurasiaAsia2
Middle EastChinaOECD
Bunkers3AfricaNon-OECD Americas
0
2 000
4 000
6 000
8 000
10 000
1971 1975 1980 1985 1990 1995 2000 2005 2010 2013
1973 and 2013 regional shares of total final consumption1
World total final consumption1 from 1971 to 2013 by region (Mtoe)
© O
ECD
/IEA
, 201
5
OECD, IEA, 2015
3
33
Oil
0 500
1 000
1 500
2 000
2 500
3 000
3 500
4 000
Other1 TransportIndustry Non-energy use1971 1975 1980 1985 1990 1995 2000 2005 2010 2013
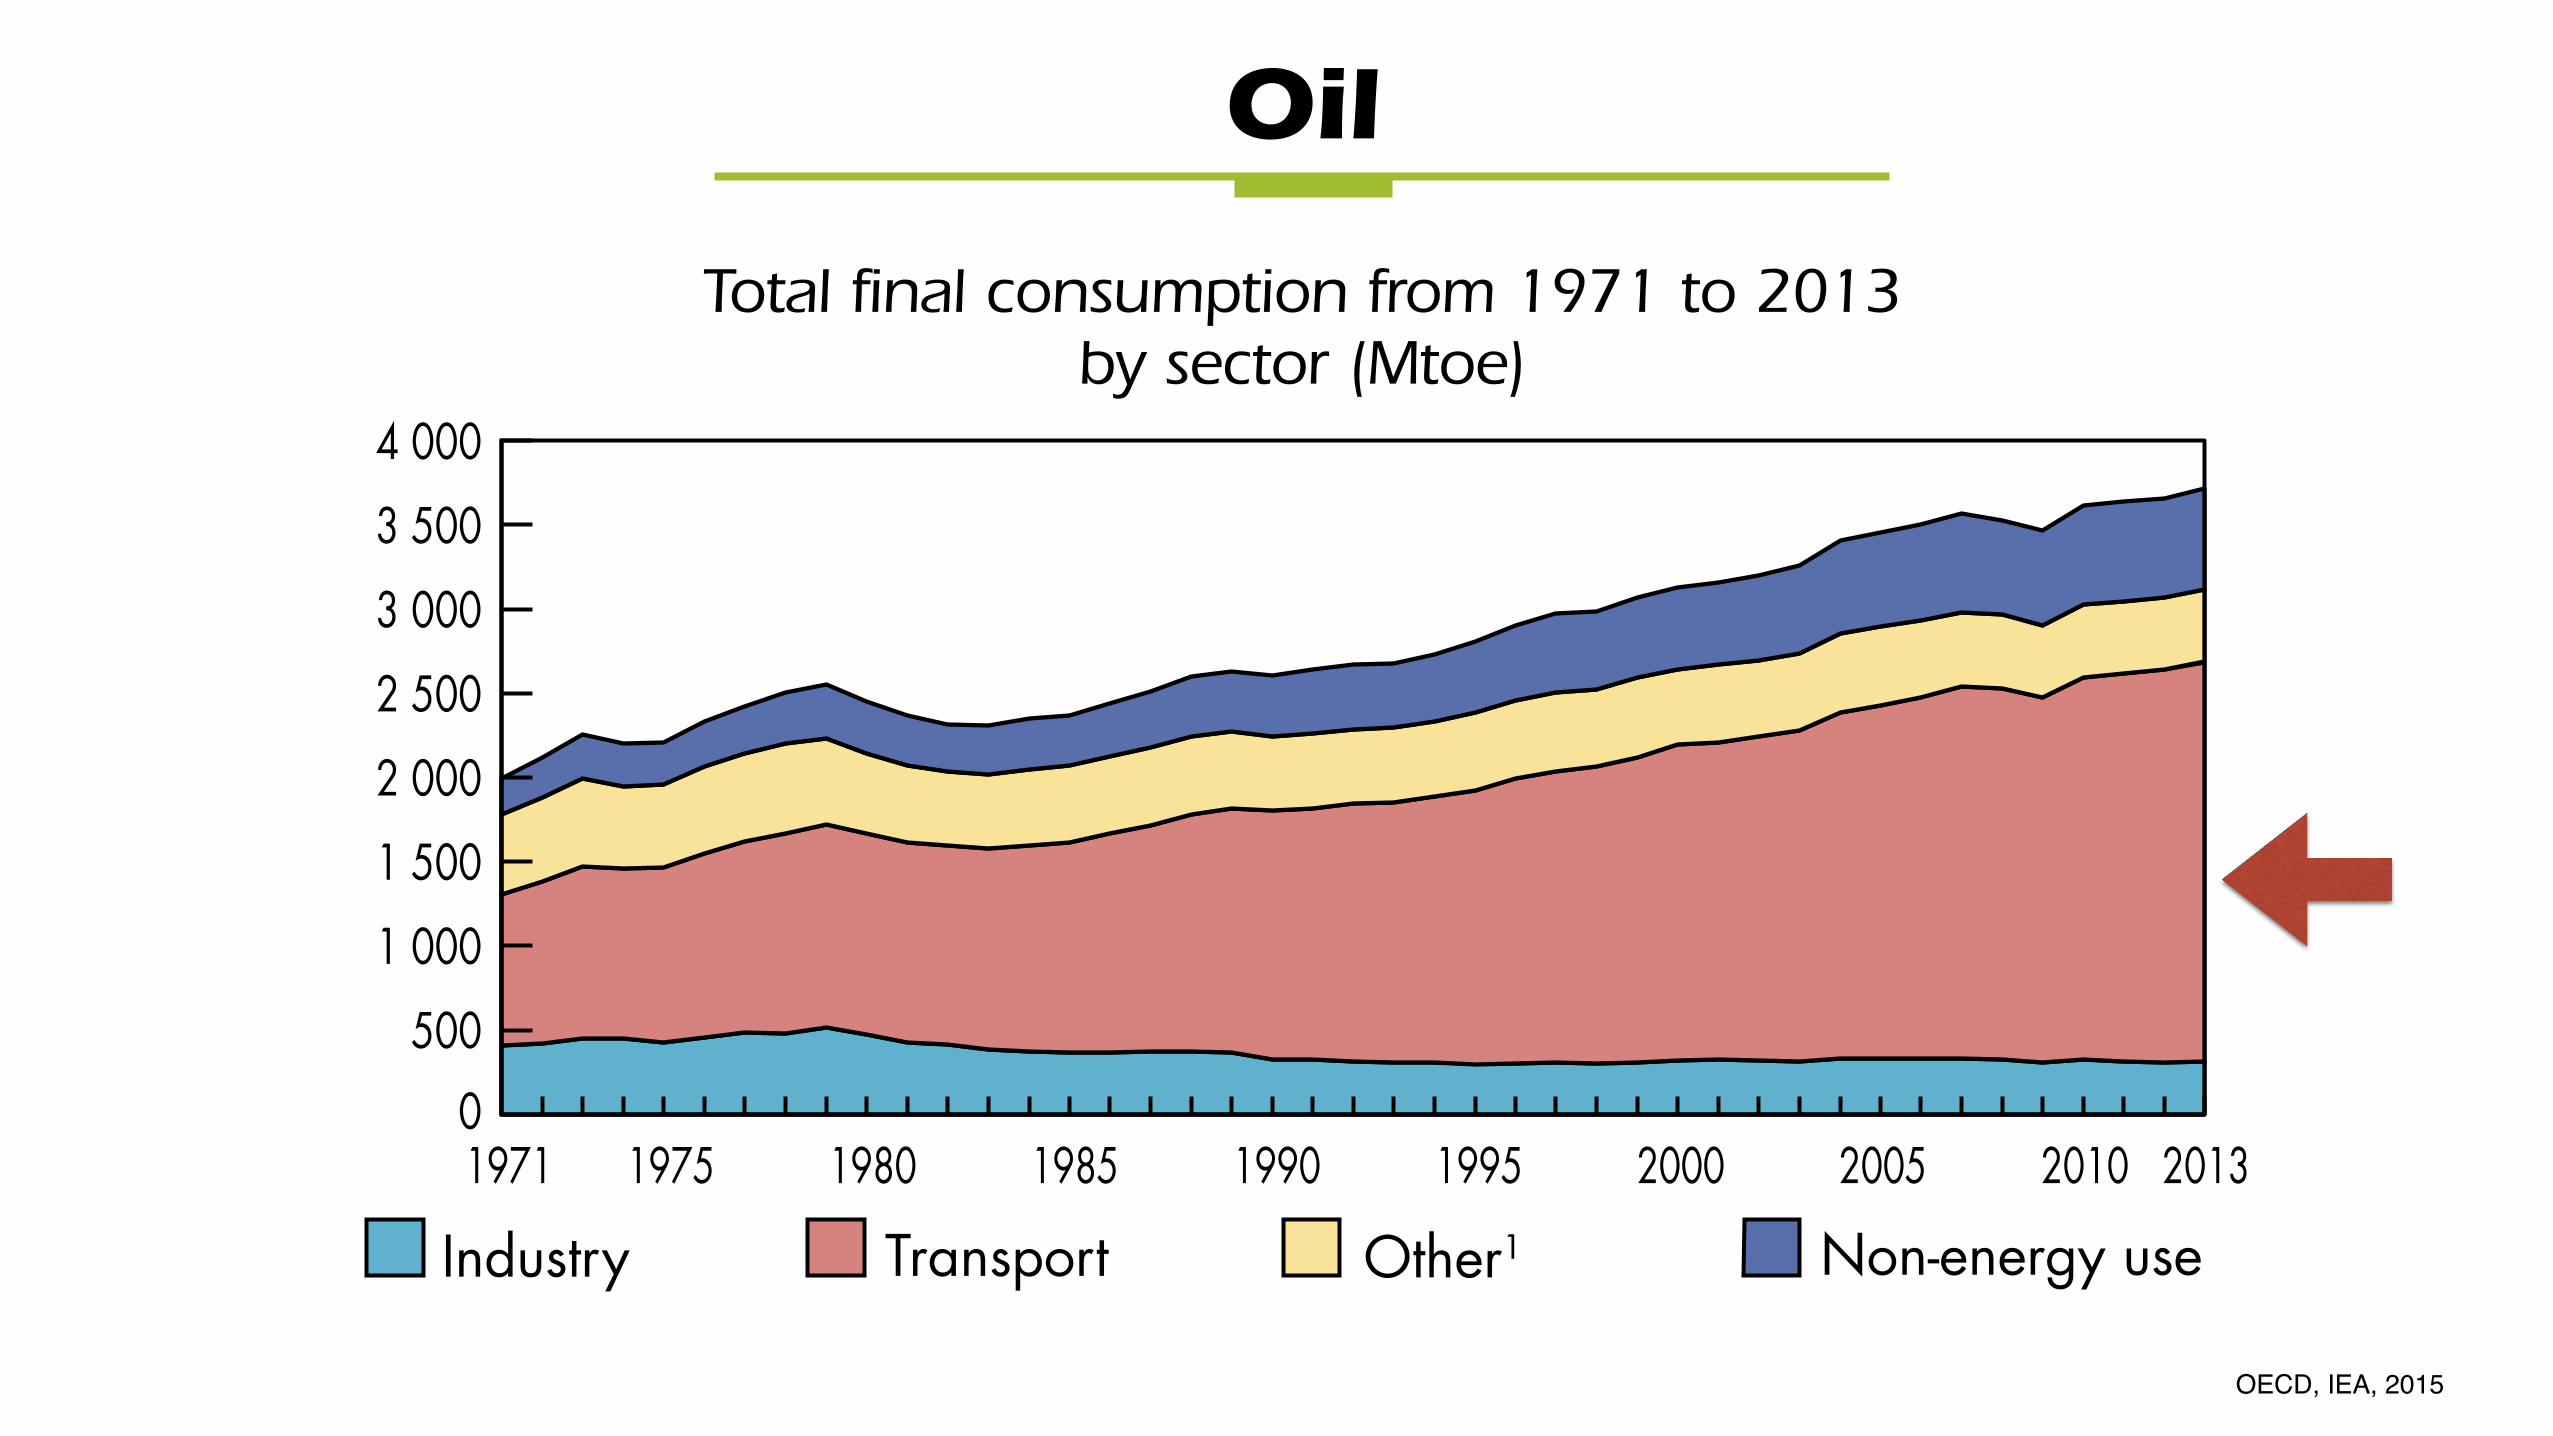
Total final consumption from 1971 to 2013 by sector (Mtoe)
1973 and 2013 shares of world oil consumption
2 252 Mtoe 3 716 Mtoe
1. Includes agriculture, commercial and public services, residential, and non-specified other.
1973 2013
BY SECTOR
Industry19.9%
Transport45.4%
Other1
23.1%
Non-energy use11.6%
Non-energy use16.2% Industry
8.4%
Transport63.8%
Other1
11.6%
© O
ECD
/IEA
, 201
5
OECD, IEA, 2015
34
CONSUMPTION
Natural gas
0
300
600
900
1 200
1 500
Other1 TransportIndustry Non-energy use1971 1975 1980 1985 1990 1995 2000 2005 2010 2013
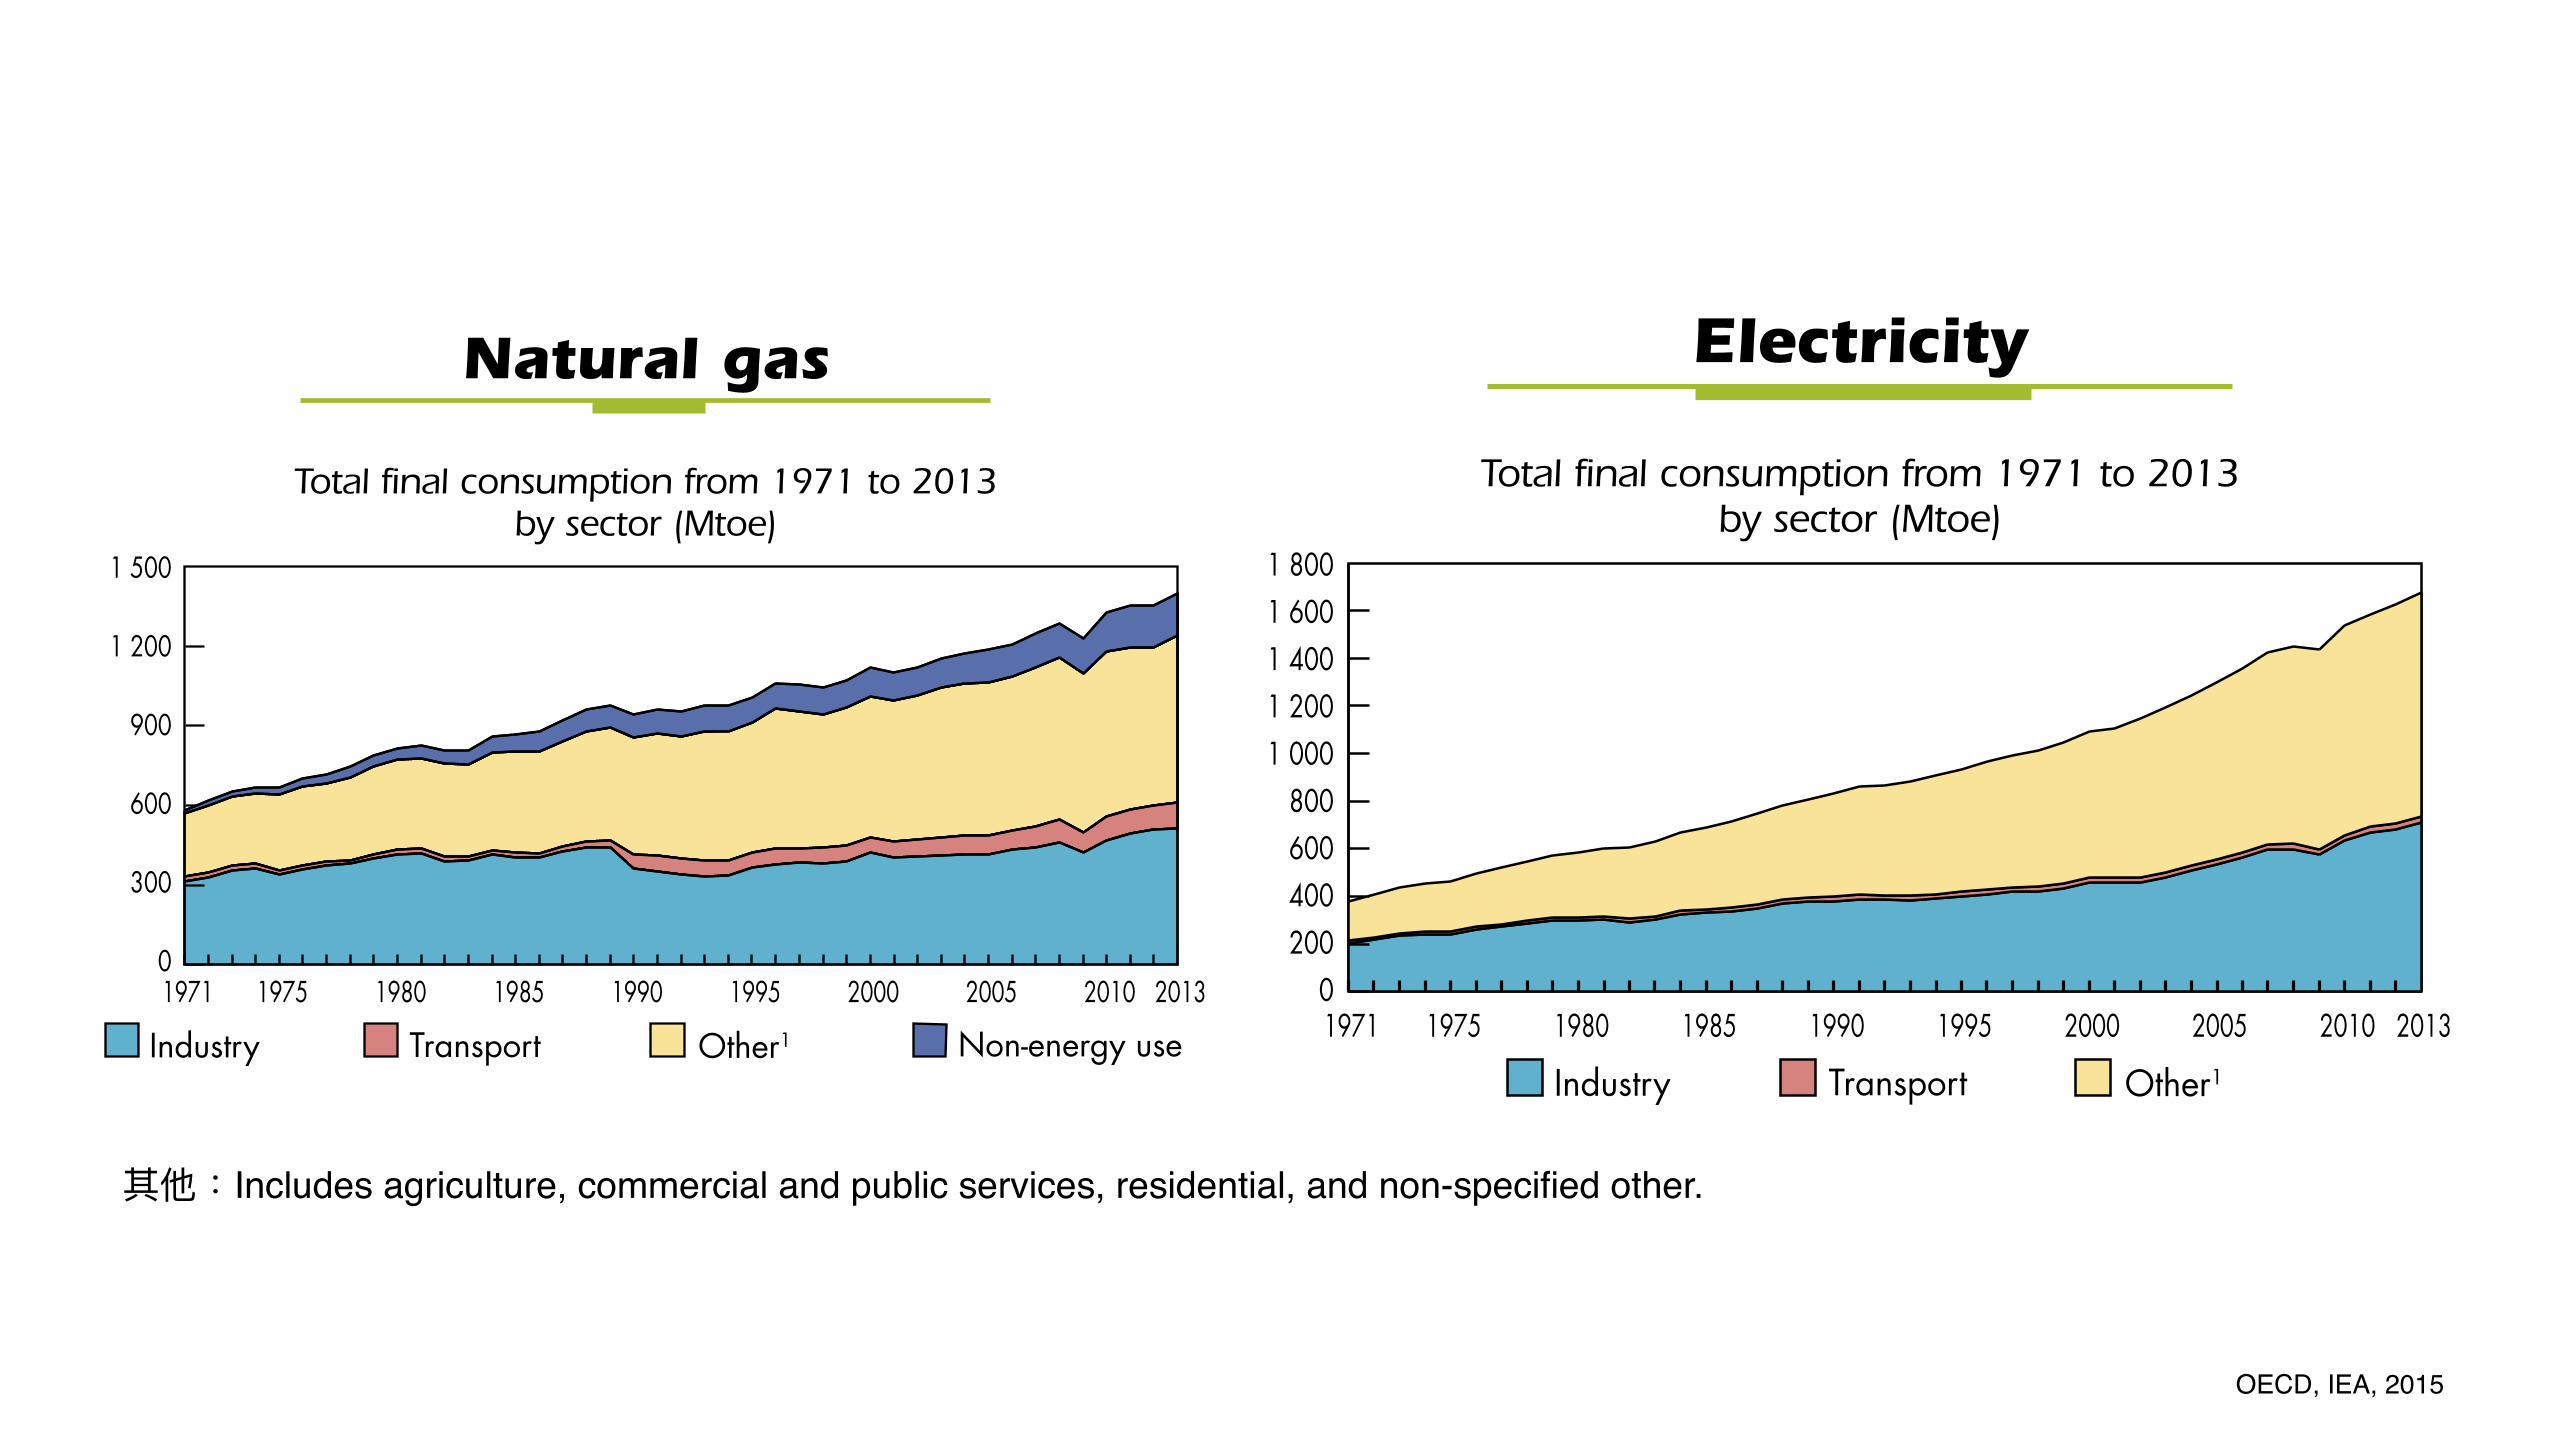
Total final consumption from 1971 to 2013 by sector (Mtoe)
1973 and 2013 shares of world natural gas consumption
652 Mtoe 1 401 Mtoe
1. Includes agriculture, commercial and public services, residential, and non-specified other.
1973 2013
Industry54.7%
Transport 2.7%
Other1
39.8%
Non-energy use2.8%
Non-energy use11.1%
Other1
44.8%
Transport 6.9%
Industry37.2%
T O T A L F I N A L C O N S U M P T I O N
© O
ECD
/IEA
, 201
5
3
35
Electricity
Other1 TransportIndustry
0 200 400 600 800
1 000 1 200 1 400 1 600 1 800
1971 1975 1980 1985 1990 1995 2000 2005 2010 2013
Total final consumption from 1971 to 2013 by sector (Mtoe)
1973 and 2013 shares of world electricity consumption
440 Mtoe 1 677 Mtoe
1. Includes agriculture, commercial and public services, residential, and non-specified other.
1973 2013
Industry53.4%
Transport2.4%
Other1
44.2% Other1
56.2%
Industry42.3%
Transport1.5%
BY SECTOR
© O
ECD
/IEA
, 201
5Includes agriculture, commercial and public services, residential, and non-specified other.
OECD, IEA, 2015
EMISSIONS
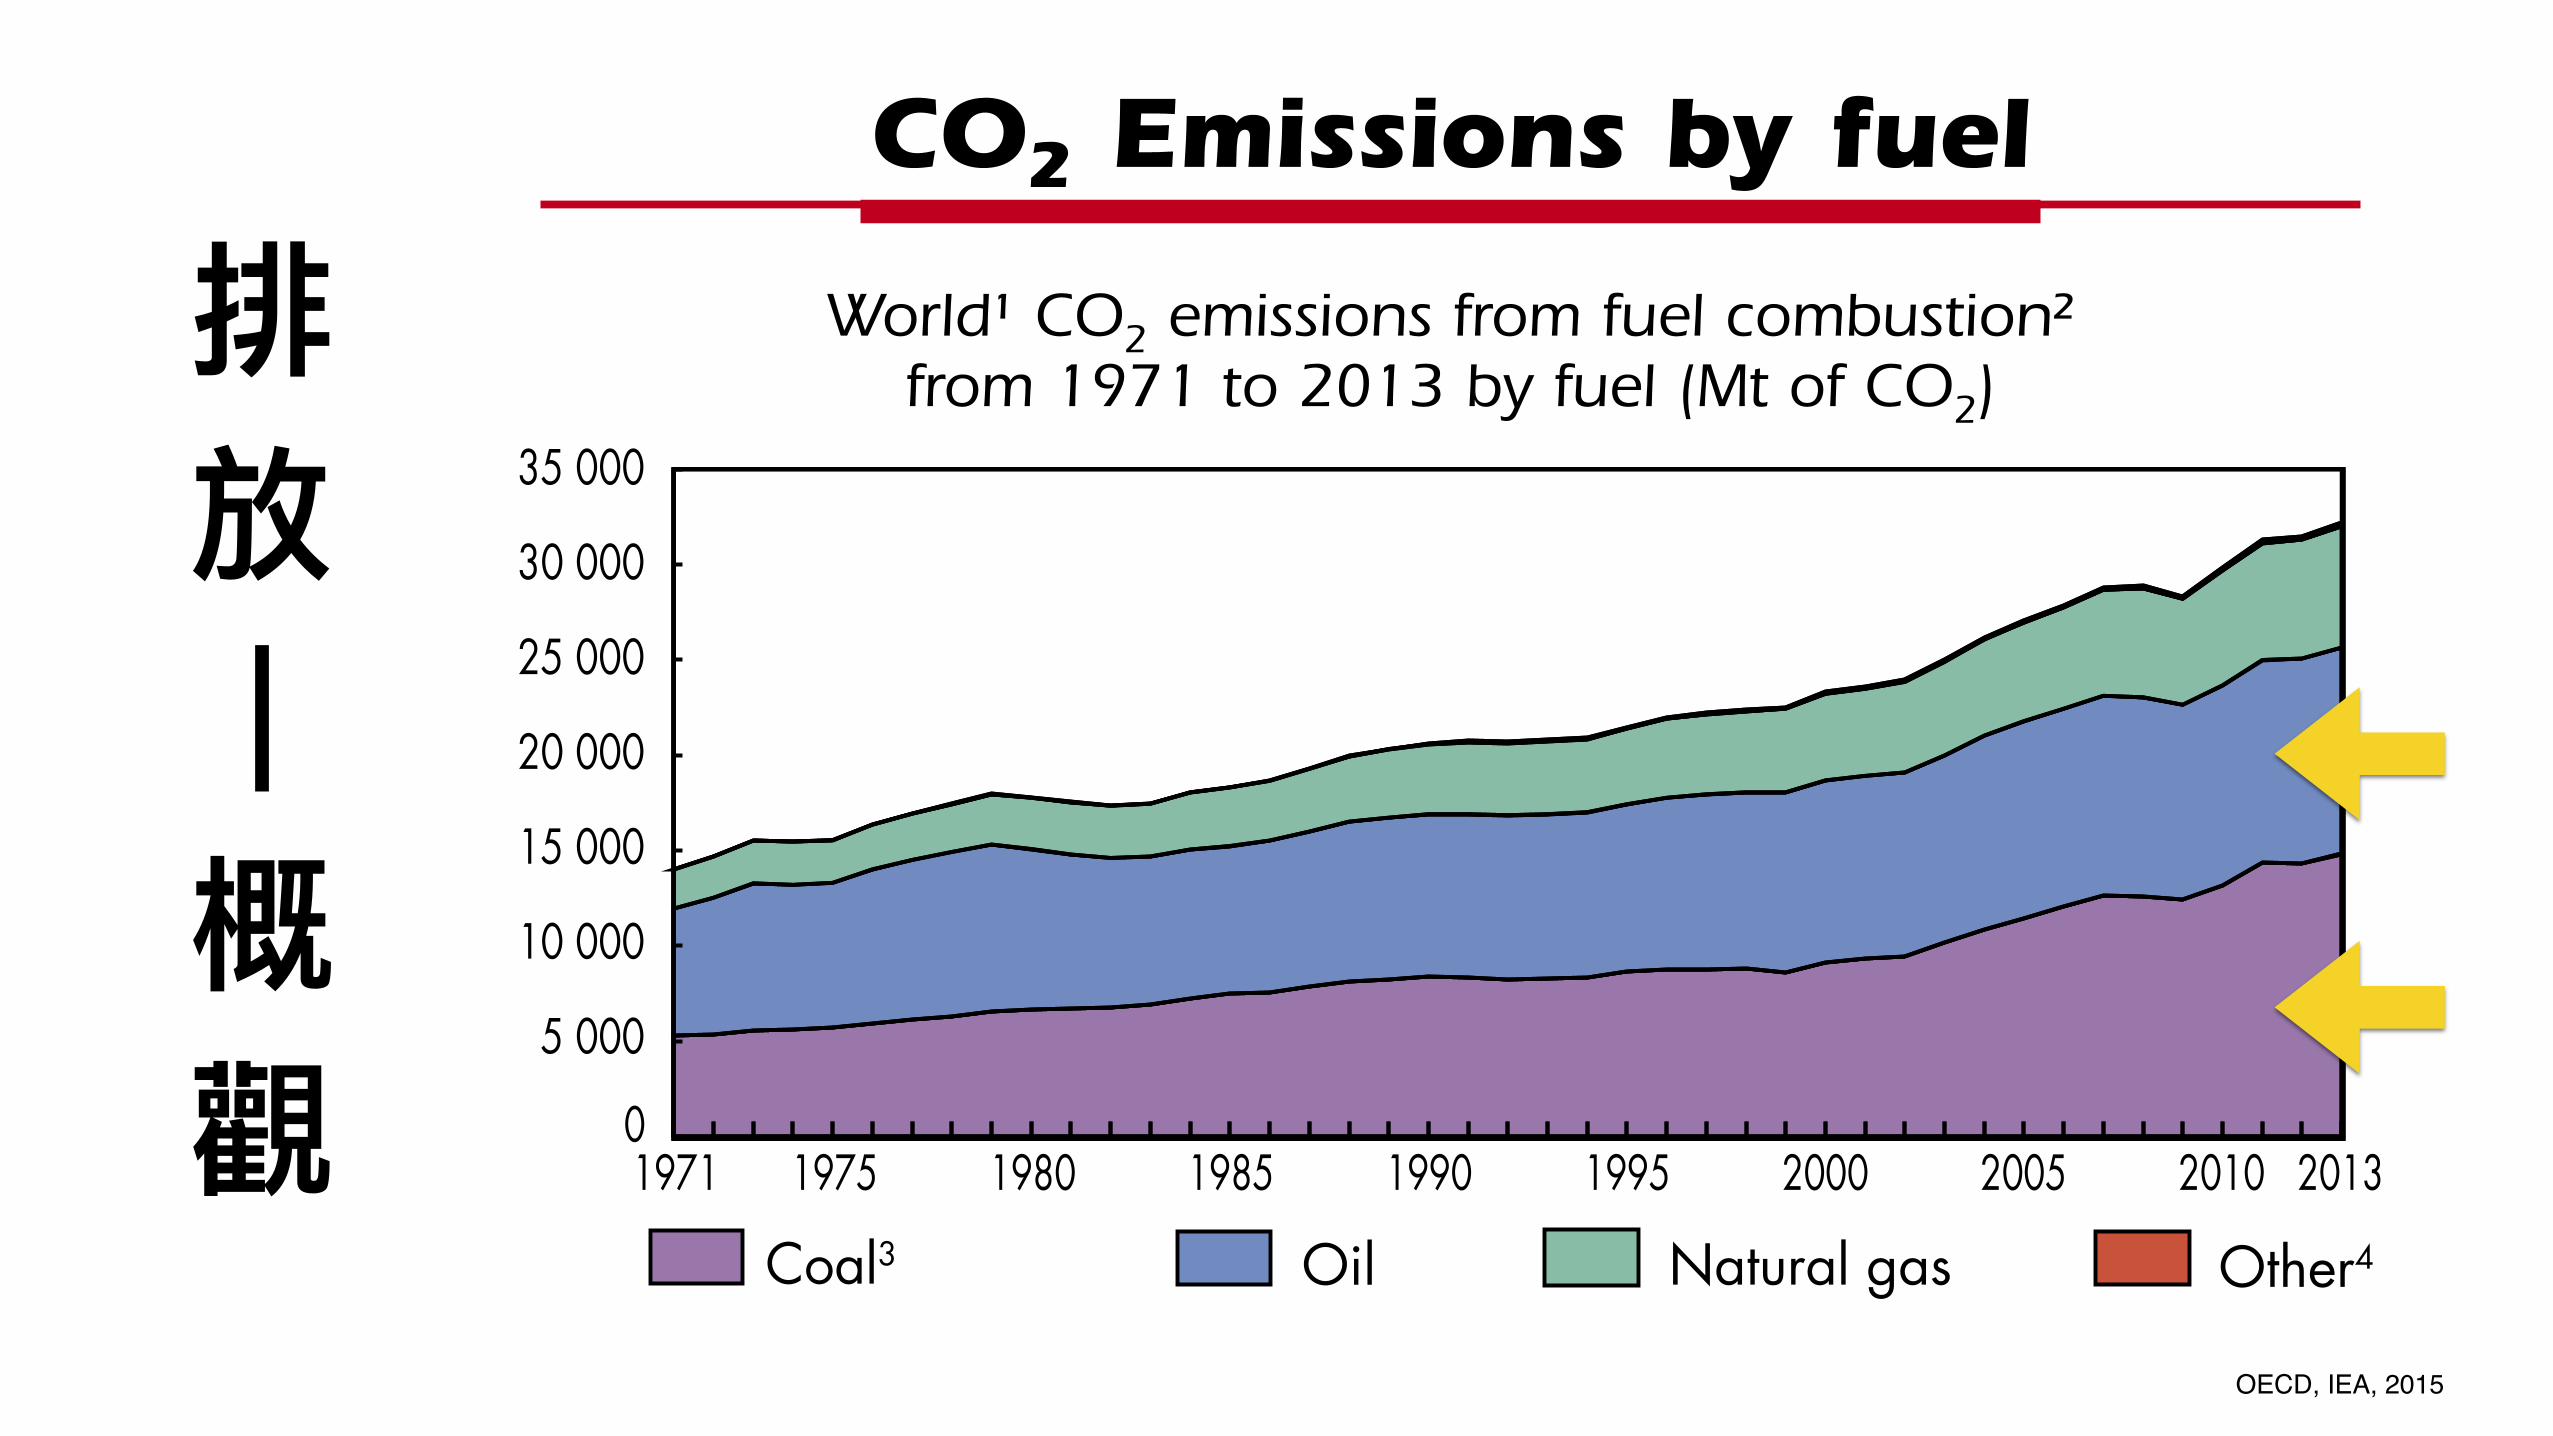
CO2 Emissions by fuel
1973 and 2013 fuel shares of CO2 emissions from fuel combustion²
15 515 Mt of CO2 32 190 Mt of CO2
1. World includes international aviation and international marine bunkers. 2. CO2 emissions from fuel combustion are based on the IEA energy balances
and on the 2006 IPCC Guidelines, excluding emissions from non-energy. 3. In these graphs, peat and oil shale are aggregated with coal. 4. Includes industrial waste and non-renewable municipal waste.
1973 2013
44
EMISSIONS
World¹ CO2 emissions from fuel combustion² from 1971 to 2013 by fuel (Mt of CO2)
1971 1975 1980 1985 1990 1995 2000 2005 2010 2013
Natural gasOilCoal3 Other4
0
5 000
10 000
15 000
20 000
25 000
30 000
35 000
Natural gas19.8%
Oil33.6%
Coal346.0%
Natural gas14.4%
Oil49.7%
Coal335.9%
Other4
0.6%
© O
ECD
/IEA
, 201
5
OECD, IEA, 2015
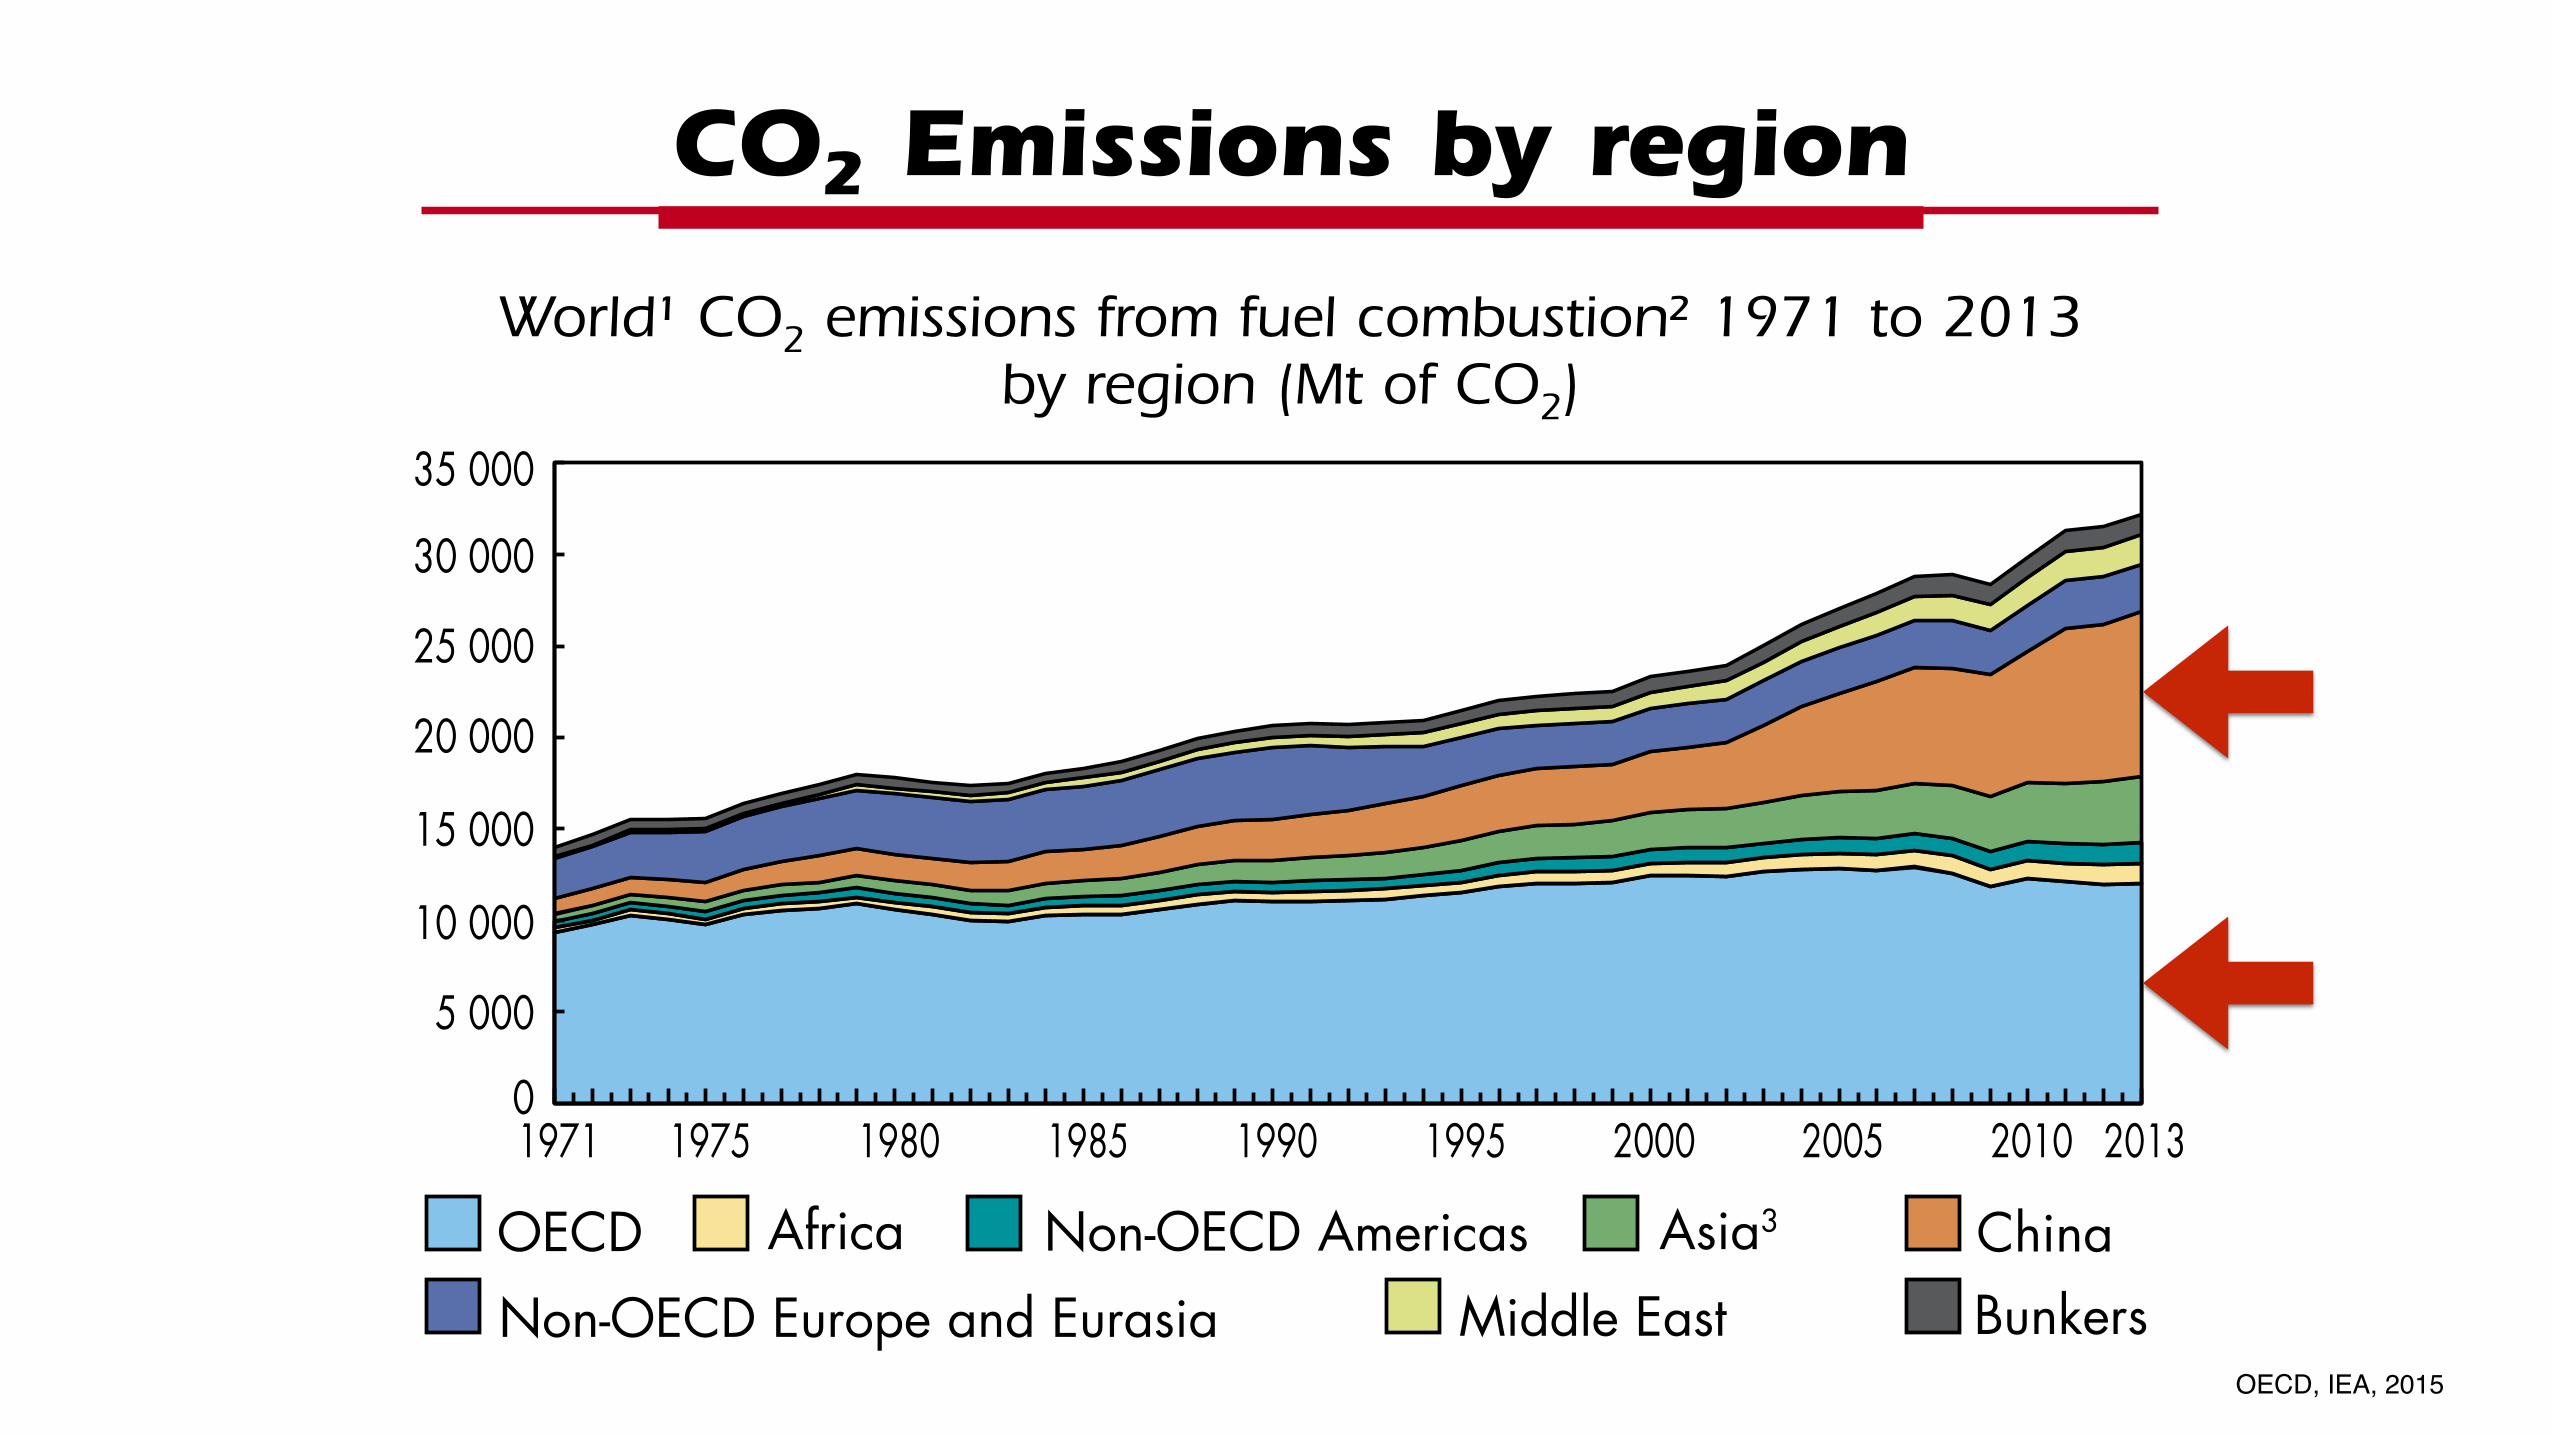
61973 and 2013 regional shares of
CO2 emissions from fuel combustion²
15 515 Mt of CO2 32 190 Mt of CO2
1. World includes international aviation and international marine bunkers, which are shown together as Bunkers.
2. CO2 emissions from fuel combustion are based on the IEA energy balances and on the 2006 IPCC Guidelines, excluding emissions from non-energy.
3. Asia excludes China.
Non-OECDAmericas
2.5%
Non-OECDAmericas 3.5%
Asia3 3.0%
Asia3
11.2%
Non-OECD Europe
and Eurasia15.9%
Non-OECD Europeand Eurasia 8.0%
Middle East 0.8%
Middle East 5.1%
OECD 66.3% OECD
37.4%
China6.0%
China28.0%
Africa1.8%
Africa 3.4%
Bunkers 3.7%
Bunkers 3.4%
CO2 Emissions by region
45
6
1971 1975 1980 1985 1990 1995 2000 2005 2010 2013
Non-OECD Europe and EurasiaNon-OECD Americas Asia3
Middle EastChinaOECDBunkers
Africa
0
5 000
10 000
15 000
20 000
25 000
30 000
35 000
1973 2013
World¹ CO2 emissions from fuel combustion² 1971 to 2013by region (Mt of CO2)
© O
ECD
/IEA
, 201
5
OECD, IEA, 2015
OECD, IEA, 2015
7
(Source: IEA WEO 2006)
47
7
(Source: IEA, World Energy Outlook 2014)
NPS: New Policies Scenario (based on policies under consideration)
450S: 450 Scenario3
(based on policies needed to limit global average temperature increase to 2 °C)
TPES Outlook by region
1990 2012 NPS2020
450S NPS2030
450S NPS2040
450S0
2 000 4 000 6 000 8 000
10 000 12 000 14 000 16 000
20 000 18 000
OECD China Asia1 Non-OECD Europe and Eurasia
Middle East Africa Non-OECD Americas Bunkers2
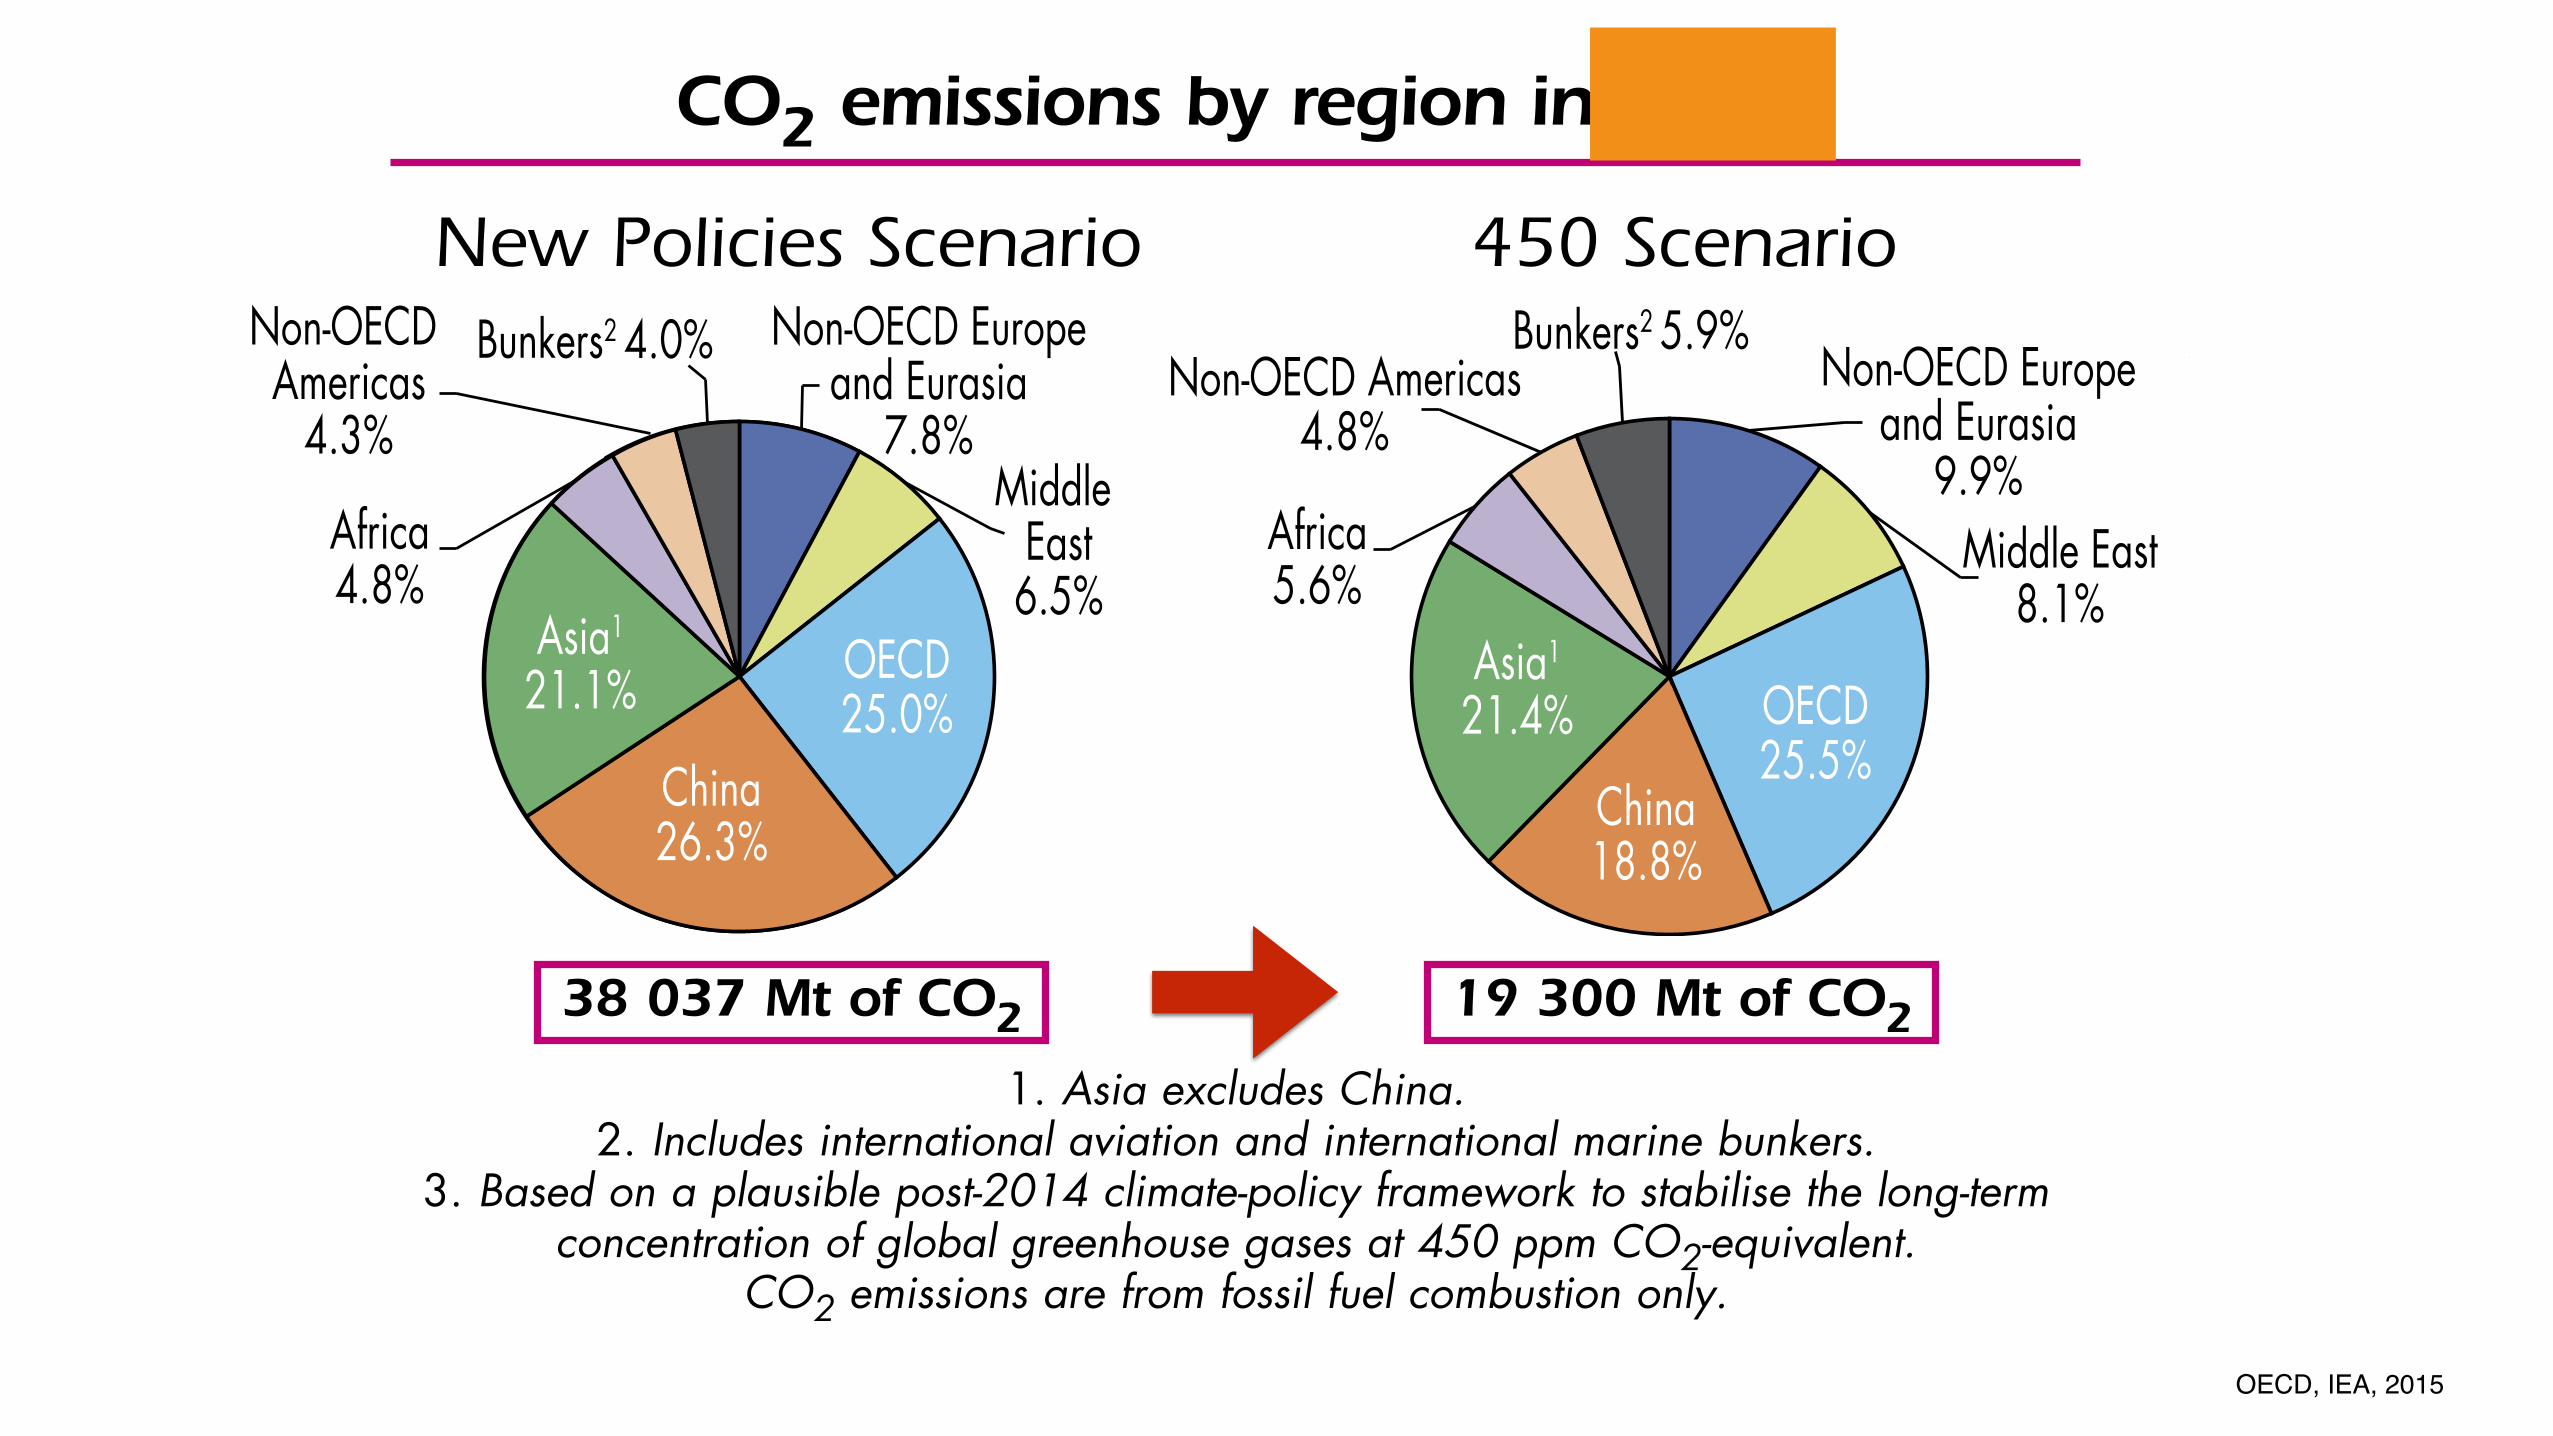
CO2 emissions by region in 2040
38 037 Mt of CO2 19 300 Mt of CO2
1. Asia excludes China.2. Includes international aviation and international marine bunkers.
3. Based on a plausible post-2014 climate-policy framework to stabilise the long-term concentration of global greenhouse gases at 450 ppm CO2-equivalent.
CO2 emissions are from fossil fuel combustion only.
New Policies Scenario 450 Scenario
OECD25.0%
China26.3%
Asia1
21.1%
Non-OECD Europeand Eurasia
7.8%Middle
East6.5%
Africa4.8%
Non-OECD Americas
4.3%
Bunkers2 4.0%
OECD25.5%
China18.8%
Asia1
21.4%
Non-OECD Europeand Eurasia
9.9%Middle East
8.1%Africa5.6%
Non-OECD Americas4.8%
Bunkers2 5.9%
T O 2 0 4 0
(Mtoe)
© O
ECD
/IEA
, 201
5

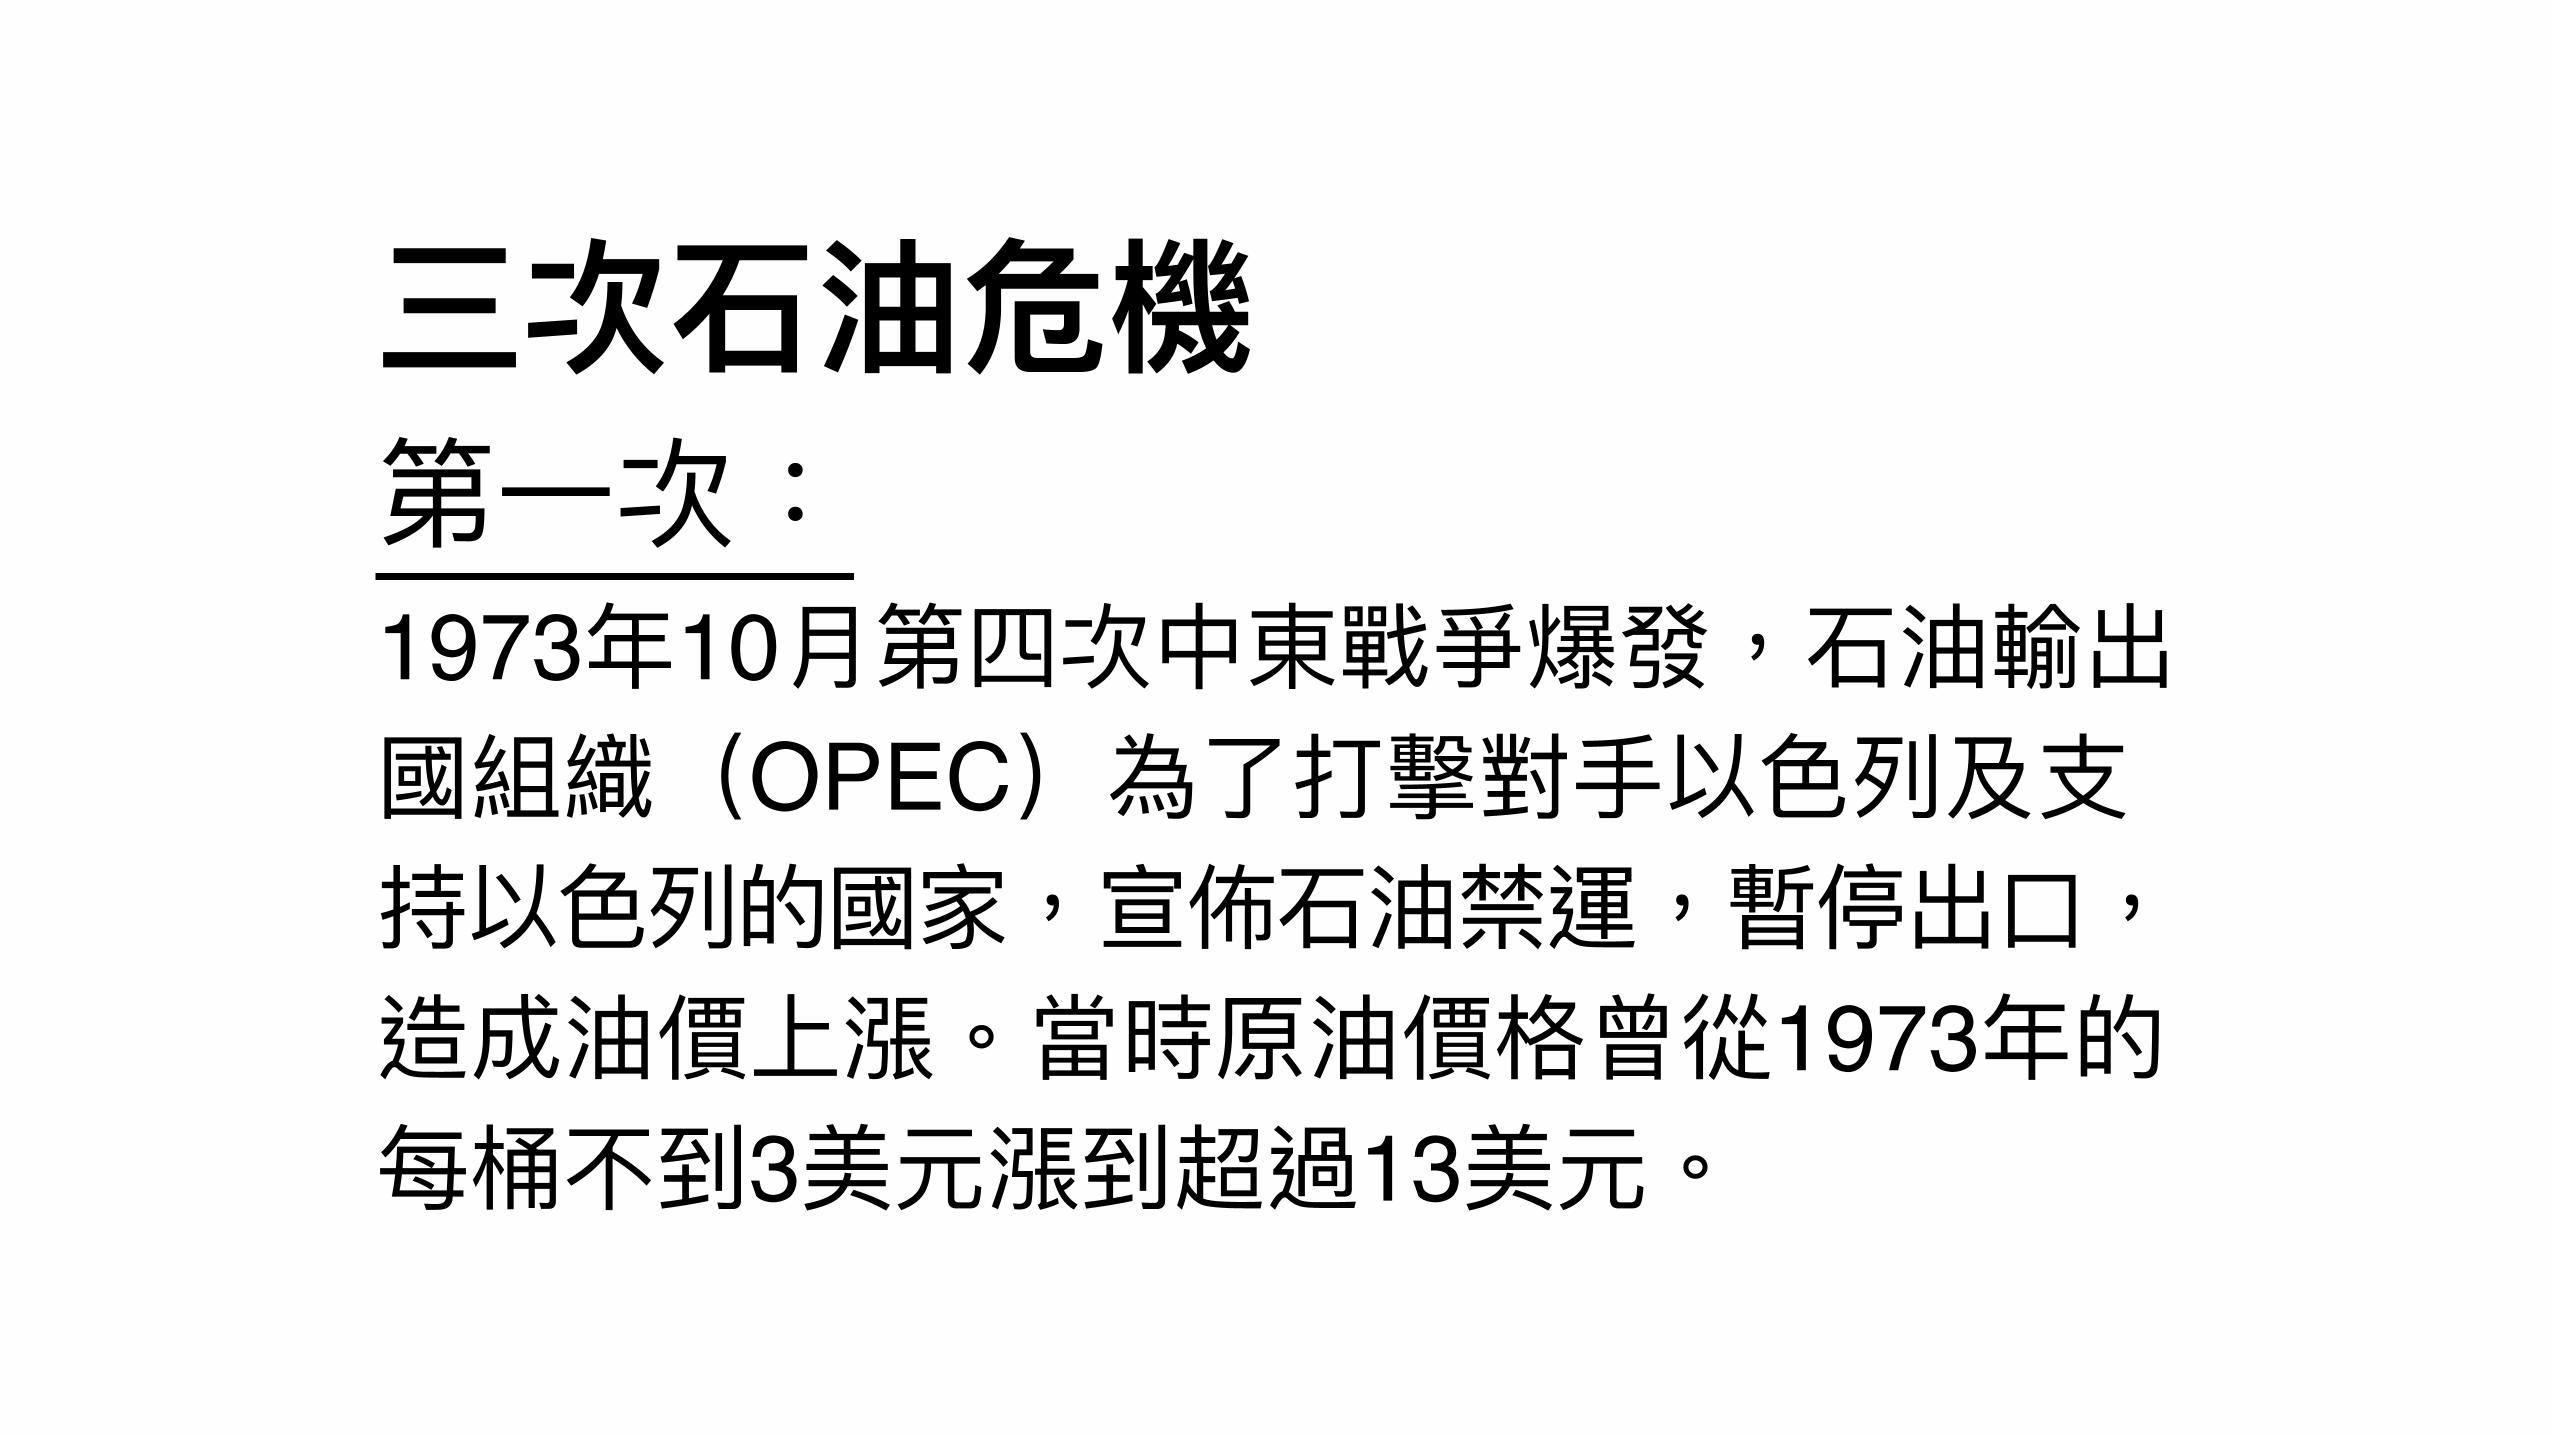
1973 10OPEC
19733 13

1978
50013
34

1990 8
42
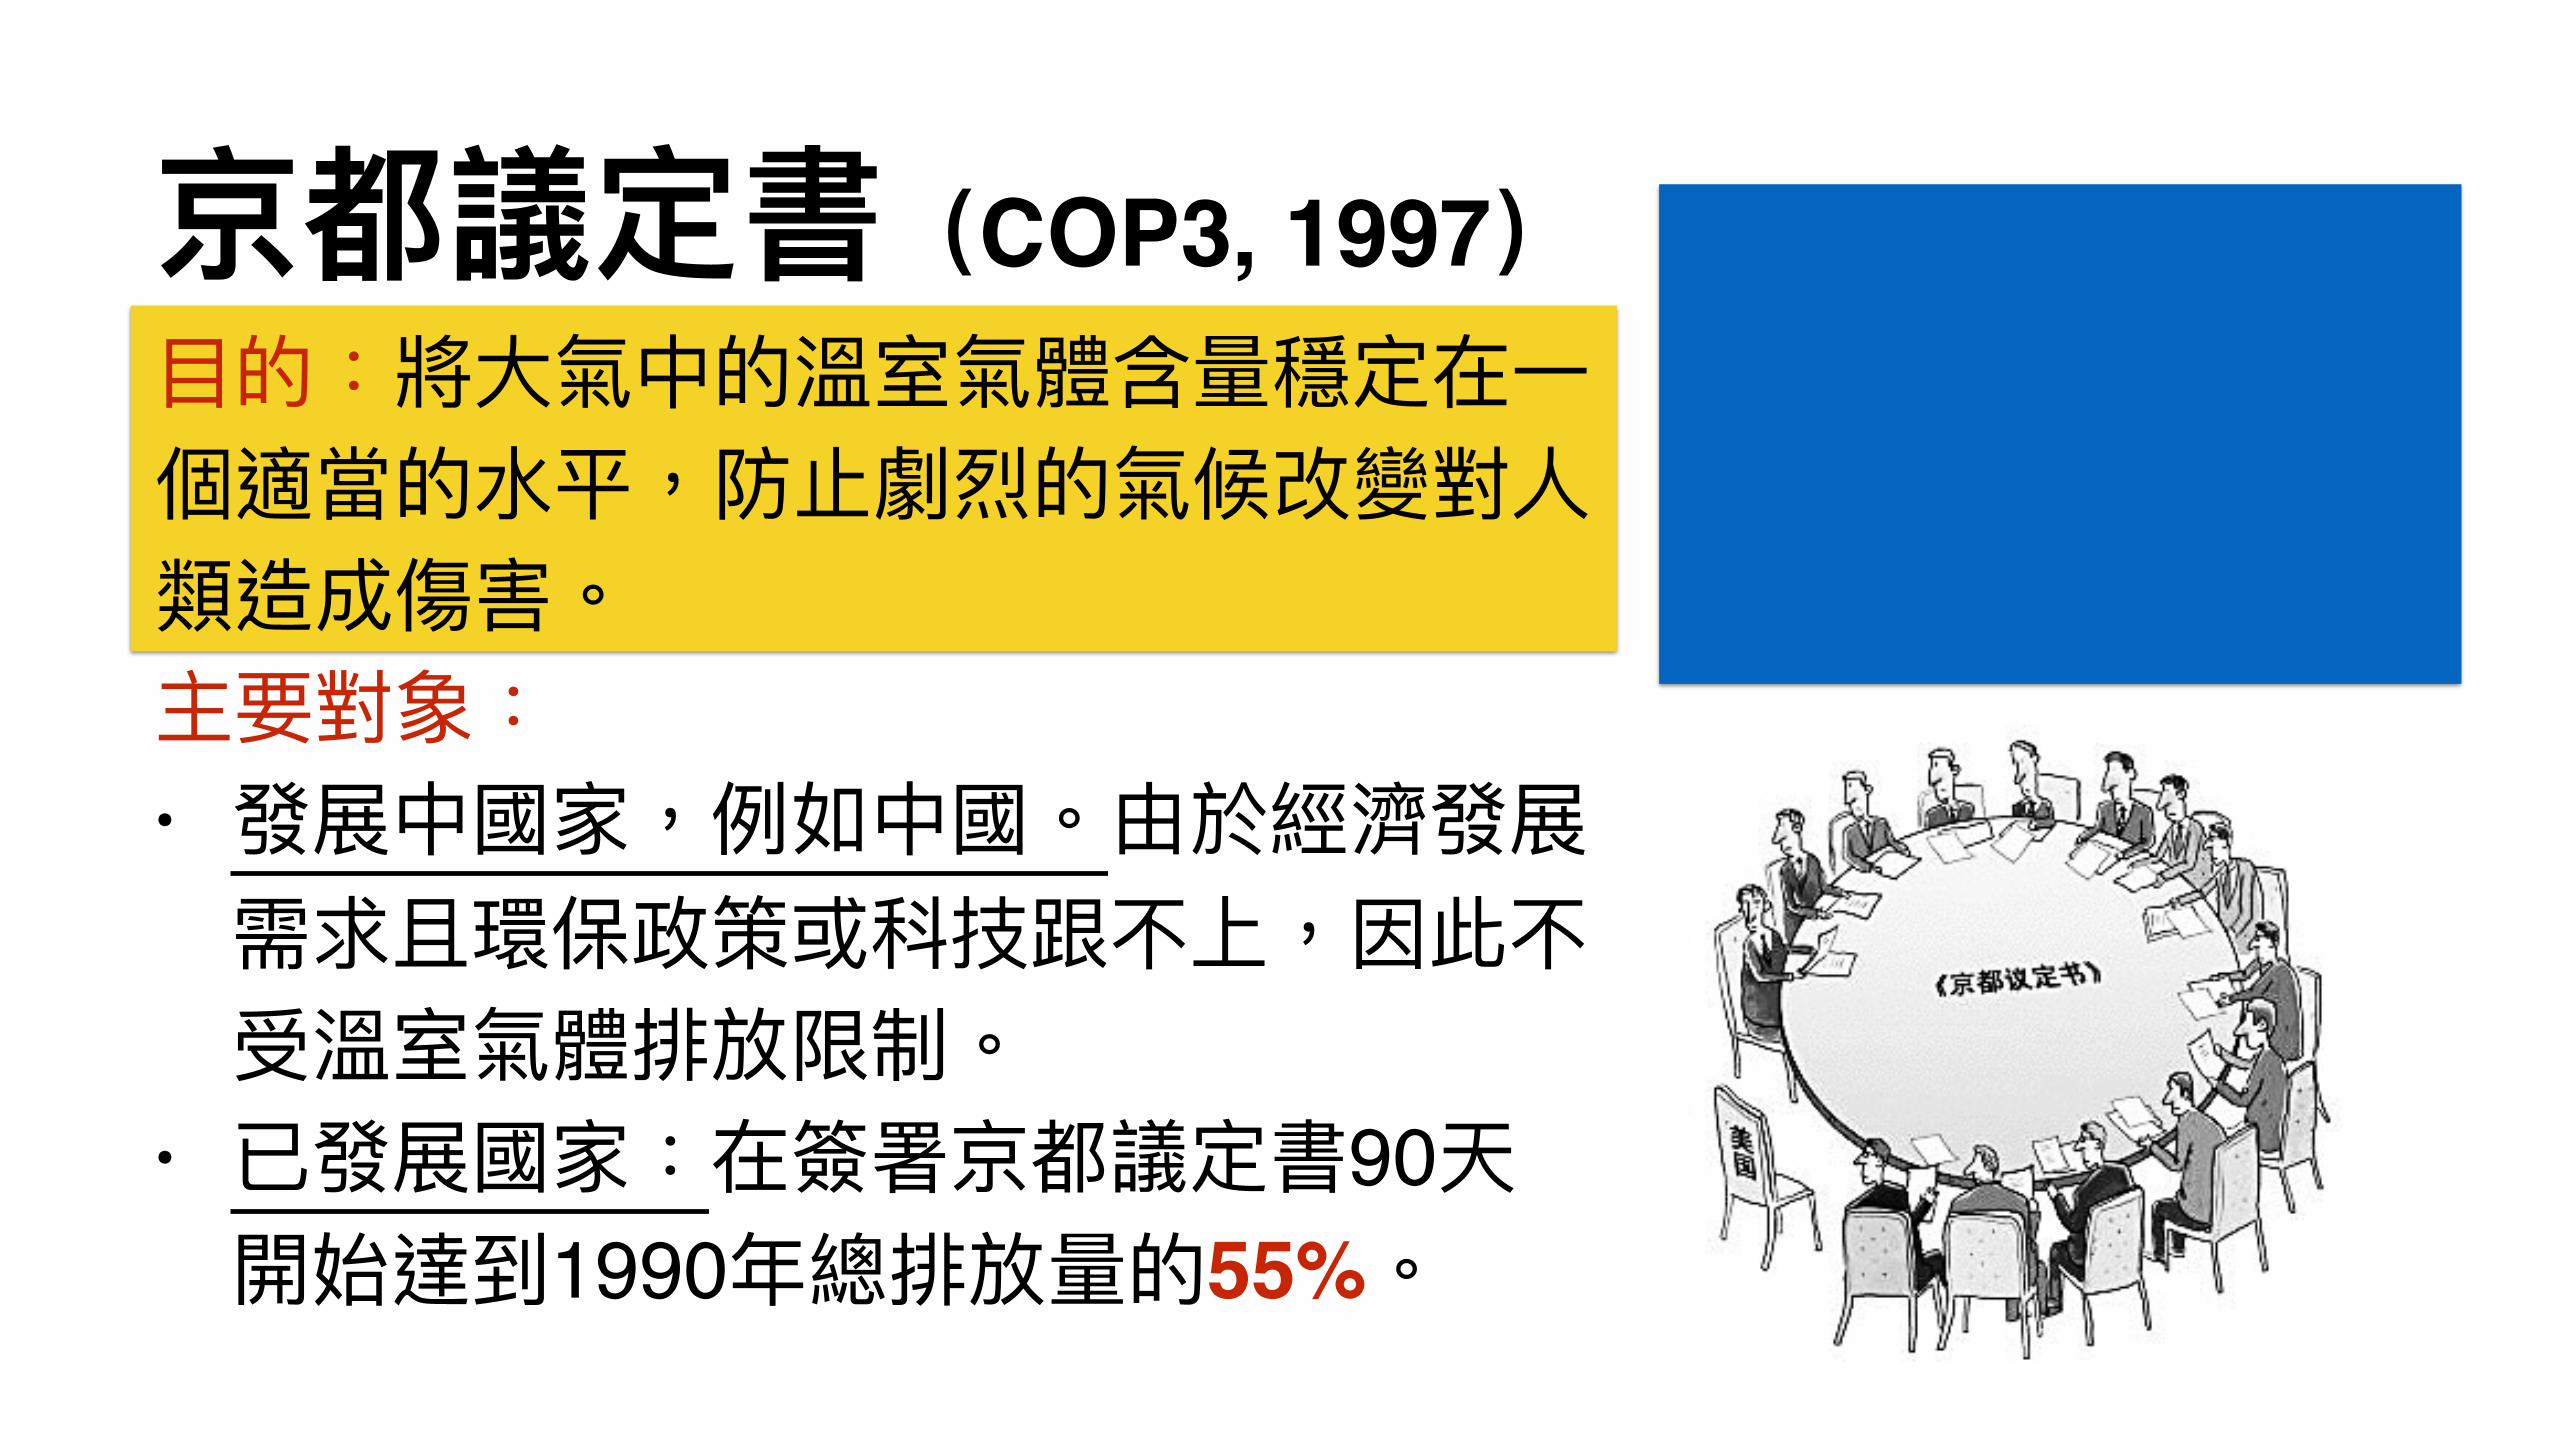
COP3, 1997
•
• 901990 55%
20112012
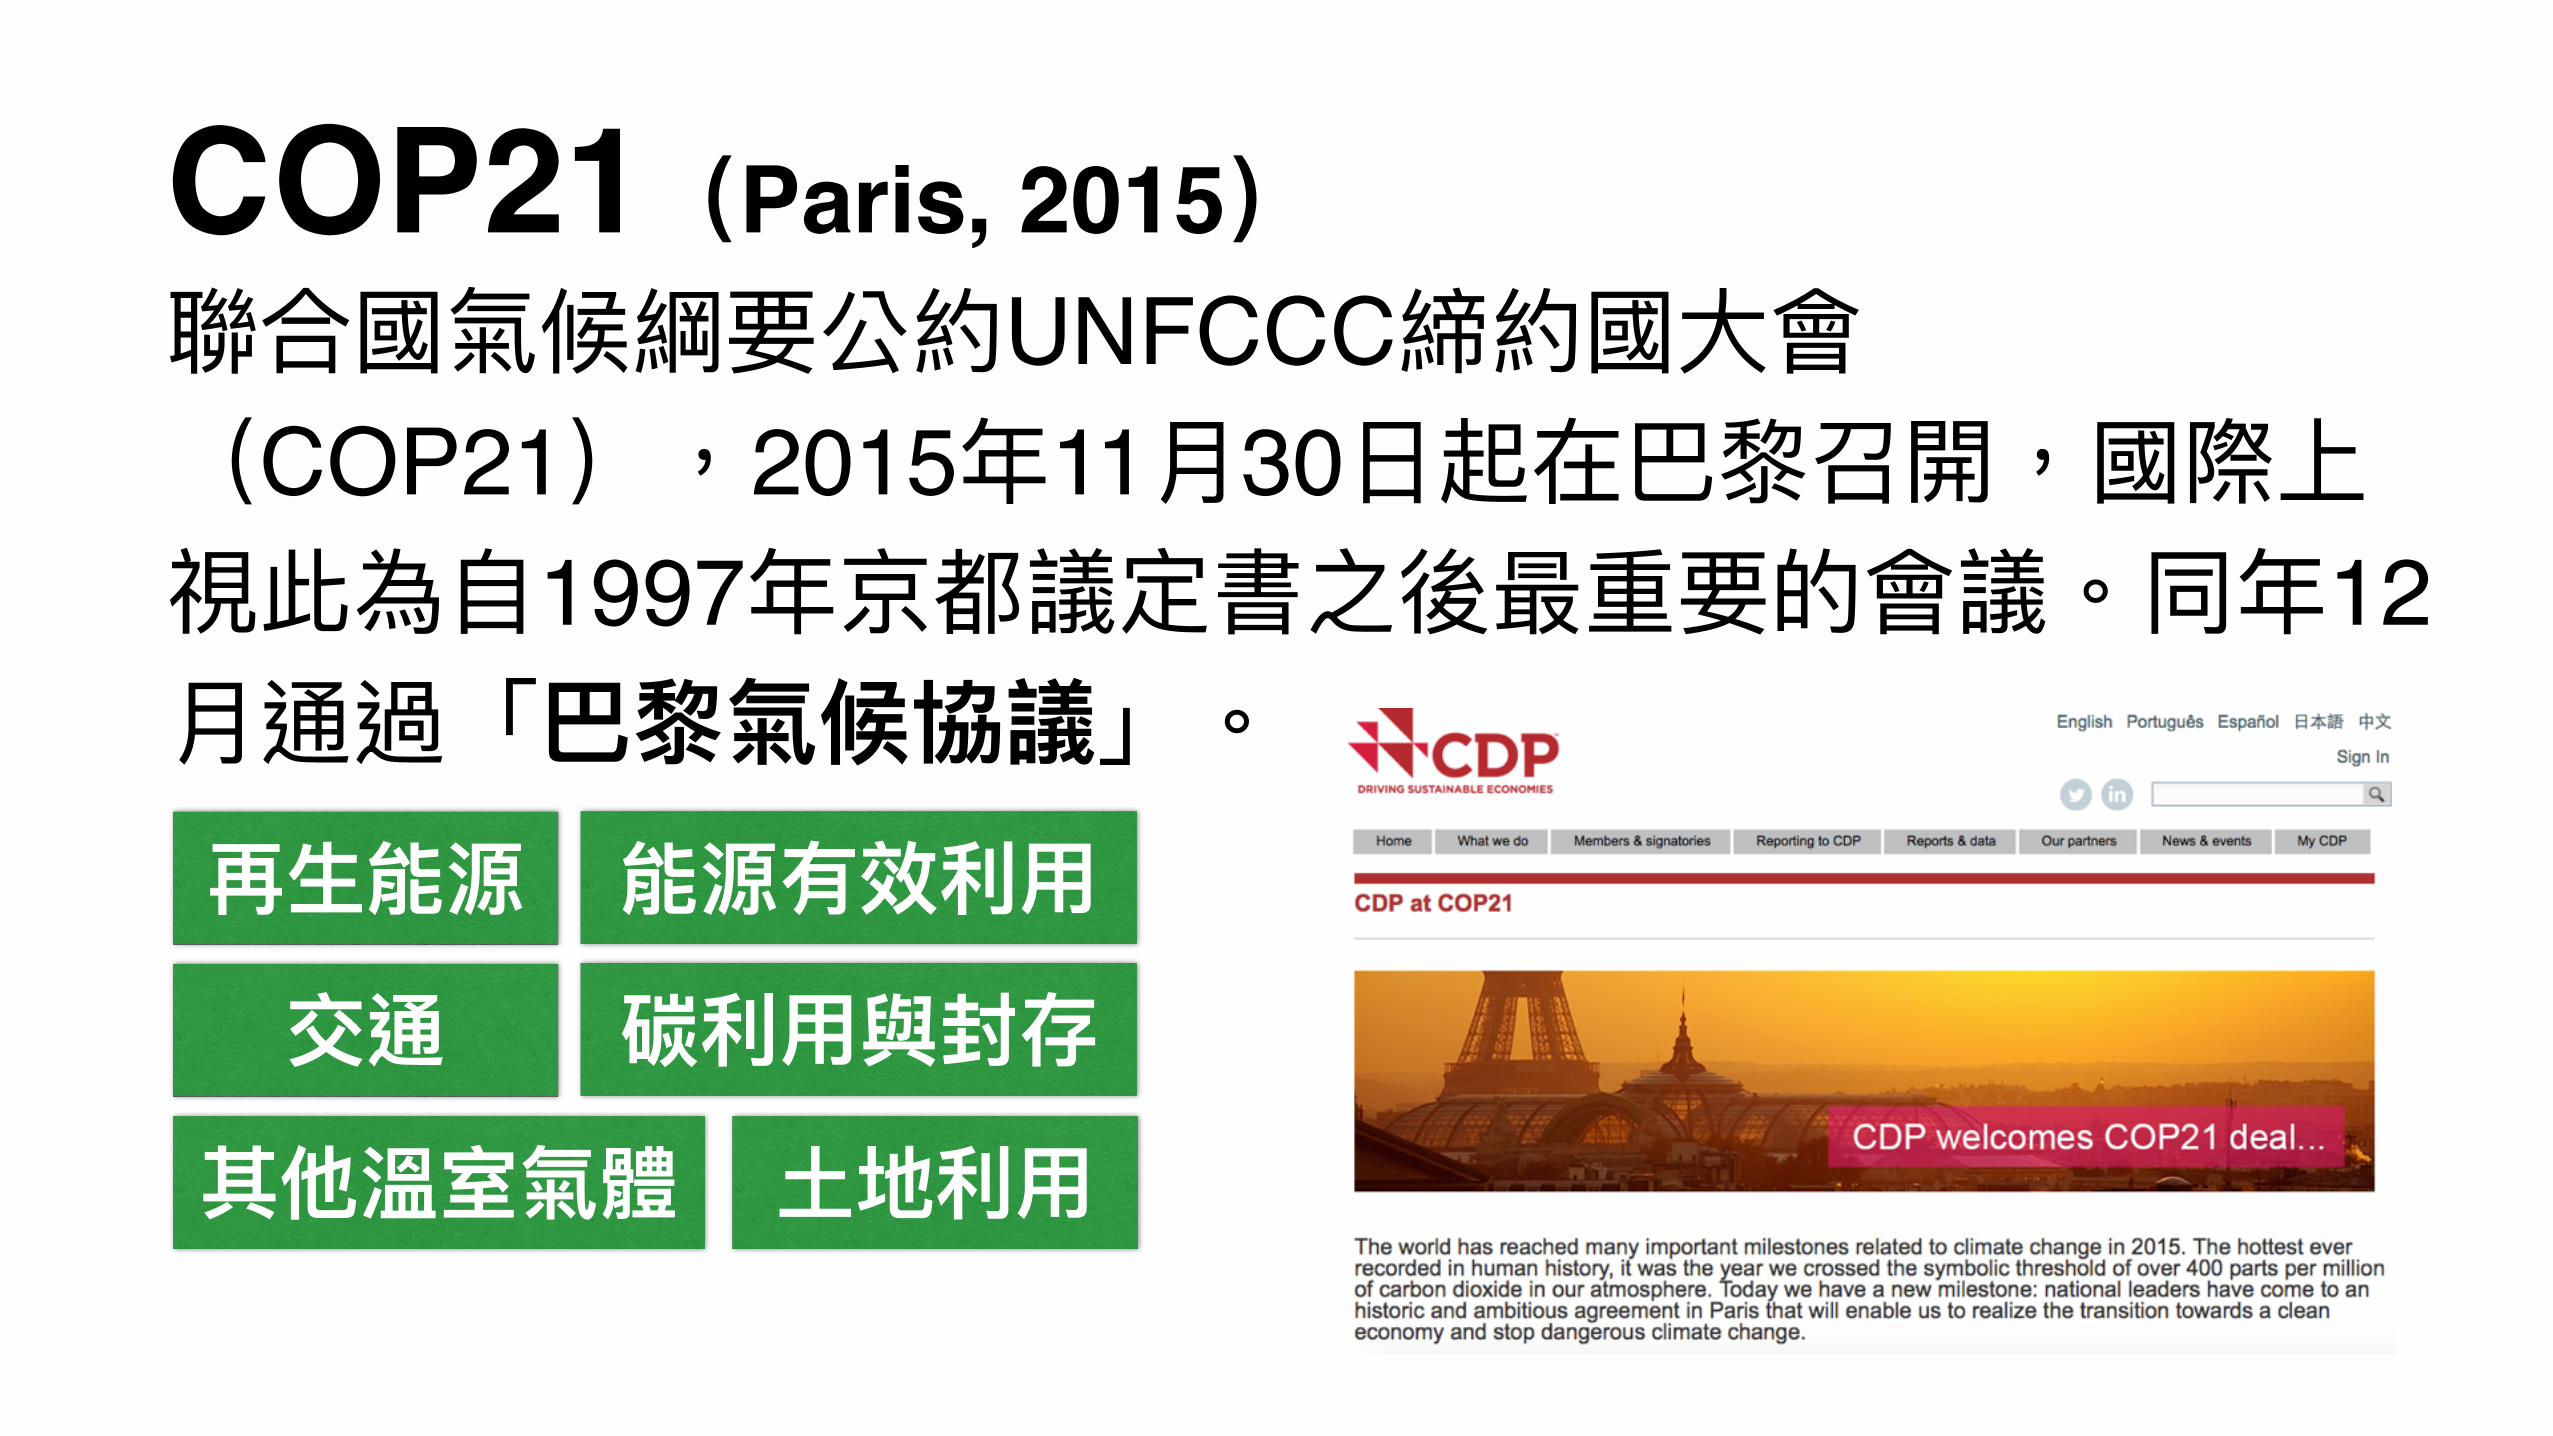
COP21 Paris, 2015UNFCCC
COP21 2015 11 301997 12

1.2.3.


https://www.youtube.com/watch?v=rVj8sjgC1Sw
https://www.youtube.com/watch?v=KlP17PObxUQhttps://www.youtube.com/watch?v=PyU-VL2SGE8
https://www.youtube.com/watch?v=v91U6yvLiSA
https://www.youtube.com/watch?v=v91U6yvLiSA
http://www.ettoday.net/news/20151211/611841.htm