Embed Size (px)
Citation preview
Creating a University for the 21st Century, FINANCIAL SUSTAINABILITY | ROADSHOW
EXPANDED LEADERSHIP TEAM| MARCH 2015
DAVE LAWLORVICE CHANCELLOR & CHIEF FINANCIAL OFFICER
1
Agenda
2
FramingEconomic ModelCapital PlansPrioritiesStructureVC-CFO Initiatives

Framing
3

4
UC Davis of the 21st century, in order to accomplish its core mission, must be
run as well as the best global enterprises.

Why?
5
UC Davis of the 21st Century, Why?
in order to accomplish its core mission, To attract & invest in faculty, research, academic programs, & support infrastructure we must be wise stewards of all resources, and have sufficientresources to be competitive on important dimensions.
must be run as well as the best global enterprises.
There are more pressures on families than ever before to afford a quality university education.
We must become an irresistible investment opportunity for federal, state, and corporate investments in our core mission and in new partnership opportunities.
Guiding Principles
6
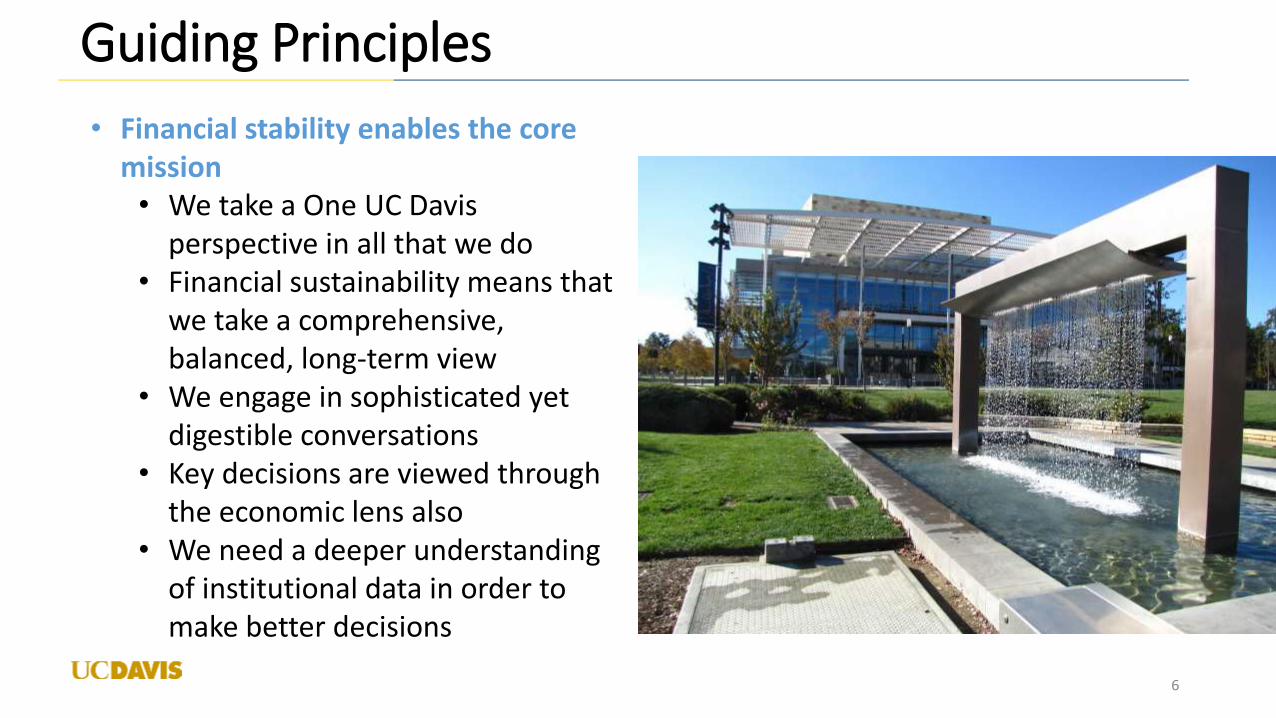
• Financial stability enables the core mission• We take a One UC Davis
perspective in all that we do• Financial sustainability means that
we take a comprehensive, balanced, long-term view
• We engage in sophisticated yet digestible conversations
• Key decisions are viewed through the economic lens also
• We need a deeper understanding of institutional data in order to make better decisions
Financial Sustainability Action Plan:
7
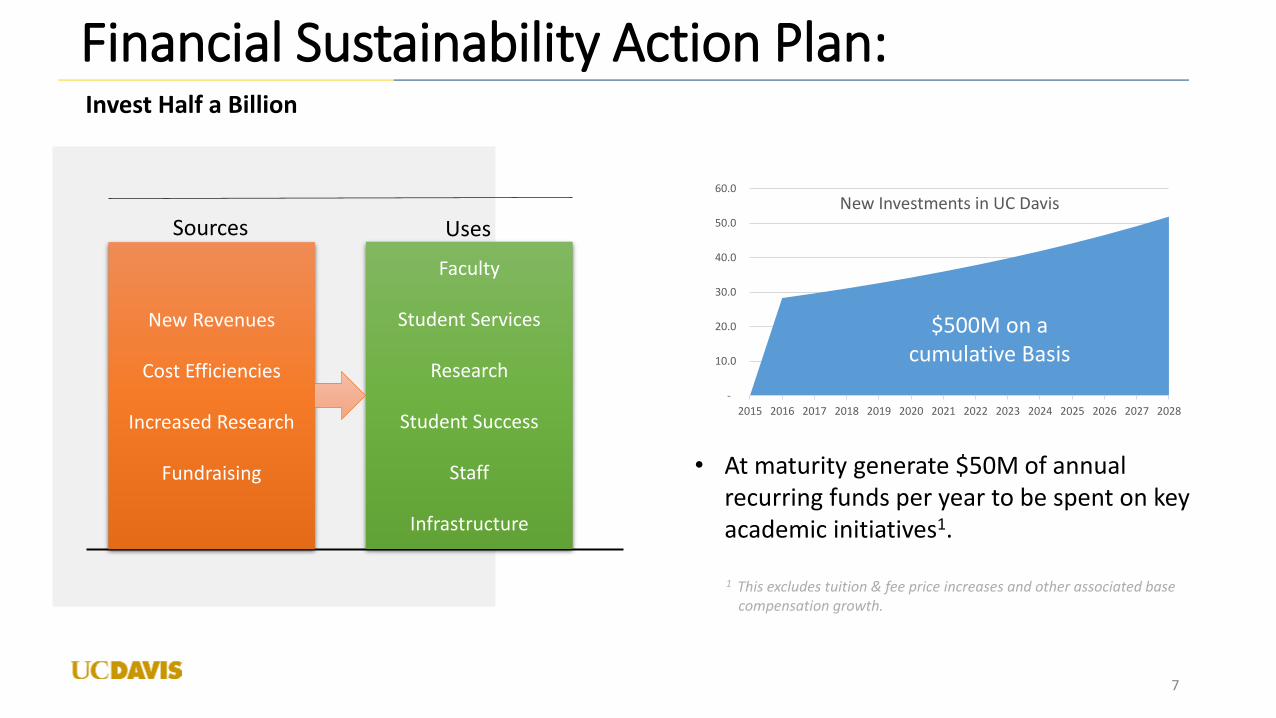
New Revenues
Cost Efficiencies
Increased Research
Fundraising
Faculty
Student Services
Research
Student Success
Staff
Infrastructure
• At maturity generate $50M of annual recurring funds per year to be spent on key academic initiatives1.
1 This excludes tuition & fee price increases and other associated base compensation growth.
-
10.0
20.0
30.0
40.0
50.0
60.0
2015 2016 2017 2018 2019 2020 2021 2022 2023 2024 2025 2026 2027 2028
New Investments in UC Davis
$500M on a cumulative Basis
Sources Uses
Invest Half a Billion

Financial Sustainability Action Plan
8
FSAP Tranparency Report
0
50
100
150
200
250
Sources Funnel Available for Investment Invested
Financial Sustainability Action PlanBase Year FY12, Goal Year FY21
We have identified $200M of new sourcesof funnel which we are presently pursuing.
Of these funnel items, in FY14 we have generated $34M+ of incremental Net Revenue available for investment. $34M was generated from the 2020 Initiative; $XM from Administrative Efficiencies, $YM from ICR growth, and $ZM in new Payout on new gifts to our endowment.
$xM has been invested in recurring items.
Not shown on the recurring chart: $cM of one time sources have been harvested, and $dM of which has been invested in one time uses.
DRAFT
The Economic Model
9
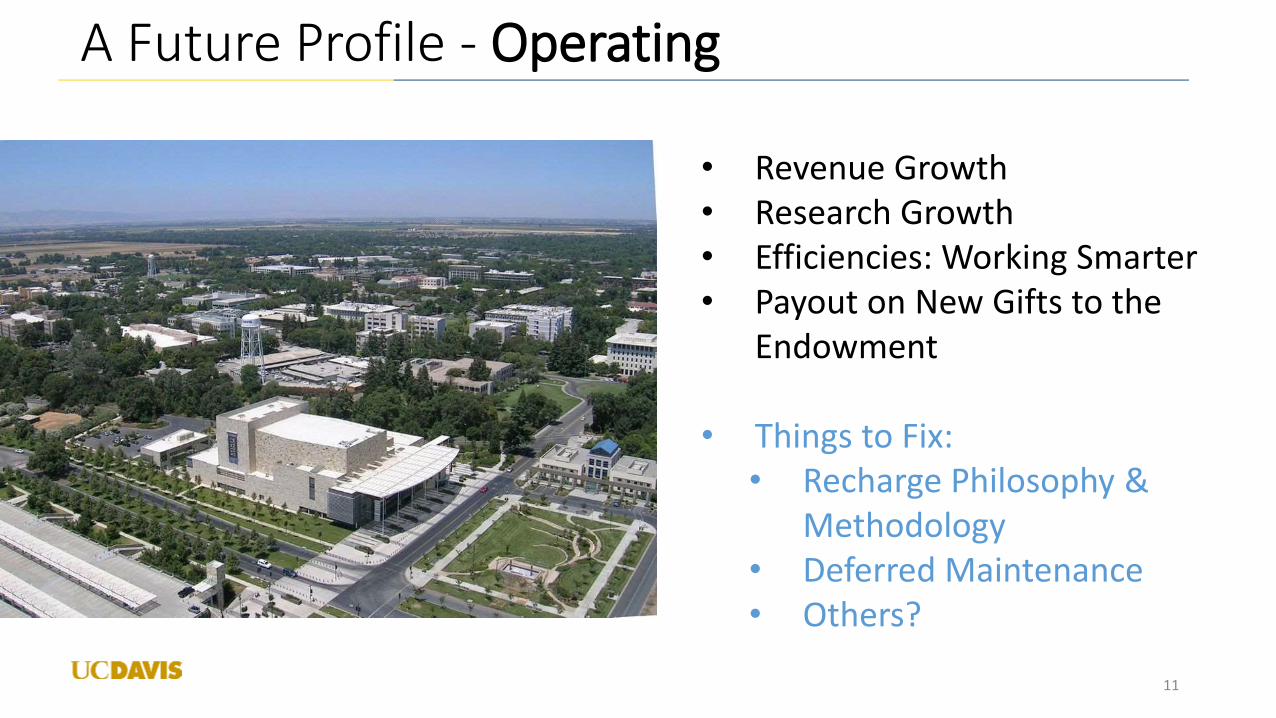
A Future Profile - Operating
11
• Revenue Growth• Research Growth• Efficiencies: Working Smarter• Payout on New Gifts to the
Endowment
• Things to Fix:• Recharge Philosophy &
Methodology• Deferred Maintenance• Others?
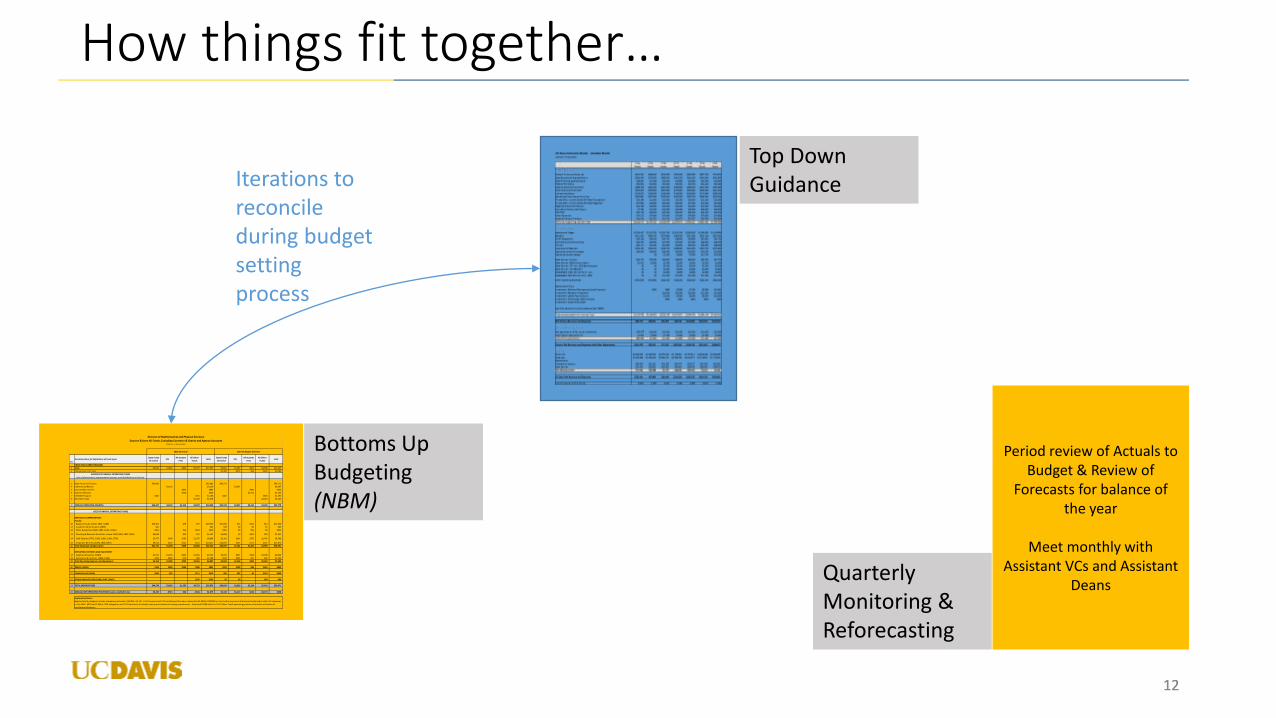
How things fit together…
1212
Period review of Actuals to Budget & Review of
Forecasts for balance of the year
Meet monthly with Assistant VCs and Assistant
Deans
Top Down Guidance
Bottoms Up Budgeting (NBM)
Quarterly Monitoring & Reforecasting
lineSee Instructions for Definitions of Fund Types
State Funds
& Tuition ICR
All Student
Fees
All Other
FundsTotal
State Funds
& Tuition ICR
All Student
Fees
All Other
FundsTotal
PRIOR YEAR CARRYFORWARD:
1 Total $3,652 $1,852 $836 $5,227 $11,567 $5,821 $1,337 $901 $4,598 $12,657
2 Change from Prior Year $2,169 -$515 $64 -$629 $1,089
SOURCES OF ANNUAL OPERATING FUNDS
(net of depreciation, improvements reserves, and distributions out of org)
3 State Funds and Tuition $45,982 $45,982 $49,712 $49,712
4 Indirect Cost Return $3,110 $3,110 $3,937 $3,937
5 Course Material Fees $895 $895 $660 $660
6 Summer Sessions $419 $419 $1,753 $1,753
7 COSMOS Program $465 $701 $1,166 $467 $826 $1,293
8 All Other Funds $3,378 $3,378 $2,423 $2,423
9 ANNUAL OPERATING SOURCES $46,447 $3,110 $1,314 $4,079 $54,950 $50,179 $3,937 $2,414 $3,249 $59,778
USES OF ANNUAL OPERATING FUNDS
EMPLOYEE COMPENSATION:
Faculty
10 Regular Faculty (ACAD, SB01, SUB0) $20,461 $78 $37 $20,576 $21,854 $12 $321 $13 $22,200
11 Academic Administrators (SB05) $41 $41 $39 $0 $0 $5 $43
12 Other Academics (SB06, SB03, ACAX, ACGA) $201 $12 $103 $316 $301 $0 $91 $0 $393
13 Teaching & Research Assistants, House Staff (SB02, SB07, SB04) $6,058 $62 $22 $6,141 $6,828 $0 $402 $70 $7,301
14 Staff Salaries (STFO, SUBS, SUBG, SUBX, STFB) $5,477 $969 $185 $1,375 $8,006 $6,161 $914 $270 $1,435 $8,780
15 Employee Benefits (SUB6, SB28, SB67) $9,514 $325 $101 $531 $10,471 $10,876 $255 $177 $567 $11,875
16 Total Employee Compensation $41,751 $1,294 $438 $2,068 $45,551 $46,059 $1,181 $1,262 $2,090 $50,591
OPERATING EXPENSES AND EQUIPMENT
17 Supplies & Expense (SUB3) $1,911 $1,153 $694 $1,964 $5,722 $1,672 $971 $758 $2,598 $6,000
18 Equipment & Facilities (SB34, SUB4) $243 $843 $10 $89 $1,184 $979 $385 $91 $45 $1,500
19 Total Operating Expenses and Equipment $2,154 $1,996 $704 $2,053 $6,907 $2,652 $1,356 $849 $2,643 $7,500
20 TRAVEL (SUB5) $124 $283 $108 $386 $901 $231 $190 $86 $455 $962
21 FINANCIAL AID (SCHL) $249 $52 $111 $412 $93 $93 $0 $163 $349
22 OTHER UNALLOCATED (SUB8, SUB7, SBMC) $105 $105 $0 $0 $69 $69
23 TOTAL EXPENDITURES $44,278 $3,625 $1,250 $4,723 $53,876 $49,034 $2,820 $2,198 $5,419 $59,471
24 ANNUAL NET OPERATING POSITION [Surplus (+)/Deficit (-)] $2,169 -$515 $64 -$644 $1,075 $1,145 $1,117 $216 -$2,170 $308
Explanatory Notes:
Regular faculty category includes temporary instructors ($2.3M in 13-14). 13-14 income and 14-15 carryforward has been reduced by $1.0M for COSMOS on-line tuition payments that were transferred to other UC campuses
in July 2014. MPS had $7.0M in COBL obligations at YE13-14 primarily for faculty startup and retention funding commitments. Projected $2.0M deficit in 14-15 Other Funds operating position reflects the utilization of
carryforward balances.
Division of Mathematical and Physical Sciences
Sources & Uses All Funds, Excluding Contracts & Grants and Agency Accounts(Dollars in thousands)
2013-14 Actual 2014-15 Budget Estimate
Iterations to reconcile during budget setting process
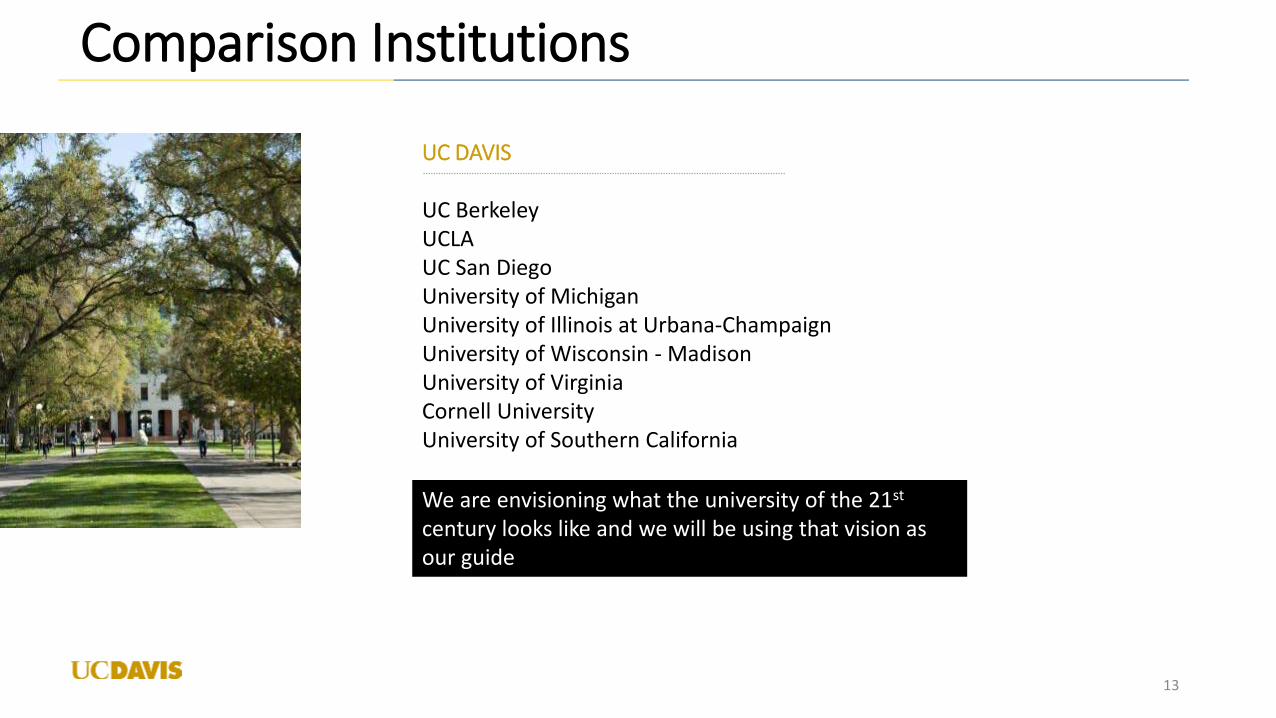
Comparison Institutions
13
UC DAVIS
UC BerkeleyUCLAUC San DiegoUniversity of MichiganUniversity of Illinois at Urbana-ChampaignUniversity of Wisconsin - MadisonUniversity of VirginiaCornell UniversityUniversity of Southern California
We are envisioning what the university of the 21st
century looks like and we will be using that vision as our guide
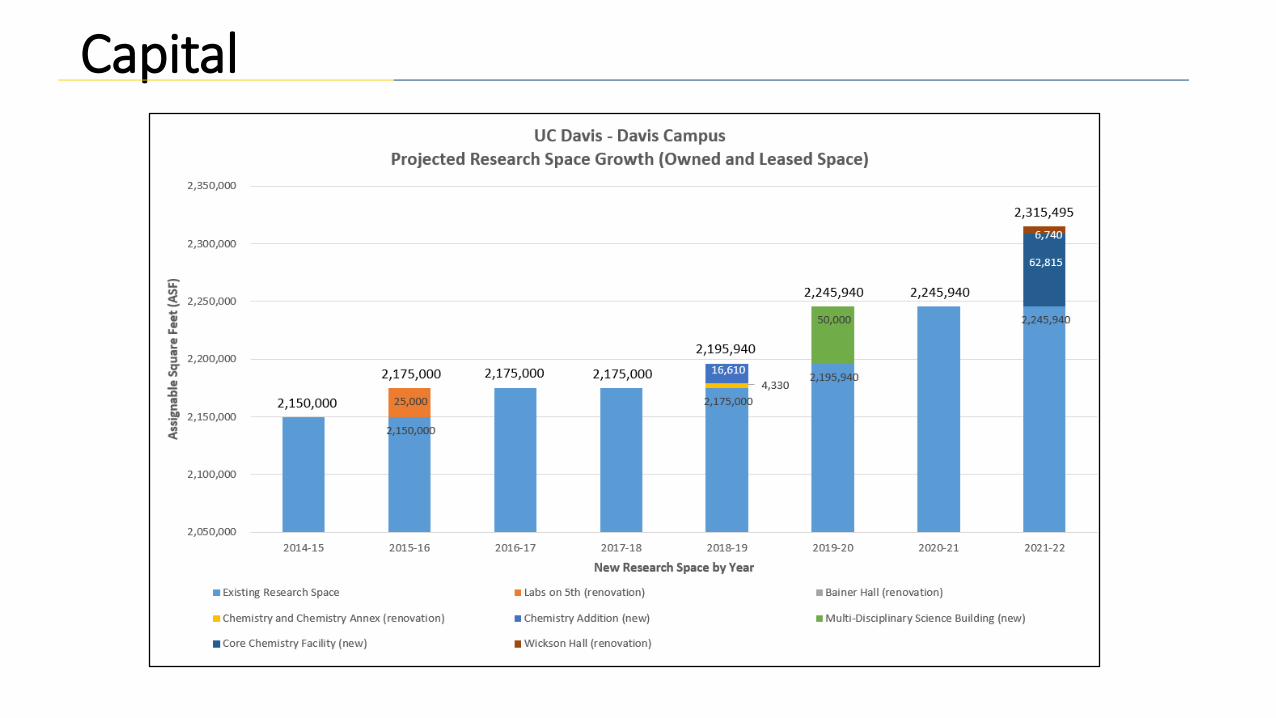
Capital
14

A Future Profile - Capital
15
• Operating strength enables capital strength
• Affordability dimensions: build, operate, & maintain
• Long range financial planning & short term implementations
• Systematically solving the deferred maintenance problem
• Leverage multiple funding sources

2014-24 Capital Financial Plan - $2.9B
$303,660
$1,634,137
$605,613
$40,723 $362,667
Project Goal
Regulatory Student Success Student Experience
Research/Initiatives Support and Stewardship
$867,750
$190,067 $1,370,664
$457,558
$45,000
Type of Project
New Construction and Renovation Infrastructure
New Construction Renovation
Deferred Maintenance Program
Capital
Priorities:Regulatory (Seismic)Critical InfrastructureCapacity (e.g. 2020)…etc…
Determine appropriate proportions
Deferred maintenance handled parallel
Capital
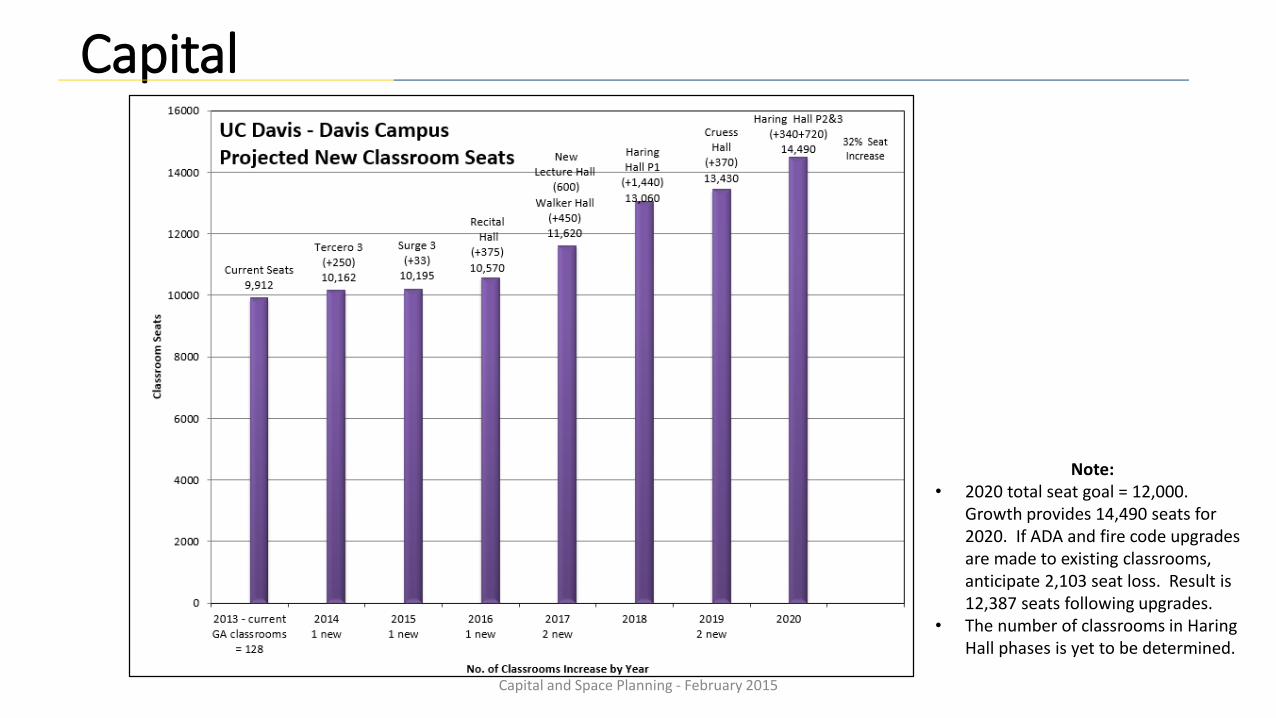
Capital and Space Planning - February 2015
Note:• 2020 total seat goal = 12,000.
Growth provides 14,490 seats for 2020. If ADA and fire code upgrades are made to existing classrooms, anticipate 2,103 seat loss. Result is 12,387 seats following upgrades.
• The number of classrooms in Haring Hall phases is yet to be determined.
Capital

Deferred Maintenance Needs - $1.3B
$141,222
$67,998
$68,062
$39,248
$34,590
Facilities Immediate Needs -$42M Mechan
ical
$16,862
$8,119
$8,127
$4,686
$4,130
Maintenance/Repair - $351M
Mechanical
Electrical
Plumbing/Steam
Structural
$396,272
$190,804
$190,984
$110,131
$97,062
Modernization/Renewal -$985M Mechanical
Electrical
Plumbing/Steam
Structural
Roofing
Deferred Maintenance Composition
• Institute new policies whereby deferred maintenance doesn’t get worse with new projects (FFEs for DM required).
• Develop a prioritized list of items over a 20 year time frame• Resolve via: Replacement, Discontinued Use, Remediation

Multi-pronged approach to DM reduction
• The core deferred maintenance balance will be mitigated by a combination of items:
• Replacement Facilities• Renovations• Discontinuance• Acceptable State Continuance• DM investments
New Construction
StopUsing
GoodEnough
Renovations
Total Deferred Maintenance
$1.3B
$X
$Y$W
$Z
Priorities
23

Priorities
24
Resource Stewardship
Planning & Execution
Delight Our Customers
We must delight our customers in every aspect
of what we do.
Thoughtful planning and relentless execution
becomes our reputational core.
We will use our scarce resources in a thoughtful,
optimal manner, being ever aware of scarcity of
resources and the need to be financially healthy.
Develop & Inspire Our Team
Together we will reach the next level of
performance while supporting, developing, &
Caring for our team-mates.

A Key HR Focus:
25
Develop & Inspire Our Team
Together we will reach the next level of
performance while supporting, developing, &
Caring for our team-mates.
Performance management Stay the course on PfR rollout, educate & assist supervisors, set clear cascaded
goals, focus on results. Manage expectations. Get to qualified “Yes”. Change management:
Are we doing a good job of defining the burning platform Support
What are the greatest needs of the organization? Are we prepared to train and equip our leaders and team members?
Be sensitive to workload, capacity, backlog. Create capacity and help people find smart ways to stop doing things without compromising customer service.
Development Providing the tools, training, creating time, etc. Encourage and support a continual learning environment.
Care (winning their hearts) How we go about engaging our workforce. Characteristics such as: transparency,
clarity in expectations, excellence in communication, Community Principles. Even when it’s a tough message.
See and care for the person.

Structure
26
VC-CFO Senior Leadership Team
(Comprised of Direct Reports)
VC-CFO Expanded Leadership Team (~100)
(Included Department Heads)
VC-CFO Council(Compilation of key leaders both inside and outside the VC-CFO)
Assistant Vice Chancellors & Assistant
Deans(Dotted Line Reports to the VC-CFO)
Leads the VC-CFO function on strategic and operational (Job
#1) topics.
The linkage with Executive Leadership (At UCD and UCOP).
Accountable for attaining excellence across VC-CFO.
Ambassadors for creating and cascading a vision, key
priorities, and operational excellence.
We will invest time and energy to mentor and develop this group of people—the core leadership team of VC-CFO
Eyes and ears to report back on how things are going, monitors of progress, morale, successes,
cautions, opportunists.
Focused on key priorities—The imperatives which will allow us
to move to the next level.
This is the group of our most talented senior leaders, those with great potential, people who have a reputation for getting it done in the right
way—change agents.
Liaisons to the Schools/Colleges and Administrative Units.
Those close to the heart-beat of the Schools/Colleges/Units.
Able to influence Deans, Department Chairs, Faculty,
Vice Chancellors.
The accountability drivers across the university—a critical mechanism to attain financial
health.

VC-CFO Administrative Initiatives
• Business Management and Analysis Group
• Telecommuting
• Employee Performance Management (EPAR)
• CFO Internship program
27

Business Management and Analysis Group
Business Management & Analysis Group (BMAG) is the internal support group that provides consistent high level services to support both VC-CFO and campus initiatives.
Arriving soon:
http://bmag.ucdavis.edu
New Services-
• Project Management• Tools, Training and Services
Rebranded Services –
• Human Resources consulting
• IT desktop support and system administration
• Targeted financial administration & analytical support
28

Telecommuting Initiative
• Building on campus tools & piloting new focus for campus
• Creating a 2015 spring / summer cohort goal of 24 employees• Supervisors supported with monthly meetings
• 6 month trial period
• Long term this initiative creates capacity for additional staff workstations by having shared workspace for employees
• VC-CFO program specifics coming soon.
29
Creating an environment within VC-CFO that robustly adopts and supports telecommuting for increased employee engagement.

Employee Performance Management
VC-CFO will be providing unit wide guidelines by March 25th
• Rating distributions / calibration
• Structure of the Departmental Approval Chain
• Development and quarterly review of employee goals• Specific
• Measureable
• Attainable
• Results oriented
• Time framed
30

CFO Internship Program
Creates a highly competitive opportunity for administrative & business minded students to work on meaningful high-level projects while receiving 1:1 mentoring from campus leaders.
• Generated student excitement at the Spring 2015 internship fair
• Program launched for spring quarter 2015 with ~ 5 positions
• Fall 2015 recruitment will occur during spring quarter that will grow program cohort.
31
32