Embed Size (px)
Citation preview
FINANCIAL STATEMENT
GROUP 1- CLASS 1- FINAL PRESENTATION
NGUYEN HOANG HUNG – 295907 ( LEADER)
NGUYEN TRIEU PHUC HAI- 295902
NGUYEN THANH BINH- 295899
LE NHAT HUY- 295896
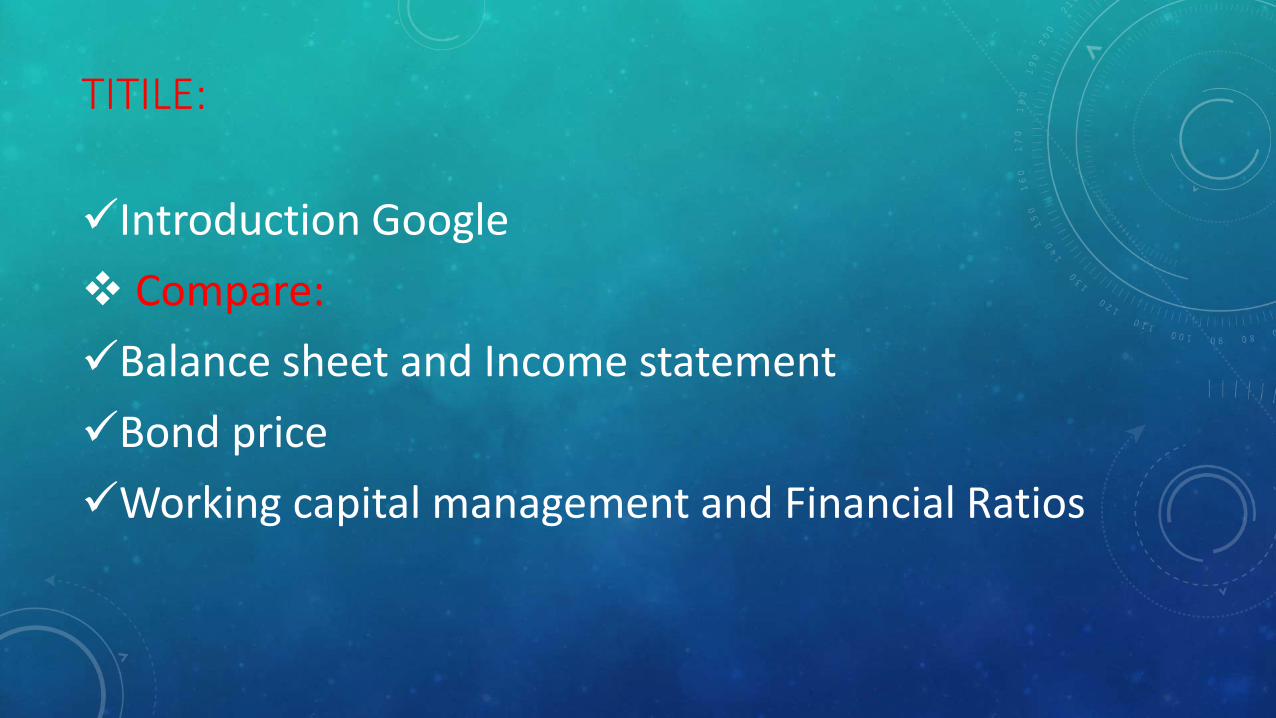
TITILE:
Introduction Google
Compare:
Balance sheet and Income statement
Bond price
Working capital management and Financial Ratios
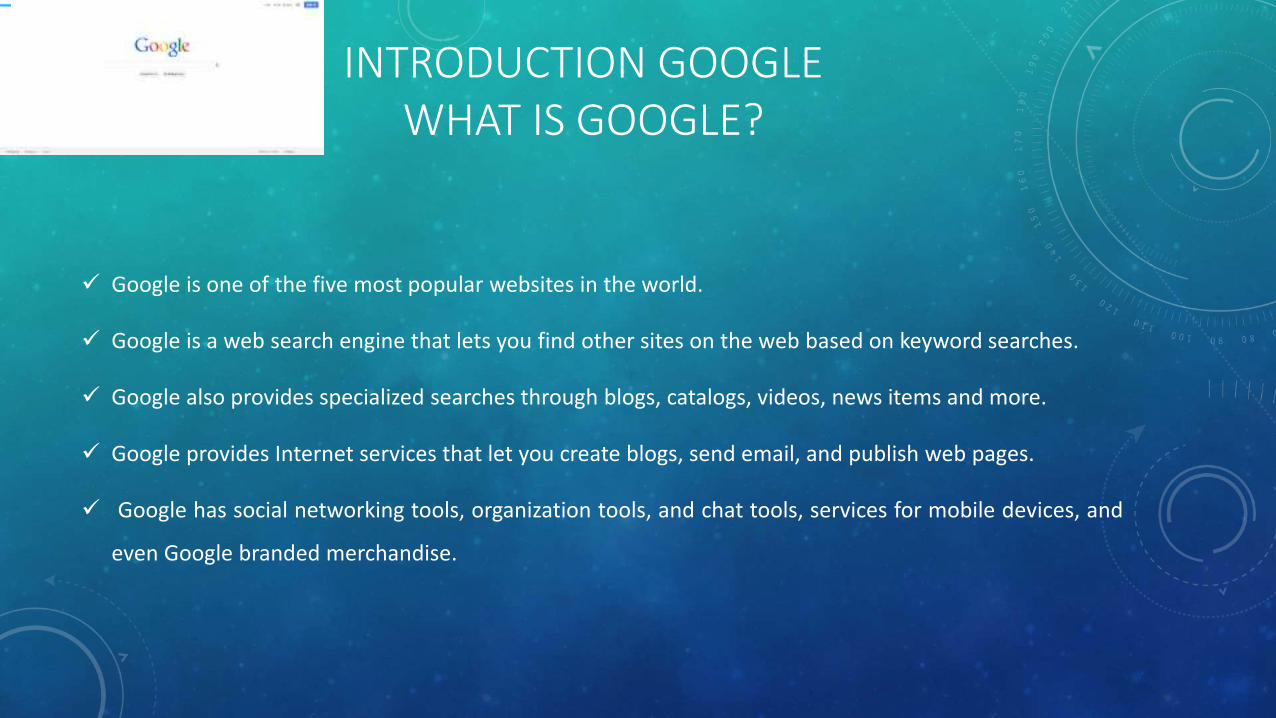
INTRODUCTION GOOGLEWHAT IS GOOGLE?
Google is one of the five most popular websites in the world.
Google is a web search engine that lets you find other sites on the web based on keyword searches.
Google also provides specialized searches through blogs, catalogs, videos, news items and more.
Google provides Internet services that let you create blogs, send email, and publish web pages.
Google has social networking tools, organization tools, and chat tools, services for mobile devices, and
even Google branded merchandise.
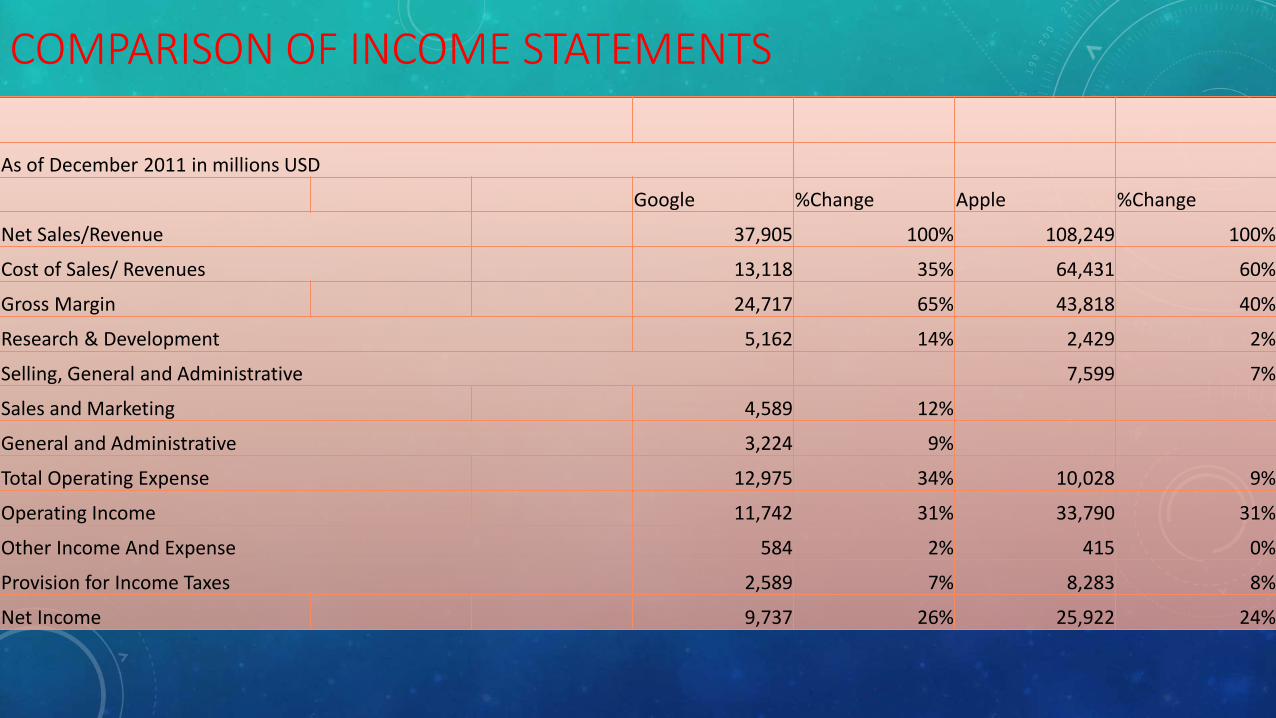
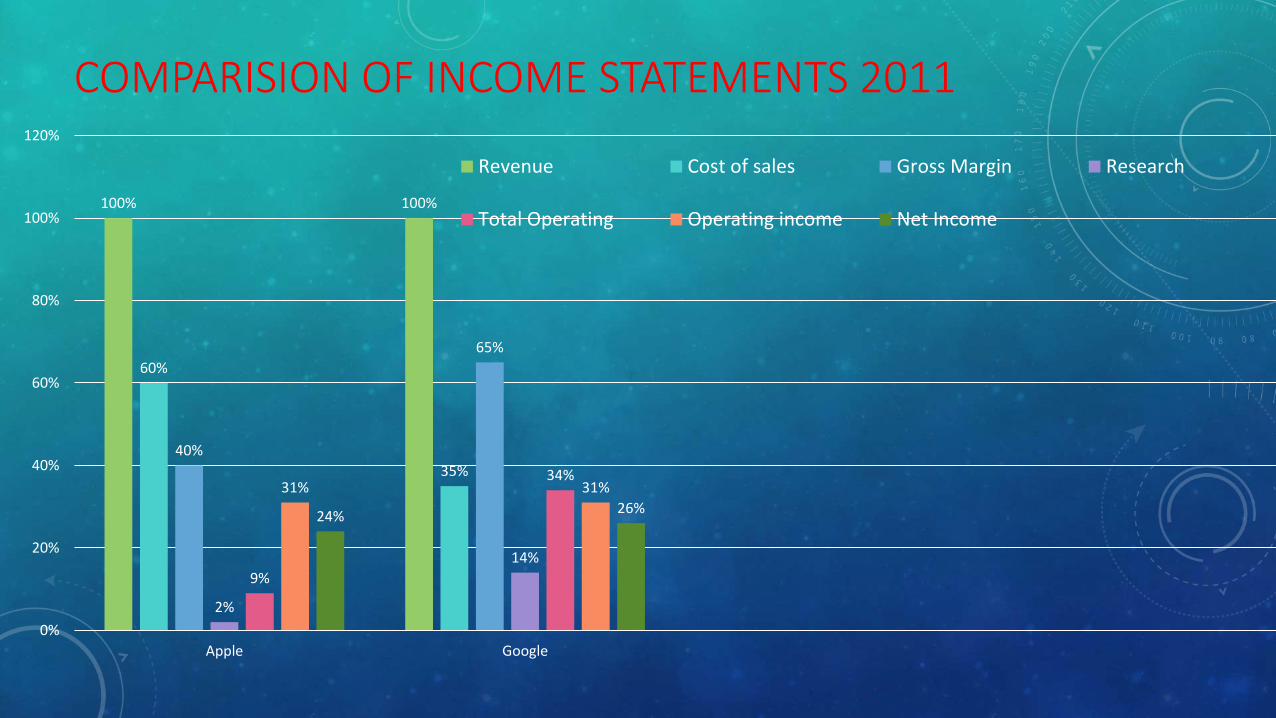
COMPARISON OF INCOME STATEMENTS
As of December 2011 in millions USD
Google %Change Apple %Change
Net Sales/Revenue 37,905 100% 108,249 100%
Cost of Sales/ Revenues 13,118 35% 64,431 60%
Gross Margin 24,717 65% 43,818 40%
Research & Development 5,162 14% 2,429 2%
Selling, General and Administrative 7,599 7%
Sales and Marketing 4,589 12%
General and Administrative 3,224 9%
Total Operating Expense 12,975 34% 10,028 9%
Operating Income 11,742 31% 33,790 31%
Other Income And Expense 584 2% 415 0%
Provision for Income Taxes 2,589 7% 8,283 8%
Net Income 9,737 26% 25,922 24%
COMPARISION OF INCOME STATEMENTS 2011
100% 100%
60%
35%
40%
65%
2%
14%
9%
34%31% 31%
24%26%
0%
20%
40%
60%
80%
100%
120%
Apple Google
Revenue Cost of sales Gross Margin Research
Total Operating Operating income Net Income
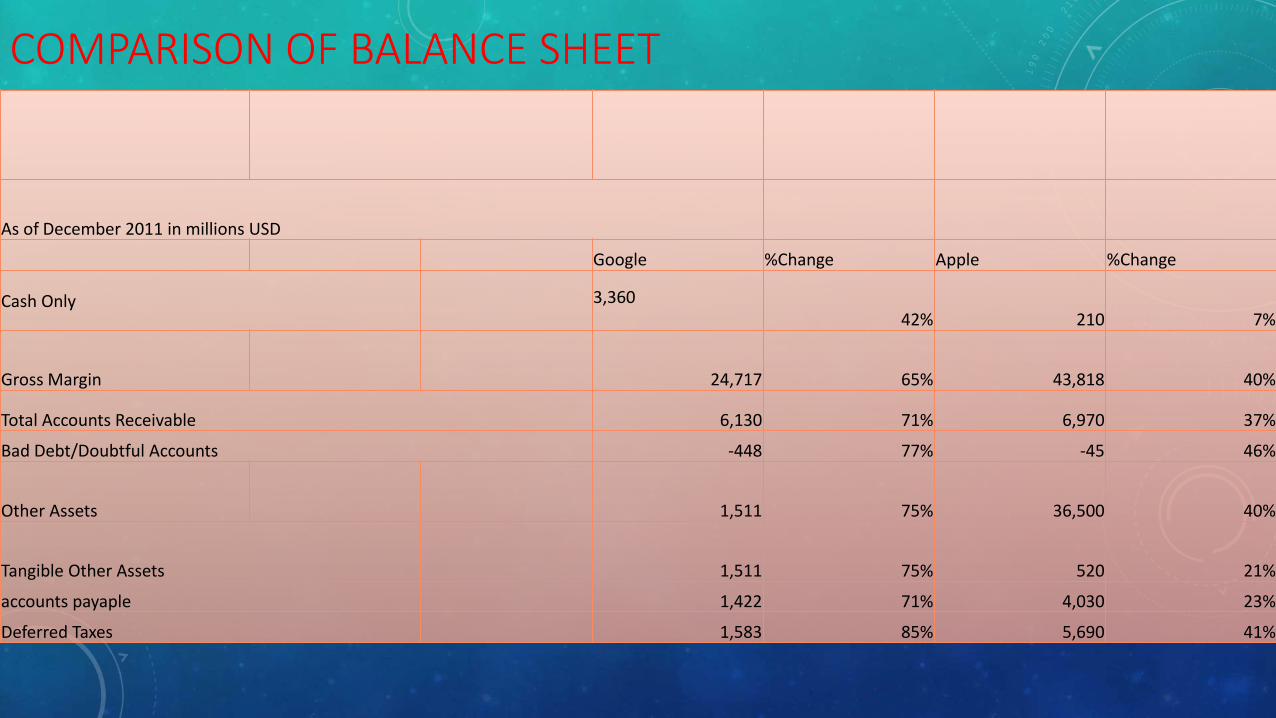
COMPARISON OF BALANCE SHEET
As of December 2011 in millions USD
Google %Change Apple %Change
Cash Only 3,36042% 210 7%
Gross Margin 24,717 65% 43,818 40%
Total Accounts Receivable 6,130 71% 6,970 37%
Bad Debt/Doubtful Accounts -448 77% -45 46%
Other Assets 1,511 75% 36,500 40%
Tangible Other Assets 1,511 75% 520 21%
accounts payaple 1,422 71% 4,030 23%
Deferred Taxes 1,583 85% 5,690 41%

COMPARISON OF BALANCE SHEET
DECEMBER 2011 IN MILLIONS USD
42%
7%
65%
40%
71%
37%
77%
46%
75%
40%
GOOGLE APPLE
Cash only Gross Margin Total Accounts Receivable Bad Debt Other Assets

BOND PRICE
Google Appleprice 103.3 100
coupon (%) 2.13% 0.45%maturity date 5/19/2016 5/3/2016
yield to maturity 0.209 0.44
current yeild (%) 1.996Issuer rating on issue date AA AA
coupon payment equency 2 time(s) per year 2 time(s) per yearFirst coupon date 1/19/2011Type Corporate CorporateCallable No No
BOND PRICE
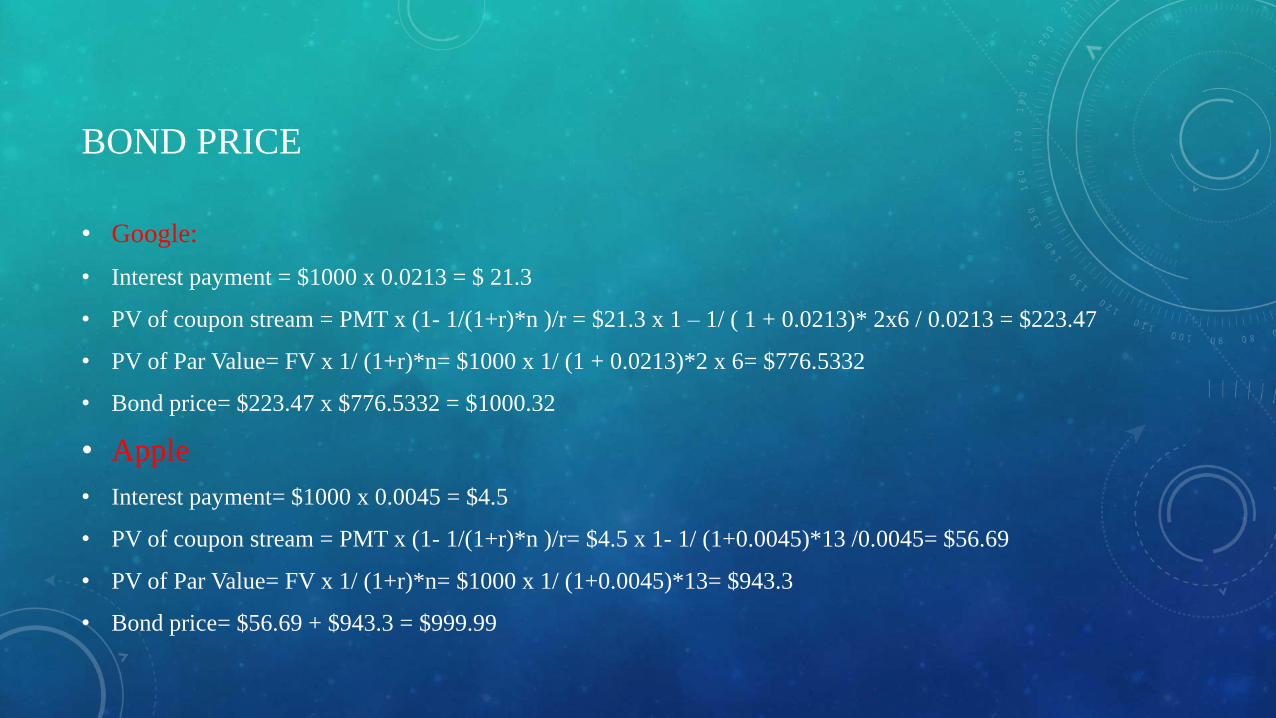
• Google:
• Interest payment = $1000 x 0.0213 = $ 21.3
• PV of coupon stream = PMT x (1- 1/(1+r)*n )/r = $21.3 x 1 – 1/ ( 1 + 0.0213)* 2x6 / 0.0213 = $223.47
• PV of Par Value= FV x 1/ (1+r)*n= $1000 x 1/ (1 + 0.0213)*2 x 6= $776.5332
• Bond price= $223.47 x $776.5332 = $1000.32
• Apple
• Interest payment= $1000 x 0.0045 = $4.5
• PV of coupon stream = PMT x (1- 1/(1+r)*n )/r= $4.5 x 1- 1/ (1+0.0045)*13 /0.0045= $56.69
• PV of Par Value= FV x 1/ (1+r)*n= $1000 x 1/ (1+0.0045)*13= $943.3
• Bond price= $56.69 + $943.3 = $999.99
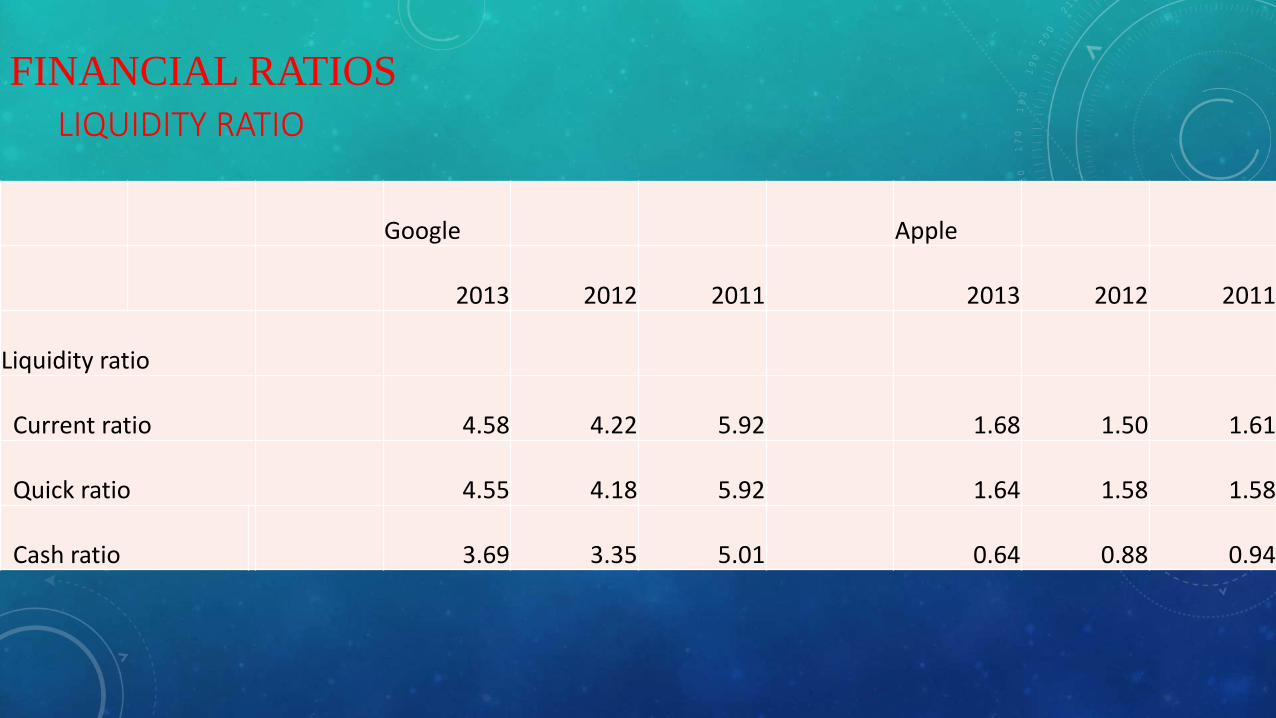
FINANCIAL RATIOS
LIQUIDITY RATIO
Google Apple
2013 2012 2011 2013 2012 2011
Liquidity ratio
Current ratio 4.58 4.22 5.92 1.68 1.50 1.61
Quick ratio 4.55 4.18 5.92 1.64 1.58 1.58
Cash ratio 3.69 3.35 5.01 0.64 0.88 0.94
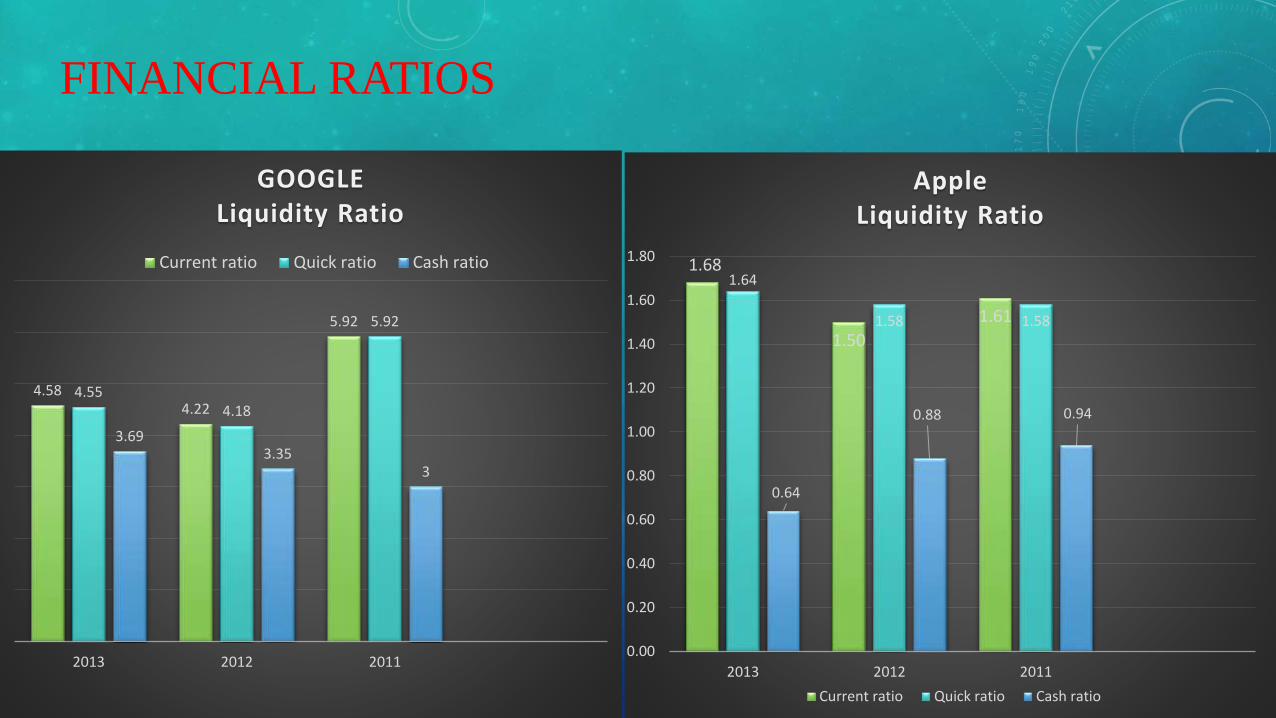
FINANCIAL RATIOS
4.584.22
5.92
4.554.18
5.92
3.693.35
3
2013 2012 2011
GOOGLELiquidity Ratio
Current ratio Quick ratio Cash ratio 1.68
1.50
1.61
1.64
1.58 1.58
0.64
0.88 0.94
0.00
0.20
0.40
0.60
0.80
1.00
1.20
1.40
1.60
1.80
2013 2012 2011
AppleLiquidity Ratio
Current ratio Quick ratio Cash ratio
FINANCIAL RATIOS
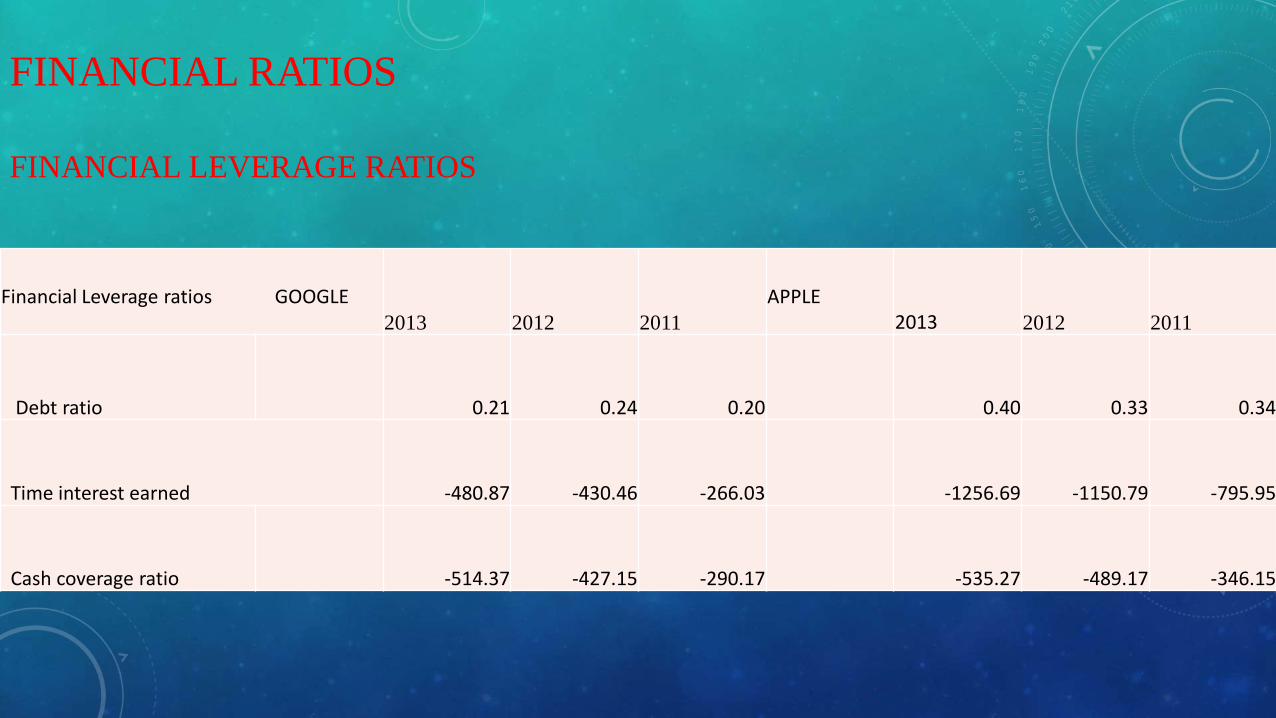
FINANCIAL LEVERAGE RATIOS
Financial Leverage ratios GOOGLE2013 2012 2011
APPLE2013 2012 2011
Debt ratio 0.21 0.24 0.20 0.40 0.33 0.34
Time interest earned -480.87 -430.46 -266.03 -1256.69 -1150.79 -795.95
Cash coverage ratio -514.37 -427.15 -290.17 -535.27 -489.17 -346.15
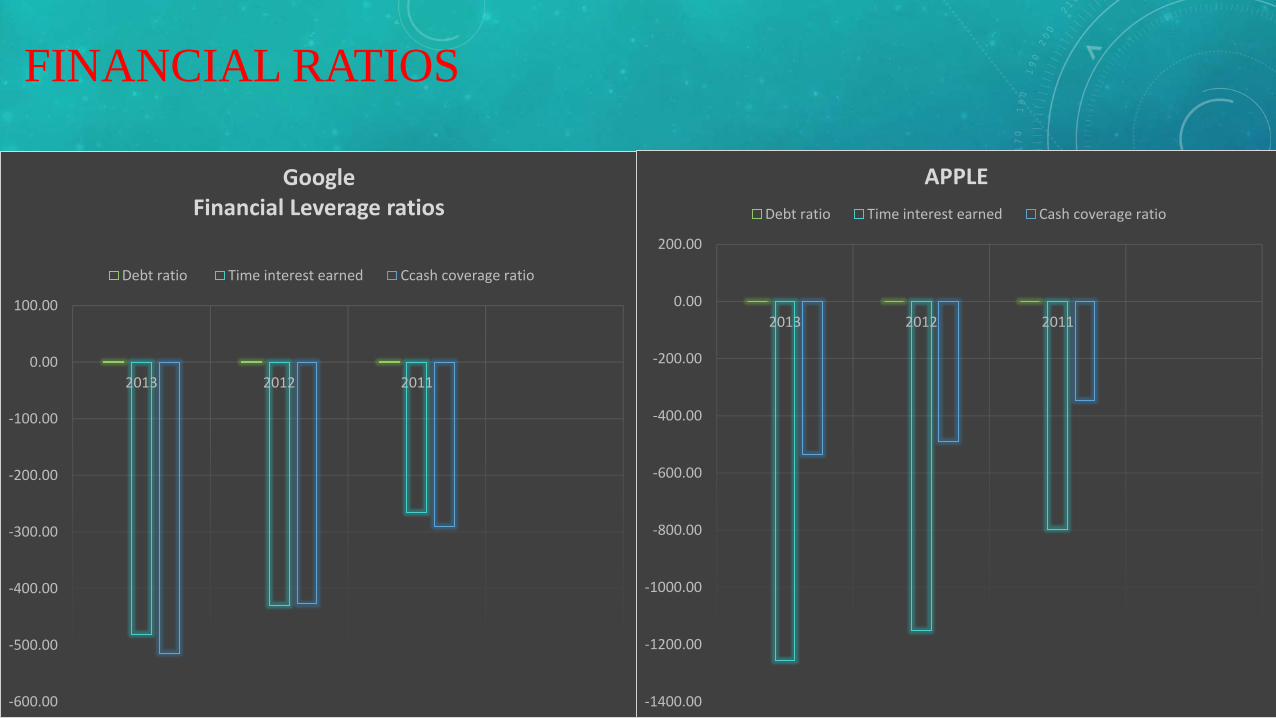
FINANCIAL RATIOS
-600.00
-500.00
-400.00
-300.00
-200.00
-100.00
0.00
100.00
2013 2012 2011
GoogleFinancial Leverage ratios
Debt ratio Time interest earned Ccash coverage ratio
-1400.00
-1200.00
-1000.00
-800.00
-600.00
-400.00
-200.00
0.00
200.00
2013 2012 2011
APPLE
Debt ratio Time interest earned Cash coverage ratio
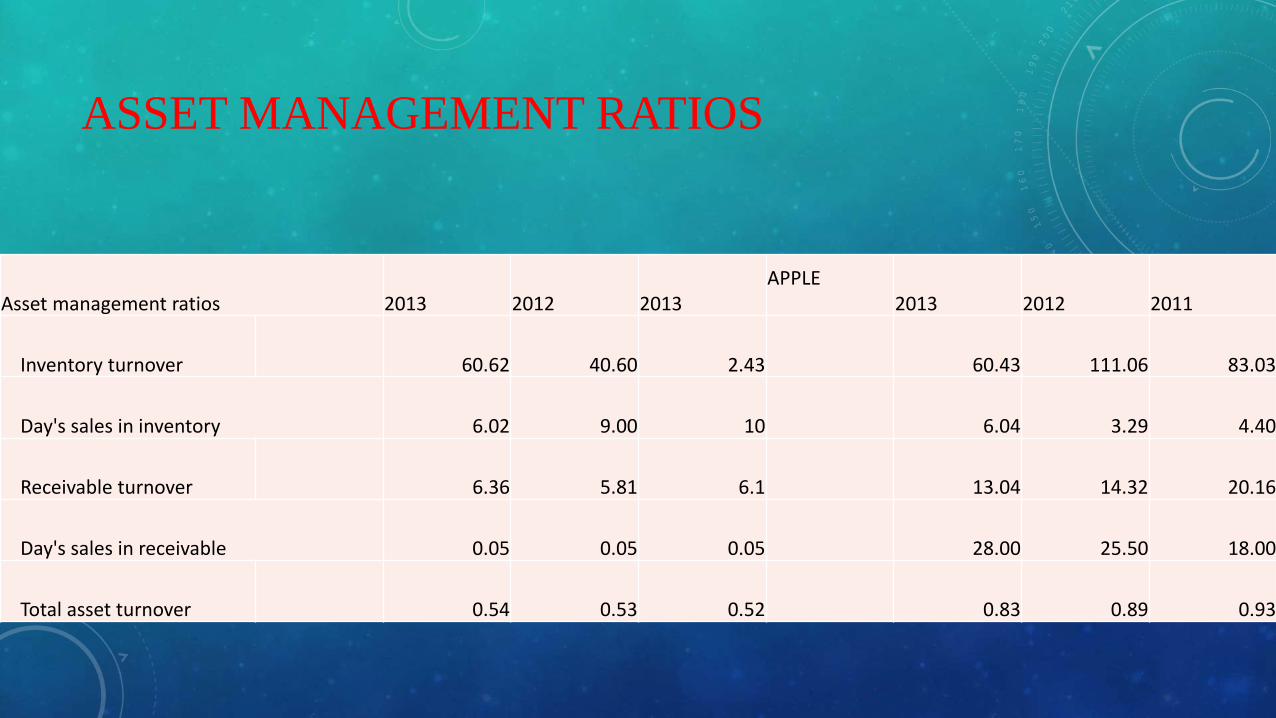
ASSET MANAGEMENT RATIOS
Asset management ratios 2013 2012 2013APPLE
2013 2012 2011
Inventory turnover 60.62 40.60 2.43 60.43 111.06 83.03
Day's sales in inventory 6.02 9.00 10 6.04 3.29 4.40
Receivable turnover 6.36 5.81 6.1 13.04 14.32 20.16
Day's sales in receivable 0.05 0.05 0.05 28.00 25.50 18.00
Total asset turnover 0.54 0.53 0.52 0.83 0.89 0.93
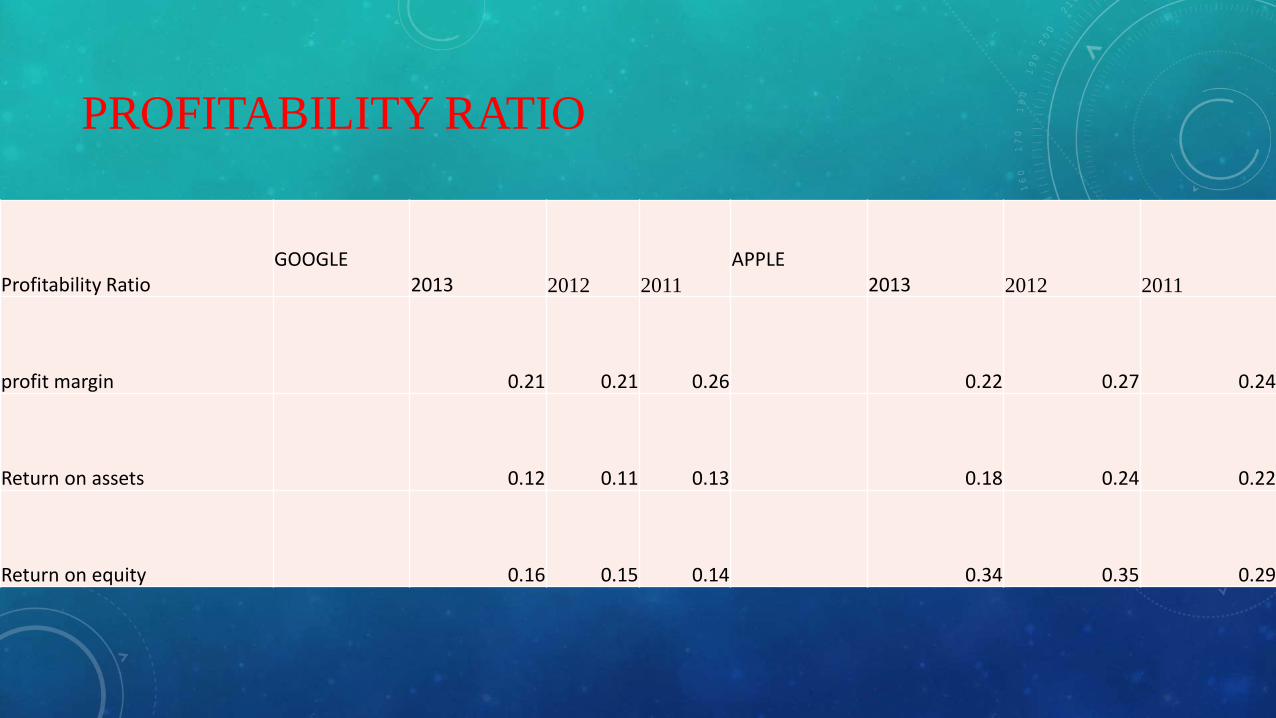
PROFITABILITY RATIO
Profitability RatioGOOGLE
2013 2012 2011
APPLE2013 2012 2011
profit margin 0.21 0.21 0.26 0.22 0.27 0.24
Return on assets 0.12 0.11 0.13 0.18 0.24 0.22
Return on equity 0.16 0.15 0.14 0.34 0.35 0.29
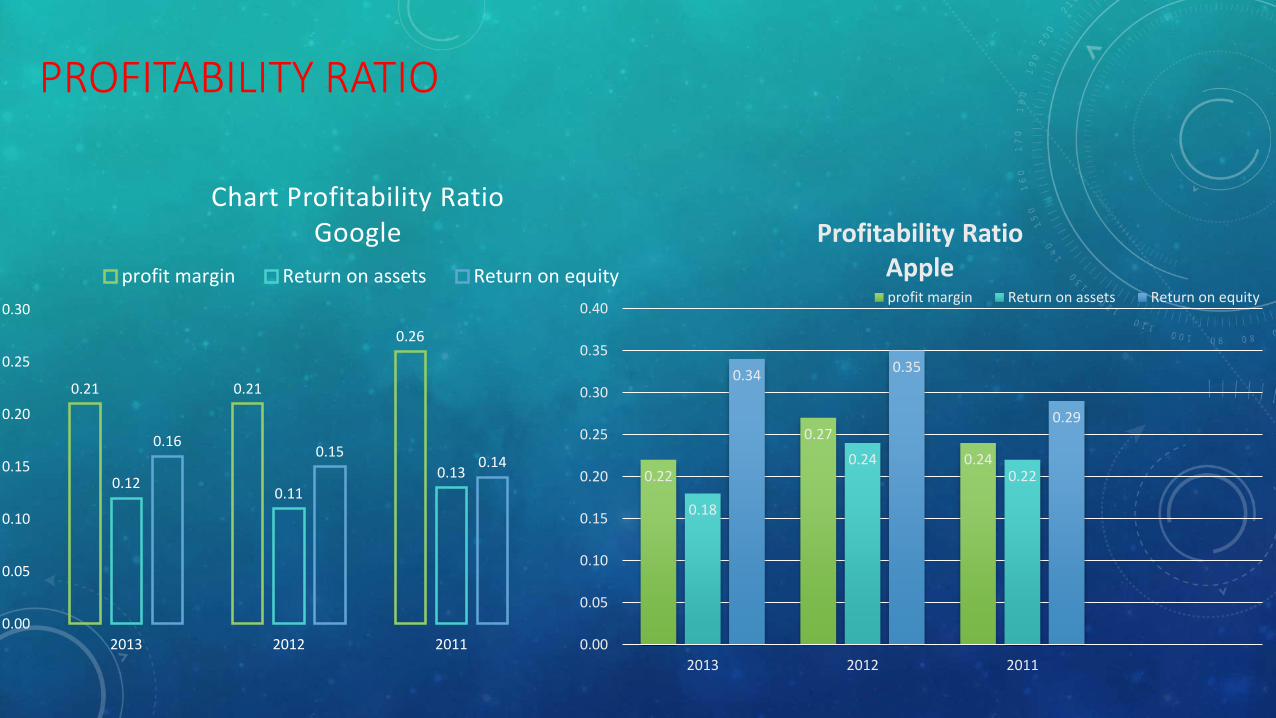
PROFITABILITY RATIO
0.21 0.21
0.26
0.120.11
0.13
0.160.15
0.14
0.00
0.05
0.10
0.15
0.20
0.25
0.30
2013 2012 2011
Chart Profitability RatioGoogle
profit margin Return on assets Return on equity
0.22
0.27
0.24
0.18
0.240.22
0.340.35
0.29
0.00
0.05
0.10
0.15
0.20
0.25
0.30
0.35
0.40
2013 2012 2011
Profitability RatioAppleprofit margin Return on assets Return on equity

THANK FOR LISTENING