Embed Size (px)
Citation preview
ACCT 100
Chapter 14
Financial Statement Analysis
Financial Statement Analysis 2
Objectives of the Chapter
1. Discuss the need for comparative analysis.
2. Identify and apply the tools of financial statement analysis.
3. Understand how the unusual and infrequent events are presented in the financial statements.
4. Understand the quality of earnings.
The Need for Comparative Financial Statement (F/S) Analysis Investors have interests in the following
three characteristics of companies:
Liquidity: a company’s ability to pay current liabilities.
Profitability: the operating success of a company for a period of time.
Solvency: the long-term solvency of a company.
Financial Statement Analysis 3
Investors and F/S Analysis
Short term creditors are mostly interested in the liquidity.
Long-term creditors (i.e., bondholders) and stockholders are more interested in profitability and solvency than in liquidity.
Ratio analysis can provide liquidity, profitability and solvency information of firms.
Financial Statement Analysis 4
Ratio Analysis
For example, the ratio of current assets over current liabilities (i.e., the current ratio) measure the ability of a firm to pay current liabilities.
The ratio of total liabilities over total assets (i.e., debt ratio) measures the solvency and the ratio of net income over net sales (i.e., profit margin) measure the profitability.
Financial Statement Analysis 5
Comparative Ratio Analysis
To assess the adequacy of these financial ratios, the following comparisons can be performed:
1)Intra-company comparison: the ratios are compared with those of previous years’ to assess whether these ratios are improved or deteriorated.
2)Industry comparison: the ratios are compared with the industry average. Dun & Bradstreet, Moody’s and Standard & Poor’s publish such averages.
Financial Statement Analysis 6
Comparative Ratio Analysis (contd.)
3) Intercompany comparison: to compare the ratios with those of one or more competitors. The intercompany comparison is to determine the company’s competitive position.
Ratio analysis is used in all three comparisons.
Financial Statement Analysis 7
Other Tools for Comparative Financial Statement Analysis
In addition to ratio analysis , two other tools are also available for statement analysis:
1)Horizontal analysis: study the percentage changes of items (accounts) in comparative financial statements.
This analysis emphasizes on the changes of one single item over time.
This tool is primary used in intra-company comparison.
Financial Statement Analysis 8
Other Tools for Comparative Financial Statement Analysis (contd.)
2) Vertical analysis: this analysis studies the relationship of one single item with all other items in the statement.
This analysis is to express each item as a percent of a base item (i.e., net sales of an income statement or total assets of a balance sheet).
Vertical analysis is used in both intra and inter-company comparison.
Financial Statement Analysis 9
Comparative F/S Analysis
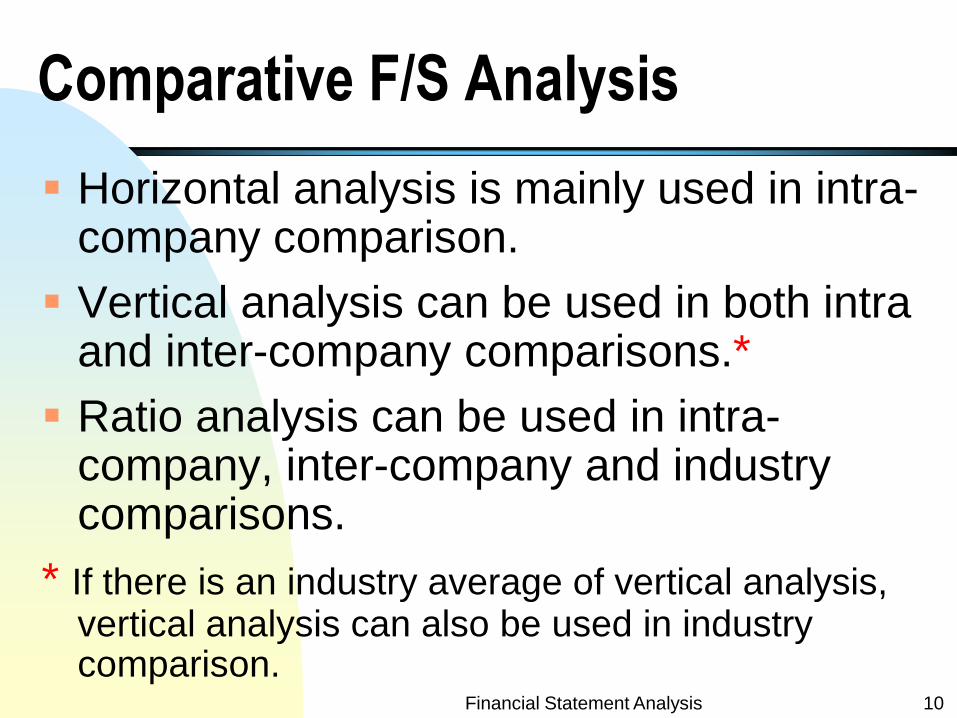
Horizontal analysis is mainly used in intra-company comparison.
Vertical analysis can be used in both intra and inter-company comparisons.*
Ratio analysis can be used in intra-company, inter-company and industry comparisons.
* If there is an industry average of vertical analysis, vertical analysis can also be used in industry comparison.
Financial Statement Analysis 10
Comparative Analysis –A Note
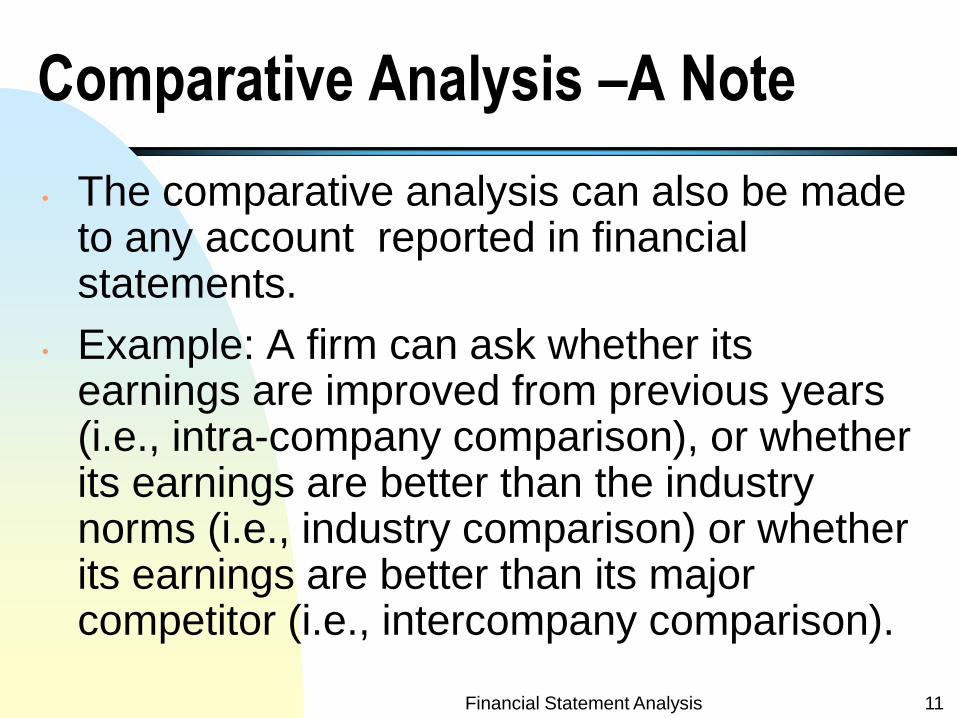
• The comparative analysis can also be made to any account reported in financial statements.
• Example: A firm can ask whether its earnings are improved from previous years (i.e., intra-company comparison), or whether its earnings are better than the industry norms (i.e., industry comparison) or whether its earnings are better than its major competitor (i.e., intercompany comparison).
Financial Statement Analysis 11
Financial Statement Analysis 12
Horizontal , Vertical and Ratio Analyses
Horizontal Analysis: the following slide
is an example of horizontal analysis
used in intra-company comparison:
Financial Statement Analysis 13
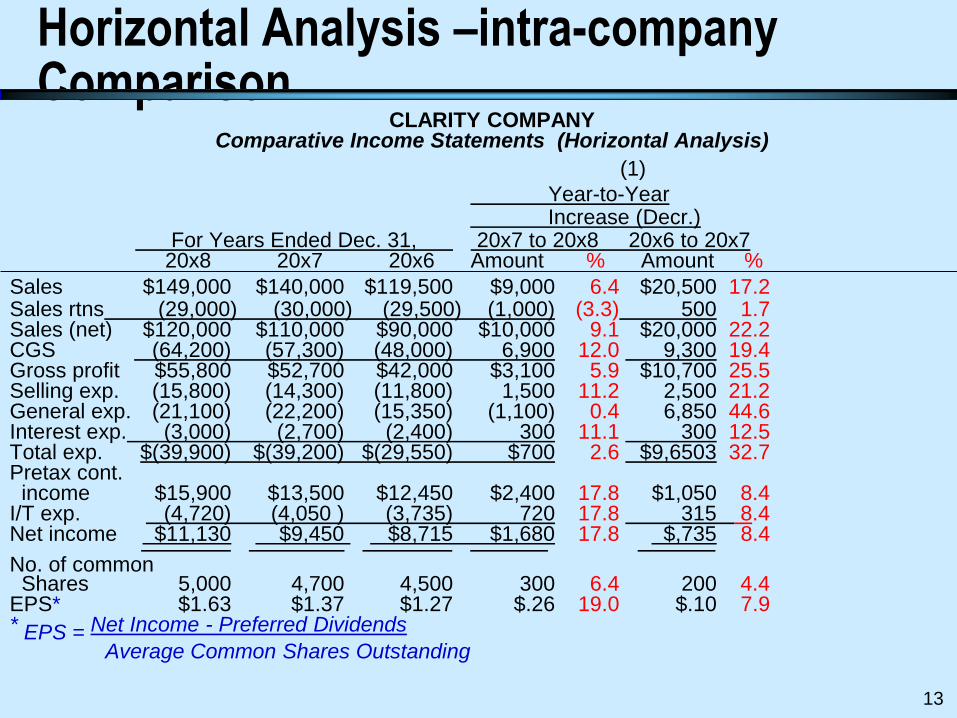
Horizontal Analysis –intra-company Comparison
CLARITY COMPANY Comparative Income Statements (Horizontal Analysis)
(1)
Year-to-Year Increase (Decr.) For Years Ended Dec. 31, 20x7 to 20x8 20x6 to 20x7 20x8 20x7 20x6 Amount % Amount %
Sales $149,000 $140,000 $119,500 $9,000 6.4 $20,500 17.2 Sales rtns (29,000) (30,000) (29,500) (1,000) (3.3) 500 1.7 Sales (net) $120,000 $110,000 $90,000 $10,000 9.1 $20,000 22.2 CGS (64,200) (57,300) (48,000) 6,900 12.0 9,300 19.4 Gross profit $55,800 $52,700 $42,000 $3,100 5.9 $10,700 25.5 Selling exp. (15,800) (14,300) (11,800) 1,500 11.2 2,500 21.2 General exp. (21,100) (22,200) (15,350) (1,100) 0.4 6,850 44.6 Interest exp. (3,000) (2,700) (2,400) 300 11.1 300 12.5 Total exp. $(39,900) $(39,200) $(29,550) $700 2.6 $9,6503 32.7 Pretax cont. income $15,900 $13,500 $12,450 $2,400 17.8 $1,050 8.4 I/T exp. (4,720) (4,050 ) (3,735) 720 17.8 315 8.4 Net income $11,130 $9,450 $8,715 $1,680 17.8 $,735 8.4 No. of common Shares 5,000 4,700 4,500 300 6.4 200 4.4 EPS* $1.63 $1.37 $1.27 $.26 19.0 $.10 7.9 * EPS = Net Income - Preferred Dividends
Average Common Shares Outstanding
13
Financial Statement Analysis 14
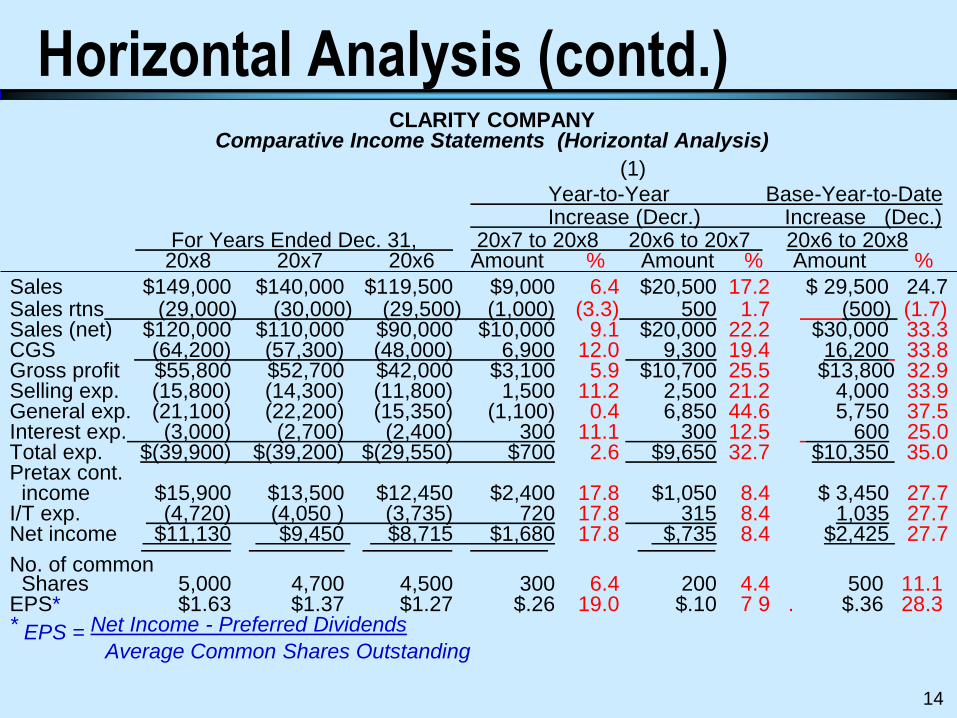
Horizontal Analysis (contd.) CLARITY COMPANY
Comparative Income Statements (Horizontal Analysis)
(1)
Year-to-Year Base-Year-to-Date Increase (Decr.) Increase (Dec.) For Years Ended Dec. 31, 20x7 to 20x8 20x6 to 20x7 20x6 to 20x8 20x8 20x7 20x6 Amount % Amount % Amount %
Sales $149,000 $140,000 $119,500 $9,000 6.4 $20,500 17.2 $ 29,500 24.7 Sales rtns (29,000) (30,000) (29,500) (1,000) (3.3) 500 1.7 (500) (1.7) Sales (net) $120,000 $110,000 $90,000 $10,000 9.1 $20,000 22.2 $30,000 33.3 CGS (64,200) (57,300) (48,000) 6,900 12.0 9,300 19.4 16,200 33.8 Gross profit $55,800 $52,700 $42,000 $3,100 5.9 $10,700 25.5 $13,800 32.9 Selling exp. (15,800) (14,300) (11,800) 1,500 11.2 2,500 21.2 4,000 33.9 General exp. (21,100) (22,200) (15,350) (1,100) 0.4 6,850 44.6 5,750 37.5 Interest exp. (3,000) (2,700) (2,400) 300 11.1 300 12.5 600 25.0 Total exp. $(39,900) $(39,200) $(29,550) $700 2.6 $9,650 32.7 $10,350 35.0 Pretax cont. income $15,900 $13,500 $12,450 $2,400 17.8 $1,050 8.4 $ 3,450 27.7 I/T exp. (4,720) (4,050 ) (3,735) 720 17.8 315 8.4 1,035 27.7 Net income $11,130 $9,450 $8,715 $1,680 17.8 $,735 8.4 $2,425 27.7 No. of common Shares 5,000 4,700 4,500 300 6.4 200 4.4 500 11.1 EPS* $1.63 $1.37 $1.27 $.26 19.0 $.10 7 9 . $.36 28.3 * EPS = Net Income - Preferred Dividends
Average Common Shares Outstanding
14
Financial Statement Analysis 15
Horizontal Analysis (contd.)
Trend percentages are computed by selecting a base year whose amounts are set to equal 100 percent. The amounts of each following year are expressed as a percentage of the base amount.
Example:
Financial Statement Analysis 16
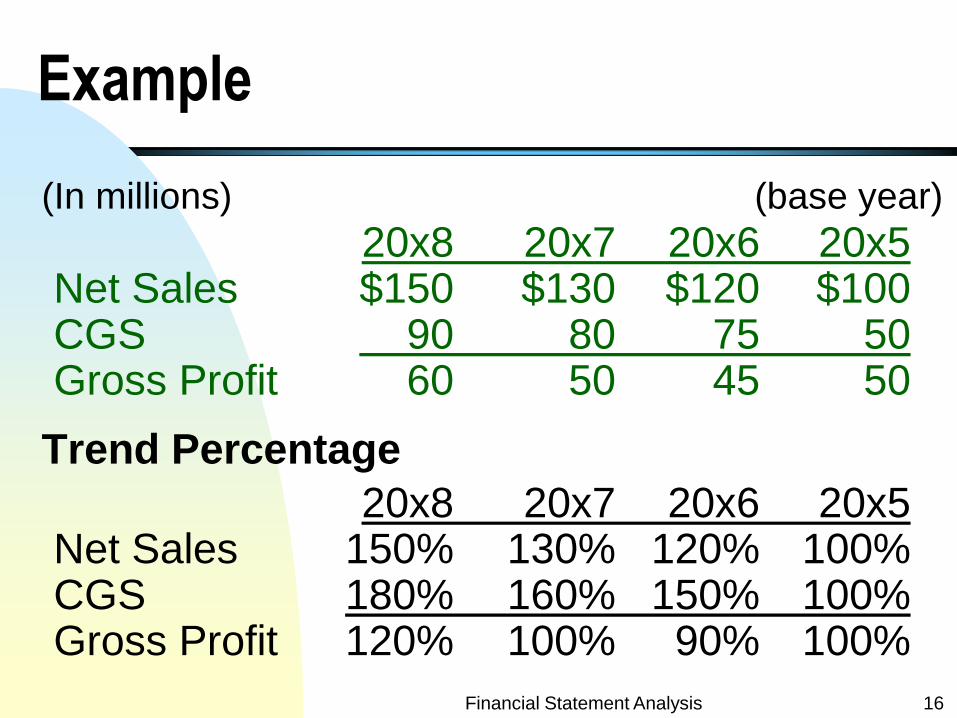
Example
(In millions) (base year)
20x8 20x7 20x6 20x5 Net Sales $150 $130 $120 $100 CGS 90 80 75 50 Gross Profit 60 50 45 50
Trend Percentage
20x8 20x7 20x6 20x5 Net Sales 150% 130% 120% 100% CGS 180% 160% 150% 100% Gross Profit 120% 100% 90% 100%
Financial Statement Analysis 17
Vertical Analysis
This analysis emphasizes on the
relationship of one single item with all
other items on the statement.
The following example is a vertical
analysis used in intra-company
comparison.
Financial Statement Analysis 18
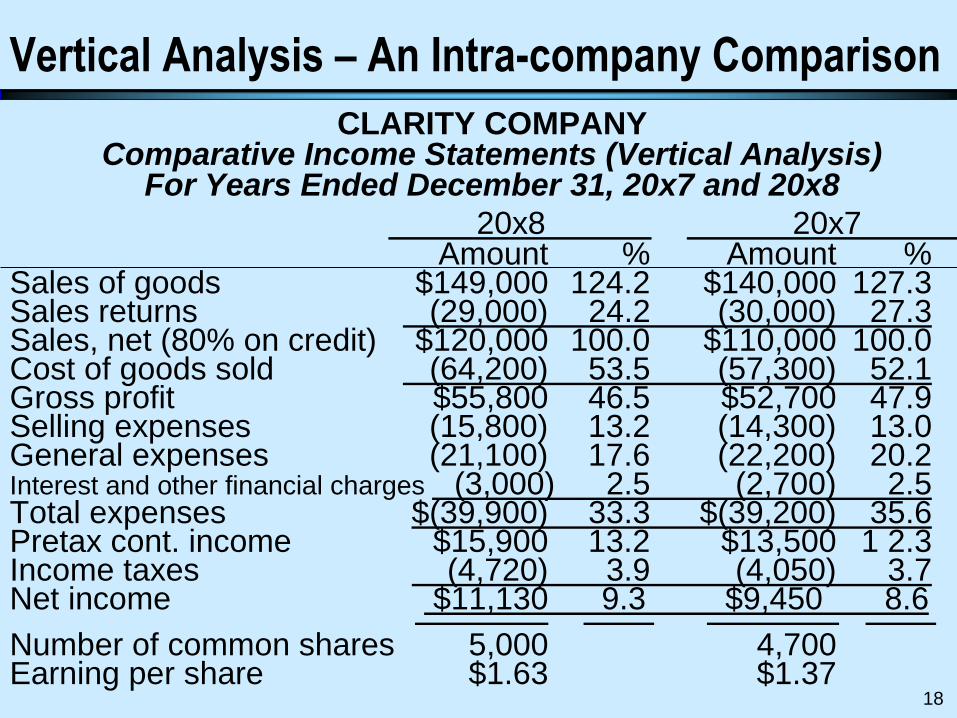
Vertical Analysis – An Intra-company Comparison
CLARITY COMPANY Comparative Income Statements (Vertical Analysis)
For Years Ended December 31, 20x7 and 20x8
20x8 20x7 Amount % Amount % Sales of goods $149,000 124.2 $140,000 127.3 Sales returns (29,000) 24.2 (30,000) 27.3 Sales, net (80% on credit) $120,000 100.0 $110,000 100.0 Cost of goods sold (64,200) 53.5 (57,300) 52.1 Gross profit $55,800 46.5 $52,700 47.9 Selling expenses (15,800) 13.2 (14,300) 13.0 General expenses (21,100) 17.6 (22,200) 20.2 Interest and other financial charges (3,000) 2.5 (2,700) 2.5 Total expenses $(39,900) 33.3 $(39,200) 35.6 Pretax cont. income $15,900 13.2 $13,500 1 2.3 Income taxes (4,720) 3.9 (4,050) 3.7 Net income $11,130 9.3 $9,450 8.6 Number of common shares 5,000 4,700 Earning per share $1.63 $1.37 18
Financial Statement Analysis 19
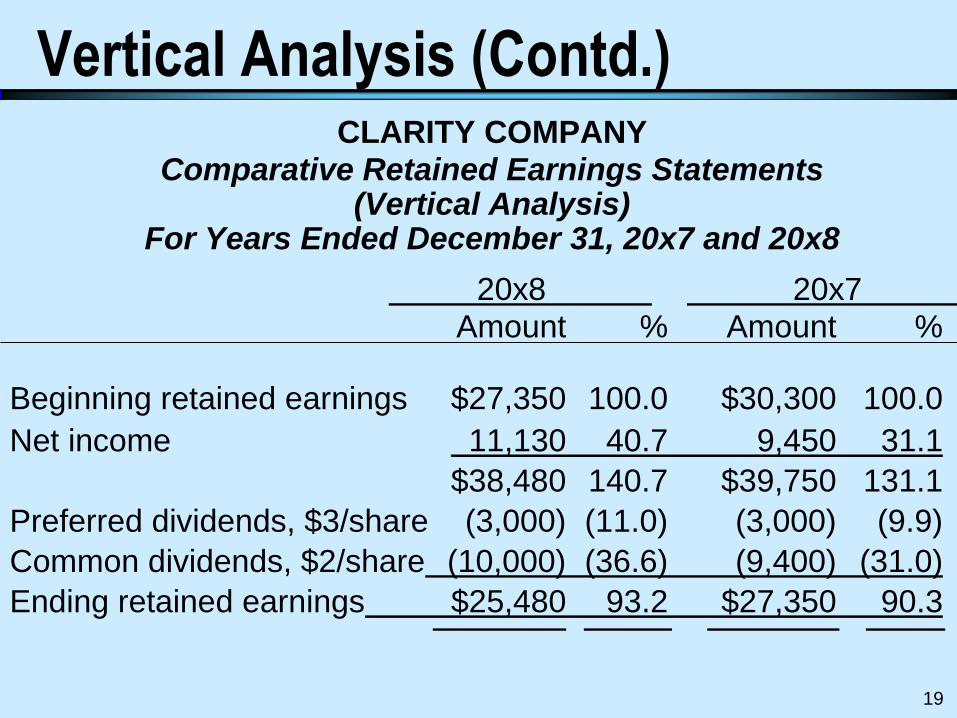
Vertical Analysis (Contd.) CLARITY COMPANY
Comparative Retained Earnings Statements (Vertical Analysis)
For Years Ended December 31, 20x7 and 20x8
20x8 20x7 Amount % Amount %
Beginning retained earnings $27,350 100.0 $30,300 100.0
Net income 11,130 40.7 9,450 31.1
$38,480 140.7 $39,750 131.1
Preferred dividends, $3/share (3,000) (11.0) (3,000) (9.9)
Common dividends, $2/share (10,000) (36.6) (9,400) (31.0)
Ending retained earnings $25,480 93.2 $27,350 90.3
19
Financial Statement Analysis 20
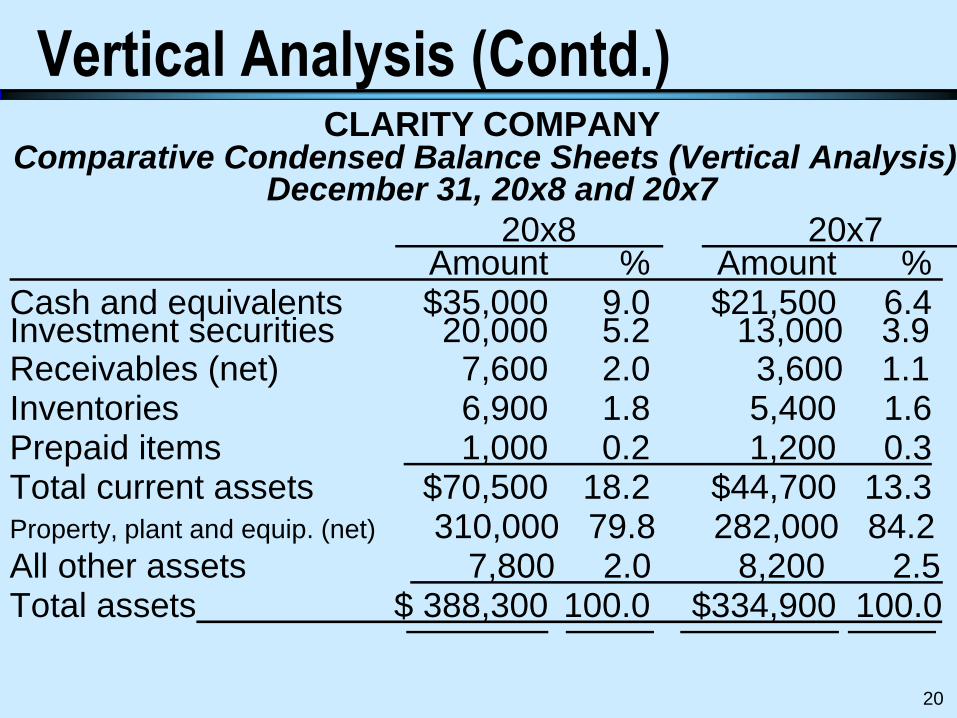
Vertical Analysis (Contd.) CLARITY COMPANY
Comparative Condensed Balance Sheets (Vertical Analysis) December 31, 20x8 and 20x7
20x8 20x7 Amount % Amount % Cash and equivalents $35,000 9.0 $21,500 6.4 Investment securities 20,000 5.2 13,000 3.9 Receivables (net) 7,600 2.0 3,600 1.1 Inventories 6,900 1.8 5,400 1.6 Prepaid items 1,000 0.2 1,200 0.3 Total current assets $70,500 18.2 $44,700 13.3 Property, plant and equip. (net) 310,000 79.8 282,000 84.2 All other assets 7,800 2.0 8,200 2.5 Total assets $ 388,300 100.0 $334,900 100.0
20
Financial Statement Analysis 21
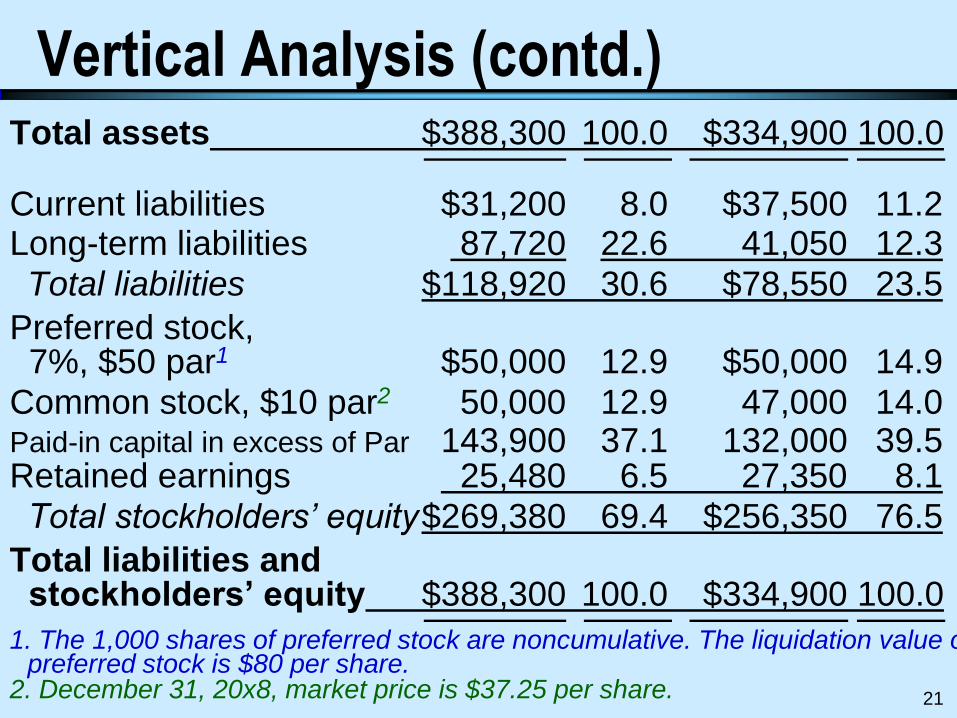
Vertical Analysis (contd.) Total assets $388,300 100.0 $334,900 100.0 Current liabilities $31,200 8.0 $37,500 11.2 Long-term liabilities 87,720 22.6 41,050 12.3 Total liabilities $118,920 30.6 $78,550 23.5
Preferred stock, 7%, $50 par1 $50,000 12.9 $50,000 14.9 Common stock, $10 par2 50,000 12.9 47,000 14.0 Paid-in capital in excess of Par 143,900 37.1 132,000 39.5 Retained earnings 25,480 6.5 27,350 8.1 Total stockholders’ equity $269,380 69.4 $256,350 76.5
Total liabilities and stockholders’ equity $388,300 100.0 $334,900 100.0 1. The 1,000 shares of preferred stock are noncumulative. The liquidation value of
preferred stock is $80 per share. 2. December 31, 20x8, market price is $37.25 per share. 21
Financial Statement Analysis 22
Vertical Analysis (contd.)
Common-size statements:
Financial statements are presented in percentages (no dollar amounts). For a common-size income statement, all items are expressed as a percentage of the net sales amount. For a common-size balance sheet statement, each item is expressed as a percentage of total assets.
Example:
Financial Statement Analysis 23
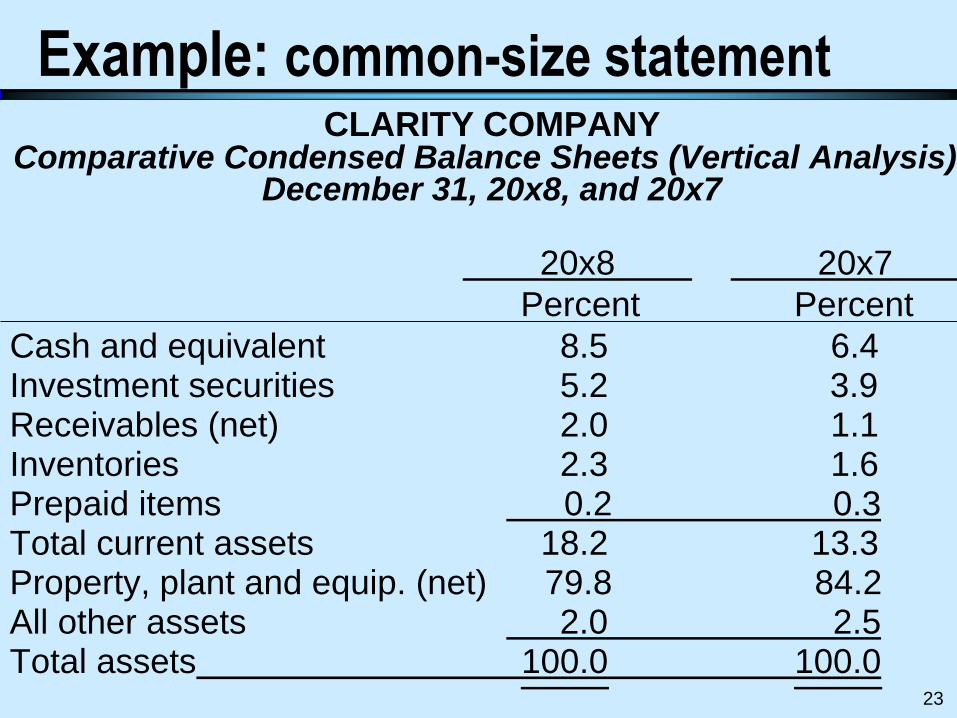
Example: common-size statement CLARITY COMPANY
Comparative Condensed Balance Sheets (Vertical Analysis) December 31, 20x8, and 20x7
20x8 20x7
Percent Percent
Cash and equivalent 8.5 6.4 Investment securities 5.2 3.9 Receivables (net) 2.0 1.1 Inventories 2.3 1.6 Prepaid items 0.2 0.3 Total current assets 18.2 13.3 Property, plant and equip. (net) 79.8 84.2 All other assets 2.0 2.5 Total assets 100.0 100.0 23
Financial Statement Analysis 24
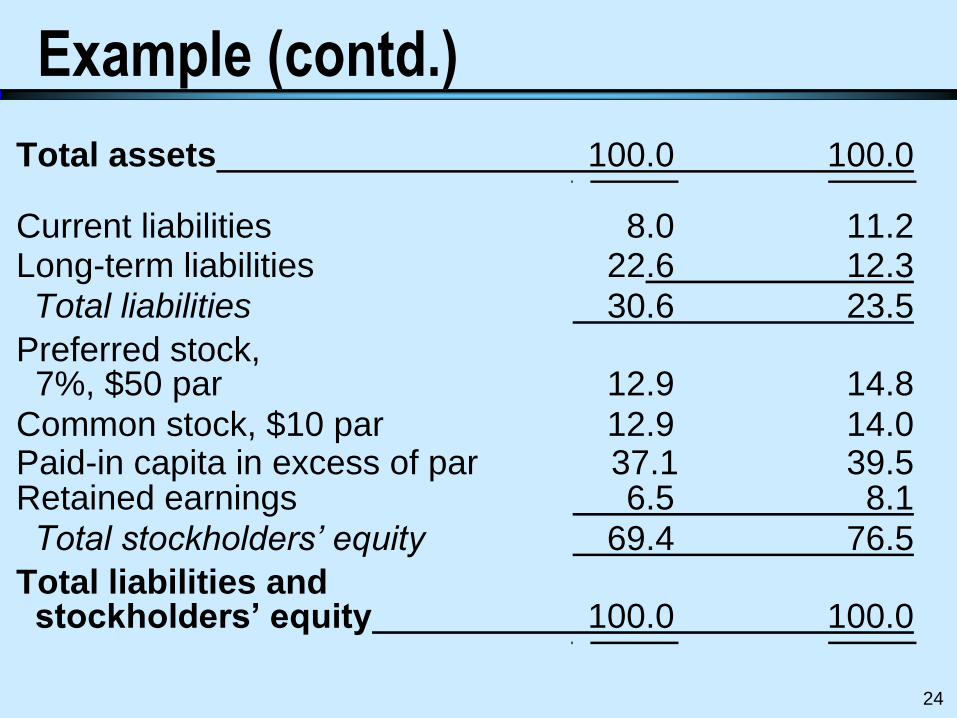
Example (contd.)
Total assets 100.0 100.0 Current liabilities 8.0 11.2 Long-term liabilities 22.6 12.3 Total liabilities 30.6 23.5
Preferred stock, 7%, $50 par 12.9 14.8 Common stock, $10 par 12.9 14.0 Paid-in capita in excess of par 37.1 39.5 Retained earnings 6.5 8.1 Total stockholders’ equity 69.4 76.5
Total liabilities and stockholders’ equity 100.0 100.0
24
Financial Statement Analysis 25
Vertical Analysis – An Inter-company Comparison Benchmarking: comparing the
performance of a company to a standard
set by other companies (i.e., inter-
company comparison) or by a industry
(industry comparison).
Example: comparing company’s vertical
analysis percentages against a key
competitor’s vertical analysis percentages
(i.e., inter-company comparison).
Financial Statement Analysis 26
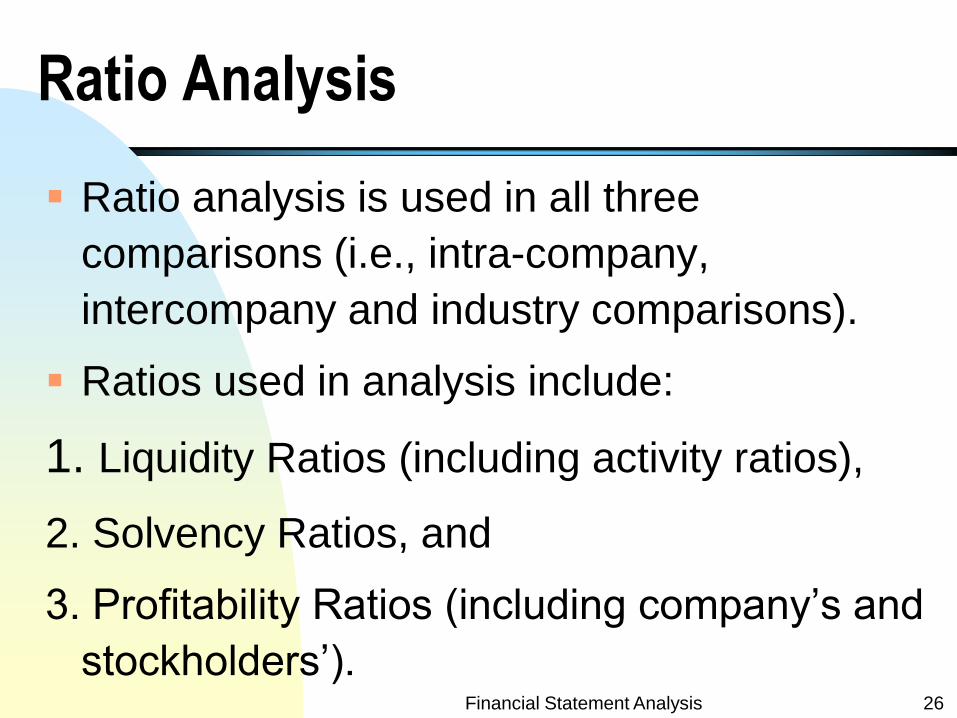
Ratio Analysis
Ratio analysis is used in all three
comparisons (i.e., intra-company,
intercompany and industry comparisons).
Ratios used in analysis include:
1. Liquidity Ratios (including activity ratios),
2. Solvency Ratios, and
3. Profitability Ratios (including company’s and
stockholders’).
Financial Statement Analysis 27
Liquidity Ratios
Measuring a company’s ability to pay
current liabilities.
These ratios are served to evaluate the
company’s ability to meet their current
maturing financial obligations.
Financial Statement Analysis 28
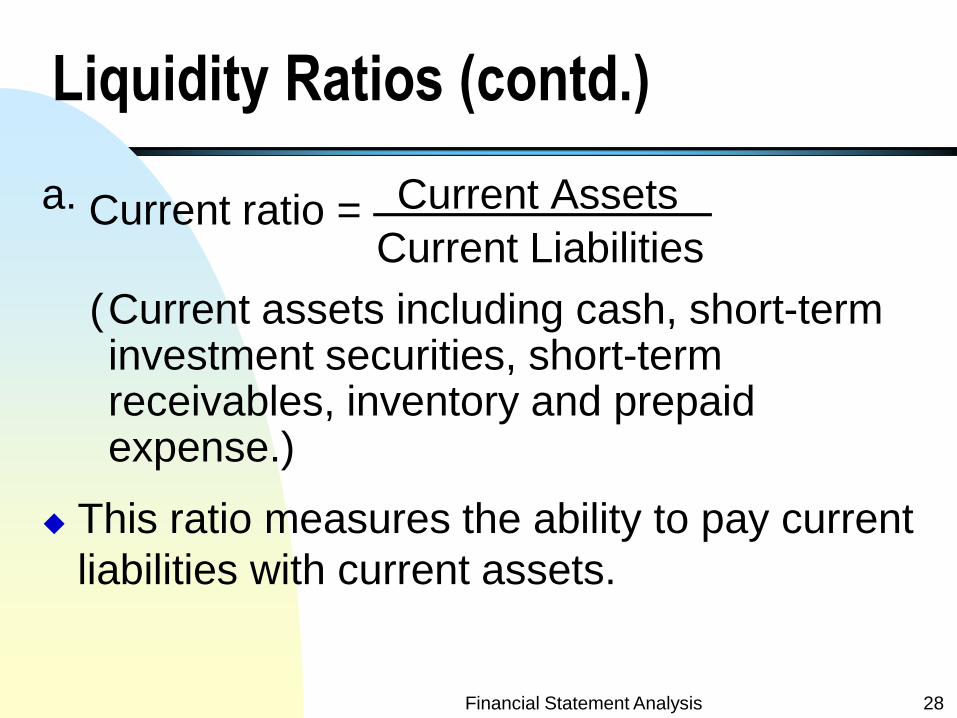
Liquidity Ratios (contd.)
a. Current ratio = Current Assets
Current Liabilities
( Current assets including cash, short-term investment securities, short-term receivables, inventory and prepaid expense.)
This ratio measures the ability to pay current
liabilities with current assets.
Financial Statement Analysis 29
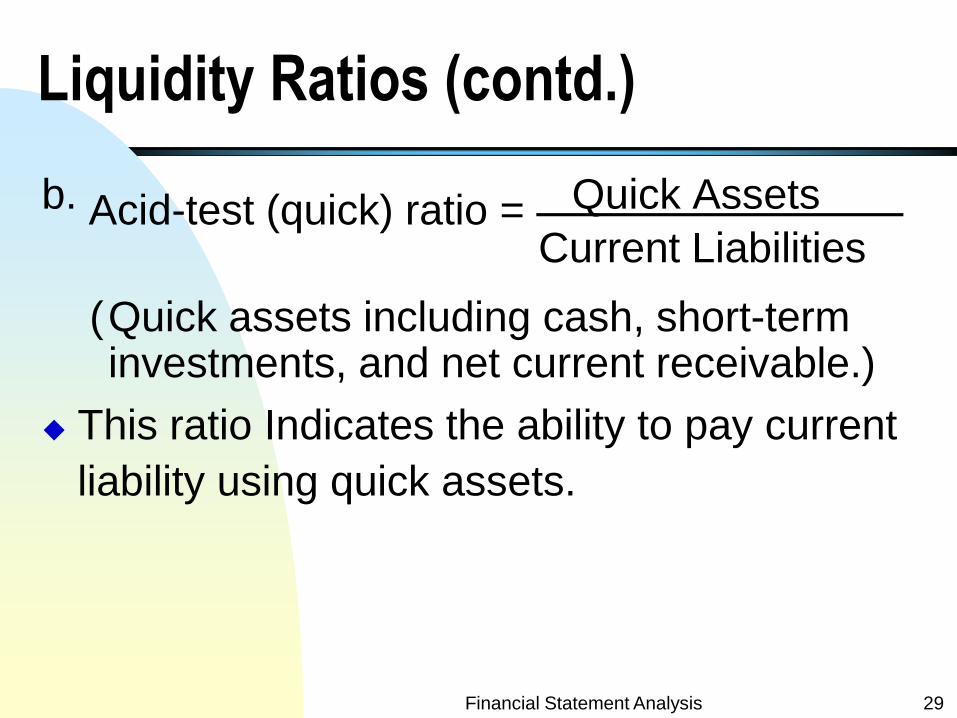
Liquidity Ratios (contd.)
b. Acid-test (quick) ratio = Quick Assets
Current Liabilities
( Quick assets including cash, short-term investments, and net current receivable.)
This ratio Indicates the ability to pay current
liability using quick assets.
Financial Statement Analysis 30
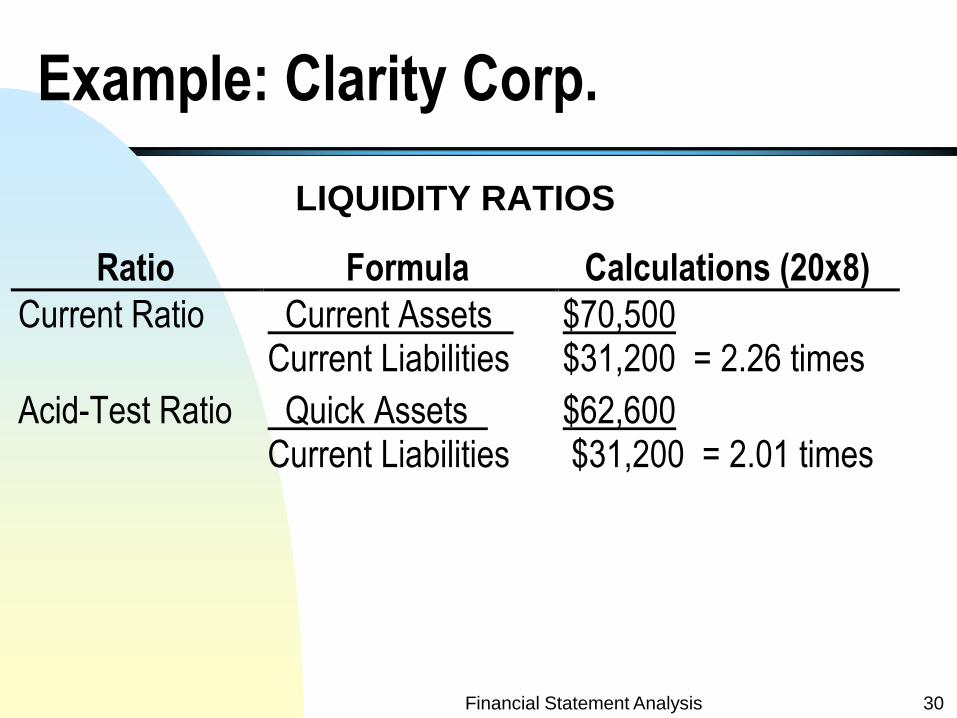
Example: Clarity Corp.
LIQUIDITY RATIOS
Ratio Formula Calculations (20x8)
Current Ratio Current Assets Current Liabilities
$70,500 $31,200 = 2.26 times
Acid-Test Ratio Quick Assets Current Liabilities
$62,600 $31,200 = 2.01 times
Financial Statement Analysis 31
Liquidity /Activity Ratios
Measure the effectiveness of a company in selling inventory (i.e., inventory turnover rate) and in collecting receivables (i.e., receivable turnover rate).
These ratios are indicators of the efficiency with which the company uses its short-term economic resources (i.e., inventory and receivables).
Financial Statement Analysis 32
Liquidity /Activity Ratios (Contd.) These ratios are also referred to as liquidity
ratios.
The faster a company can sell inventory or collect receivable, the faster it can convert inventory or receivables in to the most liquid asset - cash.
As a result, both inventory and receivable turnover rates are also referred as liquidity ratios.
Financial Statement Analysis 33
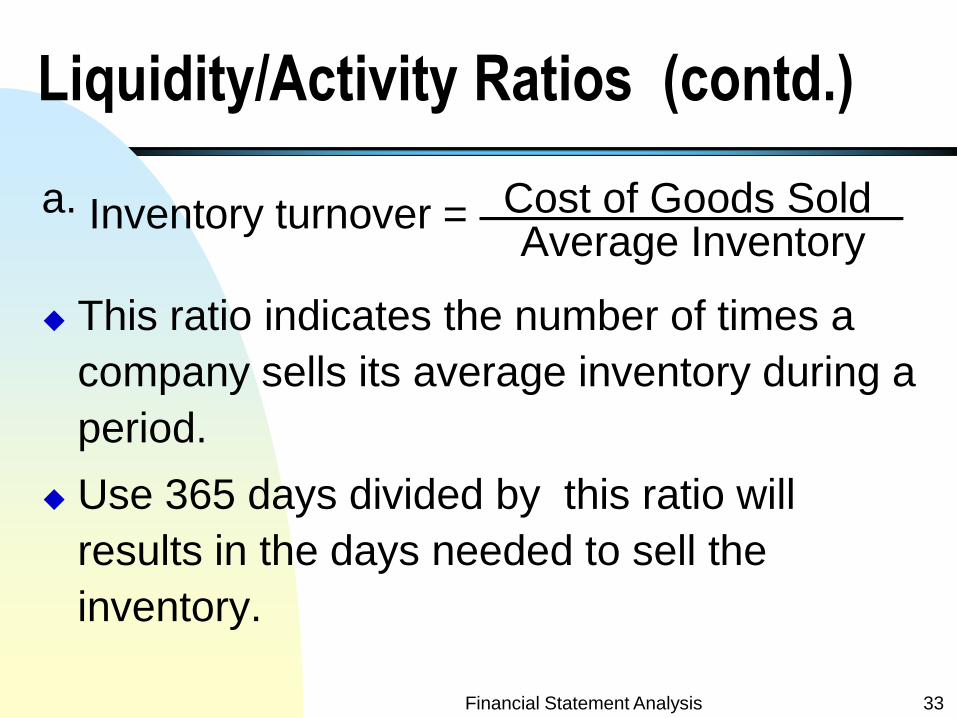
Liquidity/Activity Ratios (contd.)
a. Inventory turnover = Cost of Goods Sold Average Inventory
This ratio indicates the number of times a
company sells its average inventory during a
period.
Use 365 days divided by this ratio will
results in the days needed to sell the
inventory.
Financial Statement Analysis 34
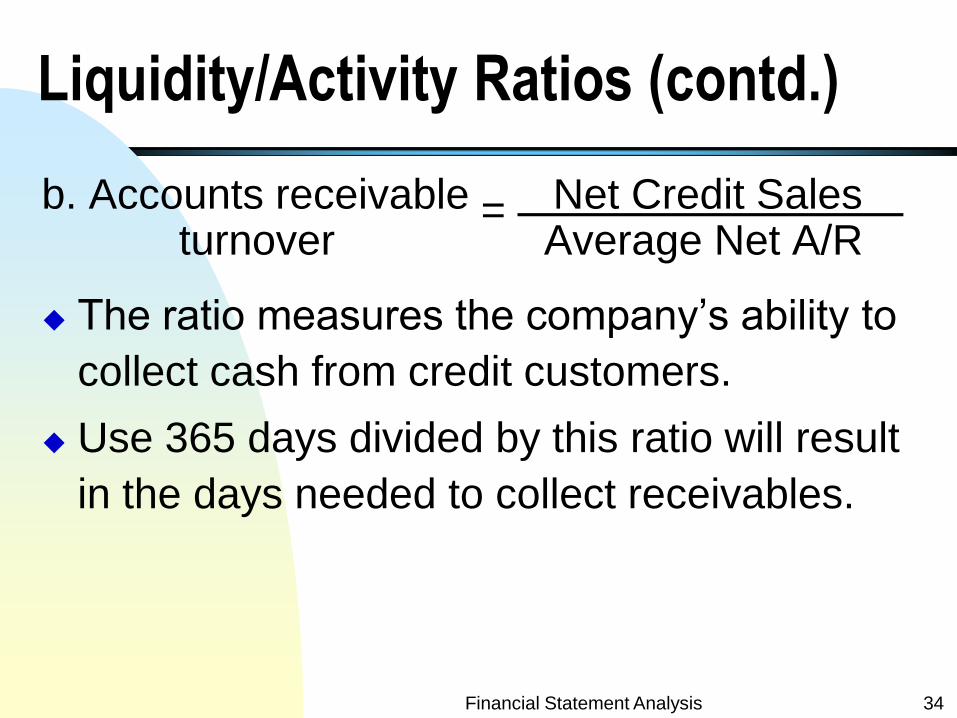
Liquidity/Activity Ratios (contd.)
b. Accounts receivable = Net Credit Sales turnover Average Net A/R
The ratio measures the company’s ability to
collect cash from credit customers.
Use 365 days divided by this ratio will result
in the days needed to collect receivables.
Financial Statement Analysis 35
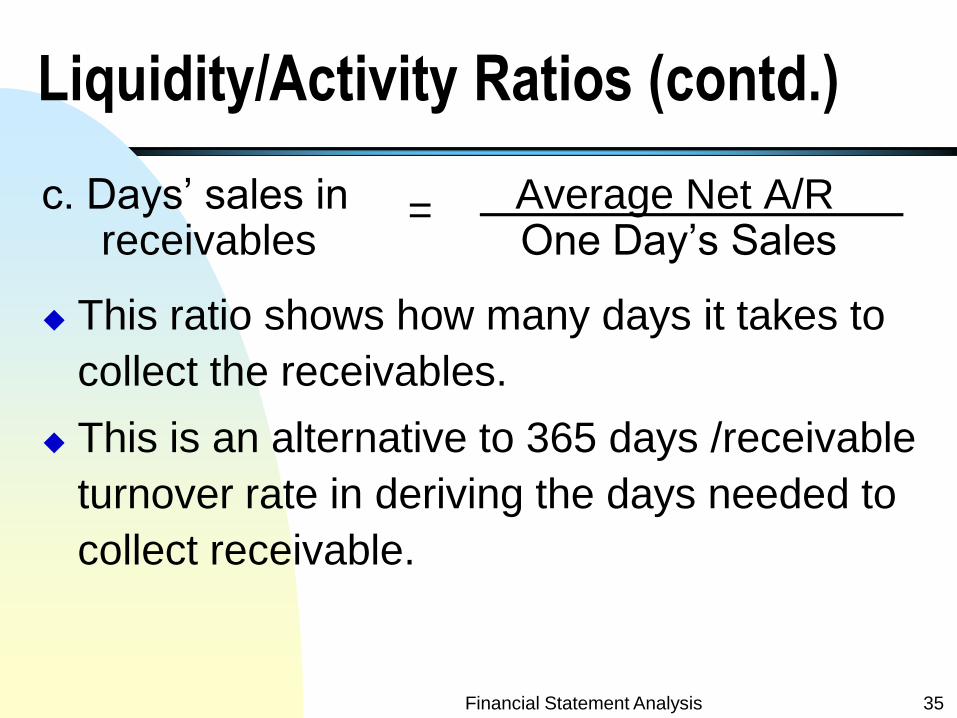
Liquidity/Activity Ratios (contd.)
c. Days’ sales in = Average Net A/R receivables One Day’s Sales
This ratio shows how many days it takes to
collect the receivables.
This is an alternative to 365 days /receivable
turnover rate in deriving the days needed to
collect receivable.
Financial Statement Analysis 36
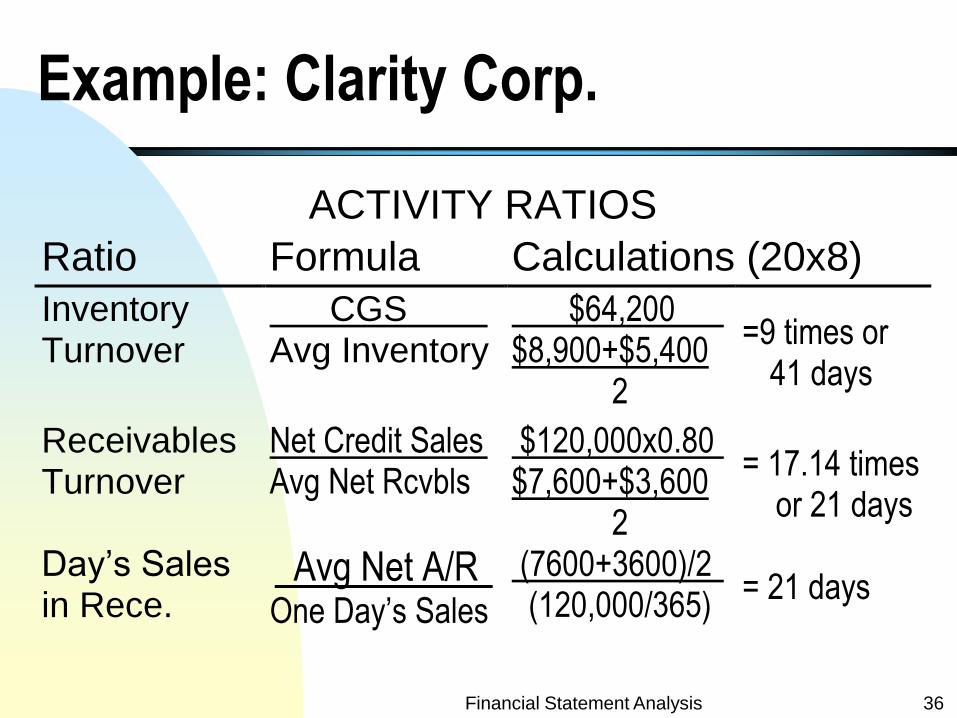
Example: Clarity Corp.
ACTIVITY RATIOS
Ratio Formula Calculations (20x8)
Inventory Turnover
CGS Avg Inventory
$64,200 $8,900+$5,400
2
=9 times or 41 days
Receivables Turnover
Net Credit Sales Avg Net Rcvbls
$120,000x0.80 $7,600+$3,600
2
= 17.14 times or 21 days
Day’s Sales in Rece.
Avg Net A/R One Day’s Sales
(7600+3600)/2 (120,000/365)
= 21 days
Financial Statement Analysis 37
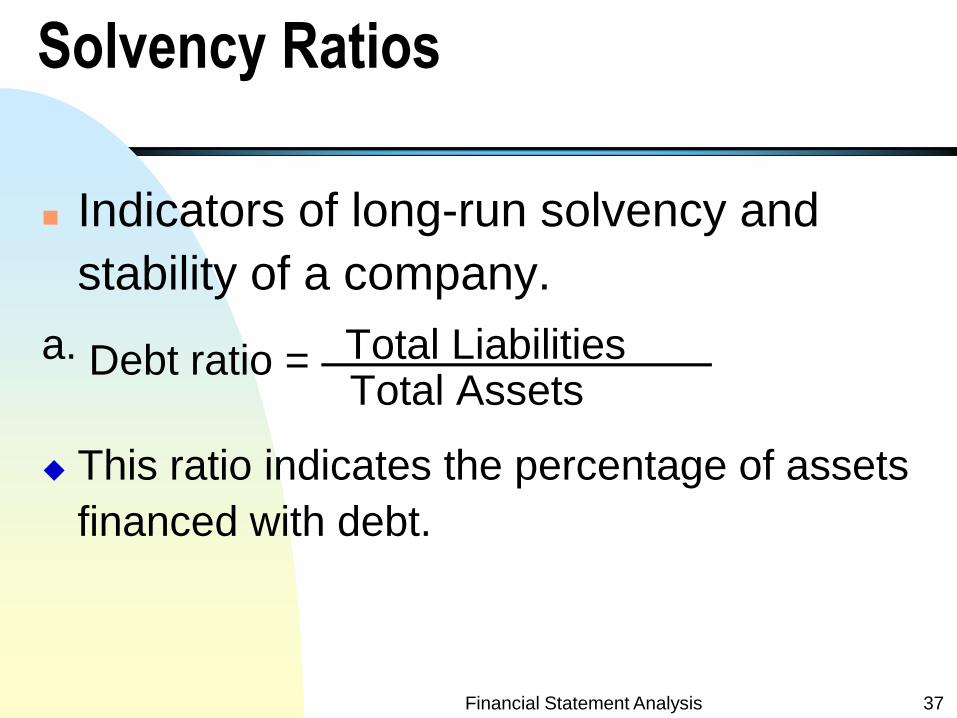
Solvency Ratios
Indicators of long-run solvency and
stability of a company.
a. Debt ratio = Total Liabilities Total Assets
This ratio indicates the percentage of assets
financed with debt.
Financial Statement Analysis 38
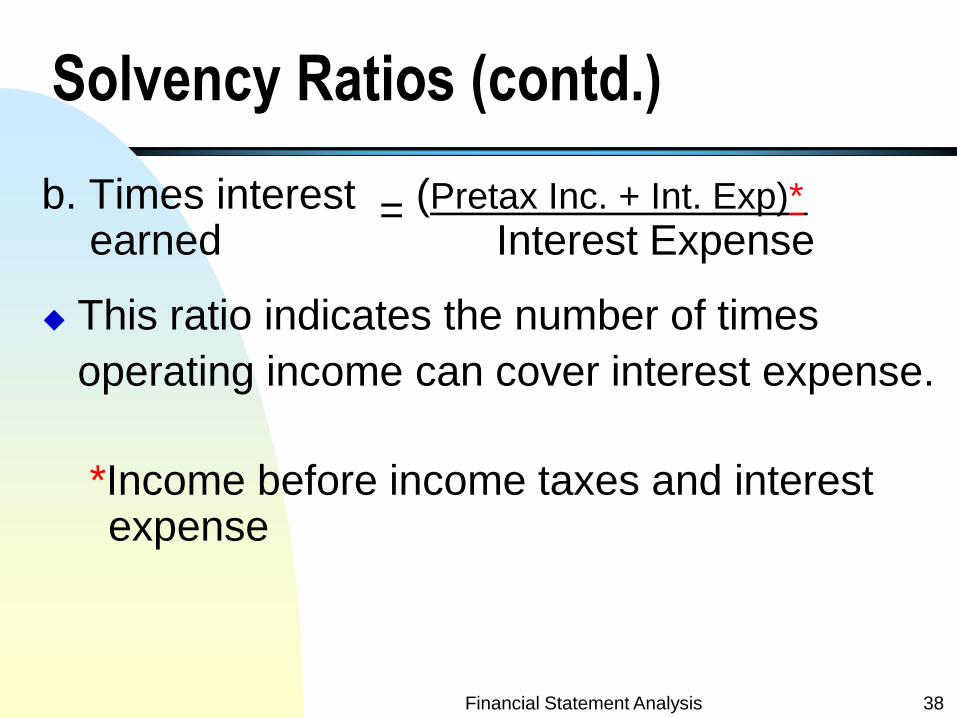
Solvency Ratios (contd.)
b. Times interest = (Pretax Inc. + Int. Exp)* earned Interest Expense
This ratio indicates the number of times
operating income can cover interest expense.
*Income before income taxes and interest expense
Financial Statement Analysis 39
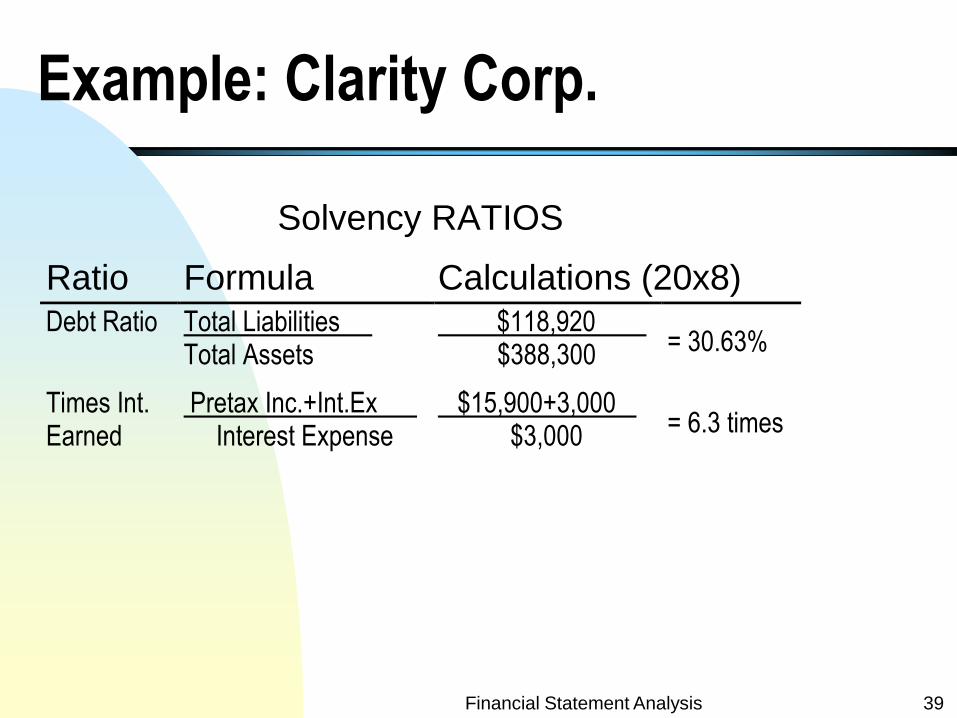
Example: Clarity Corp.
Solvency RATIOS
Ratio Formula Calculations (20x8) Debt Ratio Total Liabilities
Total Assets $118,920
$388,300 = 30.63%
Times Int. Earned
Pretax Inc.+Int.Ex Interest Expense
$15,900+3,000 $3,000 = 6.3 times
Financial Statement Analysis 40
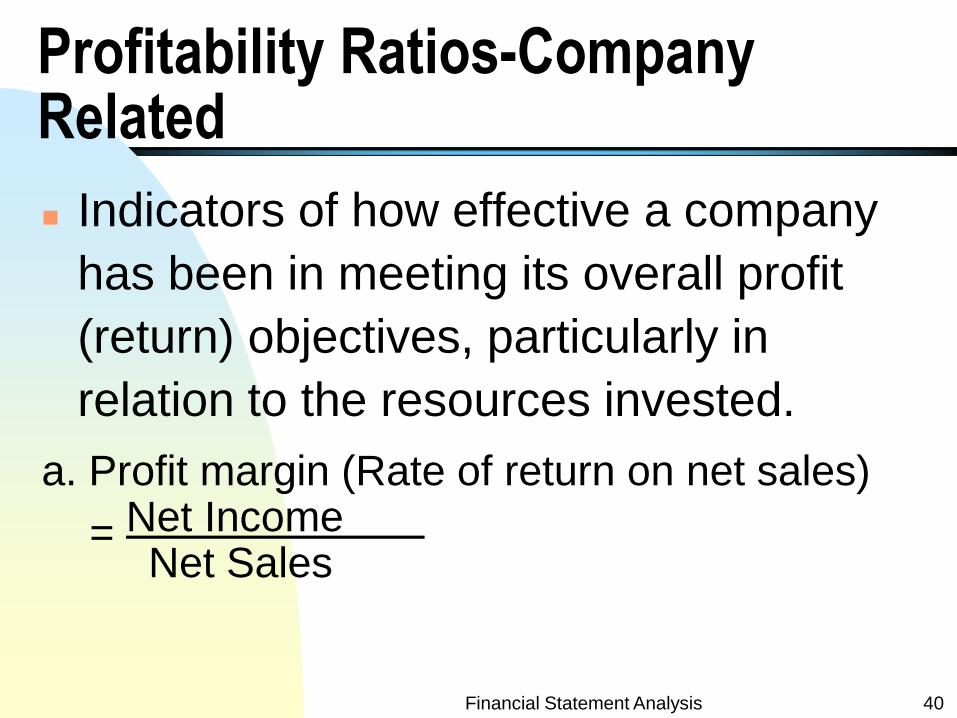
Profitability Ratios-Company Related Indicators of how effective a company
has been in meeting its overall profit
(return) objectives, particularly in
relation to the resources invested.
a. Profit margin (Rate of return on net sales)
= Net Income Net Sales
Financial Statement Analysis 41
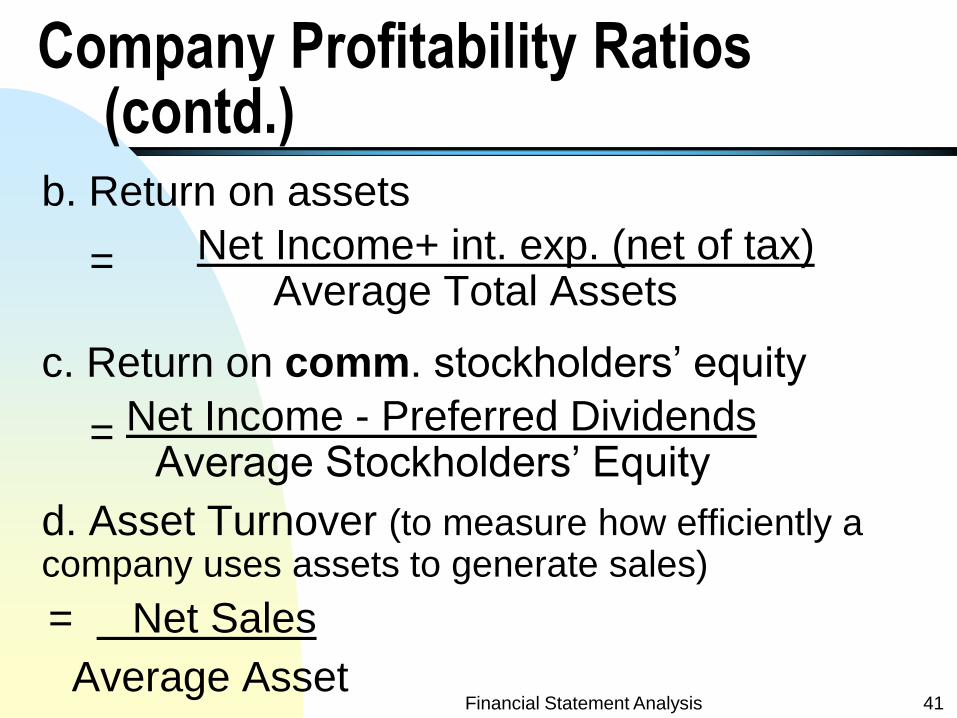
Company Profitability Ratios (contd.)
b. Return on assets
= Net Income+ int. exp. (net of tax) Average Total Assets
c. Return on comm. stockholders’ equity
= Net Income - Preferred Dividends Average Stockholders’ Equity
d. Asset Turnover (to measure how efficiently a company uses assets to generate sales)
= Net Sales
Average Asset
Financial Statement Analysis 42
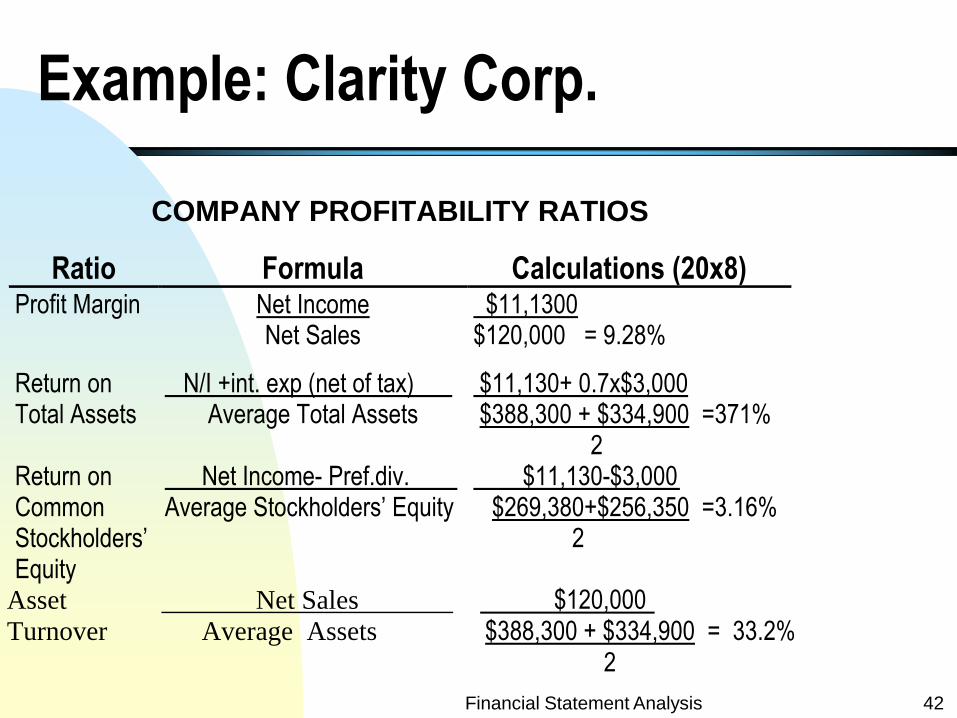
Example: Clarity Corp.
COMPANY PROFITABILITY RATIOS
Ratio Formula Calculations (20x8) Profit Margin Net Income
Net Sales $11,1300 $120,000 = 9.28%
Return on Total Assets
N/I +int. exp (net of tax) Average Total Assets
$11,130+ 0.7x$3,000 $388,300 + $334,900 =371% 2
Return on Common Stockholders’ Equity
Net Income- Pref.div. Average Stockholders’ Equity
$11,130-$3,000 $269,380+$256,350 =3.16% 2
Asset Net Sales $120,000 Turnover Average Assets $388,300 + $334,900 = 33.2% 2
Example: Contd.
When the rate of return on equity is higher than the rate return on assets, it indicates that the company earns a higher return from borrowed money than the interest paid for the borrowed money.
It is also an indication of an effective use of leverage .
Financial Statement Analysis 43
Financial Statement Analysis 44
Profitability Ratios- Shareholders Related Indicators of how effective a company
has been in meeting the profit
objectives of its shareholders.
Financial Statement Analysis 45
Profitability Ratios -Shareholders(contd.)
a. Earnings per share
= Net Income - Preferred Dividends Average Common Shares Outstanding
This ratio given the amount of net income per
common share.
Financial Statement Analysis 46
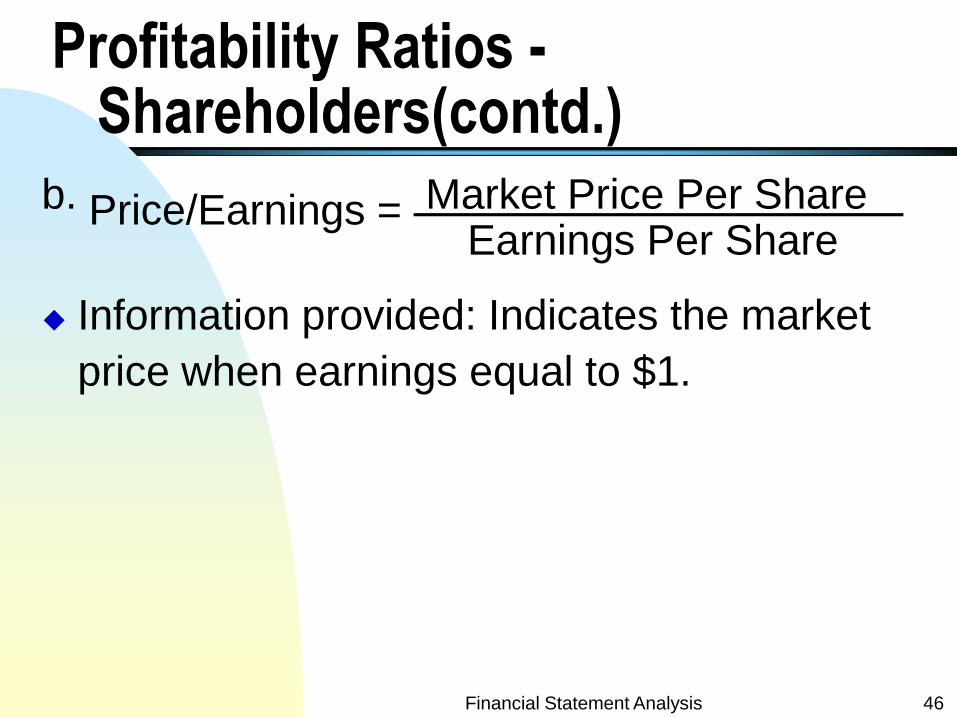
Profitability Ratios - Shareholders(contd.)
b. Price/Earnings = Market Price Per Share Earnings Per Share
Information provided: Indicates the market
price when earnings equal to $1.
Financial Statement Analysis 47
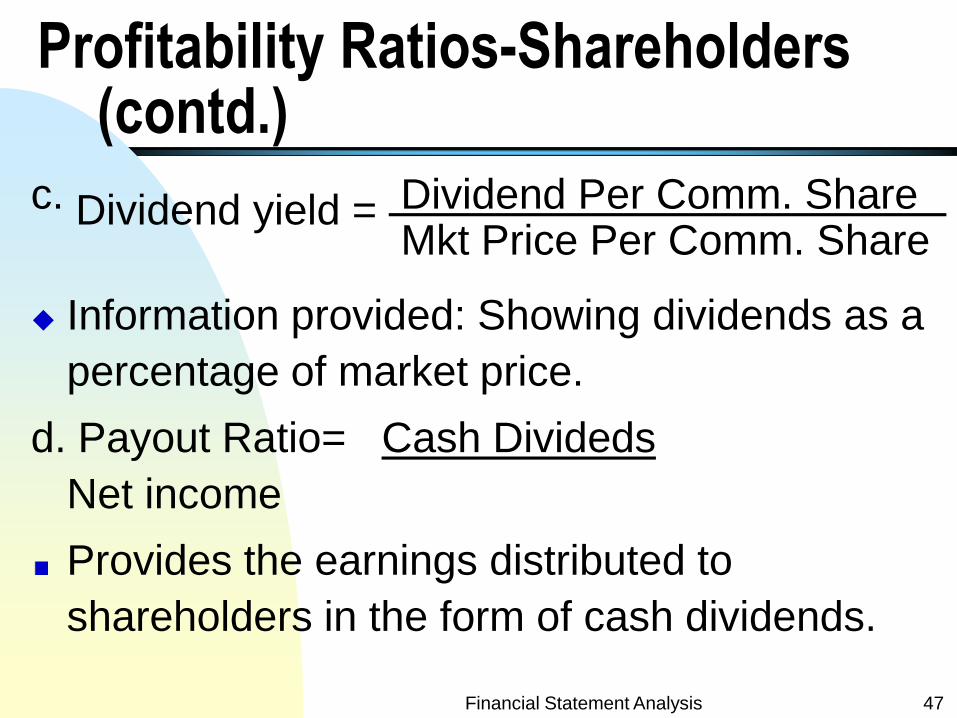
Profitability Ratios-Shareholders (contd.)
c. Dividend yield = Dividend Per Comm. Share Mkt Price Per Comm. Share
Information provided: Showing dividends as a
percentage of market price.
d. Payout Ratio= Cash Divideds
Net income
Provides the earnings distributed to
shareholders in the form of cash dividends.
Financial Statement Analysis 48
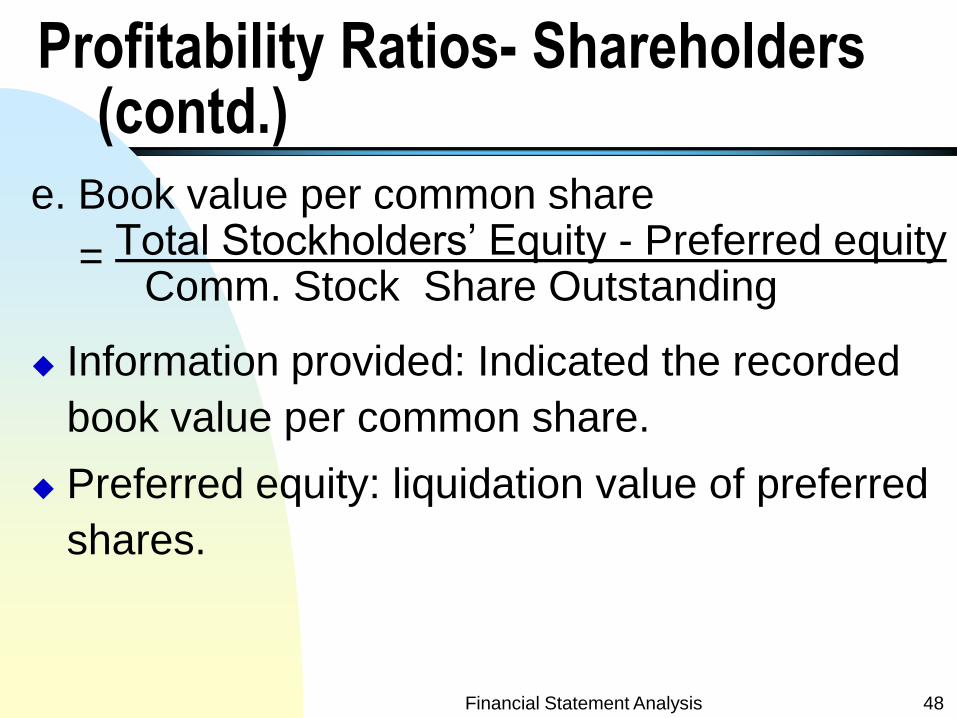
Profitability Ratios- Shareholders (contd.)
e. Book value per common share
= Total Stockholders’ Equity - Preferred equity Comm. Stock Share Outstanding
Information provided: Indicated the recorded
book value per common share.
Preferred equity: liquidation value of preferred
shares.
Financial Statement Analysis 49
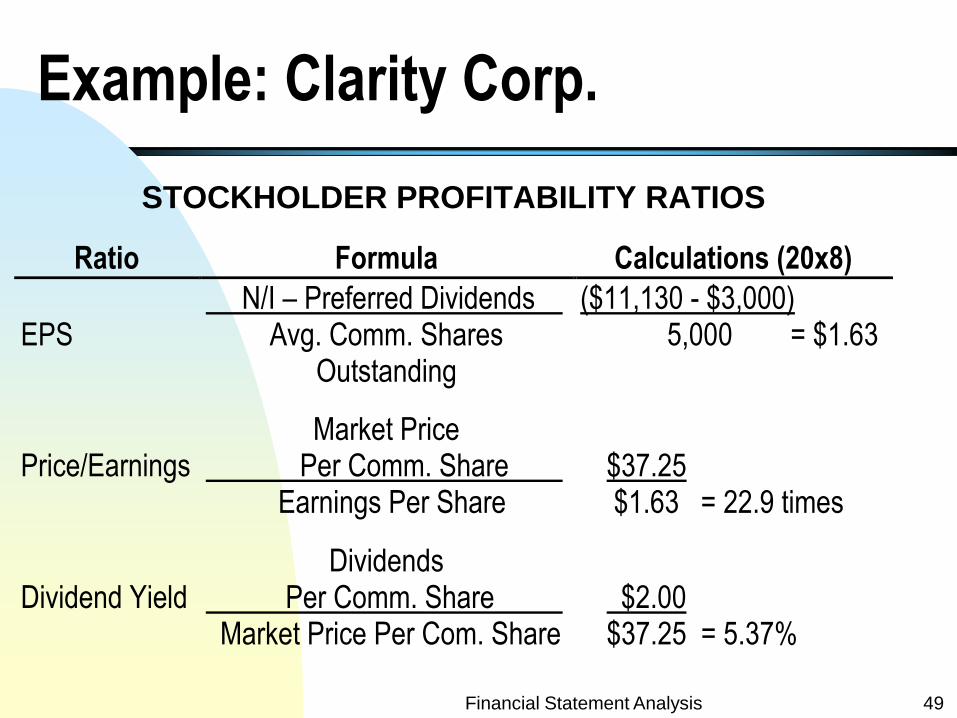
Example: Clarity Corp.
STOCKHOLDER PROFITABILITY RATIOS
Ratio Formula Calculations (20x8)
EPS
N/I – Preferred Dividends Avg. Comm. Shares
Outstanding
($11,130 - $3,000) 5,000 = $1.63
Price/Earnings
Market Price Per Comm. Share Earnings Per Share
$37.25 $1.63 = 22.9 times
Dividend Yield
Dividends Per Comm. Share Market Price Per Com. Share
$2.00 $37.25 = 5.37%
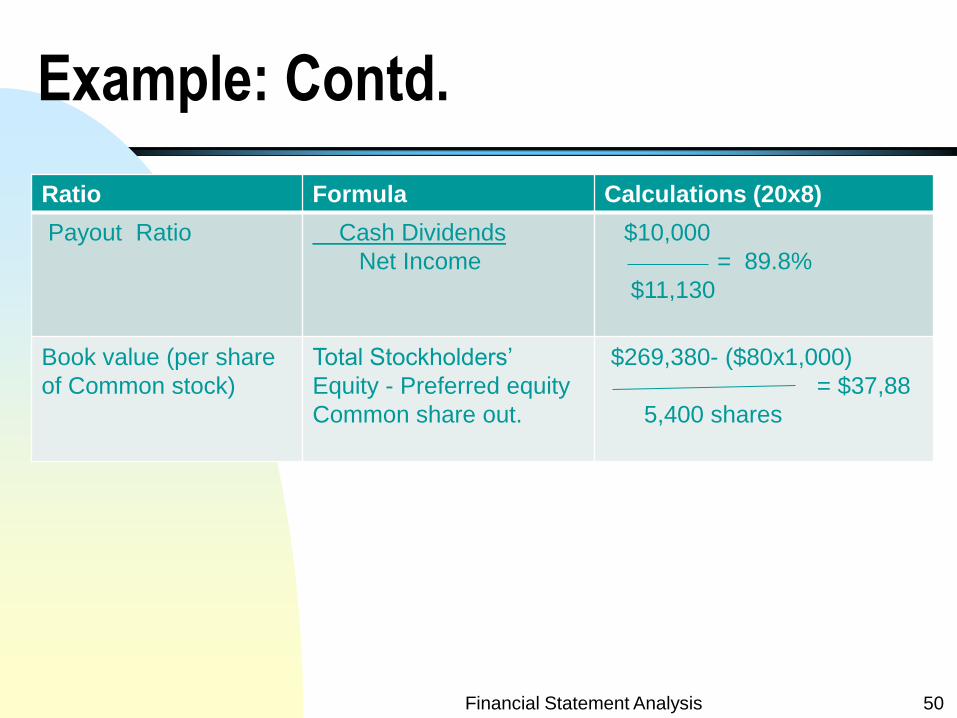
Example: Contd.
Ratio Formula Calculations (20x8)
Payout Ratio Cash Dividends
Net Income
$10,000
= 89.8%
$11,130
Book value (per share
of Common stock)
Total Stockholders’
Equity - Preferred equity
Common share out.
$269,380- ($80x1,000)
= $37,88
5,400 shares
Financial Statement Analysis 50
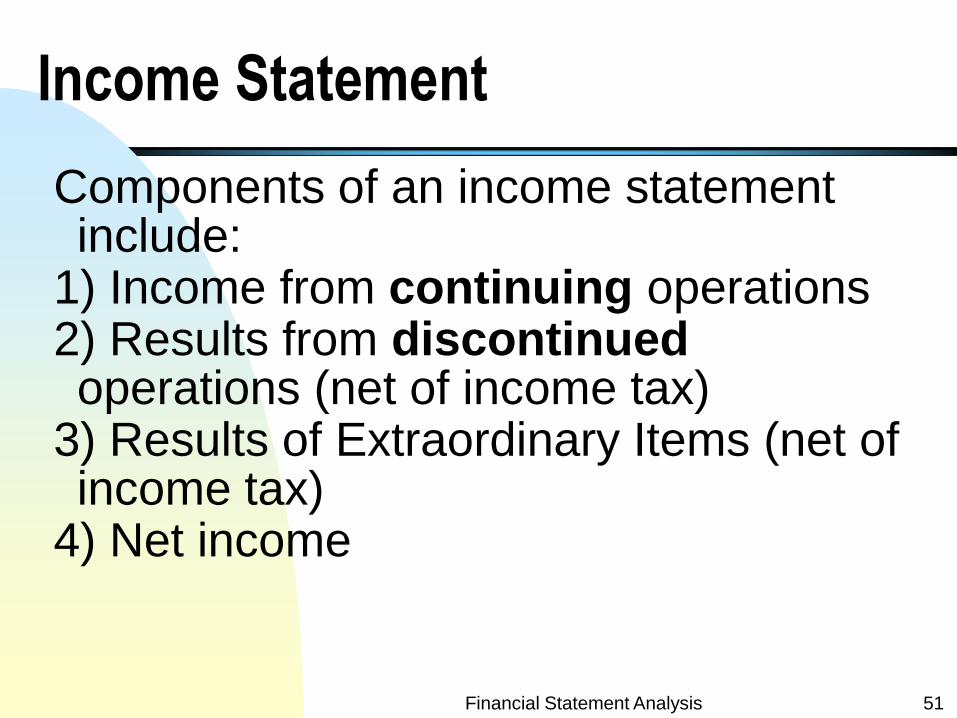
Income Statement
Components of an income statement include:
1) Income from continuing operations 2) Results from discontinued operations (net of income tax)
3) Results of Extraordinary Items (net of income tax)
4) Net income
Financial Statement Analysis 51
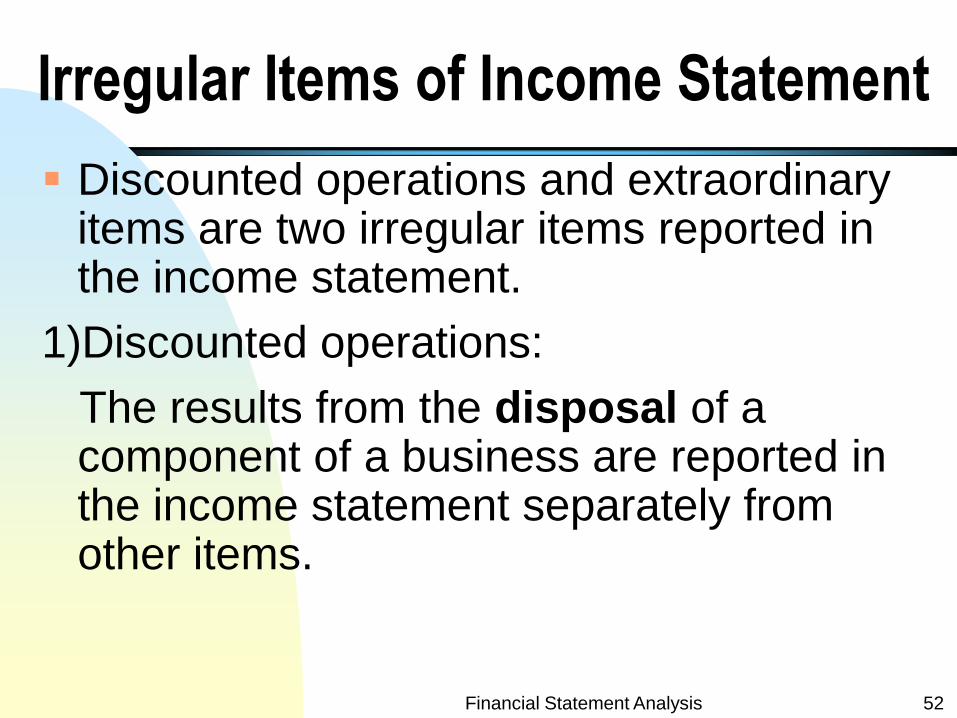
Irregular Items of Income Statement
Discounted operations and extraordinary items are two irregular items reported in the income statement.
1)Discounted operations:
The results from the disposal of a component of a business are reported in the income statement separately from other items.
Financial Statement Analysis 52
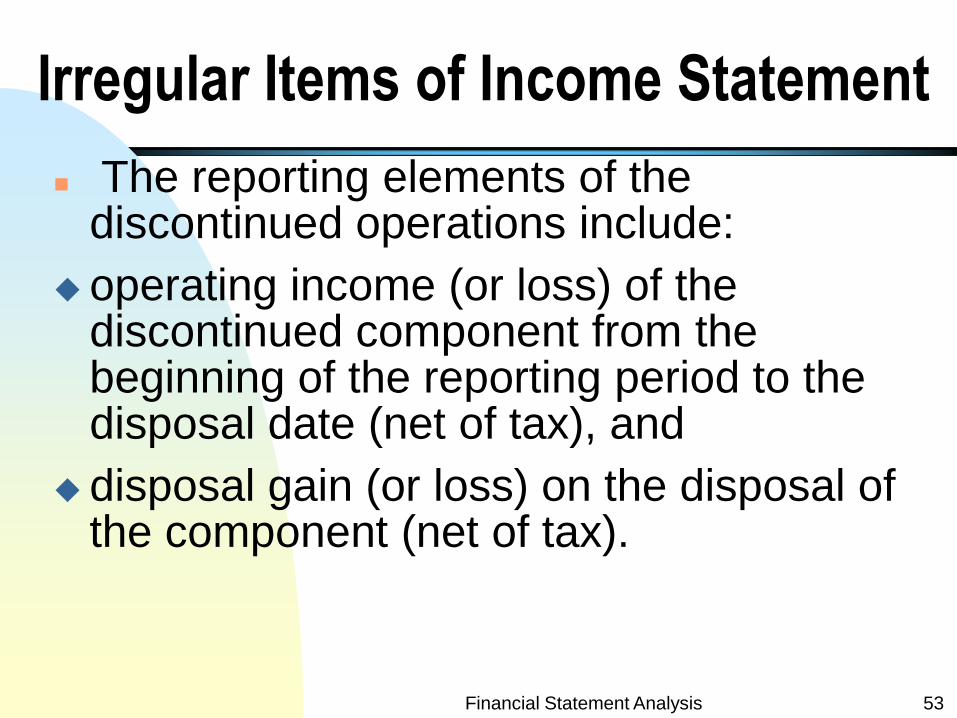
Irregular Items of Income Statement
The reporting elements of the discontinued operations include:
operating income (or loss) of the discontinued component from the beginning of the reporting period to the disposal date (net of tax), and
disposal gain (or loss) on the disposal of the component (net of tax).
Financial Statement Analysis 53
Extraordinary Items
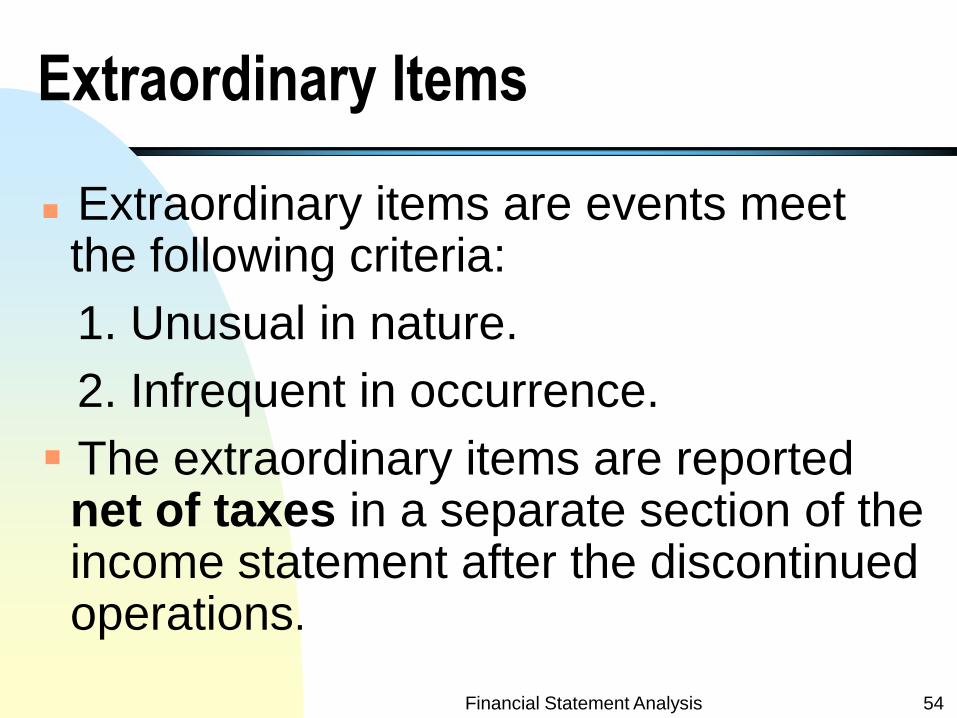
Extraordinary items are events meet the following criteria:
1. Unusual in nature.
2. Infrequent in occurrence.
The extraordinary items are reported net of taxes in a separate section of the income statement after the discontinued operations.
Financial Statement Analysis 54
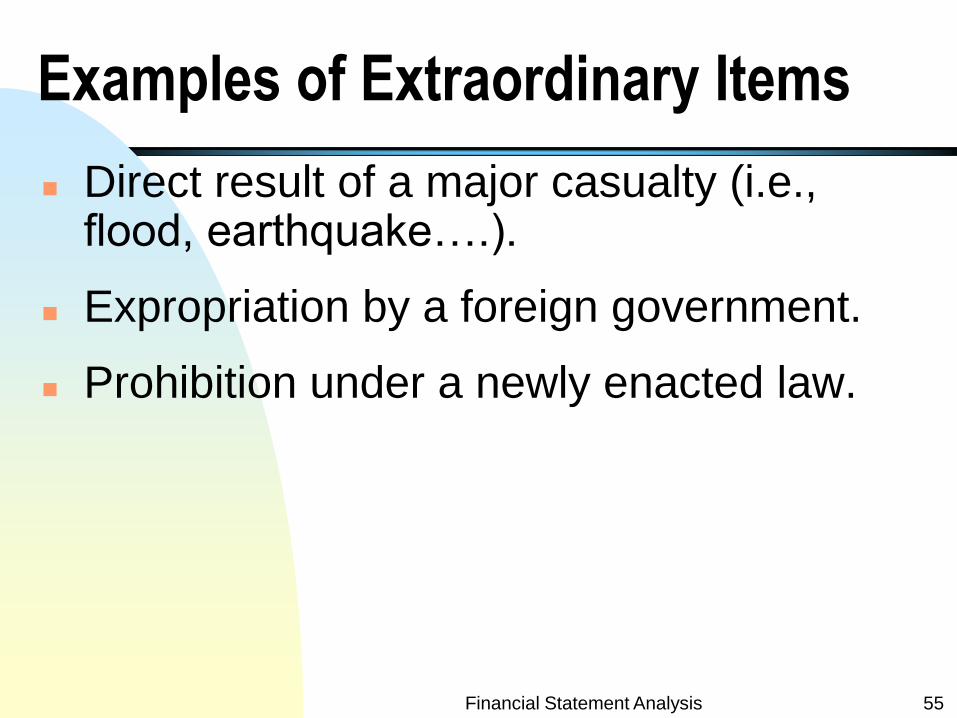
Examples of Extraordinary Items
Direct result of a major casualty (i.e., flood, earthquake….).
Expropriation by a foreign government.
Prohibition under a newly enacted law.
Financial Statement Analysis 55
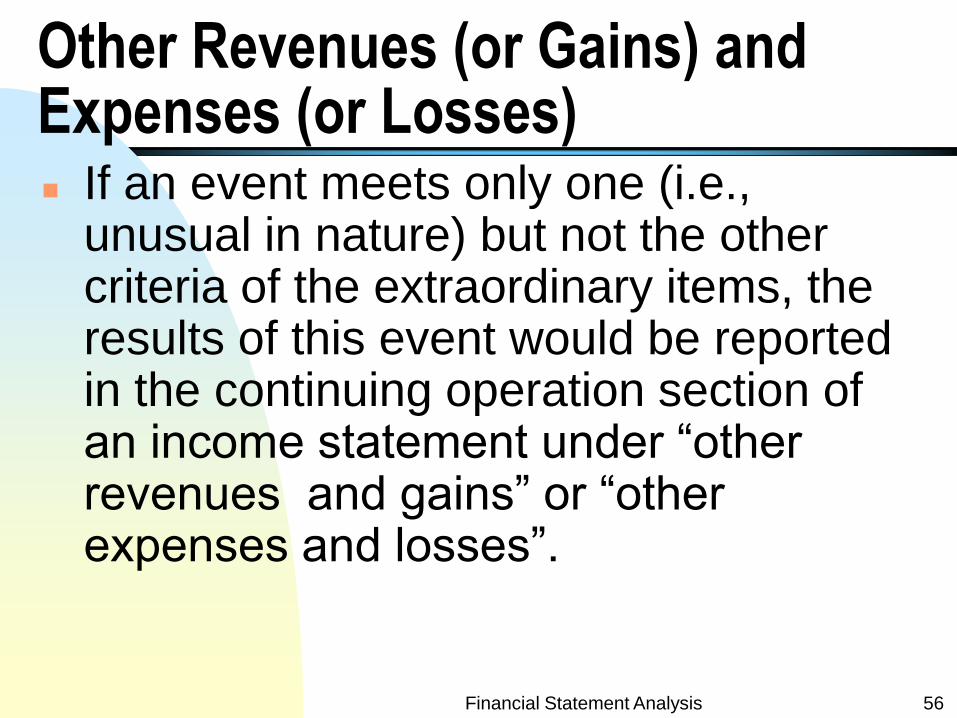
Other Revenues (or Gains) and Expenses (or Losses) If an event meets only one (i.e.,
unusual in nature) but not the other criteria of the extraordinary items, the results of this event would be reported in the continuing operation section of an income statement under “other revenues and gains” or “other expenses and losses”.
Financial Statement Analysis 56
Changes in Accounting Principle
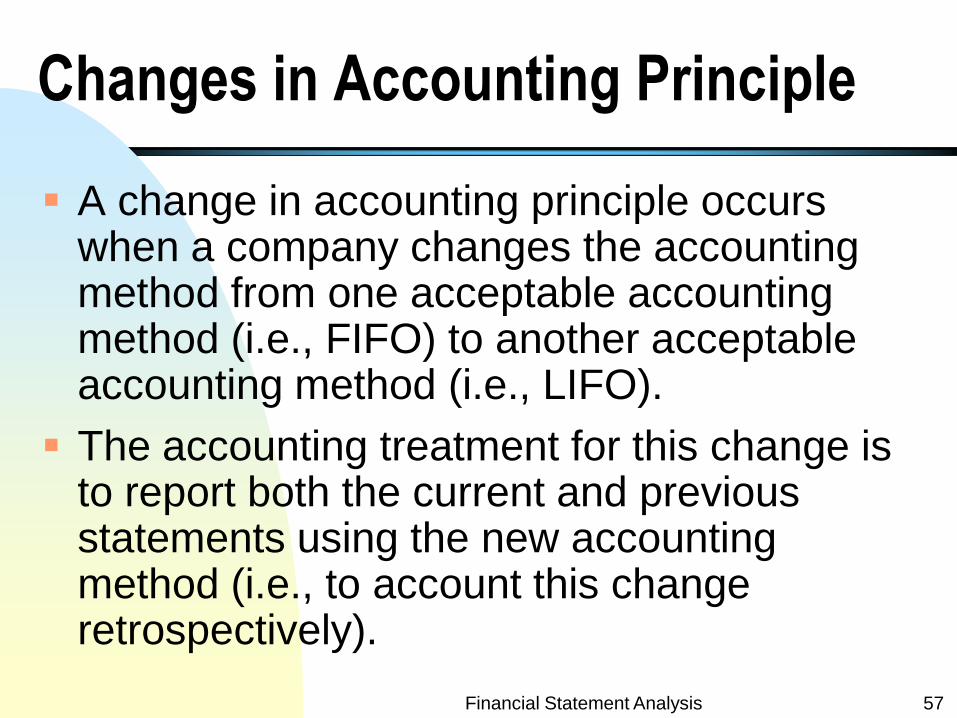
A change in accounting principle occurs when a company changes the accounting method from one acceptable accounting method (i.e., FIFO) to another acceptable accounting method (i.e., LIFO).
The accounting treatment for this change is to report both the current and previous statements using the new accounting method (i.e., to account this change retrospectively).
Financial Statement Analysis 57
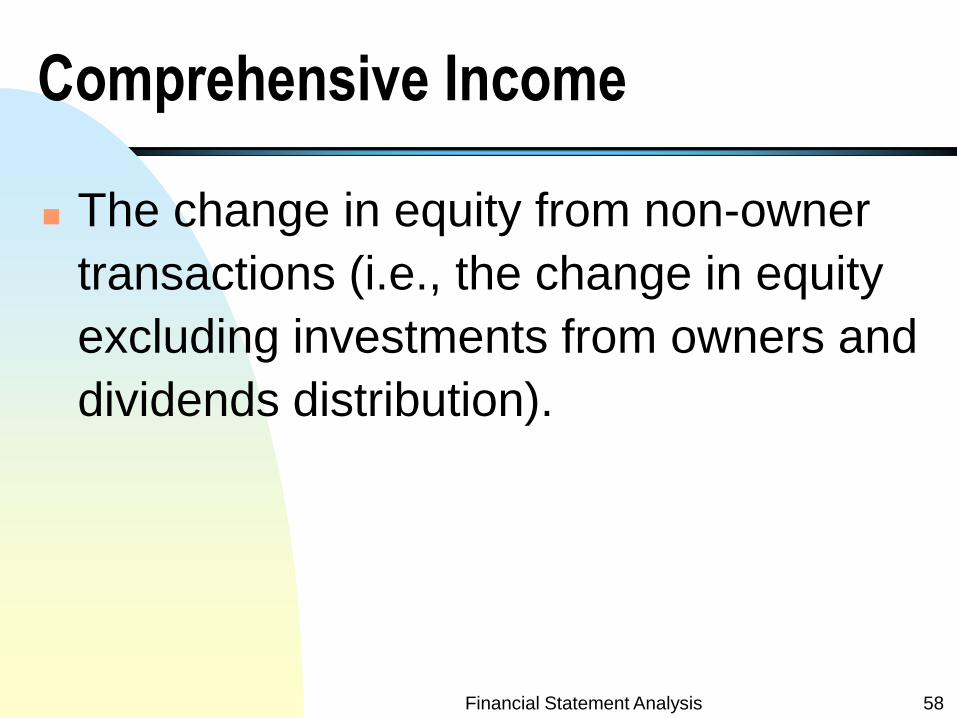
Comprehensive Income The change in equity from non-owner
transactions (i.e., the change in equity
excluding investments from owners and
dividends distribution).
Financial Statement Analysis 58
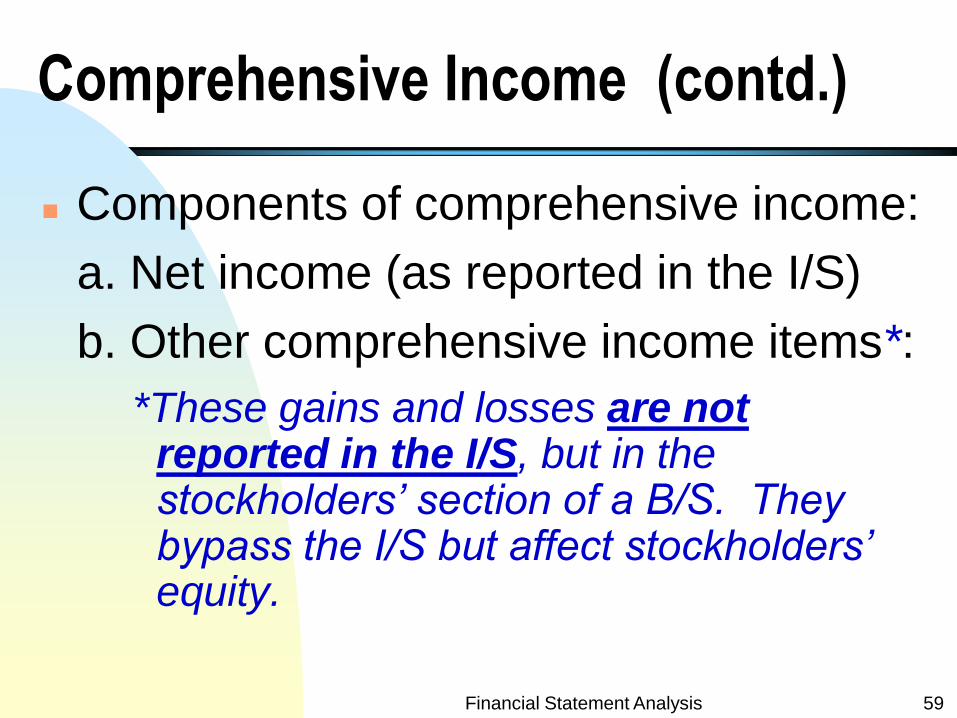
Comprehensive Income (contd.) Components of comprehensive income:
a. Net income (as reported in the I/S)
b. Other comprehensive income items*:
*These gains and losses are not reported in the I/S, but in the stockholders’ section of a B/S. They bypass the I/S but affect stockholders’ equity.
Financial Statement Analysis 59
Comprehensive Income (contd.)
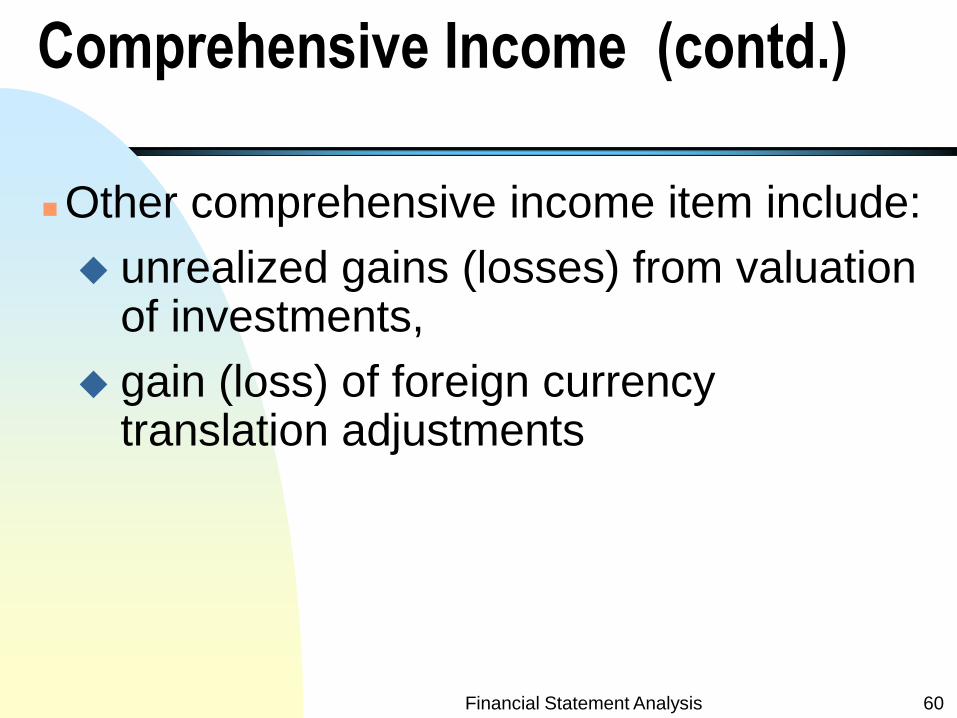
Other comprehensive income item include:
unrealized gains (losses) from valuation of investments,
gain (loss) of foreign currency translation adjustments
Financial Statement Analysis 60
The Income Statement and Statement of Cash Flows 61
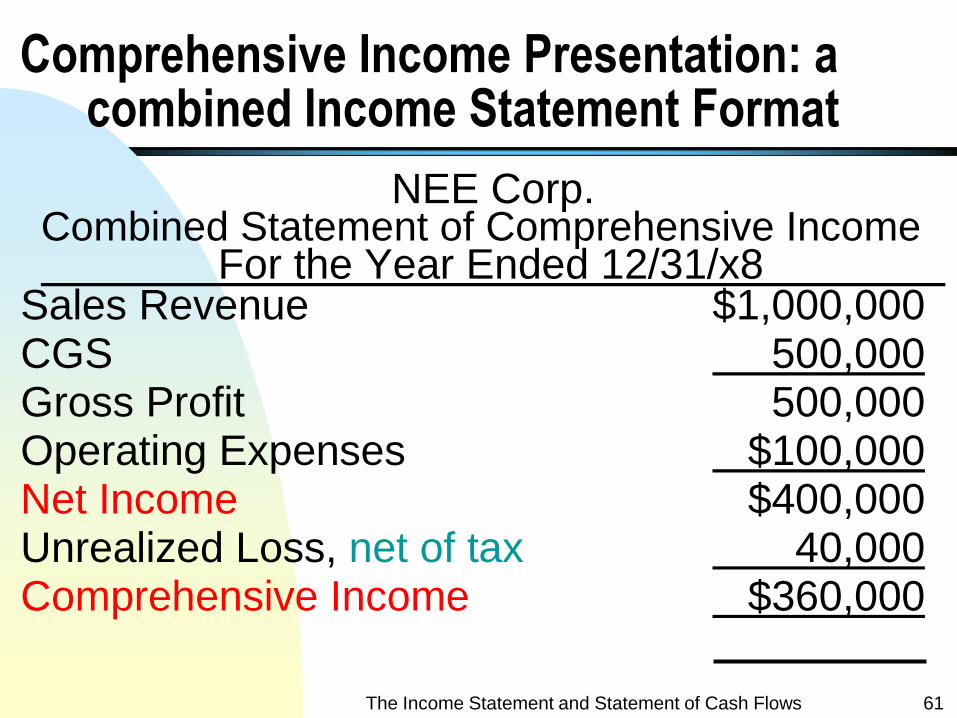
Comprehensive Income Presentation: a combined Income Statement Format
NEE Corp. Combined Statement of Comprehensive Income For the Year Ended 12/31/x8
Sales Revenue $1,000,000 CGS 500,000 Gross Profit 500,000 Operating Expenses $100,000 Net Income $400,000 Unrealized Loss, net of tax 40,000 Comprehensive Income $360,000
Quality of Earnings
Quality of earnings is important to financial statement analysis.
Factors affect the quality of earnings include (source: Financial Accouting by Weygandt, Kimmel and Kieso)
1. Alternative accounting methods.
2. Pro Forma Income.
3. Improper Recognition.
Financial Statement Analysis 62