Embed Size (px)
DESCRIPTION
Have you ever wondered what happens to all the precious RAM after running your 'simple' CPython code? Prepare yourself for a short introduction to CPython memory management! This presentation will try to answer some memory related questions you always wondered about. It will also discuss basic memory profiling tools and techniques.
Citation preview
Basic stuff Notes on memory model Memory profiling tools Notes on malloc() in CPython Summary
Everything You Always Wanted to Know AboutMemory in PythonBut Were Afraid to Ask
(extended)
Piotr Przymus
Nicolaus Copernicus University
PyConPL 2014,Szczyrk
P. Przymus 1/53

Basic stuff Notes on memory model Memory profiling tools Notes on malloc() in CPython Summary
About Me
Piotr PrzymusPhD student / Research Assistant at Nicolaus Copernicus University.Interests: databases, GPGPU computing, datamining, High-performancecomputing.8 years of Python experience.Some of my Python projects:
Worked on parts of trading platform in turbineam.com (back testing,trading algorithms).Mussels bio-monitoring analysis and data mining software.Simulator of heterogeneus processing environment for evaluation ofdatabase query scheduling algorithms.
P. Przymus 2/53

Basic stuff Notes on memory model Memory profiling tools Notes on malloc() in CPython Summary
Basic stuff
P. Przymus 3/53
Basic stuff Notes on memory model Memory profiling tools Notes on malloc() in CPython Summary
Size of objects
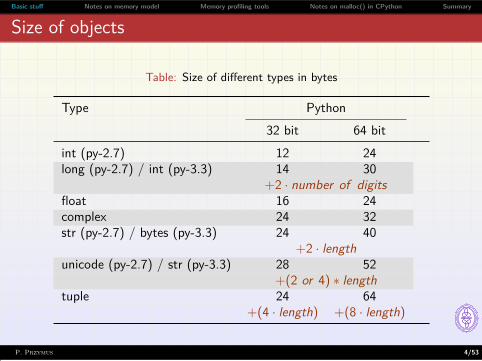
Table: Size of different types in bytes
Type Python32 bit 64 bit
int (py-2.7) 12 24long (py-2.7) / int (py-3.3) 14 30
+2 · number of digitsfloat 16 24complex 24 32str (py-2.7) / bytes (py-3.3) 24 40
+2 · lengthunicode (py-2.7) / str (py-3.3) 28 52
+(2 or 4) ∗ lengthtuple 24 64
+(4 · length) +(8 · length)
P. Przymus 4/53
Basic stuff Notes on memory model Memory profiling tools Notes on malloc() in CPython Summary
Size of objects
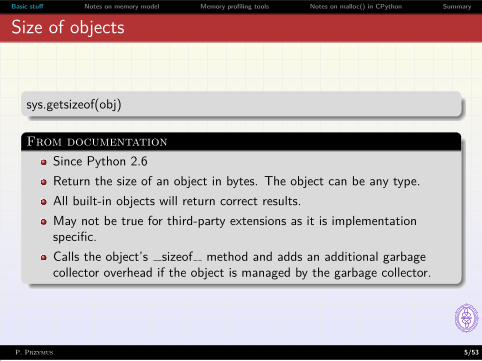
sys.getsizeof(obj)
From documentationSince Python 2.6Return the size of an object in bytes. The object can be any type.All built-in objects will return correct results.May not be true for third-party extensions as it is implementationspecific.Calls the object’s sizeof method and adds an additional garbagecollector overhead if the object is managed by the garbage collector.
P. Przymus 5/53
Basic stuff Notes on memory model Memory profiling tools Notes on malloc() in CPython Summary
Size of containers
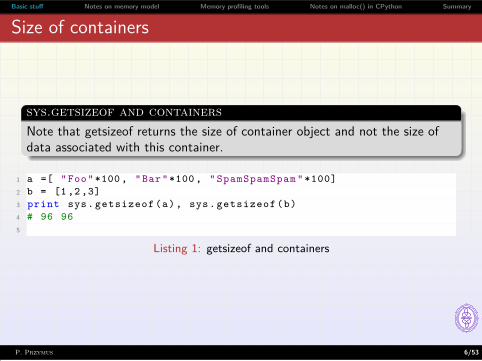
sys.getsizeof and containersNote that getsizeof returns the size of container object and not the size ofdata associated with this container.
1 a =[ "Foo"*100 , "Bar"*100 , " SpamSpamSpam " *100]2 b = [1 ,2 ,3]3 print sys. getsizeof (a), sys. getsizeof (b)4 # 96 965
Listing 1: getsizeof and containers
P. Przymus 6/53
Basic stuff Notes on memory model Memory profiling tools Notes on malloc() in CPython Summary
Objects interning – fun example
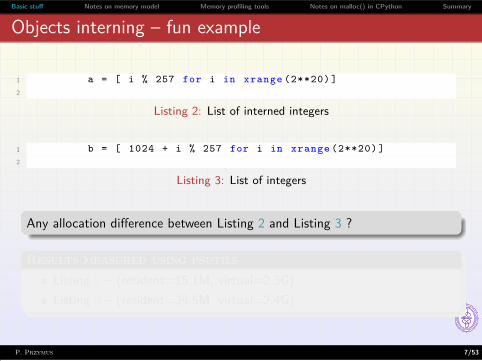
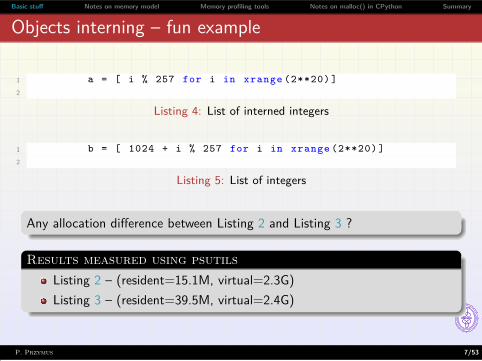
1 a = [ i % 257 for i in xrange (2**20) ]2
Listing 2: List of interned integers
1 b = [ 1024 + i % 257 for i in xrange (2**20) ]2
Listing 3: List of integers
Any allocation difference between Listing 2 and Listing 3 ?
Results measured using psutilsListing 2 – (resident=15.1M, virtual=2.3G)Listing 3 – (resident=39.5M, virtual=2.4G)
P. Przymus 7/53
Basic stuff Notes on memory model Memory profiling tools Notes on malloc() in CPython Summary
Objects interning – fun example
1 a = [ i % 257 for i in xrange (2**20) ]2
Listing 4: List of interned integers
1 b = [ 1024 + i % 257 for i in xrange (2**20) ]2
Listing 5: List of integers
Any allocation difference between Listing 2 and Listing 3 ?
Results measured using psutilsListing 2 – (resident=15.1M, virtual=2.3G)Listing 3 – (resident=39.5M, virtual=2.4G)
P. Przymus 7/53
Basic stuff Notes on memory model Memory profiling tools Notes on malloc() in CPython Summary
Objects interning – explained
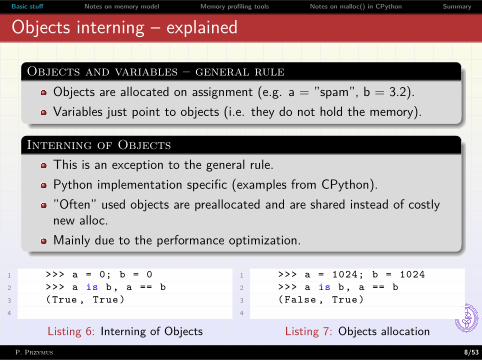
Objects and variables – general ruleObjects are allocated on assignment (e.g. a = ”spam”, b = 3.2).Variables just point to objects (i.e. they do not hold the memory).
Interning of ObjectsThis is an exception to the general rule.Python implementation specific (examples from CPython).”Often” used objects are preallocated and are shared instead of costlynew alloc.Mainly due to the performance optimization.
1 >>> a = 0; b = 02 >>> a is b, a == b3 (True , True)4
Listing 6: Interning of Objects
1 >>> a = 1024; b = 10242 >>> a is b, a == b3 (False , True)4
Listing 7: Objects allocationP. Przymus 8/53
Basic stuff Notes on memory model Memory profiling tools Notes on malloc() in CPython Summary
Objects interning – behind the scenes
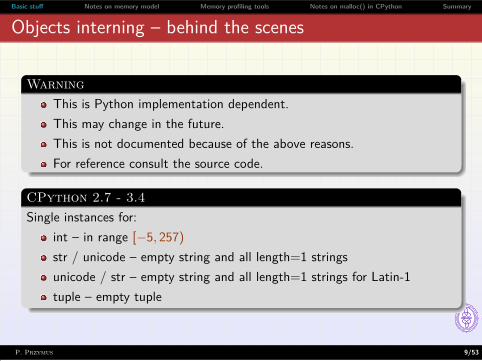
WarningThis is Python implementation dependent.This may change in the future.This is not documented because of the above reasons.For reference consult the source code.
CPython 2.7 - 3.4Single instances for:
int – in range [−5, 257)str / unicode – empty string and all length=1 stringsunicode / str – empty string and all length=1 strings for Latin-1tuple – empty tuple
P. Przymus 9/53
Basic stuff Notes on memory model Memory profiling tools Notes on malloc() in CPython Summary
String interning – example
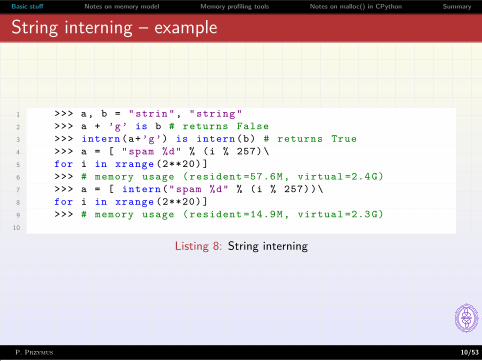
1 >>> a, b = " strin ", " string "2 >>> a + ’g’ is b # returns False3 >>> intern (a+’g’) is intern (b) # returns True4 >>> a = [ "spam %d" % (i % 257)\5 for i in xrange (2**20) ]6 >>> # memory usage ( resident =57.6M, virtual =2.4G)7 >>> a = [ intern ("spam %d" % (i % 257))\8 for i in xrange (2**20) ]9 >>> # memory usage ( resident =14.9M, virtual =2.3G)
10
Listing 8: String interning
P. Przymus 10/53
Basic stuff Notes on memory model Memory profiling tools Notes on malloc() in CPython Summary
String interning – explained
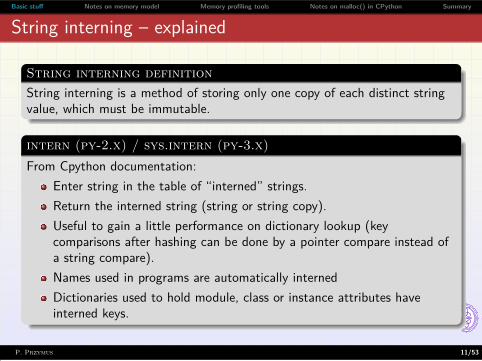
String interning definitionString interning is a method of storing only one copy of each distinct stringvalue, which must be immutable.
intern (py-2.x) / sys.intern (py-3.x)From Cpython documentation:
Enter string in the table of “interned” strings.Return the interned string (string or string copy).Useful to gain a little performance on dictionary lookup (keycomparisons after hashing can be done by a pointer compare instead ofa string compare).Names used in programs are automatically internedDictionaries used to hold module, class or instance attributes haveinterned keys.
P. Przymus 11/53
Basic stuff Notes on memory model Memory profiling tools Notes on malloc() in CPython Summary
String interning – warning
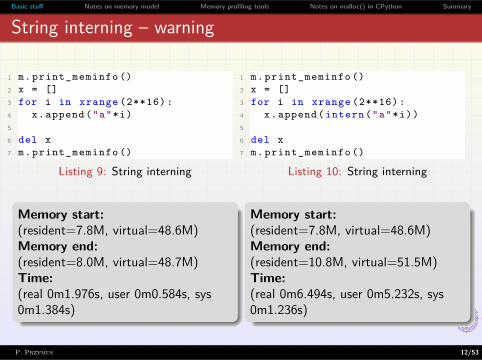
1 m. print_meminfo ()2 x = []3 for i in xrange (2**16) :4 x. append ("a"*i)5
6 del x7 m. print_meminfo ()
Listing 9: String interning
Memory start:(resident=7.8M, virtual=48.6M)Memory end:(resident=8.0M, virtual=48.7M)Time:(real 0m1.976s, user 0m0.584s, sys0m1.384s)
1 m. print_meminfo ()2 x = []3 for i in xrange (2**16) :4 x. append ( intern ("a"*i))5
6 del x7 m. print_meminfo ()
Listing 10: String interning
Memory start:(resident=7.8M, virtual=48.6M)Memory end:(resident=10.8M, virtual=51.5M)Time:(real 0m6.494s, user 0m5.232s, sys0m1.236s)
P. Przymus 12/53

Basic stuff Notes on memory model Memory profiling tools Notes on malloc() in CPython Summary
Notes on memory model
P. Przymus 13/53
Basic stuff Notes on memory model Memory profiling tools Notes on malloc() in CPython Summary
Mutable Containers Memory Allocation Strategy
Plan for growth and shrinkageSlightly overallocate memory needed by container.Leave room to growth.Shrink when overallocation threshold is reached.
Reduce number of expensive function calls:relloc()memcpy()
Use optimal layout.
List, Sets, Dictionaries
P. Przymus 14/53
Basic stuff Notes on memory model Memory profiling tools Notes on malloc() in CPython Summary
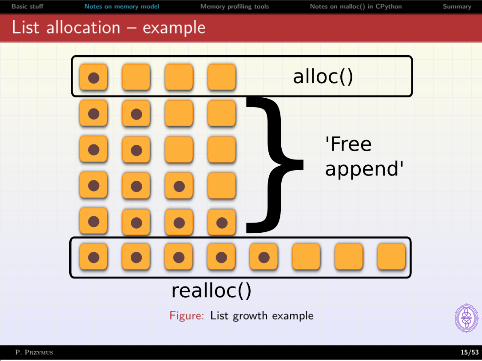
List allocation – example
Figure: List growth example
P. Przymus 15/53
Basic stuff Notes on memory model Memory profiling tools Notes on malloc() in CPython Summary
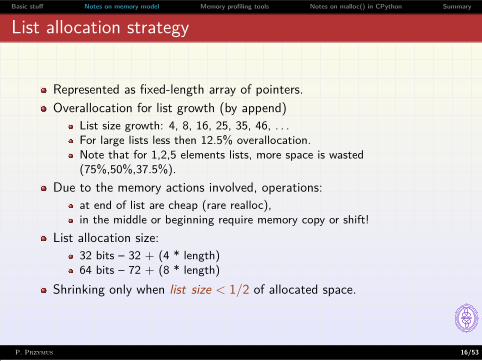
List allocation strategy
Represented as fixed-length array of pointers.Overallocation for list growth (by append)
List size growth: 4, 8, 16, 25, 35, 46, . . .For large lists less then 12.5% overallocation.Note that for 1,2,5 elements lists, more space is wasted(75%,50%,37.5%).
Due to the memory actions involved, operations:at end of list are cheap (rare realloc),in the middle or beginning require memory copy or shift!
List allocation size:32 bits – 32 + (4 * length)64 bits – 72 + (8 * length)
Shrinking only when list size < 1/2 of allocated space.
P. Przymus 16/53
Basic stuff Notes on memory model Memory profiling tools Notes on malloc() in CPython Summary
List allocation strategy - example
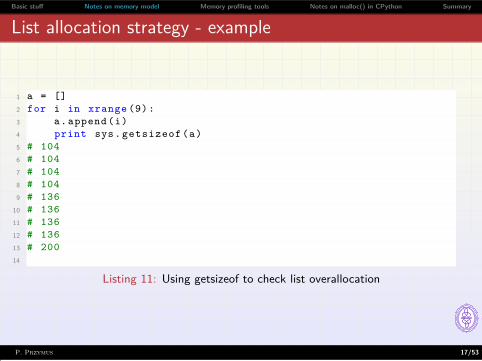
1 a = []2 for i in xrange (9):3 a. append (i)4 print sys. getsizeof (a)5 # 1046 # 1047 # 1048 # 1049 # 136
10 # 13611 # 13612 # 13613 # 20014
Listing 11: Using getsizeof to check list overallocation
P. Przymus 17/53
Basic stuff Notes on memory model Memory profiling tools Notes on malloc() in CPython Summary
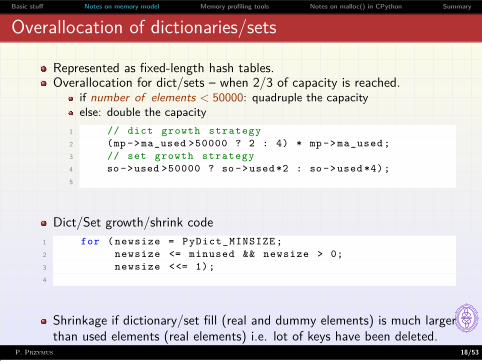
Overallocation of dictionaries/sets
Represented as fixed-length hash tables.Overallocation for dict/sets – when 2/3 of capacity is reached.
if number of elements < 50000: quadruple the capacityelse: double the capacity
1 // dict growth strategy2 (mp ->ma_used >50000 ? 2 : 4) * mp -> ma_used ;3 // set growth strategy4 so ->used >50000 ? so ->used *2 : so ->used *4);5
Dict/Set growth/shrink code1 for ( newsize = PyDict_MINSIZE ;2 newsize <= minused && newsize > 0;3 newsize <<= 1);4
Shrinkage if dictionary/set fill (real and dummy elements) is much largerthan used elements (real elements) i.e. lot of keys have been deleted.
P. Przymus 18/53
Basic stuff Notes on memory model Memory profiling tools Notes on malloc() in CPython Summary
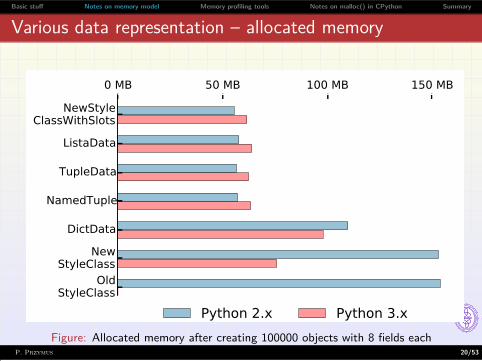
Various data representation
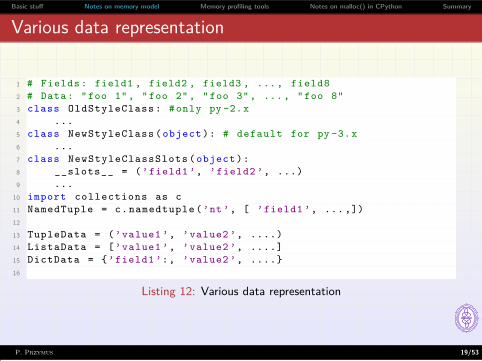
1 # Fields : field1 , field2 , field3 , ... , field82 # Data: "foo 1", "foo 2", "foo 3", ... , "foo 8"3 class OldStyleClass : #only py -2.x4 ...5 class NewStyleClass ( object ): # default for py -3.x6 ...7 class NewStyleClassSlots ( object ):8 __slots__ = (’field1 ’, ’field2 ’, ...)9 ...
10 import collections as c11 NamedTuple = c. namedtuple (’nt ’, [ ’field1 ’, ... ,])12
13 TupleData = (’value1 ’, ’value2 ’, ....)14 ListaData = [’value1 ’, ’value2 ’, ....]15 DictData = {’field1 ’:, ’value2 ’, ....}16
Listing 12: Various data representation
P. Przymus 19/53
Basic stuff Notes on memory model Memory profiling tools Notes on malloc() in CPython Summary
Various data representation – allocated memory
0 MB 50 MB 100 MB 150 MB
OldStyleClass
NewStyleClass
DictData
NamedTuple
TupleData
ListaData
NewStyleClassWithSlots
Python 2.x Python 3.x
Figure: Allocated memory after creating 100000 objects with 8 fields eachP. Przymus 20/53
Basic stuff Notes on memory model Memory profiling tools Notes on malloc() in CPython Summary
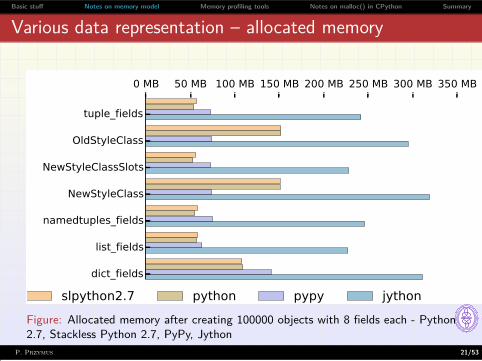
Various data representation – allocated memory
0 MB 50 MB 100 MB 150 MB 200 MB 250 MB 300 MB 350 MB
dict_fields
list_fields
namedtuples_fields
NewStyleClass
NewStyleClassSlots
OldStyleClass
tuple_fields
slpython2.7 python pypy jython
Figure: Allocated memory after creating 100000 objects with 8 fields each - Python2.7, Stackless Python 2.7, PyPy, Jython
P. Przymus 21/53
Basic stuff Notes on memory model Memory profiling tools Notes on malloc() in CPython Summary
Notes on garbage collector, reference count and cycles
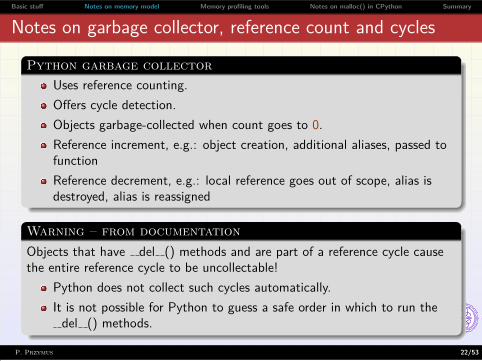
Python garbage collectorUses reference counting.Offers cycle detection.Objects garbage-collected when count goes to 0.Reference increment, e.g.: object creation, additional aliases, passed tofunctionReference decrement, e.g.: local reference goes out of scope, alias isdestroyed, alias is reassigned
Warning – from documentationObjects that have del () methods and are part of a reference cycle causethe entire reference cycle to be uncollectable!
Python does not collect such cycles automatically.It is not possible for Python to guess a safe order in which to run the
del () methods.
P. Przymus 22/53
Basic stuff Notes on memory model Memory profiling tools Notes on malloc() in CPython Summary
Collectable garbage – recipe
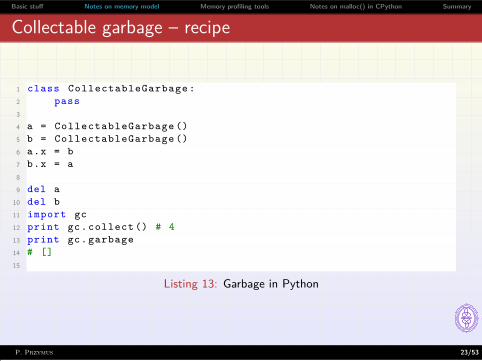
1 class CollectableGarbage :2 pass3
4 a = CollectableGarbage ()5 b = CollectableGarbage ()6 a.x = b7 b.x = a8
9 del a10 del b11 import gc12 print gc. collect () # 413 print gc. garbage14 # []15
Listing 13: Garbage in Python
P. Przymus 23/53
Basic stuff Notes on memory model Memory profiling tools Notes on malloc() in CPython Summary
Uncollectable garbage – recipe
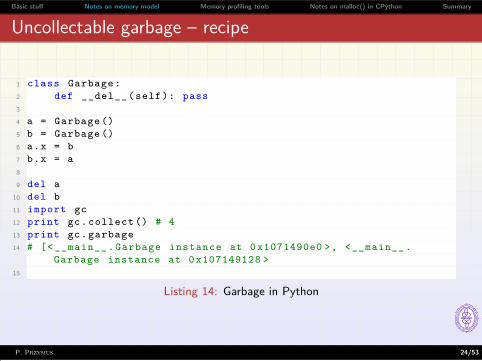
1 class Garbage :2 def __del__ (self): pass3
4 a = Garbage ()5 b = Garbage ()6 a.x = b7 b.x = a8
9 del a10 del b11 import gc12 print gc. collect () # 413 print gc. garbage14 # [< __main__ . Garbage instance at 0 x1071490e0 >, <__main__ .
Garbage instance at 0 x107149128 >15
Listing 14: Garbage in Python
P. Przymus 24/53
Basic stuff Notes on memory model Memory profiling tools Notes on malloc() in CPython Summary
Notes on GC in other Python versions
JythonUses the JVM’s built-in garbage collection – so no need to copy cPython’sreference-counting implementation.
PyPySupports pluggable garbage collectors - so various GC available.Default incminimark which does ”major collections incrementally (i.e.one major collection is split along some number of minor collections,rather than being done all at once after a specific minor collection)”
P. Przymus 25/53

Basic stuff Notes on memory model Memory profiling tools Notes on malloc() in CPython Summary
Memory profiling tools
P. Przymus 26/53
Basic stuff Notes on memory model Memory profiling tools Notes on malloc() in CPython Summary
Tools
timepsutilmemory profilerobjgraphMeliae (could be combined with runsnakerun)HeapyValgrind and Massif (and Massif Visualizer)
P. Przymus 27/53
Basic stuff Notes on memory model Memory profiling tools Notes on malloc() in CPython Summary
Tools – time, simple but useful
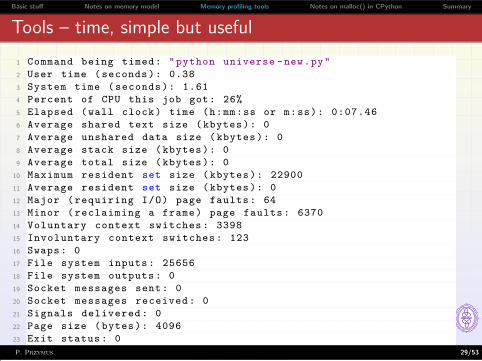
timeSimple but usefulUse ”/usr/bin/time -v” and not ”time” as usually it something different.
Average total (data+stack+text) memory use of the process, inKilobytes.Maximum resident set size of the process during its lifetime, in Kilobytes.See manual for more.
P. Przymus 28/53
Basic stuff Notes on memory model Memory profiling tools Notes on malloc() in CPython Summary
Tools – time, simple but useful1 Command being timed : " python universe -new.py"2 User time ( seconds ): 0.383 System time ( seconds ): 1.614 Percent of CPU this job got: 26%5 Elapsed (wall clock ) time (h:mm:ss or m:ss): 0:07.466 Average shared text size ( kbytes ): 07 Average unshared data size ( kbytes ): 08 Average stack size ( kbytes ): 09 Average total size ( kbytes ): 0
10 Maximum resident set size ( kbytes ): 2290011 Average resident set size ( kbytes ): 012 Major ( requiring I/O) page faults : 6413 Minor ( reclaiming a frame ) page faults : 637014 Voluntary context switches : 339815 Involuntary context switches : 12316 Swaps : 017 File system inputs : 2565618 File system outputs : 019 Socket messages sent: 020 Socket messages received : 021 Signals delivered : 022 Page size ( bytes ): 409623 Exit status : 0
Listing 15: ResultsP. Przymus 29/53
Basic stuff Notes on memory model Memory profiling tools Notes on malloc() in CPython Summary
Tools – psutil
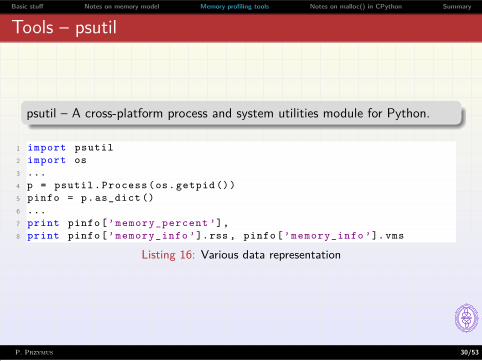
psutil – A cross-platform process and system utilities module for Python.
1 import psutil2 import os3 ...4 p = psutil . Process (os. getpid ())5 pinfo = p. as_dict ()6 ...7 print pinfo [’memory_percent ’],8 print pinfo [’memory_info ’].rss , pinfo [’memory_info ’]. vms
Listing 16: Various data representation
P. Przymus 30/53
Basic stuff Notes on memory model Memory profiling tools Notes on malloc() in CPython Summary
Tools – memory profiler
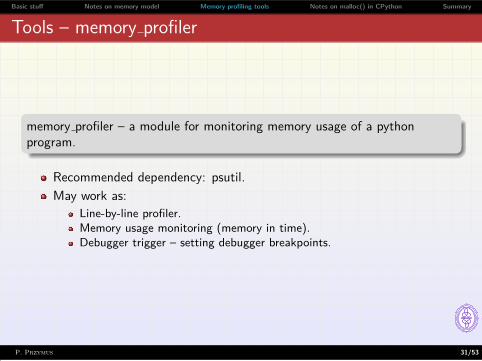
memory profiler – a module for monitoring memory usage of a pythonprogram.
Recommended dependency: psutil.May work as:
Line-by-line profiler.Memory usage monitoring (memory in time).Debugger trigger – setting debugger breakpoints.
P. Przymus 31/53
Basic stuff Notes on memory model Memory profiling tools Notes on malloc() in CPython Summary
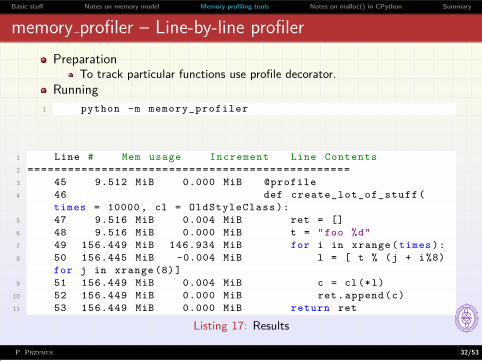
memory profiler – Line-by-line profilerPreparation
To track particular functions use profile decorator.Running
1 python -m memory_profiler
1 Line # Mem usage Increment Line Contents2 ================================================3 45 9.512 MiB 0.000 MiB @profile4 46 def create_lot_of_stuff (
times = 10000 , cl = OldStyleClass ):5 47 9.516 MiB 0.004 MiB ret = []6 48 9.516 MiB 0.000 MiB t = "foo %d"7 49 156.449 MiB 146.934 MiB for i in xrange ( times ):8 50 156.445 MiB -0.004 MiB l = [ t % (j + i%8)
for j in xrange (8)]9 51 156.449 MiB 0.004 MiB c = cl (*l)
10 52 156.449 MiB 0.000 MiB ret. append (c)11 53 156.449 MiB 0.000 MiB return ret
Listing 17: Results
P. Przymus 32/53
Basic stuff Notes on memory model Memory profiling tools Notes on malloc() in CPython Summary
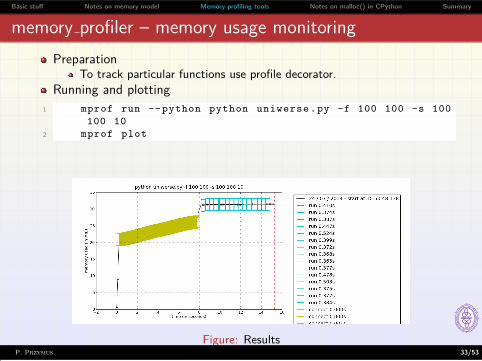
memory profiler – memory usage monitoringPreparation
To track particular functions use profile decorator.Running and plotting
1 mprof run --python python uniwerse .py -f 100 100 -s 100100 10
2 mprof plot
Figure: ResultsP. Przymus 33/53
Basic stuff Notes on memory model Memory profiling tools Notes on malloc() in CPython Summary
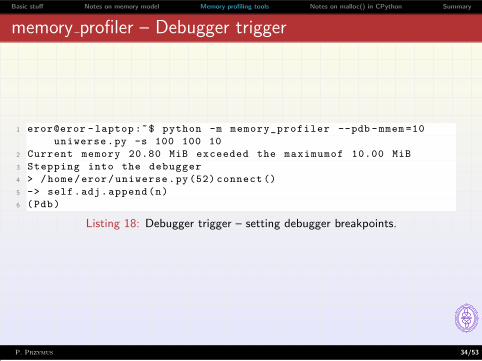
memory profiler – Debugger trigger
1 eror@eror - laptop :˜$ python -m memory_profiler --pdb -mmem =10uniwerse .py -s 100 100 10
2 Current memory 20.80 MiB exceeded the maximumof 10.00 MiB3 Stepping into the debugger4 > /home/eror/ uniwerse .py (52) connect ()5 -> self.adj. append (n)6 (Pdb)
Listing 18: Debugger trigger – setting debugger breakpoints.
P. Przymus 34/53
Basic stuff Notes on memory model Memory profiling tools Notes on malloc() in CPython Summary
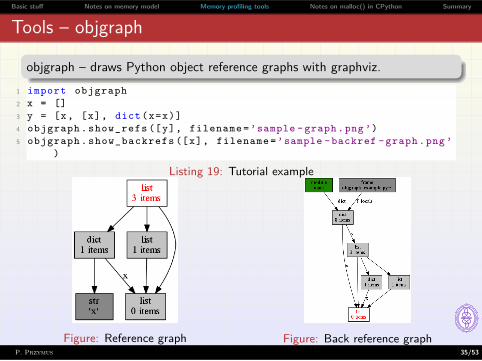
Tools – objgraph
objgraph – draws Python object reference graphs with graphviz.1 import objgraph2 x = []3 y = [x, [x], dict(x=x)]4 objgraph . show_refs ([y], filename =’sample - graph .png ’)5 objgraph . show_backrefs ([x], filename =’sample -backref - graph .png ’
)
Listing 19: Tutorial example
Figure: Reference graph Figure: Back reference graphP. Przymus 35/53
Basic stuff Notes on memory model Memory profiling tools Notes on malloc() in CPython Summary
Tools – Heapy/Meliae
HeapyThe heap analysis toolset. It can be used to find information about theobjects in the heap and display the information in various ways.
part of ”Guppy-PE – A Python Programming Environment”
MeliaePython Memory Usage Analyzer
”This project is similar to heapy (in the ’guppy’ project), in its attemptto understand how memory has been allocated.”runsnakerun GUI support.
P. Przymus 36/53
Basic stuff Notes on memory model Memory profiling tools Notes on malloc() in CPython Summary
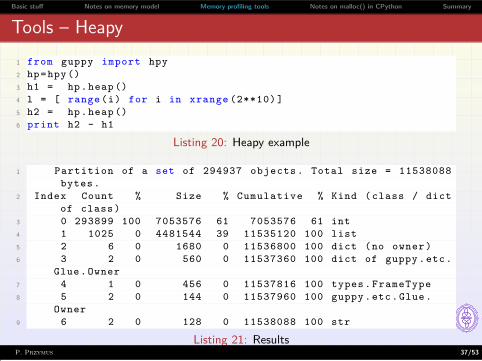
Tools – Heapy1 from guppy import hpy2 hp=hpy ()3 h1 = hp.heap ()4 l = [ range (i) for i in xrange (2**10) ]5 h2 = hp.heap ()6 print h2 - h1
Listing 20: Heapy example
1 Partition of a set of 294937 objects . Total size = 11538088bytes .
2 Index Count % Size % Cumulative % Kind ( class / dictof class )
3 0 293899 100 7053576 61 7053576 61 int4 1 1025 0 4481544 39 11535120 100 list5 2 6 0 1680 0 11536800 100 dict (no owner )6 3 2 0 560 0 11537360 100 dict of guppy .etc.
Glue. Owner7 4 1 0 456 0 11537816 100 types . FrameType8 5 2 0 144 0 11537960 100 guppy .etc.Glue.
Owner9 6 2 0 128 0 11538088 100 str
Listing 21: ResultsP. Przymus 37/53
Basic stuff Notes on memory model Memory profiling tools Notes on malloc() in CPython Summary
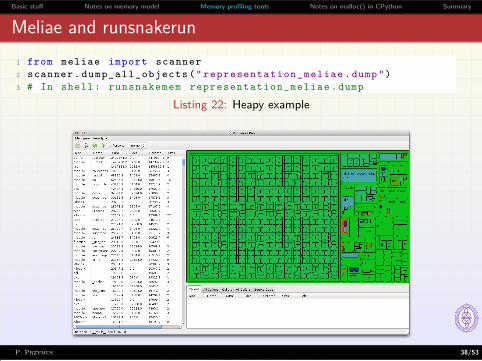
Meliae and runsnakerun1 from meliae import scanner2 scanner . dump_all_objects (" representation_meliae .dump")3 # In shell : runsnakemem representation_meliae .dump
Listing 22: Heapy example
Figure: Meliae and runsnakerunP. Przymus 38/53
Basic stuff Notes on memory model Memory profiling tools Notes on malloc() in CPython Summary
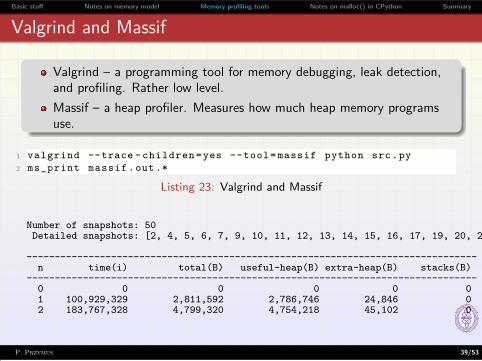
Valgrind and Massif
Valgrind – a programming tool for memory debugging, leak detection,and profiling. Rather low level.Massif – a heap profiler. Measures how much heap memory programsuse.
1 valgrind --trace - children =yes --tool= massif python src.py2 ms_print massif .out .*
Listing 23: Valgrind and Massif
Number of snapshots: 50Detailed snapshots: [2, 4, 5, 6, 7, 9, 10, 11, 12, 13, 14, 15, 16, 17, 19, 20, 26, 27, 28, 29, 30, 31, 32, 35, 36, 37, 38, 39, 40, 41, 42, 43, 45, 46, 47, 48 (peak)]
--------------------------------------------------------------------------------n time(i) total(B) useful-heap(B) extra-heap(B) stacks(B)
--------------------------------------------------------------------------------0 0 0 0 0 01 100,929,329 2,811,592 2,786,746 24,846 02 183,767,328 4,799,320 4,754,218 45,102 0
P. Przymus 39/53
Basic stuff Notes on memory model Memory profiling tools Notes on malloc() in CPython Summary
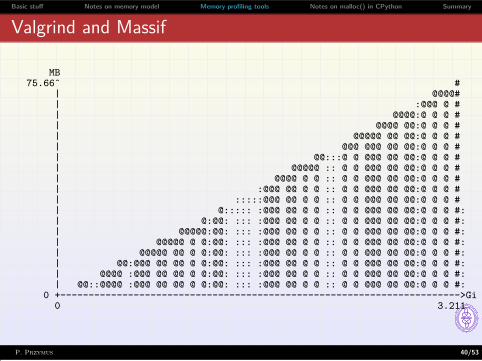
Valgrind and Massif
MB75.66ˆ #
| @@@@#| :@@@ @ #| @@@@:@ @ @ #| @@@@ @@:@ @ @ #| @@@@@ @@ @@:@ @ @ #| @@@ @@@ @@ @@:@ @ @ #| @@:::@ @ @@@ @@ @@:@ @ @ #| @@@@@ :: @ @ @@@ @@ @@:@ @ @ #| @@@@ @ @ :: @ @ @@@ @@ @@:@ @ @ #| :@@@ @@ @ @ :: @ @ @@@ @@ @@:@ @ @ #| :::::@@@ @@ @ @ :: @ @ @@@ @@ @@:@ @ @ #| @::::: :@@@ @@ @ @ :: @ @ @@@ @@ @@:@ @ @ #:| @:@@: ::: :@@@ @@ @ @ :: @ @ @@@ @@ @@:@ @ @ #:| @@@@@:@@: ::: :@@@ @@ @ @ :: @ @ @@@ @@ @@:@ @ @ #:| @@@@@ @ @:@@: ::: :@@@ @@ @ @ :: @ @ @@@ @@ @@:@ @ @ #:| @@@@@ @@ @ @:@@: ::: :@@@ @@ @ @ :: @ @ @@@ @@ @@:@ @ @ #:| @@:@@@ @@ @@ @ @:@@: ::: :@@@ @@ @ @ :: @ @ @@@ @@ @@:@ @ @ #:| @@@@ :@@@ @@ @@ @ @:@@: ::: :@@@ @@ @ @ :: @ @ @@@ @@ @@:@ @ @ #:| @@::@@@@ :@@@ @@ @@ @ @:@@: ::: :@@@ @@ @ @ :: @ @ @@@ @@ @@:@ @ @ #:
0 +----------------------------------------------------------------------->Gi0 3.211
P. Przymus 40/53
Basic stuff Notes on memory model Memory profiling tools Notes on malloc() in CPython Summary
Massif Visualizer
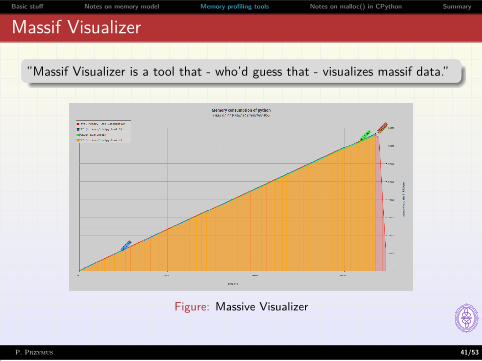
”Massif Visualizer is a tool that - who’d guess that - visualizes massif data.”
Figure: Massive Visualizer
P. Przymus 41/53
Basic stuff Notes on memory model Memory profiling tools Notes on malloc() in CPython Summary
Other useful tools
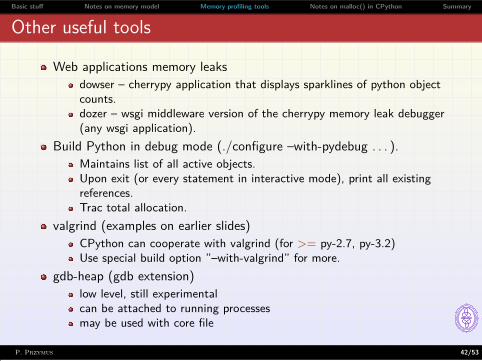
Web applications memory leaksdowser – cherrypy application that displays sparklines of python objectcounts.dozer – wsgi middleware version of the cherrypy memory leak debugger(any wsgi application).
Build Python in debug mode (./configure –with-pydebug . . . ).Maintains list of all active objects.Upon exit (or every statement in interactive mode), print all existingreferences.Trac total allocation.
valgrind (examples on earlier slides)CPython can cooperate with valgrind (for >= py-2.7, py-3.2)Use special build option ”–with-valgrind” for more.
gdb-heap (gdb extension)low level, still experimentalcan be attached to running processesmay be used with core file
P. Przymus 42/53
Basic stuff Notes on memory model Memory profiling tools Notes on malloc() in CPython Summary
Notes on malloc() in CPython
P. Przymus 43/53
Basic stuff Notes on memory model Memory profiling tools Notes on malloc() in CPython Summary
Notes on malloc allocation
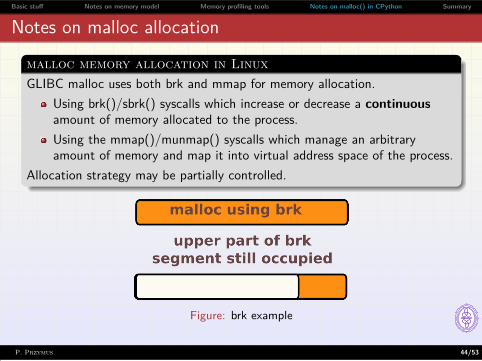
malloc memory allocation in LinuxGLIBC malloc uses both brk and mmap for memory allocation.
Using brk()/sbrk() syscalls which increase or decrease a continuousamount of memory allocated to the process.Using the mmap()/munmap() syscalls which manage an arbitraryamount of memory and map it into virtual address space of the process.
Allocation strategy may be partially controlled.
Figure: brk example
P. Przymus 44/53
Basic stuff Notes on memory model Memory profiling tools Notes on malloc() in CPython Summary
Notes on malloc() in CPython
Current CPython implementations are not affected
Example warningFollowing example
Did not affect all OS e.q.there are examples of vulnerable Linux configurations,on the other hand Mac OS X was not affected.
Probably is effectively eliminated (won’t affect modern systems).
P. Przymus 45/53
Basic stuff Notes on memory model Memory profiling tools Notes on malloc() in CPython Summary
Notes on malloc() in CPython
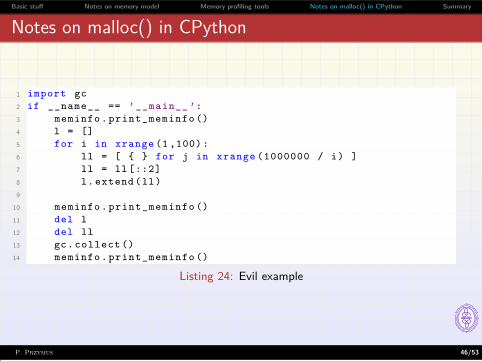
1 import gc2 if __name__ == ’__main__ ’:3 meminfo . print_meminfo ()4 l = []5 for i in xrange (1 ,100):6 ll = [ { } for j in xrange (1000000 / i) ]7 ll = ll [::2]8 l. extend (ll)9
10 meminfo . print_meminfo ()11 del l12 del ll13 gc. collect ()14 meminfo . print_meminfo ()
Listing 24: Evil example
P. Przymus 46/53
Basic stuff Notes on memory model Memory profiling tools Notes on malloc() in CPython Summary
Notes on malloc() in CPython
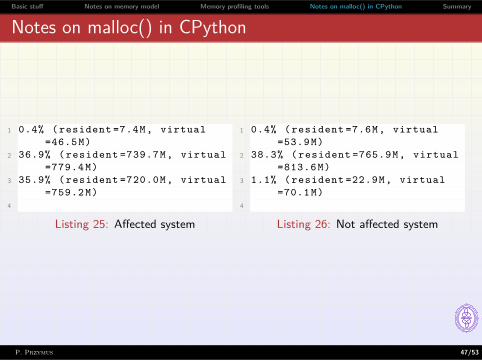
1 0.4% ( resident =7.4M, virtual=46.5 M)
2 36.9% ( resident =739.7M, virtual=779.4 M)
3 35.9% ( resident =720.0M, virtual=759.2 M)
4
Listing 25: Affected system
1 0.4% ( resident =7.6M, virtual=53.9 M)
2 38.3% ( resident =765.9M, virtual=813.6 M)
3 1.1% ( resident =22.9M, virtual=70.1 M)
4
Listing 26: Not affected system
P. Przymus 47/53
Basic stuff Notes on memory model Memory profiling tools Notes on malloc() in CPython Summary
malloc() alternatives – libjemalloc and libtcmalloc
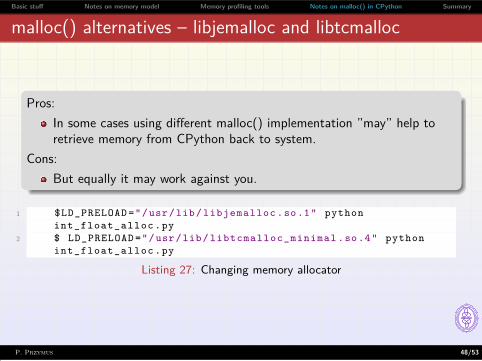
Pros:In some cases using different malloc() implementation ”may” help toretrieve memory from CPython back to system.
Cons:But equally it may work against you.
1 $LD_PRELOAD ="/usr/lib/ libjemalloc .so .1" pythonint_float_alloc .py
2 $ LD_PRELOAD ="/usr/lib/ libtcmalloc_minimal .so .4" pythonint_float_alloc .py
Listing 27: Changing memory allocator
P. Przymus 48/53

Basic stuff Notes on memory model Memory profiling tools Notes on malloc() in CPython Summary
Caution: Notes on malloc() alternatives
Things to keep in mindmalloc() alternatives will use different memory allocation strategieswhich may drastically change memory consumption of Your program.When considering malloc replacement:
Check memory usage at various checkpoints.Check the minimum and maximum memory consumption betweencontrol points!Compare performance (as this may also change).
P. Przymus 49/53
Basic stuff Notes on memory model Memory profiling tools Notes on malloc() in CPython Summary
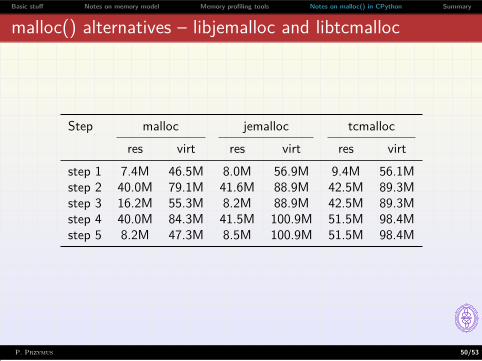
malloc() alternatives – libjemalloc and libtcmalloc
Step malloc jemalloc tcmallocres virt res virt res virt
step 1 7.4M 46.5M 8.0M 56.9M 9.4M 56.1Mstep 2 40.0M 79.1M 41.6M 88.9M 42.5M 89.3Mstep 3 16.2M 55.3M 8.2M 88.9M 42.5M 89.3Mstep 4 40.0M 84.3M 41.5M 100.9M 51.5M 98.4Mstep 5 8.2M 47.3M 8.5M 100.9M 51.5M 98.4M
P. Przymus 50/53
Basic stuff Notes on memory model Memory profiling tools Notes on malloc() in CPython Summary
Summary
P. Przymus 51/53
Basic stuff Notes on memory model Memory profiling tools Notes on malloc() in CPython Summary
Summary
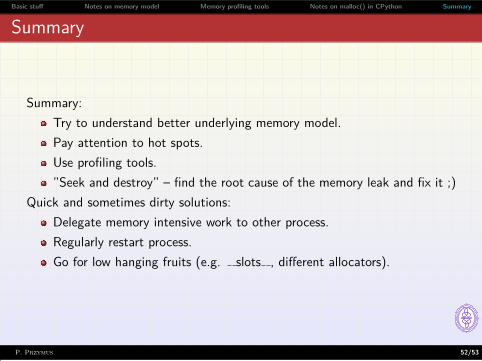
Summary:Try to understand better underlying memory model.Pay attention to hot spots.Use profiling tools.”Seek and destroy” – find the root cause of the memory leak and fix it ;)
Quick and sometimes dirty solutions:Delegate memory intensive work to other process.Regularly restart process.Go for low hanging fruits (e.g. slots , different allocators).
P. Przymus 52/53
Basic stuff Notes on memory model Memory profiling tools Notes on malloc() in CPython Summary
References
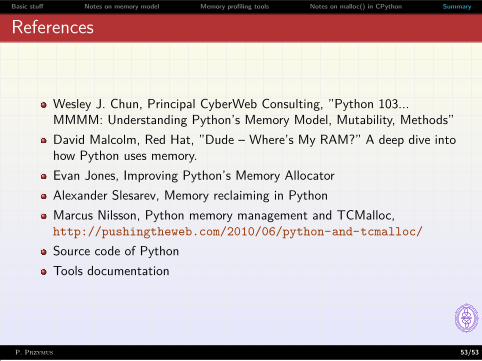
Wesley J. Chun, Principal CyberWeb Consulting, ”Python 103...MMMM: Understanding Python’s Memory Model, Mutability, Methods”David Malcolm, Red Hat, ”Dude – Where’s My RAM?” A deep dive intohow Python uses memory.Evan Jones, Improving Python’s Memory AllocatorAlexander Slesarev, Memory reclaiming in PythonMarcus Nilsson, Python memory management and TCMalloc,http://pushingtheweb.com/2010/06/python-and-tcmalloc/
Source code of PythonTools documentation
P. Przymus 53/53