Embed Size (px)
Citation preview
EPM Add-in for Microsoft Office User Guide■ SAP BusinessObjects EPM solutions, add-in for Microsoft Office 10.0
2013-01-30
© 2012 SAP AG. All rights reserved.SAP, R/3, SAP NetWeaver, Duet, PartnerEdge, ByDesign, SAPBusinessObjects Explorer, StreamWork, SAP HANA and other SAP products and services mentioned
Copyright
herein as well as their respective logos are trademarks or registered trademarks of SAP AG inGermany and other countries.Business Objects and the Business Objects logo, BusinessObjects,Crystal Reports, Crystal Decisions, Web Intelligence, Xcelsius, and other Business Objects productsand services mentioned herein as well as their respective logos are trademarks or registeredtrademarks of Business Objects Software Ltd. Business Objects is an SAP company.Sybase andAdaptive Server, iAnywhere, Sybase 365, SQL Anywhere, and other Sybase products and servicesmentioned herein as well as their respective logos are trademarks or registered trademarks of Sybase,Inc. Sybase is an SAP company. Crossgate, m@gic EDDY, B2B 360°, B2B 360° Services areregistered trademarks of Crossgate AG in Germany and other countries. Crossgate is an SAPcompany. All other product and service names mentioned are the trademarks of their respectivecompanies. Data contained in this document serves informational purposes only. National productspecifications may vary.These materials are subject to change without notice. These materials areprovided by SAP AG and its affiliated companies ("SAP Group") for informational purposes only,without representation or warranty of any kind, and SAP Group shall not be liable for errors oromissions with respect to the materials. The only warranties for SAP Group products and servicesare those that are set forth in the express warranty statements accompanying such products andservices, if any. Nothing herein should be construed as constituting an additional warranty.
2013-01-30
Contents
What's New...........................................................................................................................15Chapter 1
What's New in Support Package 13 Documentation..............................................................151.1What's New in Support Package 13 Patch 02 Documentation ..............................................161.2
Introduction to the EPM Add-in.............................................................................................19Chapter 2
Installation and Update.........................................................................................................21Chapter 3
Installation..............................................................................................................................213.1Update...................................................................................................................................213.2Re-activating the EPM Add-In ................................................................................................223.3
Logon and Connections........................................................................................................23Chapter 4
Logging On and Off................................................................................................................234.1Connection Management.......................................................................................................244.2Active Connection for the Current Sheet...............................................................................244.3Types of Connections............................................................................................................254.4Selecting Connections...........................................................................................................264.5Selectively connecting or disconnecting sheet/connection pairs ...........................................274.6
Large Volume Data Sources.................................................................................................29Chapter 5
About the EPM add-in Interface............................................................................................33Chapter 6
Main Interface Areas..............................................................................................................336.1Performing Actions without the Mouse..................................................................................346.2Using Microsoft Office 2003..................................................................................................346.3
Features Available.................................................................................................................37Chapter 7
Security on Data or Members...............................................................................................39Chapter 8
Security on Data (Planning and Consolidation, version for SAP NetWeaver)..........................398.1
2013-01-303
Open and Save a File............................................................................................................41Chapter 9
Open a Report when Dimensions or Members have Changed...............................................419.1Open a File from a Web Portal ..............................................................................................429.2Open and Save a File for Planning and Consolidation.............................................................439.3Open and Save Connection ..................................................................................................439.3.1Open Actions.........................................................................................................................449.3.2Save Actions..........................................................................................................................459.3.3Open and Save Dialog Box Description and Actions .............................................................469.3.4Server Folder Structure..........................................................................................................469.3.5
Context..................................................................................................................................49Chapter 10
Context Favorites...................................................................................................................5010.1Context Display Options........................................................................................................5110.2
Report Layout Rules..............................................................................................................53Chapter 11
Overall Layout Rules .............................................................................................................5311.1Basic Layout Rules................................................................................................................5411.1.1Dimension Layout Restrictions...............................................................................................5511.1.2Page Axis...............................................................................................................................5611.2Row Axis................................................................................................................................5611.3Simple Row Axis....................................................................................................................5711.3.1Multidimensional or Nested Row Axis....................................................................................5711.3.2Asymmetric Row Axis............................................................................................................5911.3.3Row Axis Restrictions............................................................................................................6011.3.4Column Axis...........................................................................................................................6111.4Simple Column Axis...............................................................................................................6211.4.1Multidimensional or Nested Column Axis ..............................................................................6211.4.2Asymmetric Column Axis ......................................................................................................6311.4.3Column Axis Restrictions ......................................................................................................6411.4.4Data Grid Considerations.......................................................................................................6411.5Data Grid Important Tips........................................................................................................6611.5.1
Report Creation ....................................................................................................................67Chapter 12
Member Identification and Properties.....................................................................................6712.1Member Identification.............................................................................................................6712.1.1Member Properties................................................................................................................6812.1.2Report Creation using the EPM Pane.....................................................................................6812.2Report Creation using the Report Editor.................................................................................7012.3Report Editor's Layout Tab Presentation................................................................................7112.3.1
2013-01-304
Contents
Dimension Placement in the Report Editor.............................................................................7212.3.2Member Selection in the Report Editor...................................................................................7312.3.3Position of each Dimension in the Page Axis using the Report Editor.....................................7412.3.4Report Move in the Sheet using the Report Editor.................................................................7412.3.5Shift Insertion Between the Data Grid of the Report and its Row and Column Axis................7412.3.6Report Creation Directly in a Sheet........................................................................................7512.4Member Recognition..............................................................................................................7512.4.1Member Entry Using the Member Selector............................................................................7912.4.2Member Entry Using the Member Selector (on Large Volume Data Sources)........................8812.4.3Member Entry Using the Insert Members Dialog Box.............................................................9012.4.4Report Creation using Copy/Paste........................................................................................9212.5
Asymmetric Report Creation.................................................................................................93Chapter 13
Ownership-based Hierarchies...............................................................................................95Chapter 14
Time-Dependent Hierarchies................................................................................................97Chapter 15
Actions and Options Specific to the Current Report.............................................................99Chapter 16
Report Options......................................................................................................................9916.1Freeze Data Refresh............................................................................................................10016.1.1Display only Base Level Data...............................................................................................10016.1.2Do not Store Connection and Do not Store Environment in the Connection.........................10016.1.3Data Sorting, Ranking and Filtering .....................................................................................10116.2Data Sorting ........................................................................................................................10116.2.1Data Filtering .......................................................................................................................10316.2.2Data Ranking.......................................................................................................................10516.2.3Read-only Data....................................................................................................................10616.3Local Members....................................................................................................................10616.4Local Member Automatically Detected.................................................................................10816.4.1Local Member Creation........................................................................................................10916.4.2Local Members - Examples..................................................................................................11116.4.3Renaming Members.............................................................................................................11516.5Excluding Members..............................................................................................................11516.6Member Insertion Filtering....................................................................................................11616.7Microsoft Excel Features for Report Layout.........................................................................11616.8
Several Reports in a Sheet .................................................................................................117Chapter 17
Restrictions with Several Reports in a Sheet........................................................................11817.1
2013-01-305
Contents
Report Highlight ..................................................................................................................11917.2Delete Reports ...................................................................................................................11917.3
Report Refresh ...................................................................................................................121Chapter 18
Refreshing Reports..............................................................................................................12218.1
User Options.......................................................................................................................125Chapter 19
Sheet Options.....................................................................................................................129Chapter 20
General Sheet Options........................................................................................................12920.1Expand Options....................................................................................................................12920.1.1Use as Input Form................................................................................................................13020.1.2Member Recognition Activation...........................................................................................13020.1.3EPM Worksheet...................................................................................................................13120.1.4Totals Placement .................................................................................................................13120.1.5No Data and Zero Values.....................................................................................................13320.1.6Show as Microsoft Excel Comments....................................................................................13420.1.7Formatting Sheet Options....................................................................................................13520.2Row Header Indentation ......................................................................................................13520.2.1Display Name.......................................................................................................................13620.2.2Auto Fit Column Width.........................................................................................................13620.2.3Repeat Row Headers and Repeat Column Headers.............................................................13720.2.4Empty Cell Default Value .....................................................................................................13720.2.5Member not Found Default Value.........................................................................................13820.2.6Apply Dynamic Formatting...................................................................................................13820.2.7Refresh Sheet Options.........................................................................................................13920.3Keep Formula on Data and Show Source Data in Comments ..............................................13920.3.1Calculate Parents in Hierarchies...........................................................................................13920.3.2Refresh Data on the Whole File when Opening it.................................................................14020.3.3Clear Data on the Whole File when Saving it........................................................................14120.3.4Show Unauthorized Cell Text ..............................................................................................14120.3.5Apply only Report Editor Definition for Faster Refresh..........................................................14120.3.6Restore Dynamic Selection on Refresh after Navigation......................................................14220.3.7Keep Formulas Static that Reference Report Cells .............................................................14220.3.8
Report Navigation...............................................................................................................145Chapter 21
Going Back in the Navigation Actions..................................................................................14521.1Row and Column Axes Switch.............................................................................................14621.2Expand.................................................................................................................................14621.3Expand on Nested Axis........................................................................................................14821.3.1
2013-01-306
Contents
Collapse...............................................................................................................................15021.4Collapse on Nested Axis......................................................................................................15121.4.1Keep Member......................................................................................................................15321.5Exclude Member..................................................................................................................15421.6Double-Click Actions............................................................................................................15621.7
Drill-Through.......................................................................................................................157Chapter 22
Quick Links.........................................................................................................................161Chapter 23
Creating Quick Links............................................................................................................16223.1Deleting Quick Links............................................................................................................16223.2
Custom Members................................................................................................................163Chapter 24
Creating custom members...................................................................................................16424.1Custom Members Order......................................................................................................16524.2Modifying Custom Members................................................................................................16724.3Enabling or Disabling all the Custom Members Defined for a Sheet/Connection .................16724.4Deleting Custom Members .................................................................................................16724.5Custom Members Export.....................................................................................................16824.6Exporting Custom Members.................................................................................................16824.6.1Custom Members Import.....................................................................................................16924.7Importing Custom Members ................................................................................................17024.7.1
Flash Objects......................................................................................................................171Chapter 25
Flash Object Creation, using EPM Connector......................................................................17125.1Connections and Operations................................................................................................17225.1.1Creating a Connection in Dashboard Design........................................................................17325.1.2Retrieve Data Using a Report...............................................................................................17425.1.3Retrieve Databases/Environments/InfoAreas ......................................................................17525.1.4Retrieve Cubes/Models/InfoProviders ................................................................................17625.1.5Retrieve Dimensions ...........................................................................................................17725.1.6Retrieve Dimension Members/Characteristic Values ..........................................................17825.1.7Input Data............................................................................................................................17925.1.8Retrieve Business Process Flows........................................................................................18025.1.9Retrieve Context..................................................................................................................18125.1.10Retrieve Text from Documents View....................................................................................18225.1.11Retrieve Members Property Values.....................................................................................18325.1.12Flash Object Insertion..........................................................................................................18425.2
2013-01-307
Contents
Dynamic Charts .................................................................................................................185Chapter 26
Dynamic Formatting............................................................................................................187Chapter 27
Dynamic Formatting Template Definition..............................................................................18727.1Defining a Dynamic Formatting Template ............................................................................19027.1.1Dynamic Formatting Applied to a Worksheet or to a Specific Report...................................19027.2Applying a Default Dynamic Formatting Template to the Worksheet....................................19127.2.1Applying a Default Dynamic Formatting Template to a report...............................................19127.2.2
Workbook Sheet Automatic Generation..............................................................................193Chapter 28
Offline Mode.......................................................................................................................195Chapter 29
Worksheet Protection.........................................................................................................197Chapter 30
Collaboration.......................................................................................................................199Chapter 31
Report Publication to a Web Portal.......................................................................................19931.1Publication and Distribution Connection...............................................................................20031.2Book Publication .................................................................................................................20031.2.1Distribution and Data Collection...........................................................................................21031.2.2
EPM Functions....................................................................................................................219Chapter 32
EPMUser.............................................................................................................................22232.1EPMServer..........................................................................................................................22232.2EPMEnvDatabaseDesc........................................................................................................22332.3EPMEnvDatabaseID.............................................................................................................22332.4EPMModelCubeID...............................................................................................................22432.5EPMModelCubeDesc..........................................................................................................22432.6Functions on Reports...........................................................................................................22532.7EPMDimensionOverride.......................................................................................................22532.7.1EPMAxisOverride.................................................................................................................22832.7.2EPMCopyRange...................................................................................................................22932.7.3EPMInsertCellsBeforeAfterBlock.........................................................................................23032.7.4EPMMemberID....................................................................................................................23132.7.5EPMReportOptions..............................................................................................................23132.7.6EPMMemberSortingOverride...............................................................................................23332.7.7EPMReadOnlyData..............................................................................................................23432.7.8EPMReportID.......................................................................................................................23432.8
2013-01-308
Contents
EPMFullContext...................................................................................................................23532.9EPMContextMember...........................................................................................................23532.10EPMDimensionProperty.......................................................................................................23632.11EPMDimensionPropertyValues............................................................................................23732.12EPMMemberDesc................................................................................................................23832.13EPMMemberProperty..........................................................................................................23932.14EPMMemberOffset..............................................................................................................23932.15EPMSelectMember..............................................................................................................24032.16EPMCellRanges...................................................................................................................24132.17EPMRefreshTime.................................................................................................................24232.18EPMScaleData.....................................................................................................................24232.19EPMRetrieveData................................................................................................................24332.20EPMDimensionList...............................................................................................................24432.21EPMSaveComment..............................................................................................................24532.22EPMSaveData......................................................................................................................24632.23EPMSaveDataOnly..............................................................................................................24732.24EPMWorkStatus..................................................................................................................24832.25EPMComparison..................................................................................................................24932.26EPMDimensionType.............................................................................................................25032.27EPMCommentFullContext....................................................................................................25132.28EPMCommentPartialContext................................................................................................25232.29EPMURL..............................................................................................................................25332.30EPMBook.............................................................................................................................25632.31EPMLink..............................................................................................................................25732.32EPMPathLink.......................................................................................................................25832.33EPMDocumentList...............................................................................................................26032.34EPMDocument.....................................................................................................................26132.35EPMCellContextDocument..................................................................................................26132.36EPMExecuteAPI...................................................................................................................26232.37
Data Input and Save............................................................................................................265Chapter 33
Data Input............................................................................................................................26533.1Planning Features.................................................................................................................26633.2Spread.................................................................................................................................26733.2.1Trend...................................................................................................................................26733.2.2Weight.................................................................................................................................26833.2.3Comments...........................................................................................................................26833.3Comment Creation and Modification....................................................................................26933.3.1Comment Display in a Cell...................................................................................................27033.3.2Comment Search.................................................................................................................27133.3.3Data Save............................................................................................................................27233.4
2013-01-309
Contents
Data Validation.....................................................................................................................27333.5Work Status.........................................................................................................................27433.6
Accessing Journals.............................................................................................................275Chapter 34
Business Process Flows.....................................................................................................277Chapter 35
Report and Input Form Templates.......................................................................................279Chapter 36
Other Features....................................................................................................................281Chapter 37
Metadata Cache..................................................................................................................28137.1Log File................................................................................................................................28237.2Information on Cubes ..........................................................................................................28237.3MDX Display........................................................................................................................28337.4
EPM Add-in for Microsoft Office Word and PowerPoint.....................................................285Chapter 38
Common Features to the Add-in for Microsoft Office Excel, Word and PowerPoint .............28538.1Additional Features in the Add-in for Microsoft Office Word and PowerPoint ......................28638.2Options in the Add-in for Microsoft Office Word and PowerPoint ........................................28738.3
Data Manager.....................................................................................................................289Chapter 39
About Data Manager............................................................................................................28939.1About Data Manager............................................................................................................28939.1.1Standard Packages..............................................................................................................29139.2Standard Data Management Packages................................................................................29139.2.1Financial Process Packages ................................................................................................29839.2.2System Administration Packages.........................................................................................29839.2.3Additional Packages.............................................................................................................29939.3About Additional Packages...................................................................................................29939.3.1Importing Transaction Data from an Information Provider ....................................................30639.3.2Adding or Modifying Packages.............................................................................................30739.4Package Properties..............................................................................................................30739.4.1Logic Use in Packages.........................................................................................................32639.4.2Package Object Syntax .......................................................................................................32639.4.3Data Manager Tasks............................................................................................................32739.5Data Manager Tasks............................................................................................................32739.5.1Removing a Package from the List.......................................................................................32739.5.2Running Packages................................................................................................................32739.5.3Defining a Package Link.......................................................................................................33039.5.4
2013-01-3010
Contents
Modifying the List of Selected Packages..............................................................................33139.5.5Viewing Package Status.......................................................................................................33139.5.6Viewing Package Schedule Status.......................................................................................33239.5.7Adding Multiple Process Chains to a Package......................................................................33239.5.8Importing and Exporting Data Having Multiple Key Figures...................................................33339.5.9Retracting Master Data and Transaction Data......................................................................33339.5.10About Delta Initialization.......................................................................................................33439.5.11Data Transformations and Conversions................................................................................33639.6About Data Transformations................................................................................................33639.6.1Data Conversions................................................................................................................35039.6.2Data Transfer and Preview...................................................................................................35239.7About Data Transfer and Preview.........................................................................................35239.7.1
APIs.....................................................................................................................................355Chapter 40
Macros................................................................................................................................35540.1Context................................................................................................................................35540.1.1SetSheetOption...................................................................................................................36340.1.2GetSheetOption...................................................................................................................36840.1.3Report Connections.............................................................................................................36840.1.4Reports................................................................................................................................37340.1.5GetMemberDimension ........................................................................................................39040.1.6GetMemberHierarchy ..........................................................................................................39040.1.7GetDimensionList................................................................................................................39140.1.8GetHierarchyList..................................................................................................................39240.1.9GetHierarchyMembers ........................................................................................................39240.1.10Get MDX Request ..............................................................................................................39340.1.11Book Publication and Distribution.........................................................................................39340.1.12EvDREs................................................................................................................................39540.1.13Open/Save Connections......................................................................................................39640.1.14Data Manager Connections.................................................................................................39740.1.15Macros used in EPMExecuteAPI function.............................................................................39840.2LogOn..................................................................................................................................39840.2.1Connections.........................................................................................................................39940.2.2Excel....................................................................................................................................40140.2.3Word and PowerPoint..........................................................................................................40140.2.4Navigation............................................................................................................................40340.2.5Drill Through........................................................................................................................40440.2.6Context Members................................................................................................................40540.2.7Comments...........................................................................................................................40740.2.8Open/Save from Server.......................................................................................................40840.2.9OpenDimensionAndMemberSelector ..................................................................................40940.2.10
2013-01-3011
Contents
OpenReportEditor................................................................................................................40940.2.11Options................................................................................................................................40940.2.12Refresh................................................................................................................................41040.2.13Save Data............................................................................................................................41140.2.14OpenWorkStatusEditor........................................................................................................41340.2.15Planning...............................................................................................................................41340.2.16Book Publication..................................................................................................................41440.2.17Distribution and Collection...................................................................................................41540.2.18OpenSpecificDocument.......................................................................................................41740.2.19Data Manager......................................................................................................................41840.2.20Assigning a Control Form to a Macro...................................................................................42240.3Custom VBA Functions (Events)..........................................................................................42240.4
Ribbon Extensibility.............................................................................................................425Chapter 41
Ribbon Extensions: Simple Method......................................................................................42541.1RibbonXML.xml Content......................................................................................................42541.1.1Ribbon Extensions: Advanced Method.................................................................................42741.2How to Create a Ribbon Extension ......................................................................................42841.2.1Interface Implementation Details..........................................................................................42941.2.2
Languages...........................................................................................................................437Chapter 42
About the EPM Add-In.........................................................................................................439Chapter 43
Migration.............................................................................................................................441Chapter 44
Extended Analytics Analyzer Report Migration.....................................................................44144.1Planning and Consolidation EvDRE Migration.......................................................................44144.2EvDRE Formula....................................................................................................................44244.2.1KeysRange..........................................................................................................................44244.2.2Report Members and Axes..................................................................................................44344.2.3ExpansionsRange.................................................................................................................44744.2.4SortRange............................................................................................................................45244.2.5OptionRange........................................................................................................................45244.2.6Format Migration..................................................................................................................45344.2.7Migration Log.......................................................................................................................45844.2.8Launching the EvDRE Migration...........................................................................................45944.2.9After Migration.....................................................................................................................46144.2.10
2013-01-3012
Contents

More Information.................................................................................................................463Appendix A
Index 465
2013-01-3013
Contents

2013-01-3014
Contents
What's New
1.1 What's New in Support Package 13 Documentation
Connection Name parameter in EPM functionsYou also have the option to enter the name of a model instead of the connection name, provided thatyou are not connected to other models that have the exact same name. For example, EPMContextMember.
EPM Functions with Double-Click ActionsIf the cell on which you double-click is merged with other cells, the double-click will not function. Forexample, EPMContextMember.
Member Parent Selection in Page AxisWhen performing a Collapse (Collapse command in the EPM tab) on a member cell located in thepage axis of a report, the parent member is displayed instead and is taken into account in the report.This is possible only when a single member is selected for a dimension located in the page axis. SeePage Axis Dimension Members Modification using the Member Selector and Collapse.
New API: OpenMemberSelectorThe new API OpenMemberSelector opens the Member Selector that enables you to select membersfor a specified dimension and a specified connection. OpenMemberSelector.
New Event: GetMaxTupleByCellRequestThe parameter SmartQueryEngineMaxTupleByCellRequest in the FPMXLClient.dll.config file defines- for EPM functions - the maximum number of tuples (member combinations) by query when a refreshis performed. This parameter cannot be modified during a session for a specific workbook. Forperformance reasons, you can now change the number of tuples during a session for a specific workbook,for example, if your workbook contains a lot of EPM functions such as EPMRetrieveData, EPMSaveDataand EPMSaveComment. To change the number of tuples, use the GetMaxTupleByCellRequest event.The number entered will override the SmartQueryEngineMaxTupleByCellRequest number. See CustomVBA Functions (Events).
Connection for Open, Save, Book Publication and Distribution ActionsYou can change the connection in two ways. See Publication and Distribution Connection and Openand Save Connection .
2013-01-3015
What's New
New Member Names - Specific to Large Volume Data SourcesIn a report connected to a SAP NetWeaver BW InfoCube (using a local connection), you can nowchoose other member names to display, depending on what is defined in theProviderCapabilityConfiguration.xml file located in the EPM add-in installation folder. In this file, youcan customize the member names you want, based on properties. By default, the following namecombinations are provided in the file: Key-Name, Key-Medium Name, Key-long Name, Key-Caption. Ifthe properties exist in the hierarchies, the concatenated names are proposed in the display name listin the Member Selector. The member name is taken into account in the report. See Large Volume DataSources.
EPMOlapMember FormulaThe EPMOlapMember formula is now the following: =EPMOlapMemberO(
However, both of these formulas are recognized: =EPMOlapMemberO( and =EPMOlapMember(.
API SetSheetOptionThe protection options are now documented. See SetSheetOption.
1.2 What's New in Support Package 13 Patch 02 Documentation
"Keep Formula on Data" Sheet Option RestrictionWhen you change a member in an axis, using for example the EPM Context bar, formulas are not kept.See Keep Formula on Data and Show Source Data in Comments .
Read-only Data RestrictionThe member selection is always static. See Read-only Data.
Metadata RefreshYou can refesh the metadata of a specific data source at any time. See Logging On and Off.
The RefreshConnectionMetadata API is also available. See RefreshConnectionMetadata.
Metadata CacheThe metadata cache section has been updated. See Metadata Cache.
Context FavoritesWhen frequently using the same context, you can save it as a context favorite. You can then select thecontext favorite from the EPM Context bar, instead of having to select each dimension member fromthe bar. See Context Favorites.
Offline Mode without Workbook ProtectionYou can switch a workbook to offline mode without protecting it. See Offline Mode.
2013-01-3016
What's New
APIThe following API are available:• The RefreshReportDataOnly API. See RefreshReportDataOnly.• The LogOn API. See LogOn.• The GetSheetOption API. See GetSheetOption.• The SetContextOptionsForSeveralDimensions API. See SetContextOptionsForSeveralDimensions.
User Options Display TabIn the User Options dialog box, the new Display tab has been created and certain options have beenmoved from the Others tab to the Display tab. See User Options.
Keep Formulas Static that Reference Report CellsIf you use Microsoft Excel formulas that reference cells (data or member cells) of a report and if youwant the formulas to be static, you can select the Keep Formulas Static that Reference Report Cellsoption in the Sheet Options. See Keep Formulas Static that Reference Report Cells .
Drill-ThroughA drill-through to cube enables you to display information from another cube, for any specific parametersthat have been specified in a provided file. See Large Volume Data Sources.
Using Time-Dependent HierarchiesWhen connected to a Planning and Consolidation, version for SAP NetWeaver, model, you can usetime-dependent hierarchies in your reports. See Time-Dependent Hierarchies.
Specific Formatting for Unrecognized MembersAn option enables to apply a specific formatting to unrecognized members. See Member Entry Directlyin a Sheet.
Ribbon Extensibility: Another Method for Creating ExtensionsYou can create extensions to the EPM tab of the Microsoft Office Excel Ribbon, in a simpler way, usingmacros and an .xml file. See Ribbon Extensions: Simple Method.
2013-01-3017
What's New

2013-01-3018
What's New
Introduction to the EPM Add-in
The EPM add-in is an add-in to Microsoft Office Excel, Microsoft Office Word and Microsoft OfficePowerPoint.
The EPM add-in enables you to analyze data. The EPM add-in is designed to give access to SAPBusiness Objects EPM Solutions' product data, transforming that data in real time into a form whichsupports reporting, and providing reporting and delivery tools. The add-in also permits analysis of datafrom several EPM solutions at the same time.
The EPM add-in enables you to analyze the data of the following OLAP data sources:• SSAS cubes created with SAP BusinessObjects Financial Consolidation, cube designer.• SAP NetWeaver BW InfoCubes created with SAP BusinessObjects Financial Consolidation, cube
designer.• SAP BusinessObjects Profitability and Cost Management models.• SAP BusinessObjects Planning and Consolidation, version for SAP NetWeaver, models.• SAP BusinessObjects Planning and Consolidation, version for the Microsoft platform, models.
The EPM add-in also enables you to enter data in SAP BusinessObjects Planning and Consolidationmodels, provided that you use the appropriate connection. For more information on connections, seeTypes of Connections.
Note:Depending on the connection you use, some EPM features are not supported and therefore thecommands are automatically hidden or greyed out.
You can use the EPM add-in on any other non-EPM SSAS cubes and SAP Business WarehouseInfoCubes.
When working with a Planning and Consolidation connection, the Data Manager tab is added to theMicrosoft Office Excel ribbon. The Data Manager is a Planning and Consolidation module that helpsyou move data into the system, copy or move data within and across applications, and export data froman application for use in an external tool. In addition, the Data Manager supports mapping and complextransformations of data. The Data Manager also allows you to export transactional and master datafrom an application within Planning and Consolidation to a file that you can use in an external tool. Formore information, see the Data Manager section.
Retrieving Data from 7.5 Data SourcesIn replacement of Extended Analytics Analyzer 7.5, you can use the EPM add-in 10.0 to retrieve andanalyze data that comes from the following 7.5 data sources:• SSAS cubes created with SAP BusinessObjects Financial Consolidation, cube designer.• SAP NetWeaver BW InfoCubes created with SAP BusinessObjects Financial Consolidation, cube
designer.
2013-01-3019
Introduction to the EPM Add-in
• SAP BusinessObjects Planning and Consolidation, version for SAP NetWeaver, models.• SAP BusinessObjects Planning and Consolidation, version for the Microsoft platform, models.
Note:
• Use local connections (.oqy files) to connect to the data sources though ODBO.• This note applies to Planning and Consolidation Local connections. When using both add-ins,
Planning and Consolidation Interface for Microsoft Excel 7.5 (on a 7.5 Planning and Consolidationmodel) and EPM add-in 10.0 (on a 10.0 Planning and Consolidation model), uncheck the Load EVFunctions option in the User Options of the EPM tab. This prevents conflicts between EV functionnames. Also see EPM Functions.
2013-01-3020
Introduction to the EPM Add-in
Installation and Update
• You can install the EPM add-in in several ways.• If using a Planning and Consolidation connection, once the EPM add-in is installed on your local
machine, you can install the updates.
3.1 Installation
There are several ways of installing the EPM add-in for Microsoft Office.• Launch the setup.• Download the EPM add-in from the SAP BusinessObjects Enterprise BI launch pad. Once you are
logged on to the BI launch pad, launch the installation in the Preferences area.
Note:When the EPM add-in is not installed and you try to open an existing EPM workbook or to create anew one, a dialog box appears, indicating that the application is not installed. When you chooseOK, another dialog box opens, proposing to install the application by choosing Install the EPMadd-in for Microsoft Office.
• Download the EPM add-in from the SAP BusinessObjects Planning and Consolidation web client.Once you are logged on to Planning and Consolidation, select Install EPM add-in for MicrosoftOffice.
The add-in is automatically loaded when you open Microsoft Office Excel, Microsoft Office Word orMicrosoft Office PowerPoint.
For more information about hardware and software prerequisites to installing the EPM add-in, see theSAP BusinessObjects EPM Solutions, add-in for Microsoft Office Installation guide.
3.2 Update
Applies to:SAP BusinessObjects Planning and Consolidation, version for SAP NetWeaver and SAP BusinessObjectsPlanning and Consolidation, version for the Microsoft platform.
2013-01-3021
Installation and Update
Once the EPM add-in is installed, you can install the updates, depending on the update policy definedon the server side. The following options are possible:
• To be notified whenever an update is available, select the Notify me when updates are availableoption in the User Options. When connecting to a Planning and Consolidation server, a messageappears every time an update is available, asking you whether you want to want to install it now orlater.
Note:
• If you do not want to be notified again for updates, you can either choose the Do not show thismessage again option in the message box that appears or deselect theNotifymewhen updatesare available option in the User Options. These two options are synchronized, meaning thatwhen the first one in the message box is checked, the user option is automatically unchecked.
• The Notify me when updates are available option takes effect and the Do not show thismessage again option is displayed only for updates that are defined as "user update" on theserver side. For updates that are defined as "auto update" on the server side, without specifyinganything on your side, when connecting to a Planning and Consolidation server, a messageappears every time an update is available, asking you whether you want to install it now or later.
• When updates are mandatory, (defined as "force update" on the server side), a message appearson your local machine, prompting you to install the update. If you do not install the update, youcannot use the EPM add-in.
• You can verify at any time whether or not updates are available. To do so, when using a connectionto a Planning and Consolidation server, select EPM > About > Check for Updates.
Related Topics• User Options
3.3 Re-activating the EPM Add-In
If the EPM add-in has been deactivated, you can re-activate it.1. In Microsoft Office Excel 2007, click the Office button, then click the Excel Options button.2. In the Excel Options dialog box, select Add-Ins.3. Select Disabled Items from the Manage dropdown list and click the Go button.4. In the Disabled Items dialog box, select the SAP BusinessObjects EPM Solutions, add-in for
Microsoft Office and click the Enable button.5. Click the Close button.
Note:You can also quickly re-activate the EPM add-in by executing the AddinManager.exe from the installationfolder and selecting Enabled from the dialog box that opens.
2013-01-3022
Installation and Update
Logon and Connections
To access a specific cube or model with the EPM add-in, you need to use a connection. A connectionestablishes a connection between a specific data source and a report.
The connections are managed in the Connection Manager dialog box.
4.1 Logging On and Off
Logging on enables you to establish a first connection between all the workbooks (for one MicrosoftExcel instance) and a cube or model.
To log on, select EPM > Log On. Once you are connected to a data source, the Log On ribbon buttonis hidden and the Log Off button is displayed.
When you log on, you select a first connection for the workbooks. The Logon dialog box proposes thedefault connection, if you have defined one, or is left blank and you need to click the ellipsis button toselect a connection in the Connection Manager dialog box that opens. The connection selected isconsidered as the active connection.
When you open a workbook containing several reports and you log on with a specific connection, allthe other connections used by the other reports in the workbook are automatically connected - unlessfor example a connection has been deleted; in which case you may have to enter the login and passwordto one or more connections. If you open another workbook containing reports, the connections will alsobe automatically connected.
Logging off disconnects all the connections used in the current workbook.
Metadata RefreshWhen logging on, metadata is loaded, meaning that the dimensions and members of the data source(cube or model) are loaded. When logging off and then logging on again, metadata is loaded andrefreshed with the dimensions or members that have been added in the data source since the lastlogon.
You can refesh the metadata of a specific data source at any time, avoiding to perform a log off andlog on. To do so, select EPM > More > Refresh Metadata for Current Connection. The metadata isrefreshed right away for the connection that is displayed in the Connected to area of the EPM Pane.
Related Topics• Active Connection for the Current Sheet
2013-01-3023
Logon and Connections
4.2 Connection Management
The connections are managed in the Connection Manager dialog box. The Connection Manager canbe opened in the following ways:• Select EPM > Report Actions > Manage Connections• Click Log On, then select the ellipsis button• Select Select Another Connection from the Active Connection drop-down list of the EPM pane.
When you open the Connection Manager, all the connections that you have at one time selected aredisplayed, including local connections, provided that theDisplay Local Connections option is selected.If you want local connections to always be displayed when you open the Connection Manager, selectthe Display Local Connections option in the User Options.
You perform the following actions in the Connection Manager:• Select a connection.• Set a default connection. You can set a connection as the default one. The connection will be
proposed by default when you log on. To do so, in the Connection Manager, select a connectionin the list and click Set as Default.
• Selectively connect or disconnect one or more sheet/connection pairs. For example, when a workbookcontains a large number of sheets that you do not want to be connected, you can disconnect severalsheets at the same time.
• Edit or delete a connection.• Duplicate a Planning and Consolidation connection.
Related Topics• Features Available• Report Creation• EPM Functions• Types of Connections• Selecting Connections• Selectively connecting or disconnecting sheet/connection pairs
4.3 Active Connection for the Current Sheet
The active connection is the one that is used when you create a report or enter an EPM function.
When you perform a log on, you select a first connection. This connection is the active connection forall the workbooks. You can select at any time another connection that will become the active connectionfor the current sheet.
2013-01-3024
Logon and Connections
The active connection is selected in the Active Connection dropdown list of the EPM pane. Theconnections that are available in this list are the connections that you have connected during yourcurrent Microsoft Excel session. The connection you select in the list is the active connection for thecurrent sheet until you select another one.
Related Topics• Several Reports in a Sheet• EPM Functions
4.4 Types of Connections
There are several types of connections available, depending on your environment. They include: Local,SAP BusinessObjects Enterprise, Planning and Consolidation, version for SAP NetWeaver,Planning and Consolidation, version for the Microsoft platform, and other types.
Using a Local or an SAP BusinessObjects Enterprise connection, the EPM add-in enables you toanalyze the data of the following OLAP data sources:• SSAS cubes created with SAP BusinessObjects Financial Consolidation, cube designer.• SAP NetWeaver BW InfoCubes created with SAP BusinessObjects Financial Consolidation, cube
designer (note that only the following objects of the SAP BW ODBO provider are supported: InfoCube,MultiProvider and VirtualProvider).
• SAP BusinessObjects Profitability and Cost Management models.• SAP BusinessObjects Planning and Consolidation, version for SAP NetWeaver, models.• SAP BusinessObjects Planning and Consolidation, version for the Microsoft platform, models.
Using a Planning and Consolidation, version for SAP NetWeaver or Planning and Consolidation,version for the Microsoft platform connection, the EPM add-in also enables you to enter data onSAP BusinessObjects Planning and Consolidation models.
Note:Administrators create the cubes and models to which you connect your reports. They can modify thestructure of the cubes and models at any time.
In the Connection Manager, you can use and select the connection types explained in the followingsection.
SAP BusinessObjects Enterprise ConnectionsSAP BusinessObjects Enterprise Connections are connections that are stored on the SAPBusinessObjects Enterprise platform. If you have opened the EPM add-in from the BI launch pad, youcan use these connections.
Local ConnectionsLocal connections are .oqy files. These connections can be stored on your machine or another machineon the network.
2013-01-3025
Logon and Connections
You can select folders in which your administrator stores the local connections. To do so, click theLocal Connection Folder button in the Connection Manager and select the folder in the dialog boxthat opens. Any connection added at a later time to this folder will be retrieved automatically; you willonly need to select the ones you require.
Note:
• If the connection was not created using the EPM add-in, then the authentication method has notbeen defined, and a message appears when trying to connect. You must edit the connection in theConnection Manager and specify its authentication method.
• When you connect to an SAP NetWeaver BW InfoCube, you must enter the user name and passwordto the SAP NetWeaver BW platform, and select your working language.
• If the data source for which you are creating or editing the local connection is a large volume datasource, select the Do not Load Members at Connection option. Selecting this option hasconsequences for the Member Selector and certain other features. For more information, see LargeVolume Data Sources.
Planning and Consolidation ConnectionsRefer to the SAP BusinessObjects EPM Solutions, add-in for Microsoft Office Installation guide.
Notes on Connections• For more information about connections and their authentication method, see the SAP
BusinessObjects EPM Solutions, add-in for Microsoft Office Installation guide.• Depending on the connection you use, some features are not supported and therefore the commands
are automatically hidden or greyed out.• When connecting to a cube/model, you can clear the cache if you want to load the whole structure
and not just the data. Note that the cube/model will take some extra time to load.
Related Topics• Features Available• Metadata Cache
4.5 Selecting Connections
1. Select one of the following:a. EPM > Log Onb. From theActive Connection dropdown list of the EPM pane, select Select Another Connection.c. EPM > Report Actions > Manage Connections.The Connection Manager opens, displaying the list of all the connections that you have at one timeselected, including local connections, provided that the Display Local Connections option isselected.
2013-01-3026
Logon and Connections
Note:
• If you want local connections to always be displayed when you open the Connection Manager,select the Display Local Connections option in the User Options.
• You can select folders in which your administrator stores the local connections. To do so, clickthe Local Connection Folder button in the Connection Manager and select the folder in thedialog box that opens. Any connection that is added at a later time to this folder will be retrievedautomatically.
2. Select a connection from the list and click OK.3. If the connection you want to use is not in the list, click Create and do as follows:
• If you have opened the EPM add-in from the BI launch pad, you can select the SAPBusinessObjects Enterprise connection type. Enter a name for the connection, then select anEPM connection in the list, and select the cube or model.
Note:If you have not opened the EPM add-in from the BI launch pad, when you select this type ofconnection, the list of EPM connections is empty.
• To create a Planning and Consolidation, version for SAP NetWeaver, Planning andConsolidation, version for the Microsoft platform or a Local connection, refer to the SAPBusinessObjects EPM Solutions, add-in for Microsoft Office Installation Guide.
When you connect to an SAP NetWeaver BW InfoCube, you msut enter the user name and passwordto the SAP NetWeaver BW platform, and select your working language.
Note:For more information about connections and their authentication method, see the SAP BusinessObjectsEPM Solutions, add-in for Microsoft Office Installation Guide.
4.6 Selectively connecting or disconnecting sheet/connection pairs
1. Select one of the following:a. EPM > Log Onb. From theActive Connection drop-down list of theEPM pane, selectSelect Another Connection.c. EPM > Report Actions > Manage ConnectionsThe Connection Manager opens.
2. Click Report Connections.The Report Connections dialog box opens. All connected sheets in all open workbooks in thecurrent session of Microsoft Office Excel appear in the tree view list displaying cubes/models, sheetsand reports.
Note:You can choose how to display the sheet/connection pair by clicking theDisplay by Sheet orDisplayby Connection button.
3. You can perform the following actions:
2013-01-3027
Logon and Connections
• To connect or disconnect a specific sheet/connection pair, select or deselect the sheet checkboxand click OK.
• To connect or disconnect all the sheets linked to a cube/model, select or deselect all the sheetcheckboxes individually, or select or deselect the cube/model check box and click OK.
• To connect all the sheet/connection pairs, click the Select All button and then click OK.• To disconnect all the sheet/connection couples, click the Unselect All button and then click OK.• To change a connection, select the cube/model, the sheet or the report and click the Change
Connection button.
Note:If you connect a report to a different cube or model, the previous cube/model will be disconnected.In other words, one report can only be connected to one cube/model at a time.
If you connect or disconnect a sheet/connection pair, the EPM Worksheet option in the Generaltab of the Sheet Options is automatically selected or deselected. For more information on thisoption, see EPM Worksheet.
2013-01-3028
Logon and Connections
Large Volume Data Sources
When you connect to a data source - using a local connection - that has a large volume of membersand for which the connection time is too long, you can choose not to load all the members at once atthe connection. The members are only loaded as you navigate and display them in a report.
To do this, select theDo not LoadMembers at Connection option in the Edit Connection andCreateConnection dialog boxes, when creating or editing a local connection. For more information on localconnections, see Types of Connections.
Note:This feature is only available for local connections.
Selecting this option has consequences for:• the Member Selector and any user interface areas where you can perform a member selection.
For more information about the Member Selector, see Member Entry Using the Member Selector(on Large Volume Data Sources).
• some specific features that are not supported or restricted. They are listed below.• some features are specific to large volume data sources. They are also listed below.
Restrictions on Specific FeaturesWhen the Do not Load Members at Connection option is selected for a data source, the followingfeatures are not supported or are restricted:• Books. If a book template has not been generated with the EPM add-in 10.0, the book templates
are not supported. For more information about books, see Book Publication .• If the provider used for the connection does not support custom members, it does not support blank
members either.• The Freeze Data Refresh option is available but not applied. See Freeze Data Refresh.• The Display Warning when Process Takes Time option is available but not applied. See User
Options.• Sorting, Filtering and Ranking tabs of the Report Editor:
• In the Sorting, Filtering and Ranking tabs of the Report Editor, the Show Only MembersDisplayed in the Report option does not exist.
• In the Sorting tab: the Sort Inside Level option is not available.• In the Filtering tab: the Filter on all Columns/Rows option is not available; the is/is not null
drop-down menu is not available; the Retain Members button is not available.• In the Ranking tab: the First Column and Last Column options are not available.
For more information on data sorting, filtering and ranking, see Data Sorting, Ranking and Filtering.
• Excluding members:
2013-01-3029
Large Volume Data Sources
• When excluding members, you cannot have the same combination of members twice in an axis.• When there are at least three dimensions in an axis, you can either exclude one member or the
whole combination of members.
For more information about excluding members, see Excluding Members.
• Do not use the following EPM functions as they are not supported when connected to a large volumedata source: EPMMemberProperty, EPMDimensionPropertyValues, EPMRetrieveData,EPMSelectMember, EPMMemberOffset, EPMMemberDesc, EPMScaleData, EPMSaveData,EPMSaveComment, EPMCommentPartialContext, EPMCommentFullContext, EPMWorkStatus,EPMBook and EPMExecuteAPI (when you reference members). For more information about functions,see EPM Functions.
• You can use the following two functions only if you specify the member ID in the member parameter:EPMAxisOverride, EPMDimensionsOverride.
Tip:To find out the member ID, display the member in a report and select the member. In the formulabar, the ID is displayed right after =EPMOlapMemberO("
• In the Member Selector:• the Member Property and Dimension Property relationships do not exist.• the number of children for a node is displayed, not the number of ascendants.• other restrictions exist, depending on the data source.
For more information, see Member Entry Using the Member Selector (on Large Volume DataSources).
Member Name DisplayIn a report connected to a SAP NetWeaver BW InfoCube (using a local connection), you can nowchoose other member names to display, depending on what is defined in theProviderCapabilityConfiguration.xml file located in the EPM add-in installation folder. In this file, youcan customize the member names you want, based on properties. By default, the following namecombinations are provided in the file: Key-Name, Key-Medium Name, Key-long Name, Key-Caption. Ifthe properties exist in the hierarchies, the concatenated names are proposed in the display name listin the Member Selector. The member name is taken into account in the report.
Drill-Through to CubeA drill-through to cube enables you to display information from another cube, for any specific parametersthat have been specified in the DrillThrough.xml file.
Note:
• The source report can be connected either to a SAP NetWeaver BW InfoCube (using a localconnection) or to a Planning and Consolidation, version for SAP NetWeaver, model (using a Planningand Consolidation, version for SAP NetWeaver connection).
• The source cube and the destination cube can be located either on the same server or on twodifferent servers.
Caution:The DrillThrough.xml file that is automatically provided in the EPM add-in installation folder must belocated in \%userprofile%\AppData\Local\EPMOfficeClient\.
2013-01-3030
Large Volume Data Sources
To access the drill-through information, select a data cell that belongs to the report, then select EPM> Drill-Through > Drill-Through to Cube and the name of the drill through, which is defined in theDrillThrough.xml file. Another worksheet opens, displaying a static report. The information displayeddepends on the following items:• The context of the data selected; the row and column members at the interersection of the data cell
selected.• The parameters that have been specified in the DrillThrough.xml file. Here is the description of the
parameters that need to be filled in:• <DrillThroughToCubeInfo>: defines one drill-through.• <MDXQuery>: MDX query of the destination report. Inside the query, you can put all the variable
members between double hashes (##).• <DisplayName>: name of the command that will be displayed when selectingEPM >Drill Through
> Drill-Through to Cube from the EPM tab of the ribbon.
Example:The entity member and its children are mentionned as follows in the MDX query:{[ENTITY].[All].CHILDREN, [ENTITY].[All]}
You want the entity member and its children to vary. Add double hashes (##) as follows: {##ENTITY##.CHILDREN, ##ENTITY##}
• <VBAFunctionBeforeDrillThrough>: executes a VBA macro before executing the drill-through(for example: displaying a comment before the report). Enter the name of the macro.
• <VBAFunctionAfterDrillThrough>: executes a VBA macro after executing the drill-through (forexample: applying formatting settings). Enter the name of the macro.
• <ConnectionInfo>: connection information of the .oqy file. Specify the connection informationonly if the destination cube is on another server.
• <Redirection>: specifies another file where drill-throughs are defined (a file on the network sharedby several users for example). Enter the path and name to the other file. Do not define anydrill-throughs in the current file; enter only the redirection information.
2013-01-3031
Large Volume Data Sources

2013-01-3032
Large Volume Data Sources
About the EPM add-in Interface
6.1 Main Interface Areas
The EPM add-in for Microsoft Office adds the following areas to Microsoft Office Excel, Microsoft OfficeWord and Microsoft Office PowerPoint:• In the ribbon of Microsoft Office 2007 and 2010, the EPM tab is the main entry point for performing
reporting and data input actions.
Note:
• When positioning your cursor on a command in the EPM tab, a tooltip appears, explaining thecommand.
• Depending on the Microsoft Office application, the EPM tab does not contain all the samecommands.
• In Microsoft Office 2003, the EPM menu is the main entry point for performing reporting and datainput actions.
• The EPM Context bar is displayed by default horizontally and below the ribbon.
The bar displays the dimensions that are included in the current cube/model and the members thatare used in the currently displayed report (or the saved members in an offline report).You can hide the bar by unchecking the Display EPM Context Bar option in EPM > Options >User Options. This bar can also be displayed inside the EPM pane by checking theDisplay Contextinside EPM Pane option. You can also move the bar into and back from the pane, using the mousemove pointer.
• The EPM pane is displayed by default vertically on the right side of the window.
This pane includes the following areas: the active connection; information about the selected report,including the connection used by the report, the name of the report, all the dimensions available,the page axis dimensions, the row axis dimensions and the column axis dimensions.You can hide the pane by unchecking the Display EPM Pane option in EPM > Options > UserOptions. Selecting the title bar of the pane and using drag and drop, you can move the pane to theleft side of the window or anywhere else in the window.
Note:The EPM Context bar and the EPM pane can both be hidden or displayed at the same time byclicking the Show Pane & Context button in the EPM tab.
• Cell Context menu. Only in Microsoft Office Excel, a cell context menu appears when you right-clickon any cell in the spreadsheet. The add-in adds a tab to the ribbon: EPM. This allows you to continue
2013-01-3033
About the EPM add-in Interface
to use the existing Microsoft Office Excel features (such as: cut, copy, paste and insert) and doesnot take up much space.
Persistent resizingYou can resize the pane, the bar and the dialog boxes. Your resizing choices are kept from one sessionto the next.
Related Topics• Context• Report Creation using the EPM Pane• EPM Add-in for Microsoft Office Word and PowerPoint
6.2 Performing Actions without the Mouse
The EPM add-in menus and commands can be accessed without using the mouse.• The EPM tab can be accessed by pressing the Alt key and then pressing the character that is
displayed on the EPM tab.• Inside the EPM tab, the commands can be accessed by pressing the character that is displayed on
the command you want to use.• Inside a dialog box:
• Press the Alt key to display the shorcuts on commands. Then, click the underlined letter.• To select another tab, if any, use the right/left arrow keys.• To move to the next control (list, check boxes, options), press the Tab key.• To move to the previous control, press the Shift and Tab keys.• To move between items in a list or in a group of options, press the up/down arrow keys.• To select or deselect a check box, press the Space bar.• To close a dialog box or cancel a context menu, press the Esc key.
• Context menus that require the right-mouse button can be displayed by using the Context Menu key(sometimes called the "exclusive" key). Once the menus are activated, they can then be navigatedusing the arrow keys.
6.3 Using Microsoft Office 2003
In the help documentation, all the paths described in procedures apply to Microsoft Office 2007 and2010.
If you use Microsoft Office 2003, refer to the following table for the equivalent paths.
2013-01-3034
About the EPM add-in Interface
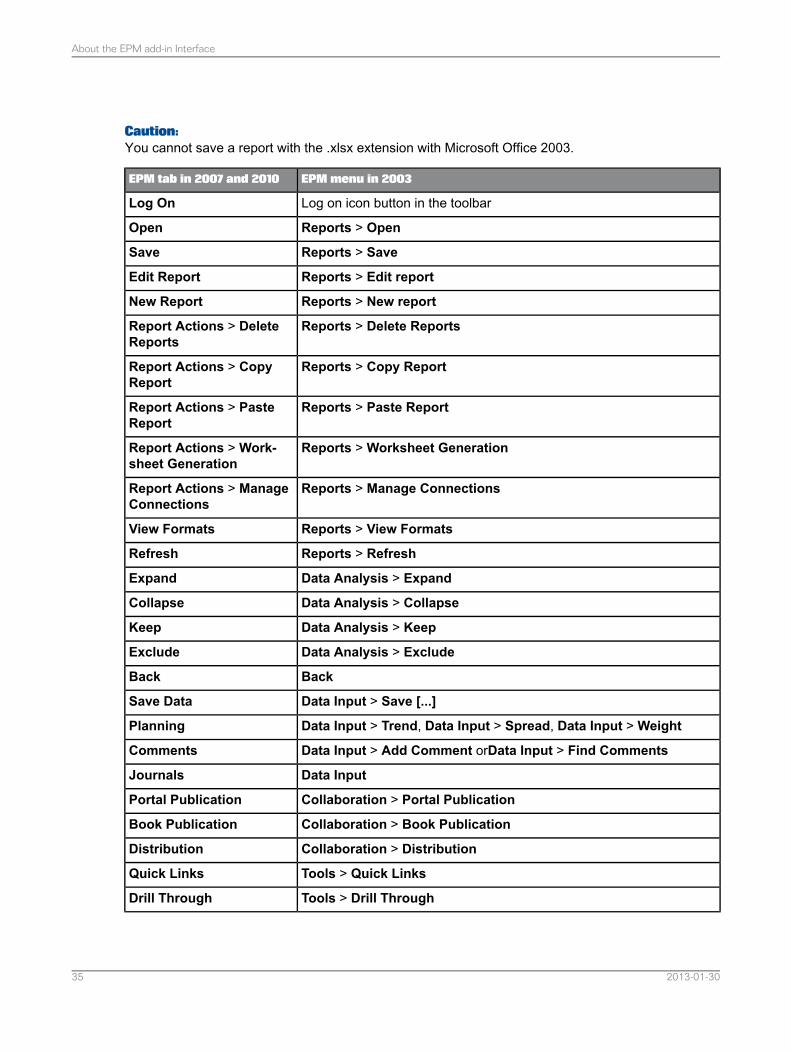
Caution:You cannot save a report with the .xlsx extension with Microsoft Office 2003.
EPM menu in 2003EPM tab in 2007 and 2010
Log on icon button in the toolbarLog On
Reports > OpenOpen
Reports > SaveSave
Reports > Edit reportEdit Report
Reports > New reportNew Report
Reports > Delete ReportsReport Actions > DeleteReports
Reports > Copy ReportReport Actions > CopyReport
Reports > Paste ReportReport Actions > PasteReport
Reports > Worksheet GenerationReport Actions > Work-sheet Generation
Reports > Manage ConnectionsReport Actions > ManageConnections
Reports > View FormatsView Formats
Reports > RefreshRefresh
Data Analysis > ExpandExpand
Data Analysis > CollapseCollapse
Data Analysis > KeepKeep
Data Analysis > ExcludeExclude
BackBack
Data Input > Save [...]Save Data
Data Input > Trend, Data Input > Spread, Data Input > WeightPlanning
Data Input > Add Comment orData Input > Find CommentsComments
Data InputJournals
Collaboration > Portal PublicationPortal Publication
Collaboration > Book PublicationBook Publication
Collaboration > DistributionDistribution
Tools > Quick LinksQuick Links
Tools > Drill ThroughDrill Through
2013-01-3035
About the EPM add-in Interface
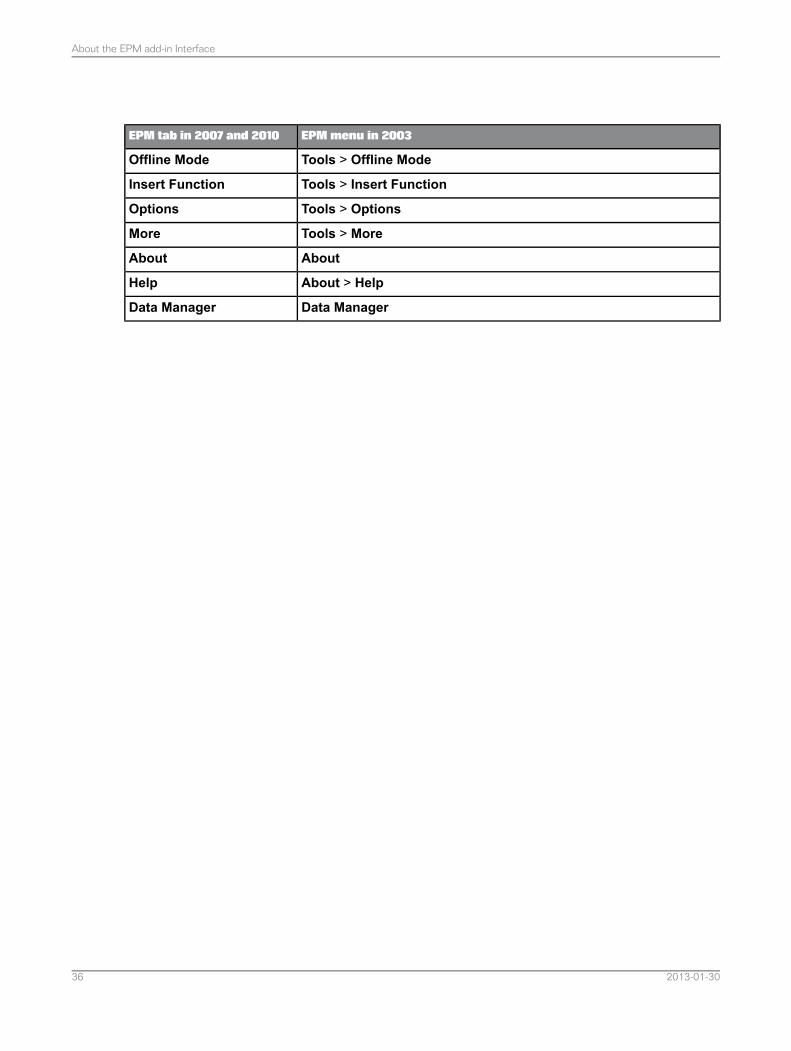
EPM menu in 2003EPM tab in 2007 and 2010
Tools > Offline ModeOffline Mode
Tools > Insert FunctionInsert Function
Tools > OptionsOptions
Tools > MoreMore
AboutAbout
About > HelpHelp
Data ManagerData Manager
2013-01-3036
About the EPM add-in Interface
Features Available
The EPM add-in features that are available depend on:• The connection you use.• The task profiles that are assigned to you.
ConnectionDepending on the connection you use, some commands are automatically hidden or greyed out in theribbon or in other interface sections, such as dialog boxes. For example, if you create on the samesheet several reports using different connections, depending on which report you select, the commandsavailable may change.
Note:In this documentation, when the feature described is not available or relevant to all cubes or modelssupported by the EPM add-in, a paragraph called "Applies to" specifies for which type(s) of connectionthe feature is available or relevant.
Note:When installing the EPM add-in, you specify the applications you use. When opening the add-in afterthe installation, the display of the EPM tab in the ribbon is initialized, depending on your selection inthe installation setup. For example, if you specified the application Financial Consolidation duringinstallation, the Data Input group in the ribbon is not displayed since it is not relevant for this application.If you want to use Planning and Consolidation at a later time, you can display the commands that arerelated to Planning and Consolidation. To display or hide the commands or group of commands in theribbon, selectEPM > Options > Command Display Options.
Task ProfilesThe features available also depend on the task profiles that have been assigned to you in the EPMapplication to which you are connected.
For more information about task profiles, see the help documentation for the EPM application you use.
Related Topics• Introduction to the EPM Add-in• Logon and Connections
2013-01-3037
Features Available

2013-01-3038
Features Available
Security on Data or Members
The security defined in the models or cubes you connect to is applied in the EPM add-in:• For all cubes or models, the security is defined on members. For example, user 1 is not authorized
to view any data on the Actual member. In a report, if you retrieve data that you are not authorizedto view, all the corresponding cells are left blank by default.
• For Planning and Consolidation, version for SAP NetWeaver, models, the security can alternativelybe defined on combinations of members, meaning on data. This is called Matrix Security. Forexample, user 2 is not authorized to view data at the intersection of the Actual member and theEntity 1, Entity 3 and Entity 4 members. Therefore, user 2 can only view the data for Actual andEntity 2.
Related Topics• Security on Data (Planning and Consolidation, version for SAP NetWeaver)
8.1 Security on Data (Planning and Consolidation, version for SAP NetWeaver)
Applies to:Planning and Consolidation, version for SAP NetWeaver, connections.
When using a model on which Matrix Security has been defined, and if security is activated on theserver, the security on data is applied in the EPM add-in.
Therefore, in a report, the cells containing data that you are not authorized to view are left blank bydefault.
Text to display in unauthorized cellsInstead of blank cells, you can have a text display in the unauthorized cells:• By default, the text is #unauthorized but you can enter another text in the Unauthorized Cell Text
field, by selecting EPM > Options > User Options.• To display the text in the unauthorized cells, you must select the Show Unauthorized Cell Text
option:• In the Sheet Options, if you want the text to be displayed in any report in the current sheet.
2013-01-3039
Security on Data or Members
Note:If you use the EPMRetrieveData function to retrieve data on members that are not authorizedto you, the cell in which you have entered the function also displays the default or specified text.
• In the Options tab of the Report Editor, if you want the text to be displayed on a specific report.
Note:The text is displayed after a refresh action.
General warning messageAlso, if the Display Matrix Security Warning option is selected in the User Options (the option isselected by default), a warning message appears when a report containing unauthorized cells isrefreshed. This message indicates that some data is not displayed.
Note:In the message box, an option enables you to specify that the warning message no longer appear. Ifyou select this option, the Display Matrix Security Warning option is consequently deselected in theUser Options. So that the message warning be displayed again, select the user option again.
Related Topics• EPMRetrieveData
2013-01-3040
Security on Data or Members
Open and Save a File
Using the EPM add-in, you can open and save files in different ways, depending on the connectionsyou use.
If you do not open a file from a web portal, or work with a Planning and Consolidation connection, youcan always use the Microsoft Office Excel, Word or PowerPoint standard open and save features.
Note:
• When using Microsoft Office Excel, you can open or save files with the following formats: xls, xlsx(except in Microsoft Office Excel 2003), xlsm, xlt, xltx and xltm.
• If the Microsoft Office 2007 compatibility pack has been installed, you cannot open in MicrosoftOffice 2003 a workbook that has been created with Microsoft Office 2007 or 2010.
9.1 Open a Report when Dimensions or Members have Changed
When you open a report that contains dimensions or members that have changed since the lastconnection, you may have to perform the following actions:• Dimensions. If some of the dimension names have changed, you need to manually remap these
dimensions. A dedicated dialog box automatically opens when needed.• Members. If some of the members used in the report are not recognized as valid members in the
cube or model (for example, a member has been deleted), you can choose between the followingbehaviors:• Do not keep the unrecognized member rows, columns and formulas on data, if any. In this case,
you can specify that the columns and rows for unrecognized members are automatically deletedas soon as you perform a refresh of the report. Consequently, if formulas were entered in thedata cells, the formulas are also deleted. To do so, uncheck the Keep Rows and Columns ofUnrecognized Members option in the User Options.
• Keep the unrecognized member rows, columns and formulas on data, if any. In this case, youcan specify that the columns and rows of unrecognized members are kept along with any formulaentered in the data cells. Consequently, the unrecognized members are automatically convertedinto "blank" members as soon as you perform a refresh of the report. To do so, check the KeepRows and Columns of Unrecognized Members option in the User Options. If you want to bewarned that members are not recognized but will be kept, you can check the Warn if Rows andColumns of Unrecognized Members will be Kept option in the User Options. A message isdisplayed after a refresh, listing the members that are not recognized in the report. If you do notwant to show the message again, select the option in the message box and click OK (clickingCancelwill not take into account the option selection) or uncheck theWarn if Rows and Columns
2013-01-3041
Open and Save a File
of Unrecognized Members will be Kept option in the User Options; these two options aresynchronized.
Note:To insert a valid member instead of a blank member, use the Insert Member feature. For moreinformation on this feature, see Member Entry Using the Insert Members Dialog Box.
Note:A report structure (dimensions and members) may have changed in the following cases:• You open a report with the same connection with which the report was created, but some dimensions
or members may have changed.• You open a report that has been created with a specific connection and you connect it to a different
connection. Even though the two data sources behind the connections have a similar structure,some dimensions or members may be different.
9.2 Open a File from a Web Portal
You can open the EPM workbooks, documents or presentations from two different web portals.
Open a file from the BI launch padIf you are using SAP BusinessObjects Enterprise, you can open an existing EPM file from the BI launchpad. In the BI launch pad tree structure of the Document List, select the appropriate folder, thendouble-click the file. Depending on the type of file, it opens in Microsoft Office Excel, Word or PowerPoint,displaying the EPM tab.You can also create an EPM workbook, document or presentation from the BI launch pad. In the BIlaunch pad tree structure of the Document List, select one of the following: New > EPM Workbook,New > EPM Document or New > EPM Presentation. A new file opens in Microsoft Office Excel, Wordor PowerPoint, displaying the EPM tab.
Note:When working in Microsoft Office Excel, Word or PowerPoint, you can publish an EPM workbook,document or presentation to the BI launch pad. For more information, see Report Publication to a WebPortal.
Open a file from Planning and Consolidation (web client)If you are using SAP BusinessObjects Planning and Consolidation, you can open an existing EPM filefrom the Documents view. For more information, see the SAP BusinessObjects Planning andConsolidation help.
Note:When in Microsoft Office Excel, Word or PowerPoint, you can publish an EPM workbook, document orpresentation to the Planning and Consolidation Documents view. For more information, see ReportPublication to a Web Portal.
2013-01-3042
Open and Save a File
9.3 Open and Save a File for Planning and Consolidation
Applies to:Planning and Consolidation connections
If you use Planning and Consolidation connections, you can use dedicated features to open and savefiles, using the server folder structure.
The dedicated features are:EPM > Open and EPM > Save.
Note:If you do not want to use the server folder structure, you can use the Microsoft Office Excel standardopen and save features.
Here are the files that you can open and save:• Using Microsoft Office Excel, you can open and save workbooks containing: reports, input forms,
book publication templates and distribution templates.• Using Microsoft Office Word, you can open and save documents containing reports.• Using Microsoft Office PowerPoint, you can open and save presentations containing reports.
Note:When using Microsoft Office Excel, you can open or save files with the following formats: xls, xlsx(except in Microsoft Office Excel 2003), xlsm, xlt, xltx and xltm.
9.3.1 Open and Save Connection
Applies to:Planning and Consolidation connections
Both Open and Save are performed on one specific connection.
By default, the connection on which Open and Save actions are performed is the connection that iscurrently displayed in the Active Connection of the EPM pane.
If you want to perform Open and Save actions on a different connection than the active connection,choose one of the following actions:• Select EPM > Open > Change Connection or EPM > Save > Change Connection, then select
the connection in the Change Connection dialog box.• Or select the connection from the Active Connection dropdown list of the EPM pane.
Note:The connection selected from the Active Connection dropdown list is automatically taken intoaccount in the Change Connection dialog box.
2013-01-3043
Open and Save a File
9.3.2 Open Actions
Applies to:Planning and Consolidation connections
When you select EPM >Open, different commands enable you to open a file from the following locations:• Local location for reports and input forms: you can open reports or input forms that are stored on
your local machine in dedicated folders.
Note:You can change the default local folder in the Open/Save Root Folder area of the User Options.
The Planning and Consolidation server folder structure is duplicated on your machine for two folders:"Reports" and "Input Schedules".• When you select Openmy Reports, the local "Reports" folder is selected by default in the dialog
box that opens.• When you select Openmy Input Forms, the local "Input Schedules" folder is selected by default
in the dialog box that opens.
Note:In Microsoft Office Word and PowerPoint, only the Open my Reports command is available.
• Server location for reports and input forms: you can open reports or input forms that are stored onthe Planning and Consolidation server, in dedicated folders: "Report" and "Input Schedules".• When you select the Open Server Report Folder, the Company (Public) "Reports" folder is
selected by default in the dialog box that opens.• When you select the Open Server Input Form Folder, the Company (Public) "Input Schedules"
folder is selected by default in the dialog box that opens.
Note:In Microsoft Office Word and PowerPoint, none of the preceding two commands are available.
• Server location for any file: you can open reports, input forms, book publication templates or distibutiontemplates that are stored on the Planning and Consolidation server, in dedicated folders.
When you select the Open Server Root Folder, the root folder is selected by default in the dialogbox that opens.
Note:
• For more information about the dialog box, see Open and Save Dialog Box Description andActions .
• For more information about the folder structure on the server, see Server Folder Structure.
2013-01-3044
Open and Save a File
9.3.3 Save Actions
Applies to:Planning and Consolidation connections
When you select EPM > Save, different commands enable you to save a file to the following locations:• Local location for reports and input forms: you can save reports or input forms to your local machine
in dedicated folders.
Note:You can change the default local folder in the Open/Save Root Folder area of the User Options.
The Planning and Consolidation server folder structure is duplicated on your machine for two folders:"Reports" and "Input Schedules".• When you select Save my Report, the local "Reports" folder is selected by default in the dialog
box that opens.• When you select Save my Input Forms, the local "Input Schedules" folder is selected by default
in the dialog box that opens.
Note:In Microsoft Office Word and PowerPoint, only the Save my Reports command is available.
• Server location for any file: you can save reports, input forms, book publication templates or distibutiontemplates on the Planning and Consolidation server, in dedicated folders.
When you select the Save to Server Root Folder, the root folder is selected by default in the dialogbox that opens.
Note:
• For more information about the dialog box, see Open and Save Dialog Box Description andActions .
• For more information about the folder structure on the server, see Server Folder Structure.
Connection Information not Stored in the Report• You can save a report without storing the connection used to create the report, meaning without
storing the environment or the model of the connection. You will then be able to use the report onother connections, provided that the models have similar structures.
To do so, in the Options tab of the Report Editor, select the Do not Store Connection option.
• You can also save a report without storing the environment of the connection used to create thereport. You will then be able to use the report on other connections using other environments,provided that the models' environments have similar structures.
To do so, in the Options tab of the Report Editor, select the Do not Store Environment in theConnection option.
2013-01-3045
Open and Save a File
Note:If you have already selected the Do not Store Connection option, the Do not Store Environmentin the Connection option is greyed out.
For more information, see Do not Store Connection and Do not Store Environment in the Connection.
9.3.4 Open and Save Dialog Box Description and Actions
Applies to:Planning and Consolidation connections.
When opening or saving a file from or to the server, the dialog box that opens can contain the followingbuttons on the left side, depending on the rights you are granted:• "Local". The folders and files displayed are the merge result of folders and files on your local machine
and folders and files on the server for "Company (Public)".
Note:You can change the default local folder in the Open/Save Root Folder area of the User Options.
• "Company (Public)". The folders and files displayed are the ones on the server.• "[team]". If you have access to a team, a button with the name of the team is displayed. The folders
are the same as for "Company (Public)".
By right-clicking a folder in the middle part of the dialog box, you can create or delete a folder, and youcan search for the name of a file.
By right-clicking a file in the right part of the dialog box, you can copy, paste, delete or rename a file.
9.3.5 Server Folder Structure
Applies to:Planning and Consolidation connections
For each model, the Planning and Consolidation and Consolidation server folder structure is as follows:• Root folder
• "Books": this folder contains book publication templates.• "Input Schedules": this folder contains input forms. Inside this folder, the folder "Templates"
contains templates for input forms.• "PDBooks": this folder contains distribution templates.• "Reports": this folder contains reports. Inside this folder, the folder "Templates" contains templates
for reports.
2013-01-3046
Open and Save a File

• "Migration Copy": this folder contains original workbooks that have been migrated (only if the Donot move original workbooks in a different folder option is selected in the migration dialogbox). For more information, see Launching the EvDRE Migration.
Note:Some folders appear only when corresponding files have been created.
Related Topics• Report and Input Form Templates
2013-01-3047
Open and Save a File

2013-01-3048
Open and Save a File
Context
The context specifies the dimensions and associated members for a specific connection.
The context represents the following:• The dimensions that are included in the current cube/model.• The members that are used in the current display of a report (or the saved members in an offline
report).
The context enables you to define, for each dimension of a selected cube/model, a membercorresponding to the default member to be applied for unspecified dimensions in any EPM function orin any report created.
Note:The members that are selected in the axes of a report override the members selected in the context.
The context applies to the user for a connection. If you open other workbooks and connect to the samecube or model, the context will be the same even if you have modified it in one of the workbooks.
The context is displayed in the dedicated EPM Context bar.
Note:
• When using a Planning and Consolidation connection, the name of the current model is displayedin the bar.
• You can alternatively display the context settings inside the EPM pane by selecting the DisplayContext inside EPM Pane option in the User Options dialog box.
However, you can set a specific member on a specific workbook or worksheet. When you set a member,you automatically lock its dimension and you cannot select another member from the EPM Contextbar: the dimension dropdown list is greyed out.
Note:If you set a member on a specific workbook, the member is also set on all the sheets of the workbook.
To change the context in a report, you can select other members from the EPM Context bar. The datadisplayed changes to reflect the new context settings. To select another member for a dimension, selecta dimension dropdown list, then select Select Other Members. The Member Selector opens and youcan make your selection. Alternatively, you can select a context favorite or save the current context asa context favorite (see Context Favorites).
Note:If the dropdown list is greyed out, you cannot select another member: this is because the dimensionhas been locked in the Context Options.
2013-01-3049
Context
To lock a dimension on a workbook or worksheet, select EPM > Options > Context Options. In theContext Lock tab, select the level from the dropdown list, then click the member and select the oneyou want from the Member Selector that opens. The Lock checkbox is automatically checked for thedimension.
Note:You can set a workbook to refresh automatically upon selecting a member from the context by selectingthe Automatic Refresh on Context Changes option in the User Options dialog box.
10.1 Context Favorites
If you frequently use the same context, you can save it as a context favorite.
You can then select the context favorite from the EPM Context bar, instead of having to select eachdimension member from the bar.
A context favorite is connection-specific.
Context Favorite CreationHere is how you can create a context favorite:• From EPM > Options > Context Favorites:
• To create your first favorite, enter a name in the Favorite list. The members selected by defaultfor the first favorite are the current context members. You can change the member selection andclick Create Favorite.
• To create a new favorite, select New Favorite from the Favorite list, enter a name in the dialogbox that opens and click OK.
• To create a favorite based on an existing one, select the existing favorite, select Copy Favoritefrom the Favorite list, then enter a name in the dialog box that opens and clickOK. Finally, modifythe member selection.
Note:None of your modifications are saved until you click OK or if you click Cancel.
• Directly from the EPM Context bar, you can save the current context as a context favorite, by usingthe context favorite dropdown list and selecting Save Current Context as Favorite.
Context Favorite SelectionThe context favorite dropdown list is available in the EPM Context bar when theShowContext Favoritesoption is selected in the Context Display tab of the Context Options and even if you have not yetcreated a context favorite (see Context Display Options).
Directly from the EPM Context bar, you can select a context favorite.
Other Actions on Context FavoritesFrom EPM > Options > Context Favorites, you can manage your context favorites:
2013-01-3050
Context
• To modify a favorite, select the favorite from the Favorite list. Modify the member selection. Whenyou click OK, the member selection is saved.
• To rename a favorite, select the favorite from the Favorite list and click Rename Favorite.• To delete a favorite, selecting the favorite from the Favorite list and click Rename Favorite.
Note:None of your modifications are saved until you click OK or if you click Cancel.
10.2 Context Display Options
You can specify display settings for the context by selecting EPM > Options > Context Options. Allthese settings will be applied to the EPM Context bar, and to the current user.• Hiding dimensions. You can choose not to display a dimension in the EPM Context bar. To do so,
select the Hide checkbox. The checkbox is available in both the Context Display and ContextLock tabs. For example, if you have locked a dimension on the worksheet, you may want to hide itfrom the EPM Context bar.
• Dimension and member name display. By default, in theEPMContext bar, the name of the dimensionand the name of the member are displayed. If you want only the member name and not the dimensionname to be displayed, you can uncheck the Show Dimension Name option.
• Dimension colors. In the EPM Context bar, colors are applied by default to all dimensions. You candefine the colors you want for each dimension by clicking the colored area in the Color column. Youcan also choose not to display the colors at all by unchecking the Show Dimension Color option.
• Dimension order. You can modify the default order of the dimensions as they appear in the EPMContext bar, by selecting a dimension and clicking the Up or Down button.
• Context favorite display. By default, in the EPMContext bar, the context favorite dedicated dropdownlist is not displayed. To display the dropdown list, check the Show Context Favorites option. Youcan specify if you want to display the list at the beggining or at the end of the bar by using the AtStart and At End options. The dropdown list is displayed even if you have not yet created a contextfavorite.
Note:You can access the four features above in the Context Display tab.
2013-01-3051
Context

2013-01-3052
Context
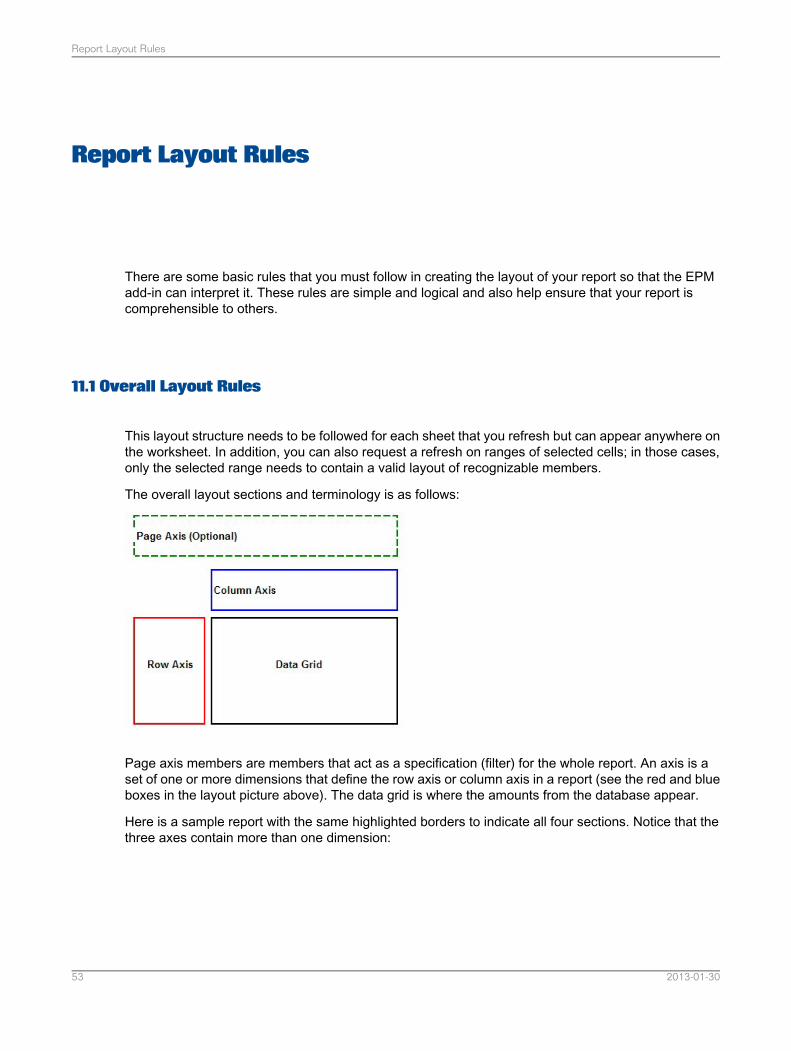
Report Layout Rules
There are some basic rules that you must follow in creating the layout of your report so that the EPMadd-in can interpret it. These rules are simple and logical and also help ensure that your report iscomprehensible to others.
11.1 Overall Layout Rules
This layout structure needs to be followed for each sheet that you refresh but can appear anywhere onthe worksheet. In addition, you can also request a refresh on ranges of selected cells; in those cases,only the selected range needs to contain a valid layout of recognizable members.
The overall layout sections and terminology is as follows:
Page axis members are members that act as a specification (filter) for the whole report. An axis is aset of one or more dimensions that define the row axis or column axis in a report (see the red and blueboxes in the layout picture above). The data grid is where the amounts from the database appear.
Here is a sample report with the same highlighted borders to indicate all four sections. Notice that thethree axes contain more than one dimension:
2013-01-3053
Report Layout Rules
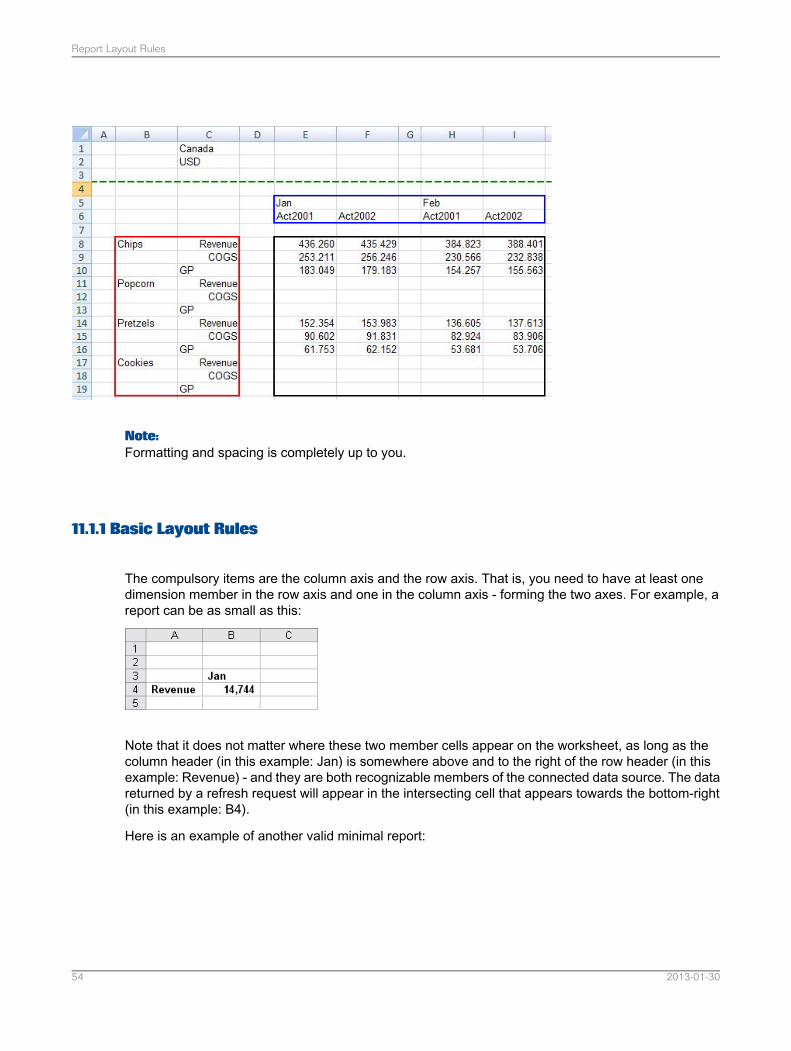
Note:Formatting and spacing is completely up to you.
11.1.1 Basic Layout Rules
The compulsory items are the column axis and the row axis. That is, you need to have at least onedimension member in the row axis and one in the column axis - forming the two axes. For example, areport can be as small as this:
Note that it does not matter where these two member cells appear on the worksheet, as long as thecolumn header (in this example: Jan) is somewhere above and to the right of the row header (in thisexample: Revenue) - and they are both recognizable members of the connected data source. The datareturned by a refresh request will appear in the intersecting cell that appears towards the bottom-right(in this example: B4).
Here is an example of another valid minimal report:
2013-01-3054
Report Layout Rules
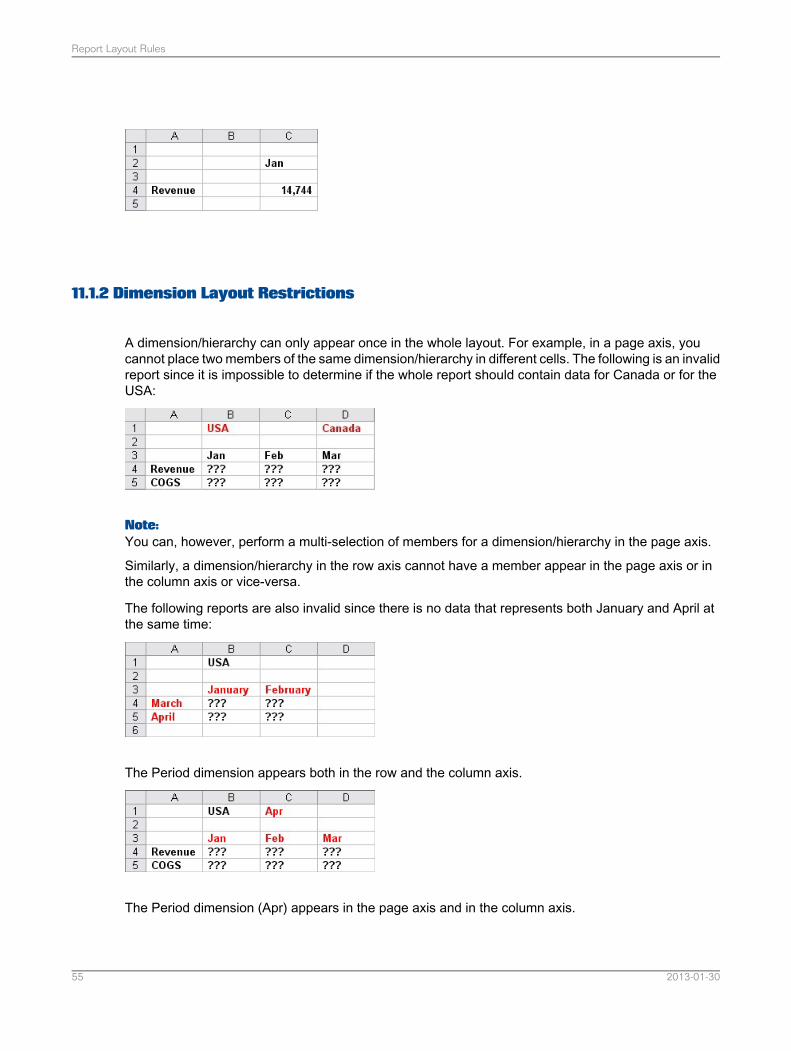
11.1.2 Dimension Layout Restrictions
A dimension/hierarchy can only appear once in the whole layout. For example, in a page axis, youcannot place two members of the same dimension/hierarchy in different cells. The following is an invalidreport since it is impossible to determine if the whole report should contain data for Canada or for theUSA:
Note:You can, however, perform a multi-selection of members for a dimension/hierarchy in the page axis.
Similarly, a dimension/hierarchy in the row axis cannot have a member appear in the page axis or inthe column axis or vice-versa.
The following reports are also invalid since there is no data that represents both January and April atthe same time:
The Period dimension appears both in the row and the column axis.
The Period dimension (Apr) appears in the page axis and in the column axis.
2013-01-3055
Report Layout Rules
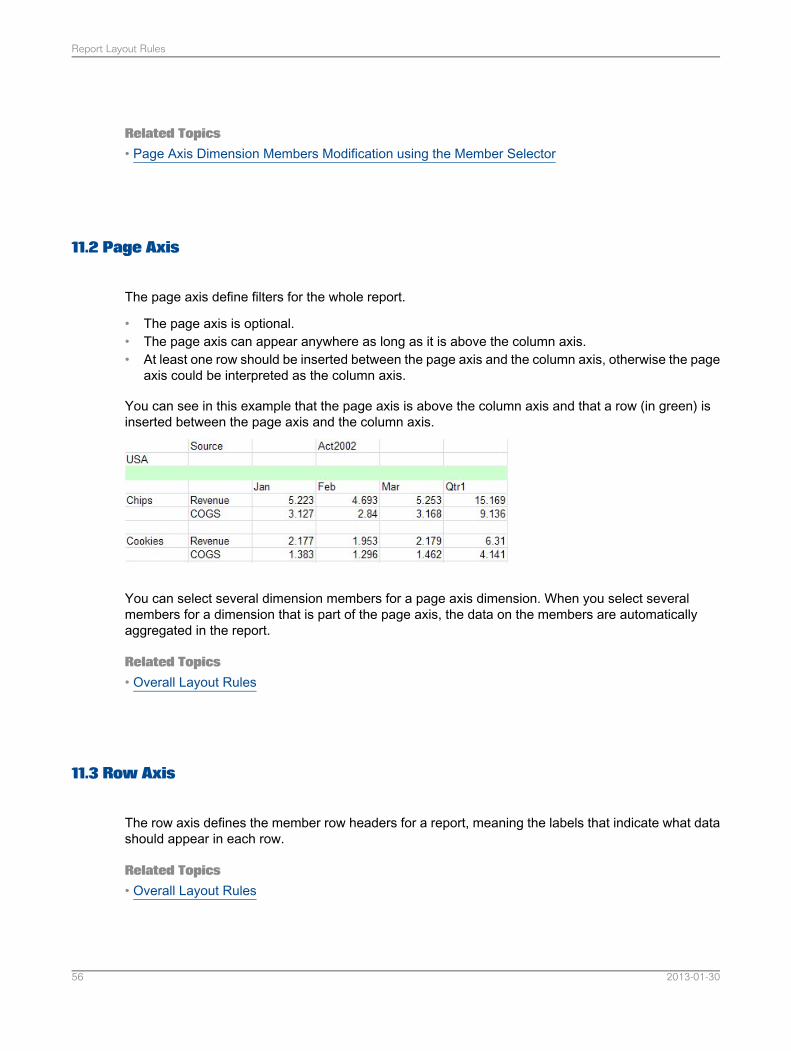
Related Topics• Page Axis Dimension Members Modification using the Member Selector
11.2 Page Axis
The page axis define filters for the whole report.
• The page axis is optional.• The page axis can appear anywhere as long as it is above the column axis.• At least one row should be inserted between the page axis and the column axis, otherwise the page
axis could be interpreted as the column axis.
You can see in this example that the page axis is above the column axis and that a row (in green) isinserted between the page axis and the column axis.
You can select several dimension members for a page axis dimension. When you select severalmembers for a dimension that is part of the page axis, the data on the members are automaticallyaggregated in the report.
Related Topics• Overall Layout Rules
11.3 Row Axis
The row axis defines the member row headers for a report, meaning the labels that indicate what datashould appear in each row.
Related Topics• Overall Layout Rules
2013-01-3056
Report Layout Rules
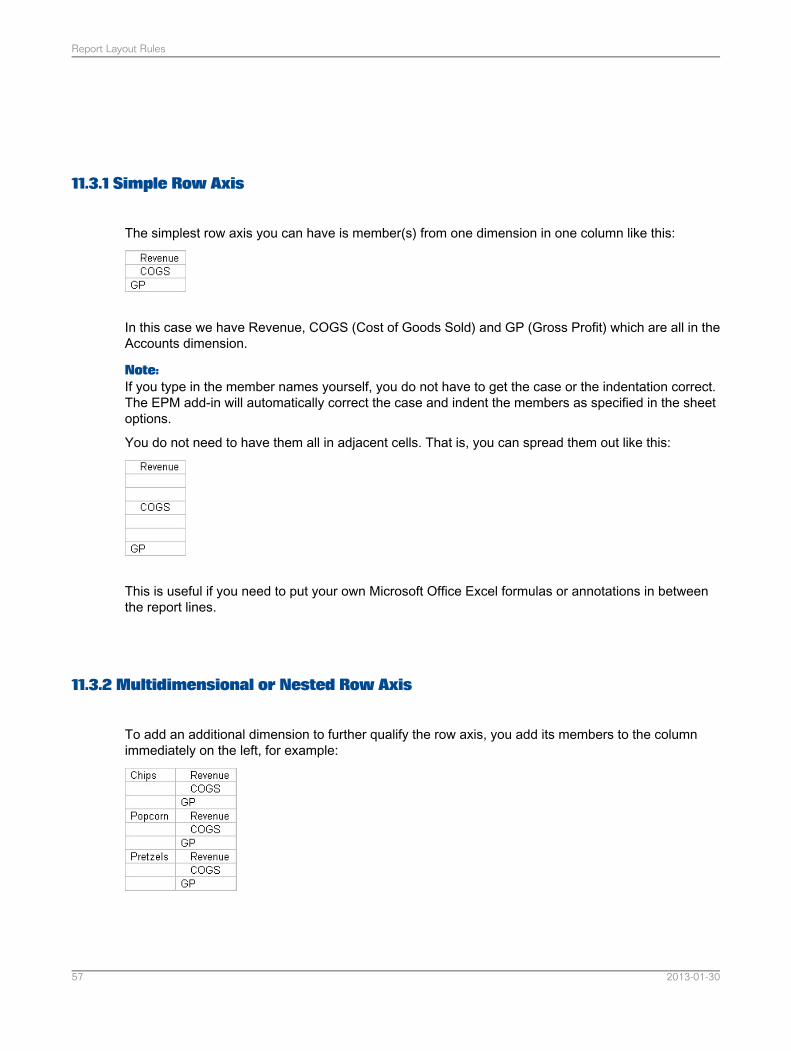
11.3.1 Simple Row Axis
The simplest row axis you can have is member(s) from one dimension in one column like this:
In this case we have Revenue, COGS (Cost of Goods Sold) and GP (Gross Profit) which are all in theAccounts dimension.
Note:If you type in the member names yourself, you do not have to get the case or the indentation correct.The EPM add-in will automatically correct the case and indent the members as specified in the sheetoptions.
You do not need to have them all in adjacent cells. That is, you can spread them out like this:
This is useful if you need to put your own Microsoft Office Excel formulas or annotations in betweenthe report lines.
11.3.2 Multidimensional or Nested Row Axis
To add an additional dimension to further qualify the row axis, you add its members to the columnimmediately on the left, for example:
2013-01-3057
Report Layout Rules
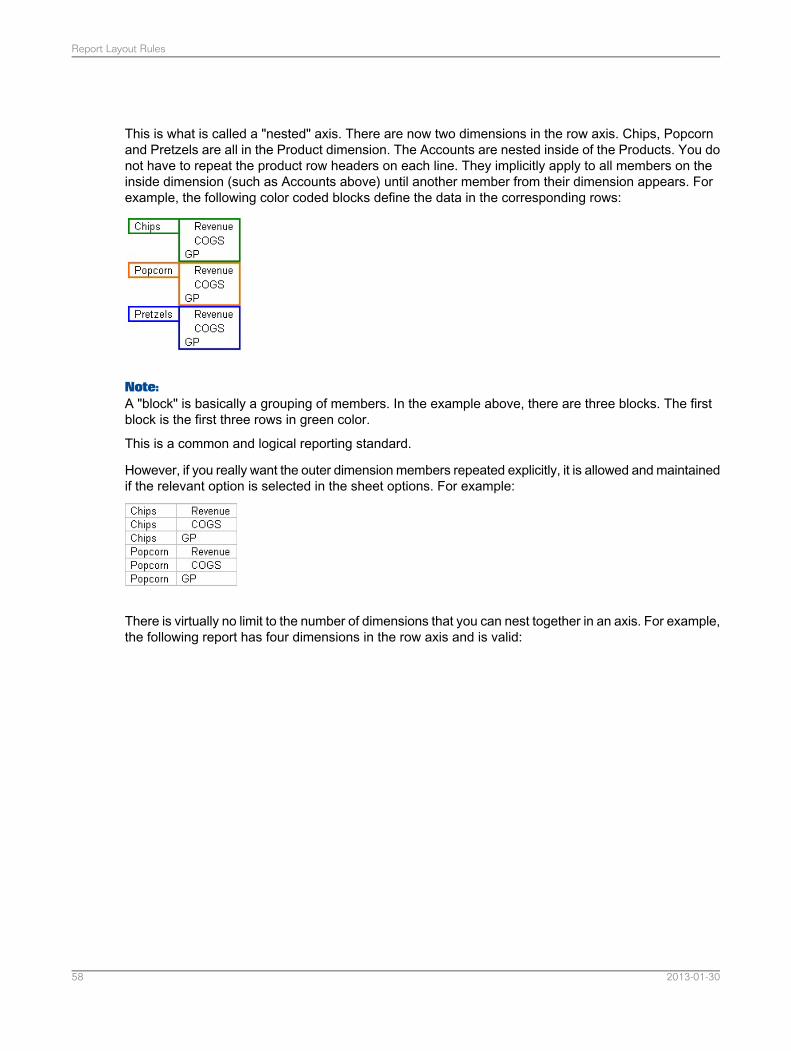
This is what is called a "nested" axis. There are now two dimensions in the row axis. Chips, Popcornand Pretzels are all in the Product dimension. The Accounts are nested inside of the Products. You donot have to repeat the product row headers on each line. They implicitly apply to all members on theinside dimension (such as Accounts above) until another member from their dimension appears. Forexample, the following color coded blocks define the data in the corresponding rows:
Note:A "block" is basically a grouping of members. In the example above, there are three blocks. The firstblock is the first three rows in green color.
This is a common and logical reporting standard.
However, if you really want the outer dimension members repeated explicitly, it is allowed and maintainedif the relevant option is selected in the sheet options. For example:
There is virtually no limit to the number of dimensions that you can nest together in an axis. For example,the following report has four dimensions in the row axis and is valid:
2013-01-3058
Report Layout Rules
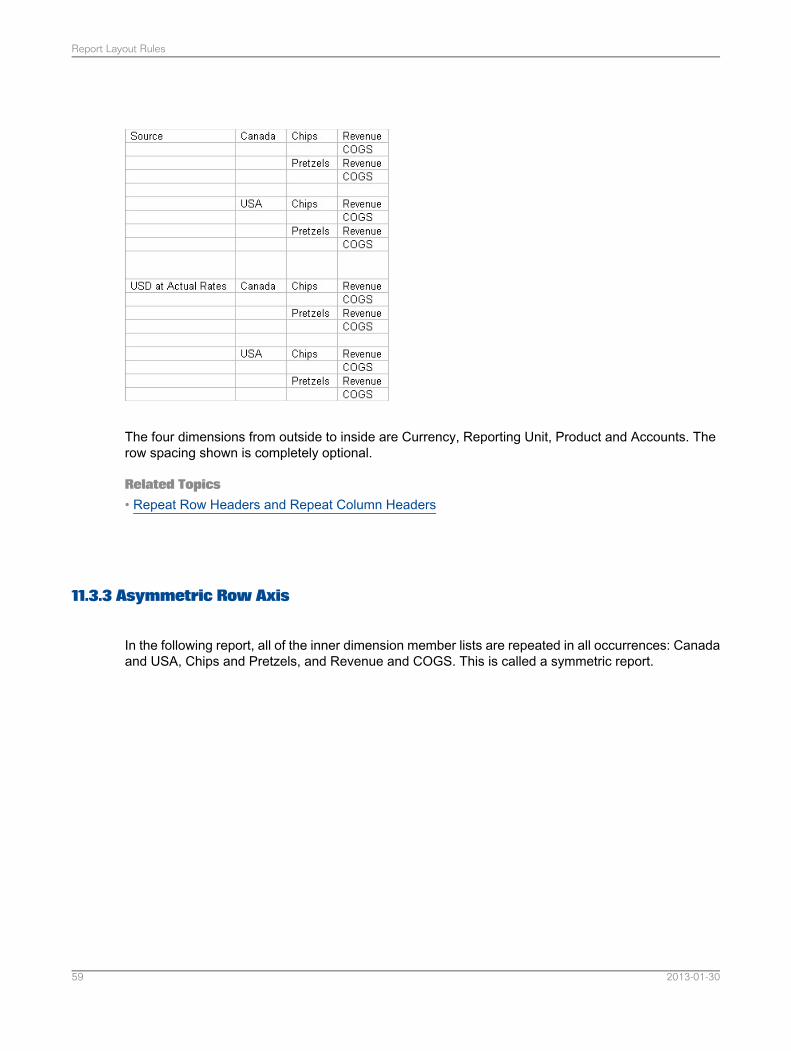
The four dimensions from outside to inside are Currency, Reporting Unit, Product and Accounts. Therow spacing shown is completely optional.
Related Topics• Repeat Row Headers and Repeat Column Headers
11.3.3 Asymmetric Row Axis
In the following report, all of the inner dimension member lists are repeated in all occurrences: Canadaand USA, Chips and Pretzels, and Revenue and COGS. This is called a symmetric report.
2013-01-3059
Report Layout Rules
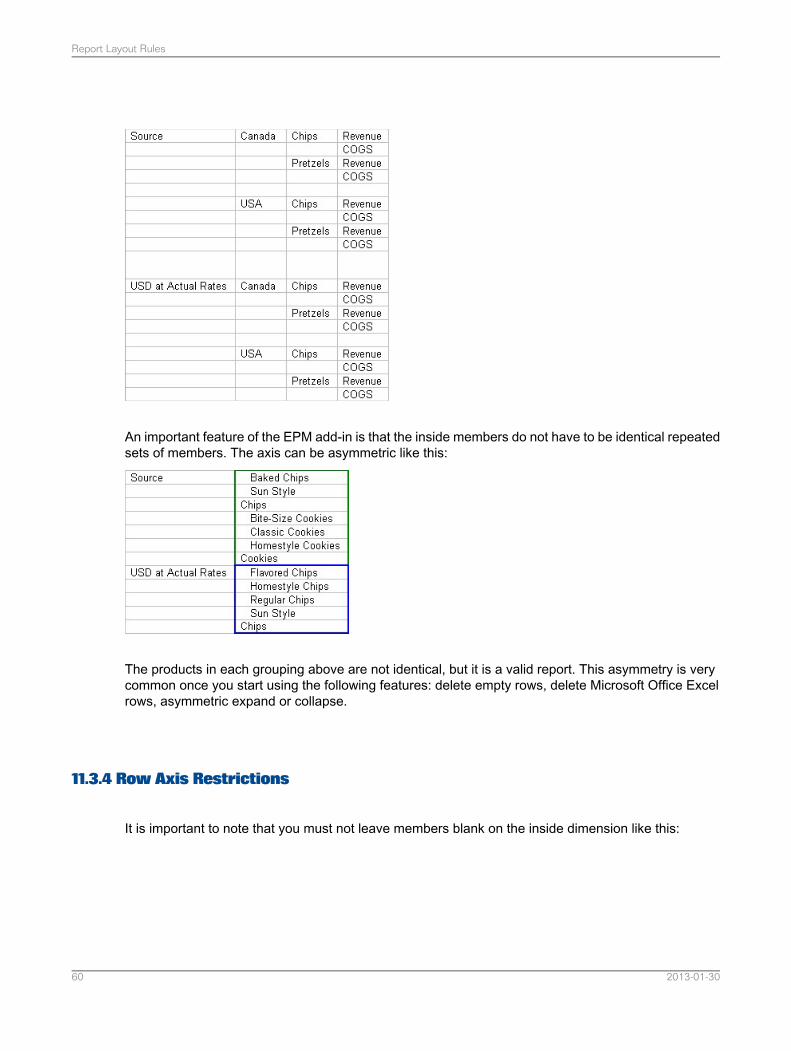
An important feature of the EPM add-in is that the inside members do not have to be identical repeatedsets of members. The axis can be asymmetric like this:
The products in each grouping above are not identical, but it is a valid report. This asymmetry is verycommon once you start using the following features: delete empty rows, delete Microsoft Office Excelrows, asymmetric expand or collapse.
11.3.4 Row Axis Restrictions
It is important to note that you must not leave members blank on the inside dimension like this:
2013-01-3060
Report Layout Rules
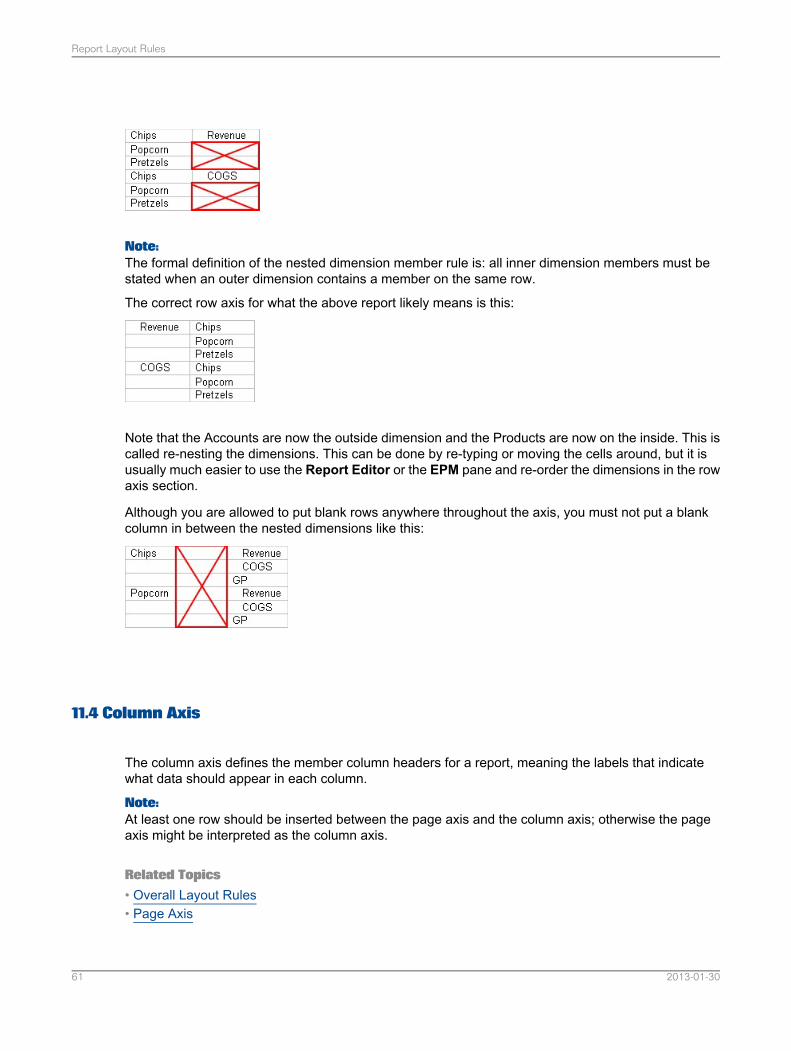
Note:The formal definition of the nested dimension member rule is: all inner dimension members must bestated when an outer dimension contains a member on the same row.
The correct row axis for what the above report likely means is this:
Note that the Accounts are now the outside dimension and the Products are now on the inside. This iscalled re-nesting the dimensions. This can be done by re-typing or moving the cells around, but it isusually much easier to use the Report Editor or the EPM pane and re-order the dimensions in the rowaxis section.
Although you are allowed to put blank rows anywhere throughout the axis, you must not put a blankcolumn in between the nested dimensions like this:
11.4 Column Axis
The column axis defines the member column headers for a report, meaning the labels that indicatewhat data should appear in each column.
Note:At least one row should be inserted between the page axis and the column axis; otherwise the pageaxis might be interpreted as the column axis.
Related Topics• Overall Layout Rules• Page Axis
2013-01-3061
Report Layout Rules
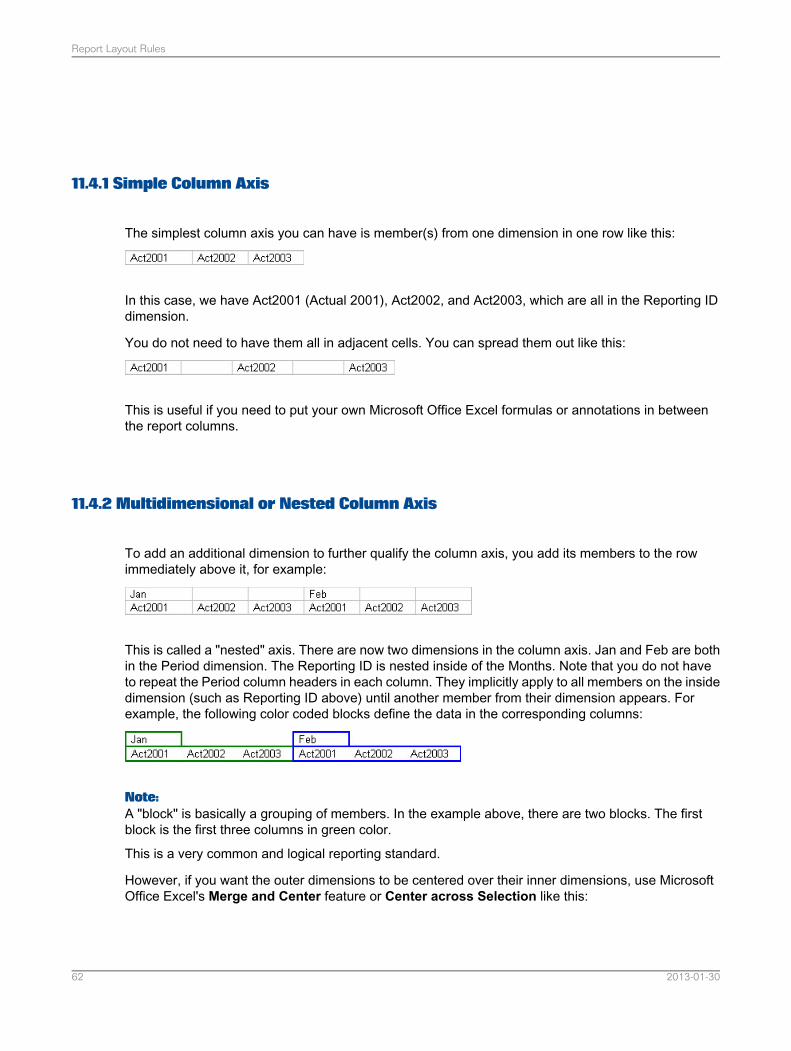
11.4.1 Simple Column Axis
The simplest column axis you can have is member(s) from one dimension in one row like this:
In this case, we have Act2001 (Actual 2001), Act2002, and Act2003, which are all in the Reporting IDdimension.
You do not need to have them all in adjacent cells. You can spread them out like this:
This is useful if you need to put your own Microsoft Office Excel formulas or annotations in betweenthe report columns.
11.4.2 Multidimensional or Nested Column Axis
To add an additional dimension to further qualify the column axis, you add its members to the rowimmediately above it, for example:
This is called a "nested" axis. There are now two dimensions in the column axis. Jan and Feb are bothin the Period dimension. The Reporting ID is nested inside of the Months. Note that you do not haveto repeat the Period column headers in each column. They implicitly apply to all members on the insidedimension (such as Reporting ID above) until another member from their dimension appears. Forexample, the following color coded blocks define the data in the corresponding columns:
Note:A "block" is basically a grouping of members. In the example above, there are two blocks. The firstblock is the first three columns in green color.
This is a very common and logical reporting standard.
However, if you want the outer dimensions to be centered over their inner dimensions, use MicrosoftOffice Excel's Merge and Center feature or Center across Selection like this:
2013-01-3062
Report Layout Rules
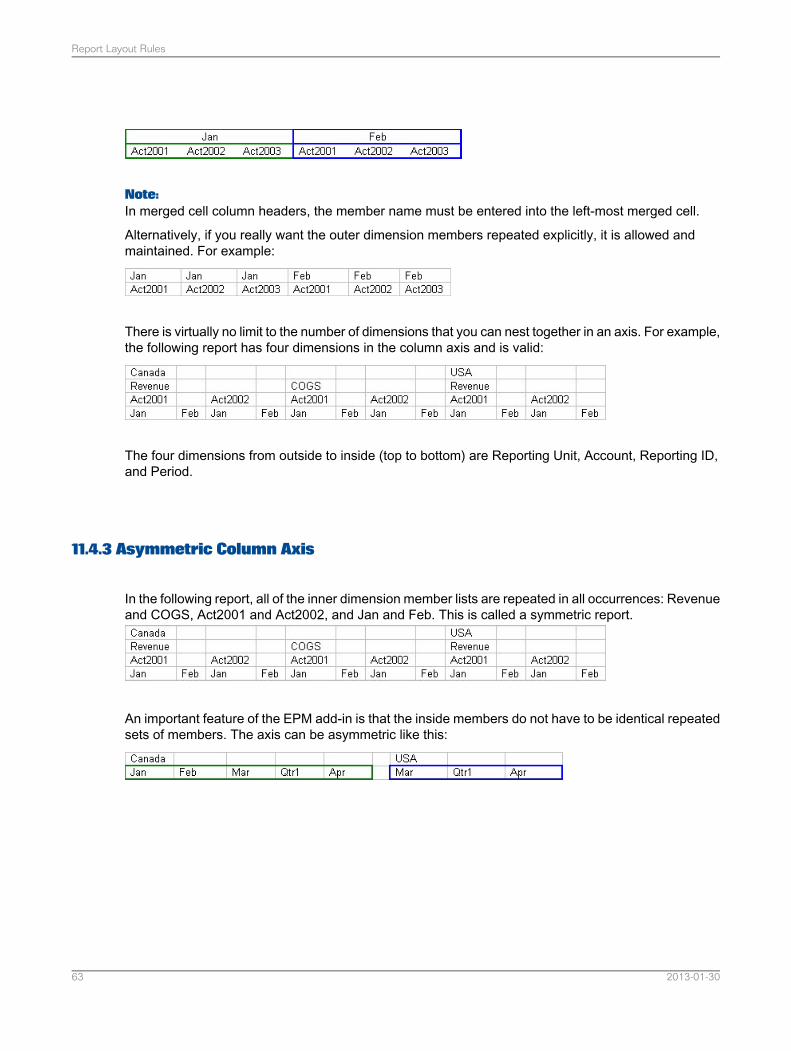
Note:In merged cell column headers, the member name must be entered into the left-most merged cell.
Alternatively, if you really want the outer dimension members repeated explicitly, it is allowed andmaintained. For example:
There is virtually no limit to the number of dimensions that you can nest together in an axis. For example,the following report has four dimensions in the column axis and is valid:
The four dimensions from outside to inside (top to bottom) are Reporting Unit, Account, Reporting ID,and Period.
11.4.3 Asymmetric Column Axis
In the following report, all of the inner dimension member lists are repeated in all occurrences: Revenueand COGS, Act2001 and Act2002, and Jan and Feb. This is called a symmetric report.
An important feature of the EPM add-in is that the inside members do not have to be identical repeatedsets of members. The axis can be asymmetric like this:
2013-01-3063
Report Layout Rules
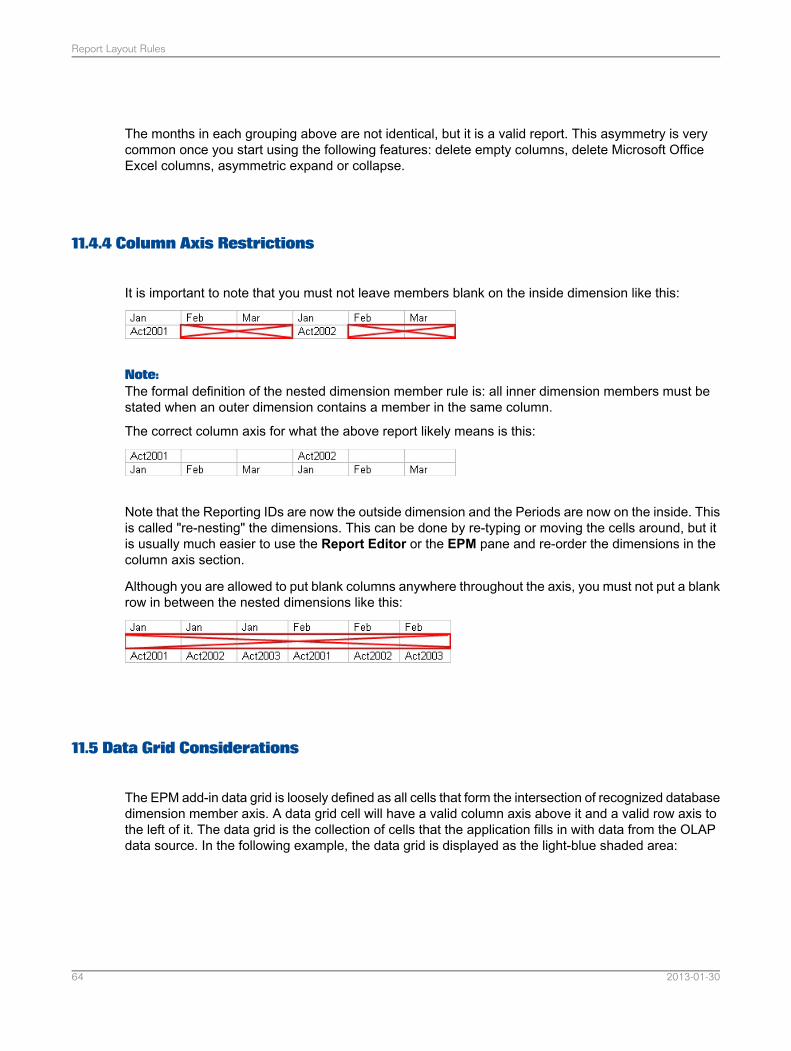
The months in each grouping above are not identical, but it is a valid report. This asymmetry is verycommon once you start using the following features: delete empty columns, delete Microsoft OfficeExcel columns, asymmetric expand or collapse.
11.4.4 Column Axis Restrictions
It is important to note that you must not leave members blank on the inside dimension like this:
Note:The formal definition of the nested dimension member rule is: all inner dimension members must bestated when an outer dimension contains a member in the same column.
The correct column axis for what the above report likely means is this:
Note that the Reporting IDs are now the outside dimension and the Periods are now on the inside. Thisis called "re-nesting" the dimensions. This can be done by re-typing or moving the cells around, but itis usually much easier to use the Report Editor or the EPM pane and re-order the dimensions in thecolumn axis section.
Although you are allowed to put blank columns anywhere throughout the axis, you must not put a blankrow in between the nested dimensions like this:
11.5 Data Grid Considerations
The EPM add-in data grid is loosely defined as all cells that form the intersection of recognized databasedimension member axis. A data grid cell will have a valid column axis above it and a valid row axis tothe left of it. The data grid is the collection of cells that the application fills in with data from the OLAPdata source. In the following example, the data grid is displayed as the light-blue shaded area:
2013-01-3064
Report Layout Rules

However, the application offers a lot more flexibility than the above tight grid layout. There are manyenhancements that you can make to and around the data grid to create a custom formatted report withadditional calculations. The following example contains exactly the same data grid as above, butdemonstrates several enhancements that will not prevent you from refreshing the report with theapplication.
Note that the unusual text and background formatting is only used here to help you differentiate theareas of the report.
2013-01-3065
Report Layout Rules
11.5.1 Data Grid Important Tips
Following are some important tips regarding the data grid:• Any number of blank rows or columns or both can be put anywhere throughout the grid. In other
words, the grid can be split up.
• You can format the cells any way that you want using Microsoft Office Excel formatting, includingscaling the data. The changes are retained by the application. However, if you expand on or pivotyour report, the formatting will not move with the cells. Therefore, it is recommended that you do allformatting last or apply dynamic formatting on the reports you want to analyze.
• Your own Microsoft Office Excel formulas can safely be entered anywhere except in a grid cell andthey will be retained in a subsequent Refresh. However, they will not be retained if you perform anavigational action (such as Expand, Collapse or Keep) that will change the size of the report. It isrecommended that you enter your custom formulas after you are finished doing ad-hoc manipulationsto the layout and content.
Note:If the Local Member Recognition is activated, any Microsoft Office Excel formula is automaticallyconverted into a local member.
• You can enter anything outside of the report area. It will be completely ignored by the applicationunless you expand your report.
Related Topics• Blank Row and Column Insertion• Dynamic Formatting• Local Members• Member Recognition
2013-01-3066
Report Layout Rules
Report Creation
You can create reports in four different ways:• Create reports using the EPM pane.• Create reports using the Report Editor.• Create reports directly in a sheet.• Create reports using the Copy and Paste features.
A report is created by default on the active connection of the worksheet. The active connection isdisplayed in theActive Connection dropdown list of the EPM pane and in the Layout tab of theReportEditor.
Related Topics• Logon and Connections
12.1 Member Identification and Properties
12.1.1 Member Identification
In the EPM add-in, each member that is part of a report is identified by a formula beginning with =EPMOlap.
2013-01-3067
Report Creation
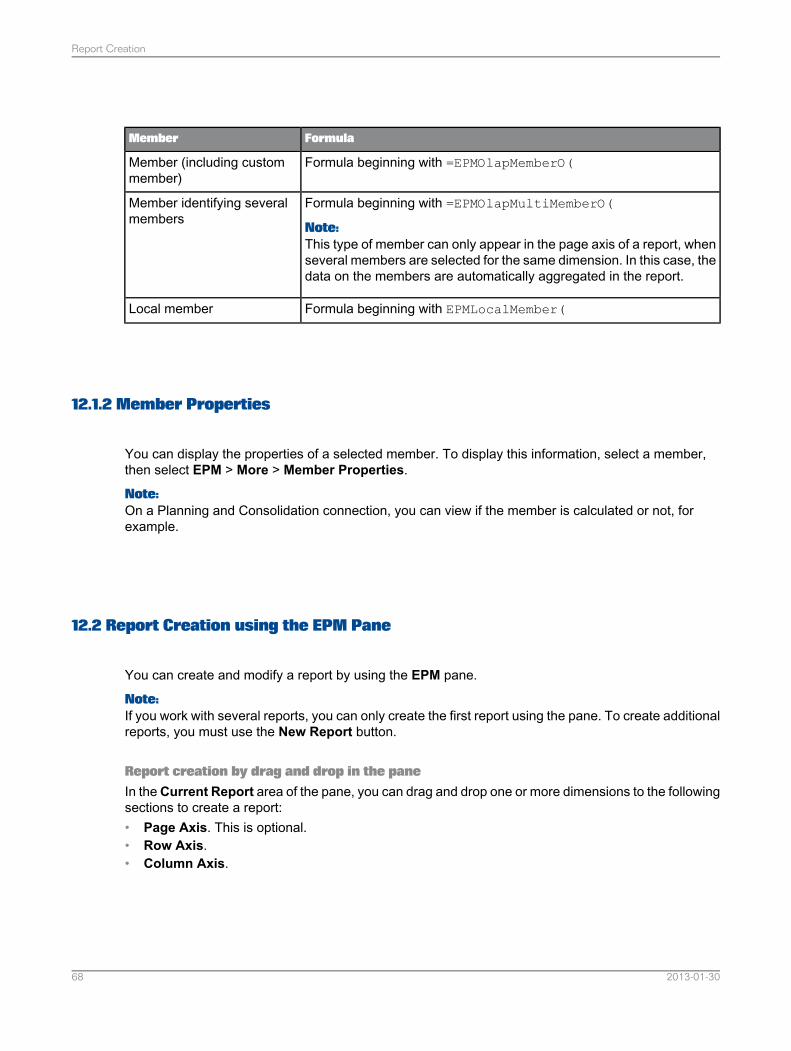
FormulaMember
Formula beginning with =EPMOlapMemberO(Member (including custommember)
Formula beginning with =EPMOlapMultiMemberO(
Note:This type of member can only appear in the page axis of a report, whenseveral members are selected for the same dimension. In this case, thedata on the members are automatically aggregated in the report.
Member identifying severalmembers
Formula beginning with EPMLocalMember(Local member
12.1.2 Member Properties
You can display the properties of a selected member. To display this information, select a member,then select EPM > More > Member Properties.
Note:On a Planning and Consolidation connection, you can view if the member is calculated or not, forexample.
12.2 Report Creation using the EPM Pane
You can create and modify a report by using the EPM pane.
Note:If you work with several reports, you can only create the first report using the pane. To create additionalreports, you must use the New Report button.
Report creation by drag and drop in the paneIn theCurrent Report area of the pane, you can drag and drop one or more dimensions to the followingsections to create a report:• Page Axis. This is optional.• Row Axis.• Column Axis.
2013-01-3068
Report Creation
As soon as you drag and drop at least one dimension in the row axis and one dimension in the columnaxis - and provided that the Defer Layout Update option is not checked, the report with the selecteddimensions is displayed in the worksheet.
By default, each time that you make a change in the axes sections, the report layout is automaticallyupdated. To improve performance when you are accessing a large amount of data, you can switch tomanual update. When you switch to manual update, you cannot use the report until you switch back toautomatic update. However, you can quickly add, move, and remove dimensions from the dimensionssection to the axes sections, and then switch back to automatic update to see your results. To enablemanual update, select the Defer Layout Update option. The Update button is enabled. When youfinish changing the report layout, click Update to see the layout in the worksheet.
By default the member taken into account for a dimension is the one defined in the context, with theMember and Children relationship. Once a dimension has been added to an axis section, you canselect another member for the dimension by clicking the dimension name that appears as a link. TheMember Selector opens and you can select the member you want.
When placing several dimensions in one axis, you can reorder the dimensions by selecting a dimensionrow (click on the right of the dimension link, not on the link itself) and performing a drag and drop.
In the page axis section, you can click on the cell reference of the dimension (D7 for example). Usingthe Cell Selection dialog box that opens, select the cell you want in the sheet to move the page axisdimension. An error message appears if you have selected a cell that is below the column axis.
Alternatively to some of the above features, you can perform the following actions:• In the dimension list section, using the arrow context menu (right-click), you can add the selected
dimension to:• The page axis by clicking the Move to Page Axis command.• The row axis by clicking the Move to Row Axis command.• The column axis by clicking the Move to Column Axis command.
• In the page, row and column axes sections, clicking the arrow that appears when you mouse overa member, you can:• Select members for the selected dimension by clicking theSelect DimensionMembers command.
The Member Selector opens and you can select the members you want.• Move the dimension to another axis, by clicking the Move to Page Axis, Move to Row Axis or
Move to Column Axis command.• Remove the dimension from the axis by clicking the Remove command.
• In the row and column axes sections only, you can reorder the dimensions if you have selectedmore than one dimension in an axis. To do so, use the Move to the Top, Move Up, Move to theBottom and Move Down commands.
• In the page axis section only, you can click the Change Cell... command. Using the Cell Selectiondialog box that opens, select the cell you want in the sheet to move the page axis dimension.
Report creation by drag and drop in the worksheetYou can drag and drop dimensions or hierarchies from the Current Report list directly to the worksheetto create a report:
2013-01-3069
Report Creation
• For a Planning and Consolidation connection. The member that is selected in the context is displayedby default in the report, with the following relationship: Member Only. Therefore, when you changea member in the EPM Context bar, the member will also change in the report.
• For a local or SAP BusinessObjects Enterprise connection. The context member or the defaultmember is displayed by default in the report, with the following relationship: Member Only. Whenseveral hierarchies exist for a dimension, a member node that belongs to one hierarchy may notbelong to another hierarchy. For this reason, the context member is taken into account if the memberbelongs to the hierarchy you drag and drop. If the context member does not belong to the hierarchyyou drag and drop, it is the default member of the hierarchy (this is defined in the cube or model)that is taken into account.
Related Topics• Several Reports in a Sheet
12.3 Report Creation using the Report Editor
The Report Editor dialog box plays several roles:• It can act as a graphic user interface for defining an initial report on a blank worksheet.• It can be used to define other reports on a sheet already containing a report.• It can be used at any time on a valid report to re-arrange the layout or change the members in each
section of the report: move (pivot) one or more dimensions between the page headers, row axis andcolumn axis; reorder the nesting of dimensions within an axis; or change the selection or order ofmembers of one or more dimensions in the report.
• It can be used to define report position: moving a report in a sheet, inserting a separation betweenaxis and data, moving each page axis dimension individually.
You can perform all the above actions in the Layout tab of the Report Editor.
Note:Using the other tabs of the Report Editor, you can also define specific options for the current report,enter customized names for the members, exclude members from the report, define sorting, filteringand ranking on the current report data.
You can access the Report Editor dialog box by clicking Edit Report in the ribbon. The Report Editorperforms a refresh after it closes since the report must be valid to close it.
Related Topics• Report Editor's Layout Tab Presentation• Several Reports in a Sheet
2013-01-3070
Report Creation
12.3.1 Report Editor's Layout Tab Presentation
To define or modify your report layout, click on Edit Report in the EPM tab of the ribbon. The ReportEditor dialog box opens, displaying the Layout tab by default.• You can perform drag and drop operations between the three axes and the Dimensions areas.• On the left side is the Dimensions area which displays all the available dimensions, along with their
hierarchies.
Note:If named sets are included in SSAS cubes created with Financial Consolidation Cube Designer,they will also appear along with the dimensions at the hierarchy level. The hierarchies appear inblack, whereas the named sets appear in blue. When a named set is created in SAP BusinessObjectsFinancial Consolidation, cube designer, the default hierarchy (flat list) automatically comes along.As a consequence, both the named set and the default hierarchy appear below the dimension inthe Report Editor. Note that, once you have included the named set in the view, you cannot includethe default hierarchy anymore.
• On the right side is an intuitive view of the dimensional layout of the report.
Note:Note that you can add an unused dimension in the Dimensions area to any section, and remove adimension from any axis area by dragging it back into the Dimensions area.
• On the right side, you can dynamically modify your report at any time with actions such as pivoting,re-nesting (reordering dimensions within an axis) or changing the member selections. On the rightside, you can also:• Define a shift between the data grid of the report and its row and column headers.• Move the whole report by defining the position of the top left cell of the data grid.• Define the position of each dimension of the page header.
When you click OK in the Report Editor, the report is refreshed automatically.
Note:Alternatively to some of the main features, using the context menu (right-click) in the dimension listsection and the three axes sections, and depending on the section you are in, you can perform thefollowing actions:• In the dimension list section, you can add the selected dimension to:
• The page axis by clicking the Move to Page Axis command.• The row axis by clicking the Move to Row Axis command.• The column axis by clicking the Move to Column Axis command.
• In the page, row and column axes sections, you can:• Select members for the selected dimension by clicking theSelect DimensionMembers command.
The Member Selector opens and you can select the members you want.• Move the dimension to another axis, by clicking the Move to Page Axis, Move to Row Axis or
Move to Column Axis command.
2013-01-3071
Report Creation
• Remove the dimension from the axis by clicking the Remove command.• In the row and column axes sections only, you can order the dimensions if you have selected more
than one dimension in an axes. To do so, use the Move to the Top, Move Up, Move to the Bottomand Move Down commands.
• In the page axis section only, you can click the Change Cell... command. Using the Cell Selectiondialog box that opens, select the cell you want in the sheet to move the page axis dimension.
12.3.2 Dimension Placement in the Report Editor
You can use the Report Editor at any time on a valid report to re-arrange the layout or change themembers in each section of the report: move (pivot) one or more dimensions between the page axis,row axis and column axis; reorder the nesting of dimensions within an axis; or change the selection ororder of members of one or more dimensions in the report.
To define your layout, simply drag and drop your required dimensions to the correct sections of thereport. This includes moving the dimension name from one section to another or changing the order ofthe dimensions within a section.
In the Dimensions area, the dimensions and hierarchies with a red cross indicate that they alreadyappear in the report. Dimensions that are not already in the report can be dragged into the layout fromthere. To remove a dimension from the layout, drag it to the Dimensions area.
If you add a dimension to the page axis section, it will default to the cell on the right side of the pageaxis that you drop it under.
To remove all dimensions from the layout, click Reset Report.
Example:
In the following example you can see the effect of the order of the dimensions in an axis. This appliesto the column axis also.
Product Before AccountAccount Before Product
Row Axis Dimensions:
Product.Family
Account
Row Axis Dimensions:
Account
Product.Family
2013-01-3072
Report Creation
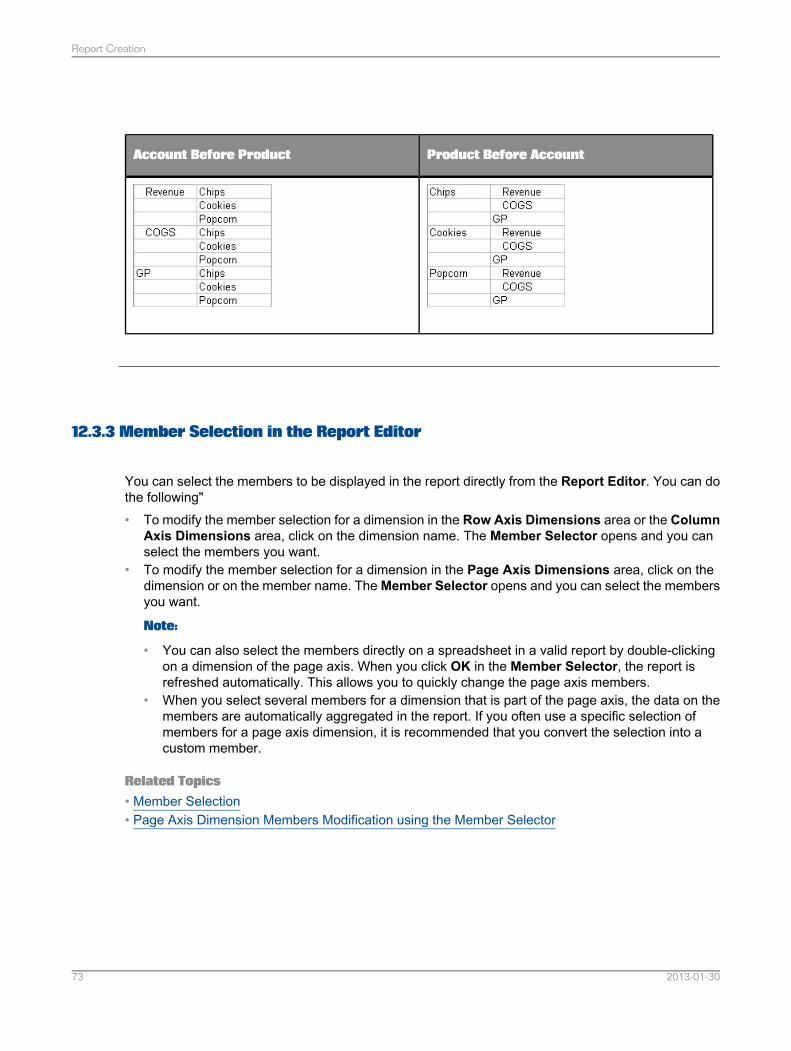
Product Before AccountAccount Before Product
12.3.3 Member Selection in the Report Editor
You can select the members to be displayed in the report directly from the Report Editor. You can dothe following"• To modify the member selection for a dimension in the Row Axis Dimensions area or the Column
Axis Dimensions area, click on the dimension name. The Member Selector opens and you canselect the members you want.
• To modify the member selection for a dimension in the Page Axis Dimensions area, click on thedimension or on the member name. The Member Selector opens and you can select the membersyou want.
Note:
• You can also select the members directly on a spreadsheet in a valid report by double-clickingon a dimension of the page axis. When you click OK in the Member Selector, the report isrefreshed automatically. This allows you to quickly change the page axis members.
• When you select several members for a dimension that is part of the page axis, the data on themembers are automatically aggregated in the report. If you often use a specific selection ofmembers for a page axis dimension, it is recommended that you convert the selection into acustom member.
Related Topics• Member Selection• Page Axis Dimension Members Modification using the Member Selector
2013-01-3073
Report Creation
12.3.4 Position of each Dimension in the Page Axis using the Report Editor
Each dimension in the page axis can be positioned individually.
You can position a page axis dimension anywhere as long as it is above the column axis
In the page axis area of theReport Editor, click on the cell reference of the dimension (D7 for example).Using the Cell Selection dialog box that opens, select the cell you want in the sheet to move the pageaxis dimension. An error message appears if you have selected a cell that is below the column axis.
12.3.5 Report Move in the Sheet using the Report Editor
You can move a report in the sheet simply by choosing one cell in the Report Editor.
The cell displayed by default in the middle of the four blue arrow buttons in the Report Editor,corresponds to the top left cell of the data grid (B22 for example). You can change it by entering thecell reference or using the arrow buttons. The whole report is moved based on this cell, as soon as youclick OK.
12.3.6 Shift Insertion Between the Data Grid of the Report and its Row and ColumnAxis
Using the Report Editor, you can insert a separation between the data grid and:• The row axis.• The column axis.
To do so, use the Shift area.
Note:You can enter negative numbers for the row axis. In this case, the row axis will be positioned on theright side of the data grid.
Example:• If you enter 2 in the Shift area below the column axis area, one column will be inserted between
the data grid and the column axis.• If you leave 1 by default in the Shift area on the right of the row axis area, no row will separate the
data grid from the row axis.
2013-01-3074
Report Creation
12.4 Report Creation Directly in a Sheet
You can create a report manually.
You can enter dimension members and create local members directly in a cell of a report. You can alsouse the Auto Fill feature to automatically fill in cells with all the members of the same level in the hierarchyorder. To do so, you use the Member Recognition and the Local Member Recognition features.
When you manually create a report, you can also get assistance to select members:• Using the Member Selector that you access through the Report Editor, the EPM pane or by
double-clicking a member located in the report page axis.• Using the Insert Members dialog box that you access by right-clicking in the row or columns axis
of a report.
12.4.1 Member Recognition
You can enter members directly in a cell of a report. You can also enter Microsoft Office Excel formulas.
When the Member Recognition feature is activated, the members are automatically recognized.
When the Local Member Recognition feature is activated, the Microsoft Office Excel formulas areautomatically converted into local members.
The Member Recognition features can be activated or deactivated by sheet or for all sheets.
12.4.1.1 Member Entry Directly in a Sheet
Instead of using the Report Editor dialog box, you can enter text and figures directly in the cells of asheet if you know the names of the members you want to retrieve. The Member Recognition featuremust be activated.
You can enter a complete dimension member name or just a part of it. If you correctly enter the completedimension member name, as soon as you press the Enter key, a green flash briefly appears in the cell,indicating that the member has been recognized. When you enter a part of a dimension member name:• If the member name fragment is unique in the cube, as soon as you press the Enter key, the name
is automatically completed and a green flash briefly appears in the cell, indicating that the memberhas been recognized.
• If the member name fragment is not sufficient to identify the member, the Ambiguous Name dialogbox opens, displaying all the members contained in the cube that might match the entered member.
2013-01-3075
Report Creation
If you do not select any member in the dialog box and close it - and provided that the Apply SpecificFormatting to Unrecognized Members user option is selected, the cell in which you have enteredthe member name is applied a specific formatting to indicate that the member is not recognized.The formatting is a standard Microsoft Excel style called EPMUnrecognizedMember. You canmodify the settings of the style.
Note:
• The recognized members are uniquely identified. When you select a member in the sheet, theMicrosoft Office Excel Formula bar displays: = EPMOlapMemberO(xxx).
• You can define a member based on a formula. If the member is unique, it is converted into a memberand the link will be kept inside the formula. For example, you can have "=Sheet2!D4" picking up thevalue "Ohio" from another worksheet. This allows you to create reporting templates where you canchange "Ohio" to say "New York" in one place and then update (Refresh) all the related reports toget "New York" data. In this case, the report loses its dynamicity and therefore becomes a staticreport.
• To create a blank member, enter blank in a cell of a report and press the Enter key. For moreinformation about blank members, see Blank Row and Column Insertion.
12.4.1.2 Blank Row and Column Insertion
In a report, you can insert a Microsoft Office Excel blank row or column to add a formula, a text or tobe used as a separation row or column.
When you perform a refresh of the report, the inserted row or column remains.
Note that a row or column is inserted at a fixed location (cells 6B for example).• If you want a blank row or column to be specifically attached to a member for example, you should
create a local member.• You can also create a blank member that behaves like any standard member, entering blank
directly in a cell of a report or using the Selection Relationship area of the Member Selector.
Related Topics• Local Members• Selection Relationship
12.4.1.3 Microsoft Office Excel Formula Entry Directly in a Sheet
You can use Microsoft Office Excel formulas to perform calculations. All Microsoft Office Excel formulasare automatically converted into local members.
2013-01-3076
Report Creation
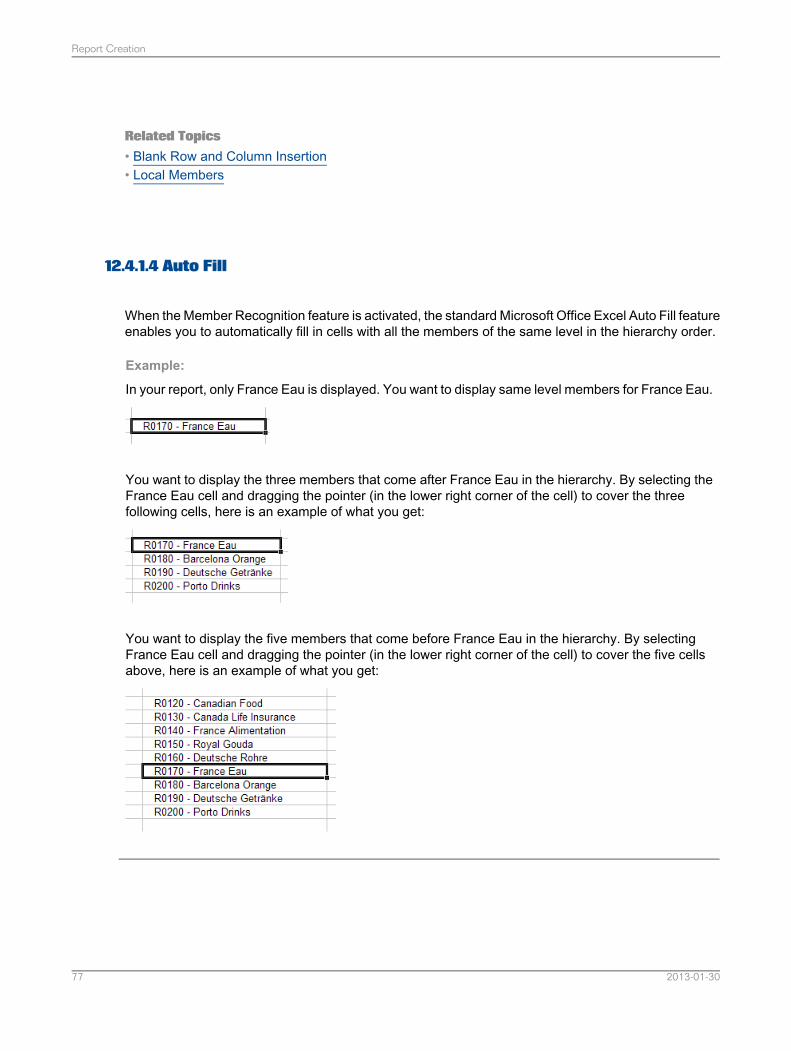
Related Topics• Blank Row and Column Insertion• Local Members
12.4.1.4 Auto Fill
When the Member Recognition feature is activated, the standard Microsoft Office Excel Auto Fill featureenables you to automatically fill in cells with all the members of the same level in the hierarchy order.
Example:
In your report, only France Eau is displayed. You want to display same level members for France Eau.
You want to display the three members that come after France Eau in the hierarchy. By selecting theFrance Eau cell and dragging the pointer (in the lower right corner of the cell) to cover the threefollowing cells, here is an example of what you get:
You want to display the five members that come before France Eau in the hierarchy. By selectingFrance Eau cell and dragging the pointer (in the lower right corner of the cell) to cover the five cellsabove, here is an example of what you get:
2013-01-3077
Report Creation
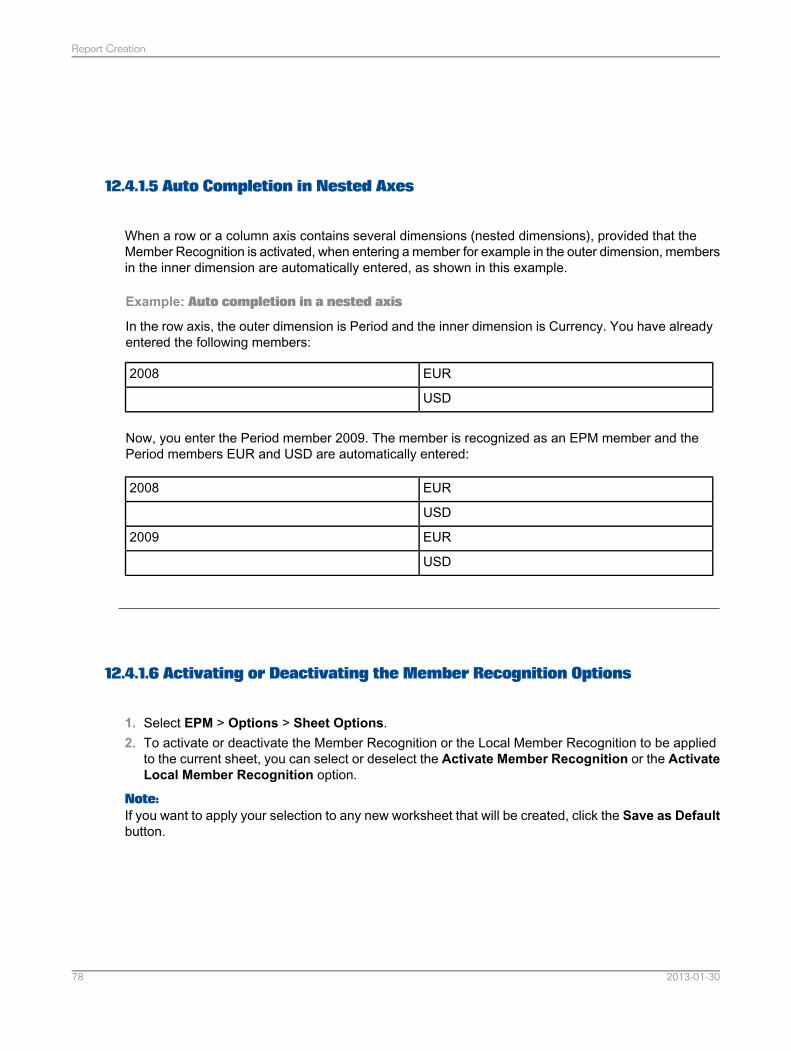
12.4.1.5 Auto Completion in Nested Axes
When a row or a column axis contains several dimensions (nested dimensions), provided that theMember Recognition is activated, when entering a member for example in the outer dimension, membersin the inner dimension are automatically entered, as shown in this example.
Example: Auto completion in a nested axis
In the row axis, the outer dimension is Period and the inner dimension is Currency. You have alreadyentered the following members:
EUR2008
USD
Now, you enter the Period member 2009. The member is recognized as an EPM member and thePeriod members EUR and USD are automatically entered:
EUR2008
USD
EUR2009
USD
12.4.1.6 Activating or Deactivating the Member Recognition Options
1. Select EPM > Options > Sheet Options.2. To activate or deactivate the Member Recognition or the Local Member Recognition to be applied
to the current sheet, you can select or deselect the Activate Member Recognition or the ActivateLocal Member Recognition option.
Note:If you want to apply your selection to any new worksheet that will be created, click the Save as Defaultbutton.
2013-01-3078
Report Creation
12.4.2 Member Entry Using the Member Selector
When you manually create or modify a report, you can get assistance from theMember Selector dialogbox which allows you to select any dimension members to help you construct your report layout.
12.4.2.1 Member Selector Presentation
TheMember Selector can be accessed through theReport Editor, the EPM pane or by double-clickinga member located in the report page axis.
The Member Selector is composed of the following areas:• In the title bar, the name of the dimension/hierarchy is displayed.• Hierarchy or list display. Using the dropdown list, you can display the members in a simple list or in
the hierarchy in the Dimension Members area.
Note:When displaying the members in a list, you can click the Member Name header and the membersare sorted by ascending/descending order.
• Member names to display. You can choose other member names to display as alternatives to thecaptions, depending on what has been defined in the cube or model. Use the list icon.
• Member filtering by properties. To help you select members, you can filter the members by propertyvalue.
• Member search. You can search for a specific member. Using the binoculars icon, enter your searchtext into the Find What text box and then click on the Find button.
Note:
• The search is not case-sensitive (for example: "Shares" and "shares" will be treated the same).
• You do not need the full member name (see "shares" example in the picture above").
• It starts from the selected (highlighted) member and goes down.
• It searches through all members, not just the visible ones.
• It will expand and scroll the tree to display each member found.
• It will tell you when it reaches the bottom and ask you if you want to restart at the top.
• It will tell you if there are no occurrences at all.
• Member Sorting & Grouping button. You can sort and group the selected members based onproperty values.
2013-01-3079
Report Creation
• Dimension Members list. This list contains all the members of the current dimension. The membertree can be expanded by clicking the + icon, and contracted by using the - icon as necessary to viewand select members.
Note:
• If you have created custom members for a specific dimension, they appear in the DimensionMembers list.
• If you have entered a customized name for a member, it appears in this list.• Buttons to select members.• Selected Members area. It is where you select and order the members of the currently selected
dimension that you want to appear in the report.• Selection Relationship drop-down list. It allows you to select many members at once based on
their relationship to selected (checked) members.• Hierarchy Levels options. For some dynamic relationships, you can define the levels of the hierarchy
you want to display.
Related Topics• Renaming Members
12.4.2.2 Member Selection
• Even if you have not selected a member to display in the report, when you open the MemberSelector, a member is selected by default.• For a Planning and Consolidation connection: the member that is selected in the context is
selected by default in theMember Selector, with the following relationship:Member andChildren.Therefore, if you choose to keep the context member selection in your report, when you changea member in the EPM Context bar, the member will also change in the report.
• For a local or SAP BusinessObjects Enterprise conection: the context member or the defaultmember is selected by default in the Member Selector. When several hierarchies exist for adimension, a member node that belongs to one hierarchy may not belong to another hierarchy.For this reason, the context member is taken into account if the member belongs to the currenthierarchy. If the context member does not belong to the current hierarchy, it is the default memberof the hierarchy (this is defined in the cube or model) that is taken into account.
• Members can be added to (or removed from) the Selected Members list using the right and leftarrow buttons to add or remove the selection made in the Dimension Members list.
Note:The arrow to the right button will copy the checked members, and any related members dependingon the Selection Relationship choice, to the bottom of the selected members list. The arrow to theleft button will remove the selected members from the Selected Members list.
2013-01-3080
Report Creation
Note:The parents of members default to the bottom of their children on the Selected Members list. Thisis because in most reporting situations, totals and sub-totals appear at the bottom.
• When selecting several items (members or filters by properties), by default, all the items will bedisplayed in the report: the + operator (=OR) is applied by default when you add an item in theSelected Members area. You can select the & operator (=AND), so that only the members at theintersection of the different items are displayed. The& operator takes precedence over the + operator.Colors indicate how the items are combined.
• You can reorder the members in the list by selecting one or more of the members and then usingthe reorder buttons.
Note:Alternatively, you can also drag and drop a selected member or members within the list to reorderthem. Use the Ctrl or Shift keys to select multiple members like in any standard Microsoft list. Youcan also delete member(s) by selecting them and then pressing the Delete key.
Related Topics• Context
12.4.2.3 Blank Member
Using the Member Selector, you can create and insert a blank member for the current dimension. Thismember behaves like any other standard member.
When you open the Member Selector, do not select any member in the Dimension Members area,and select Blank Member from the Selection Relationship dropdown list. Then add it to your memberselection by using the right arrow button. Once the blank member is displayed in the Selected Membersarea, order it as it will appear in the report.
Note:Since it behaves like a standard member, a blank member is dynamic and moves as you navigate ina report.• You can insert a Microsoft Office Excel blank row or column, but the row or column will be fixed
(cells 6B for example).• If you want a blank row or column to be specifically attached to a member, for example, you should
create a local member.• To create a blank member, you can also enter blank directly in a cell of a report.
Related Topics• Blank Row and Column Insertion• Local Members
2013-01-3081
Report Creation
12.4.2.4 Member Name to Display
You can choose other member names to display as alternatives to the captions, depending on whathas been defined in the cube or model.
You can select the names to display from the dropdown list next to hierarchy/list dropdown list.
The following items are available depending on the connection and the application:• Local and SAP BusinessObjects connections:
• Financial Consolidation: code, short description, long description, extra-long description. Propertiesand attributes can also be available.
• Profitability and Cost Management: only the captions are available.• Planning and Consolidation connections: ID, description, ID-description.
Related Topics• Display Name
12.4.2.5 Selection Relationship
The Selection Relationship list allows you to automatically select members based on their relationshipto the selected (checked) members in the Dimension Members List. This can save you a lot of time.For example, you may want all the children of a specific member or members, or you may want themember and all its ascendants.
If you select the Dynamic option (selected by default), each time you perform a refresh on the report,the report will automatically pick up new members or remove members that have been deleted fromthe cube or model.
The following list shows the supported relationships.
Note:The first time you open the Member Selector, the default relationship is Member and Children. Theselection you then make is persistent: the next time you open the Member Selector, the relationshipselected by default will be the last one you have selected.
• Member Only• Member and Children• Children• Member and Descendants• Descendants
2013-01-3082
Report Creation
• Base Level• Same Level• Siblings• Member and Ascendants• Ascendants• Member and Base Level• Member Offset
When selected, theMember Offset area is displayed. This feature enables you to display a memberrelated to another member by specifying an offset from a given member to retrieve the previous orsubsequent member.
You can also specify a hierarchy level. By default (Member Level option), the member at the samelevel as the member specified is incremented. You can also choose a specific level.
Note:When you choose a specific level using the Level option, note that only the members that are abovethe selected member or at the same level in the hierarchy, will be displayed. If you specify a levelthat is below the selected member, the level will be ignored. See the second example below.
• Example with the Member Level option: you select 2009.Q1 in the list of dimensions and youspecify an offset of 2. The 2009.Q3 member will be displayed in the report.
• Example with the Level option: you select Quarter 1 in the list of dimensions, then you specifyan offset of 3, then you specify the level 2. The member displayed in the report will be the thirdmember (increment based on member Quarter 1) at the same level of Quarter 1: Quarter 4. Sincethe second level of the hierarchy is below Quarter 1 level in the hierarchy, the level is thereforeignored.
• Member Property
When selected, the Member Property area is displayed and enables you to select a property. Thisfeature enables you to display the property value of the selected member, that is another memberof the same dimension.
For example, you check the member ACTUAL, then select Member Property from the SelectionRelationship list, then select the COMPARISON property. In your report, the member BUDGET isdisplayed, as this is the comparison value for the ACTUAL member. If there is no property value fora member, the member is retrieved in the report cell.
• Dimension Property
You can select Dimension Property when there are two dimensions in the current axis (row orcolumn axis) and when you do not select any member in the Dimension Members area of theMember Selector. OnceDimension Property is selected, theDimension Property area is displayedand enables you to select a dimension and a property for the dimension. This feature displays theproperty values for the displayed members of a dimension, based on another dimension's members.If no property value exists, the context member of the dimension is displayed in the report.
For example, the row axis contains the two dimensions Entities and Reporting Currency. Open theMember Selector for the Reporting Currency dimension: select Dimension Property from theSelection Relationship list, then select the Entity dimension and the CURRENCY property. In your
2013-01-3083
Report Creation
report, here is what is displayed: first column lists USA and France; the second column lists USDand EUR.
Note:For some relationships (relationships including ascendants, descendants and base level), you candefine the levels of the hierarchy you want to display in the report, using the Hierarchy Levels area.
Using the Selection Relationship list, you can also create a blank member. This member behaveslike any other member. Blank Member
Note:When no member is selected, the relationships available are:All Members,Base Level,BlankMemberand Dimension Property.
Related Topics• Hierarchy Levels to Display
12.4.2.6 Hierarchy Levels to Display
For some relationships (relationships including ascendants, descendants and base level), you candefine the levels of the hierarchy you want to display in the report:• By default, all the levels of the hierarchy are displayed and the All Levels option is selected.• You can select the number of levels you want to display, keeping in mind that level 1 is the highest
level of the hierarchy. If you select 3, levels 1, 2 and 3 will be displayed in the report.Use theNumberof Levels option.
• You can also select only one level to display. Use the Only Level option.
12.4.2.7 Member Sorting and Grouping by Properties
You can sort the selected members based on property values. To do so, click the Member Sortingand Grouping button and select the Enable Member Sorting options.
You can perform the following actions:• Sort the members based on their names, by ascending or descending order. If the members are
organized in a hierarchy, the members are sorted and therefore the hierarchy may be broken. Todo so, use the Ascending or Descending options.
• Additionally, you can sort the members based on a property, in ascending or descending order,depending on the option you have selected. The values of the specified property are ordered byascending or descending order. Inside each node, the members are sorted in ascending or descending
2013-01-3084
Report Creation
order. To do so, select the Group by Property option, then select a property from the dropdownlist.
• Create a grouping local member in the dimension based on the property selected for the sorting.To do so, follow these steps:• To position the local member before the set of members (or property group), select the Before
Group tab. To position the local member after the set of members (or property group), select theAfter Group tab.
• In the Create a Local Member Named area, enter a name for the grouping local member (orleave the dafault name). This name is not displayed in the report but in the Local MemberSelection tab when defining a specific format for the local member. For more information on howto define a format for a local member, see Dynamic Formatting Template Definition.
• In theDisplay area, you can enter the name for each grouping local member that will be displayedin the report. This name can be either static or dynamic, that is containing the property value orthe property value description (can be selected from the dropdown list), a prefix and a sufix.
Example:For the Currency dimension, property values are EUR and USD; property value descriptions areEuro and US Dollar.
Note:If a property value description cannot be displayed, the property value is displayed instead.
• You can then define the calculation to be performed for the grouping local member. The calculationis performed the same way as for local members. If you do not enter anything in the Formulaarea, total and sub-total calculations will be performed for a hierarchy.
Note:When using the Member Sorting and Grouping feature and also sorting data in a report, the sort ondata takes precedence over the member sorting and grouping.
Example: Entities grouped by country
In this example, a grouping local member has been created for the Entities dimension, based on theCountry property. All the entities are grouped under the country to which they belong. The followingitems are specified in theMember Sorting andGrouping area of theMember Selector: the Ascendingorder option is selected, the Country property is selected in the Group by Property dropdown list; inthe Display area of the Before Group tab, the entered prefix is "Country: " and the Property Valueis selected from the dropdown list. No formula is entered. Therefore, sub-total calculations are performedon the countries.
2013-01-3085
Report Creation
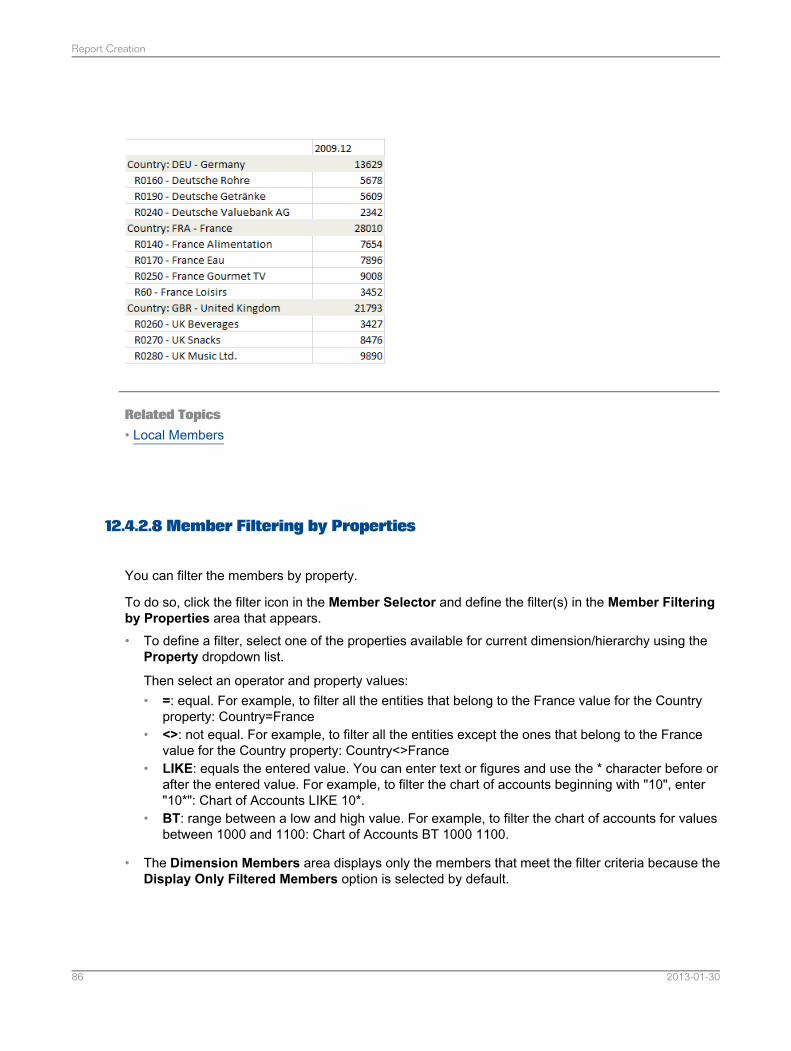
Related Topics• Local Members
12.4.2.8 Member Filtering by Properties
You can filter the members by property.
To do so, click the filter icon in the Member Selector and define the filter(s) in the Member Filteringby Properties area that appears.• To define a filter, select one of the properties available for current dimension/hierarchy using the
Property dropdown list.
Then select an operator and property values:• =: equal. For example, to filter all the entities that belong to the France value for the Country
property: Country=France• <>: not equal. For example, to filter all the entities except the ones that belong to the France
value for the Country property: Country<>France• LIKE: equals the entered value. You can enter text or figures and use the * character before or
after the entered value. For example, to filter the chart of accounts beginning with "10", enter"10*": Chart of Accounts LIKE 10*.
• BT: range between a low and high value. For example, to filter the chart of accounts for valuesbetween 1000 and 1100: Chart of Accounts BT 1000 1100.
• The Dimension Members area displays only the members that meet the filter criteria because theDisplay Only Filtered Members option is selected by default.
2013-01-3086
Report Creation
Note:When the Display Only Filtered Members option is selected, the members appear in a list; theyno longer appear in a hierarchy. Therefore, the dropdown list on the top left corner of the dialog boxautomatically displays List. If you deselect the option, all the members for the currentdimension/hierarchy are displayed in a hierarchy, and the dropdown list on the top left corner of thedialog box automatically displays Hierarchy.
• To make a selection, you can do one of the following:• Check the members you want and click the right arrow button. The checked members, and any
related members depending on the Selection Relationship choice, are moved to the bottom ofthe selected members list.
• Select the filter itself. The filter is dynamic, meaning for example that if a member with a specifiedproperty is created in the cube or model, it will be added automatically to the report. To selectthe filter itself, click the Add Dynamic Filter button.
Note:
• You can define criteria for a filter. For example, all the entities that have the "Euro" property valueand all the ones that have the "USD" property value.
• If you define several criteria using the same property, the operator OR is used between each criterion.• If you define several criteria using different properties, the operator AND is used between each
criterion.
12.4.2.9 Page Axis Dimension Members Modification using the Member Selector
You can modify the members for a dimension in the page axis directly from the sheet.
To do so, double-click the member cell. The Member Selector that opens is a sub-section of the oneopened from the Report Editor or the EPM pane.
However, this Member Selector includes an additional option called AllowMulti-Selection. Using thisoption, you can select several dimension members for a page axis dimension. When you select severalmembers, the data on the members is automatically aggregated in the report.
When the Allow Multi-Selection option is selected, the Select all Members option is enabled: youcan use it to select in one single click, all the members that are in the list of members of the MemberSelector.
Note:
• You cannot select more than 30 members.• If you often use a specific selection of members for a page axis dimension, it is recommended that
you convert the selection into a custom member.• You can display the members in a hierarchy or a list, you can select the member names to display
in the report, and you can search for a specific member.
2013-01-3087
Report Creation
Member Parent Quick Selection in Page AxisTo quickly select the parent member of a member located in the page axis of a report, select the membercell, then click Collapse in the EPM tab: the parent member is displayed instead and is taken intoaccount in the report. This is possible only when a single member is selected for a dimension locatedin the page axis.
Related Topics• Member Selector Presentation• Custom Members
12.4.3 Member Entry Using the Member Selector (on Large Volume Data Sources)
When you connect to a data source that has a large volume of members and you have selected theDo not LoadMembers at Connection option for the connection, theMember Selector is consequentlydesigned differently.
The following paragraphs describe the differences between the standard Member Selector and theMember Selector used for large volume data sources.
Hierarchy or Find Result displayUsing the dropdown list in the top-left corner of the dialog box, you can only display the members in ahierarchy, not in a simple list.
In addition, you can also display the members that result from the search that you previously performedusing the binoculars icon.
Filter by PropertiesWhen you click Filter by Properties, a dedicated dialog box opens.
For a BW data source, LIKE is not available in the dropdown lists.
For more information on filtering by properties, see Member Filtering by Properties.
FindIn the Find dialog box that opens when you click the binoculars icon:• for a BW data source:
• The Match Case option is selected and greyed out.• The Find Whole Words Only option is not selected and is greyed out.• The search is performed on member captions only.
• for an SSAS data source:• The Match Case option is not selected and is greyed out.• The Find Whole Words Only option is not selected and is greyed out.• The search is performed on the name selected in the Display menu, or by default on captions.
2013-01-3088
Report Creation
You can view the result whenever you want by selecting Find Result from the dropdown list in thetop-left corner of the dialog box.
For more information on the Find feature, see Member Selector Presentation.
DisplayWhen you select another name from the Display menu, the list of members is reset to the home level.
For more information on the Display feature, see Member Name to Display.
Relationships not contextual to a specific memberWhen clicking the last button on the right in the top part of the dialog box, the relationships availableare: All Members, Base Level, Blank Member.
Also, Dimension Property is not available.
For more information about relationships, see Selection Relationship.
Members available for the DimensionIn the list of members available for the current dimension, as members are loaded when you select anode, the navigation is different than in the standard Member Selector.• Hierarchical levels are displayed just above the list of members: the first level is indicated by a home
icon, then as you navigate in the hierarchy, each level is displayed in this section. The arrows enablesyou to select a sibling of the member node.
• A blue icon before the name of a member indicates a node.• Caution:
To expand a node and display its members, right-click on it. The members are loaded.
• For each node, the number of children is displayed, not the number of ascendants.• To select a member, click on it: the checkbox is selected.• When you can only perform a single member selection (for example: for a page axis), a green icon
with a tick indicates the member selected.• No icon indicates a base level member (a member that does not contain any members).• A tick in a checkbox indicates that the member is selected.• When selecting members in a page axis, each member selected is displayed at the bottom of the
dialog box, and a red cross icon enables you to remove each member from the selection.• A full checkbox indicates that only some of the descendants of the member are selected.• A tooltip on a node indicates the number of descendants that are selected.• At the bottom of the list of members, several pages are indicated if there are so many members that
they cannot be displayed on one page only. You can navigate in the pages. You can also choosethe number of members displayed by page. Specify the number of members in the Members perPage in Member Selector area in the Navigation tab of the User Options.
Selection RelationshipIn Members, all the members selected in the list of members are displayed.
In Relationship, you select the relationship that applies to all the selected members.
2013-01-3089
Report Creation
Note:The Member Property relationship does not exist.
Regardless of the relationship you select, the relationship is applied default settings that you can viewand modify in the Selection Relationship Options dialog box by clicking theOptions link. For example,this is where you can modify the hierarchy levels to display when selectingMember and Descendants.For more information on hierarchy levels, see Hierarchy Levels to Display.
To take into account your selection, click the Add Members button.
For more information on relationships, see Selection Relationship.
Selected MembersIn the right section of the dialog box, the members you have selected are listed.• You can edit a member selection by clicking the Edit icon to the right. The Selection Relationship
Options dialog box opens and you can make changes.• You can re-order the members using the arrow buttons on the right side.• You can remove a member selection by clicking the red cross on the right side.• When selecting several members, by default, all the members will be displayed in the report (meaning
OR is applied by default). To display only the members at the intersection of the different members(meaning AND), you can merge the members by selecting several members and clicking the MergeMembers icon on the right side. Once members are merged, you can unmerge the members orremove a member from the merge.
• Member sorting and grouping by properties. You can sort the selected members based on propertyvalues by clicking the last icon on the right side. For more information about member sorting andgrouping by properties, see Member Sorting and Grouping by Properties.
For more information about selected members, see Member Selection.
Related Topics• Large Volume Data Sources
12.4.4 Member Entry Using the Insert Members Dialog Box
You can insert members for the dimensions that are in the row or column axis of the current report.
To do so, right-click in a cell that belongs to the row or the column axis and select EPM > InsertMembers. The Insert Members dialog box displays the dimensions that are in the axis you are on.For each dimension, you can select the members you want to add to the report: select a dimension,then click Select Members. The Member Selector opens. If a filter has been previously defined torestrict the member insertion on the dimension, the Member Selector enables you to select only thefiltered members. For more information, see Member Insertion Filtering.
You can specify where in the axis you want to insert the selected members: at the selected cell or atthe end of the axis.
2013-01-3090
Report Creation
If you have specified that you want to insert the members at the selected cell, you can also specify:• if you want to insert the members and move down accordingly the members below in the axis,• or if you want the selected members to replace the current members. Example: you have selected
two members to insert, the axis contains four members and the cell selected when performing theright-click is the second member cell. The second and third members in the axis will be replaced bythe two selected members.
Note:
• The selection you make is persistent: the next time you open the Insert Members dialog box, thedefault options are the ones you selected previously.
• Empty rows and columns behavior for inserted members. You have selected the Remove Emptyoption for rows or columns in theSheet Options. You then insert members using the Insert Membersdialog box. Some of the inserted members do not have any data. However, they remain in the reportas long as you do not refresh the report. If you are using an input form (Use as Input Form optionselected in the Options tab of the Report Editor), you can enter data in rows or columns that donot yet contain any data. Then, when you refresh the report, the columns or rows for the membersthat do not contain data are not displayed in the report. For more information on empty columns androws behavior, see No Data and Zero Values
• When modifying an axis or changing the context of an axis in which members have been inserted,the inserted members are automatically removed.
The member insertion action automatically does a refresh of the report.
Restriction:You cannot use the Insert Members feature when an EPMDimensionOverride or EPMAxisOverridefunction is used in the current axis.
In Large Reports: Refreshing only Expanded or Inserted MembersIf you work with large reports and want to accelerate the refresh time, you can specify that only the newinserted rows or columns are refreshed after a member insertion. The other rows or columns of dataare not refreshed. To do so, select the user option Refresh only Expanded and Inserted Members.This behavior also applies to the expanded members (see Expand).
Caution:
Read the restrictions below before using the Refresh only Expanded and Inserted Members option:• Do not use this option if the axis on which the expansion/insertion is performed, contains local
members.• Do not use this option if the axis on which the expansion/insertion is performed, contains
EPMInsertCellsBeforeAfterBlock functions.• This option can cause certain formatting settings to not be properly applied. For more information,
see Dynamic Formatting Template Definition.
Note:This option enhance performances, but note that not all displayed data is refreshed in the report aftera member insertion.
Example:the Refresh only Expanded and Inserted Members option is selected. In a report, the followingmembers are displayed for the Time dimension: 2010, 2012. You insert the 2011 member (right-click
2013-01-3091
Report Creation
in a cell that belongs to the axis that contains the Time dimension and select EPM > Insert Members).The following members are now displayed: 2010, 2011, 2012. The data are refreshed only for themembers you have just inserted: 2011.
Related Topics• Member Entry Using the Member Selector
12.5 Report Creation using Copy/Paste
You can copy and paste an existing report from and to:• a Microsoft Office Excel worksheet• a Microsoft Office Word document• a Microsoft Office PowerPoint presentationThe connection is copied as well, and the report is automatically connected.
Note:You can view the report connection in the Layout tab of the Report Editor and above the dimensionlist in the EPM pane.
To copy and paste a report, select EPM > Report Actions > Copy Report > Paste Report.
2013-01-3092
Report Creation
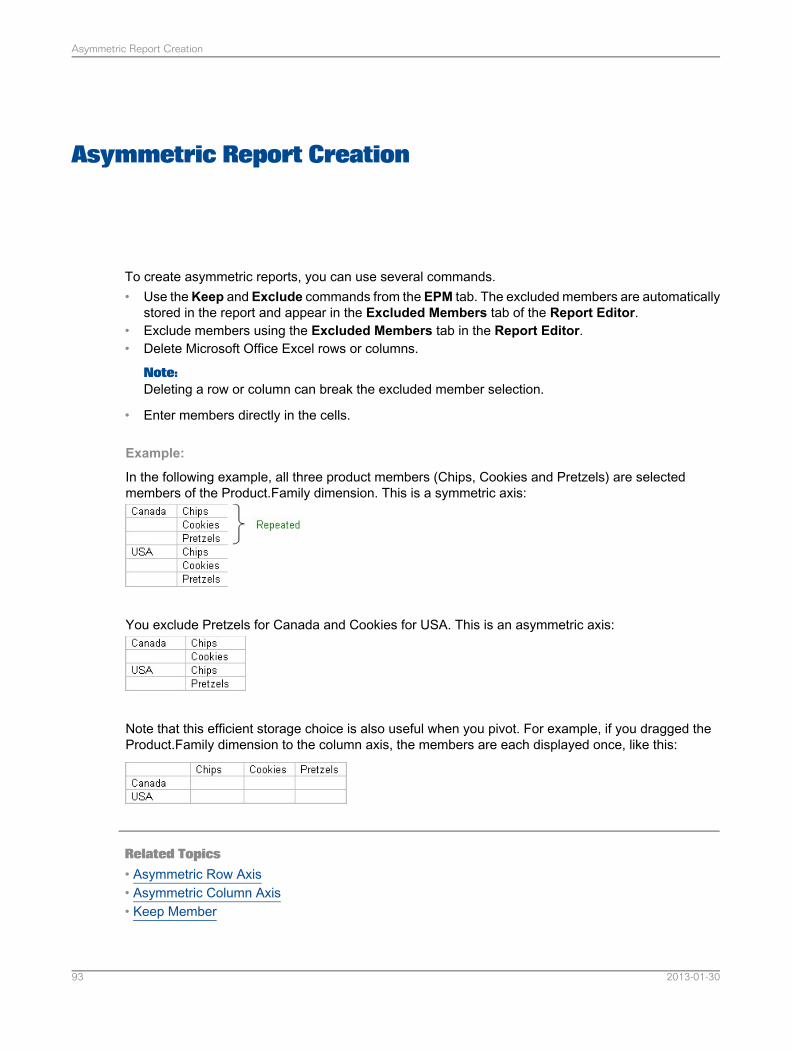
Asymmetric Report Creation
To create asymmetric reports, you can use several commands.• Use theKeep and Exclude commands from the EPM tab. The excluded members are automatically
stored in the report and appear in the Excluded Members tab of the Report Editor.• Exclude members using the Excluded Members tab in the Report Editor.• Delete Microsoft Office Excel rows or columns.
Note:Deleting a row or column can break the excluded member selection.
• Enter members directly in the cells.
Example:
In the following example, all three product members (Chips, Cookies and Pretzels) are selectedmembers of the Product.Family dimension. This is a symmetric axis:
You exclude Pretzels for Canada and Cookies for USA. This is an asymmetric axis:
Note that this efficient storage choice is also useful when you pivot. For example, if you dragged theProduct.Family dimension to the column axis, the members are each displayed once, like this:
Related Topics• Asymmetric Row Axis• Asymmetric Column Axis• Keep Member
2013-01-3093
Asymmetric Report Creation

• Exclude Member• Excluding Members
2013-01-3094
Asymmetric Report Creation
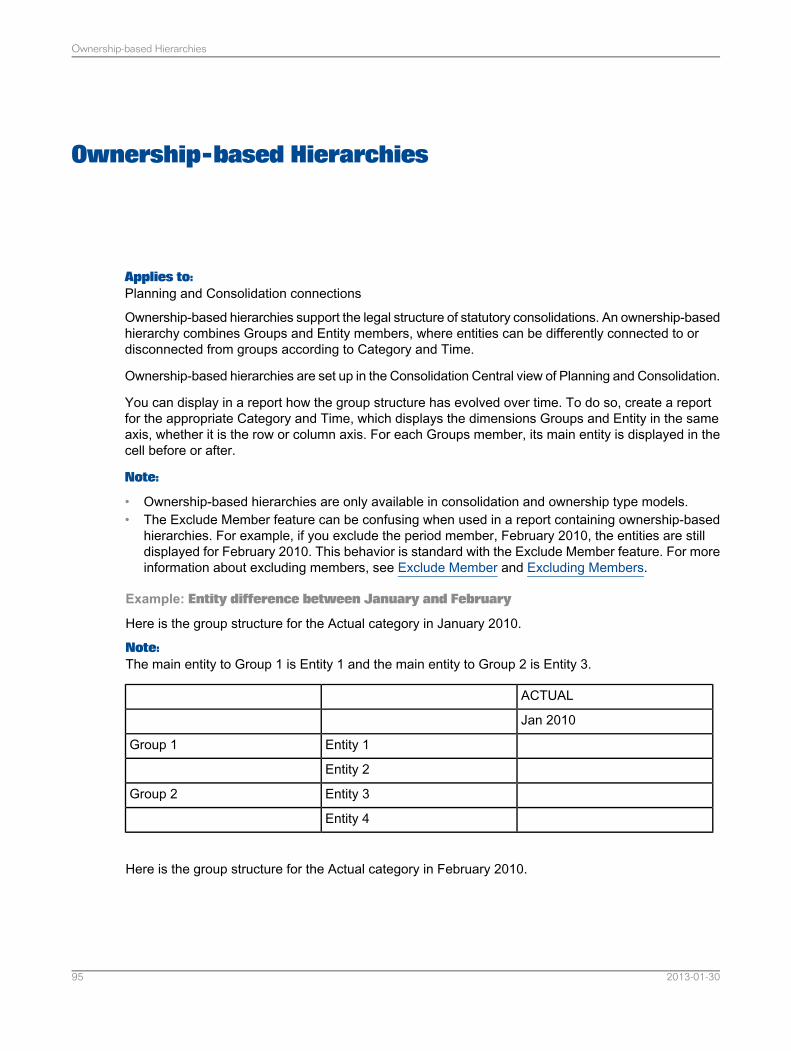
Ownership-based Hierarchies
Applies to:Planning and Consolidation connections
Ownership-based hierarchies support the legal structure of statutory consolidations. An ownership-basedhierarchy combines Groups and Entity members, where entities can be differently connected to ordisconnected from groups according to Category and Time.
Ownership-based hierarchies are set up in the Consolidation Central view of Planning and Consolidation.
You can display in a report how the group structure has evolved over time. To do so, create a reportfor the appropriate Category and Time, which displays the dimensions Groups and Entity in the sameaxis, whether it is the row or column axis. For each Groups member, its main entity is displayed in thecell before or after.
Note:
• Ownership-based hierarchies are only available in consolidation and ownership type models.• The Exclude Member feature can be confusing when used in a report containing ownership-based
hierarchies. For example, if you exclude the period member, February 2010, the entities are stilldisplayed for February 2010. This behavior is standard with the Exclude Member feature. For moreinformation about excluding members, see Exclude Member and Excluding Members.
Example: Entity difference between January and February
Here is the group structure for the Actual category in January 2010.
Note:The main entity to Group 1 is Entity 1 and the main entity to Group 2 is Entity 3.
ACTUAL
Jan 2010
Entity 1Group 1
Entity 2
Entity 3Group 2
Entity 4
Here is the group structure for the Actual category in February 2010.
2013-01-3095
Ownership-based Hierarchies
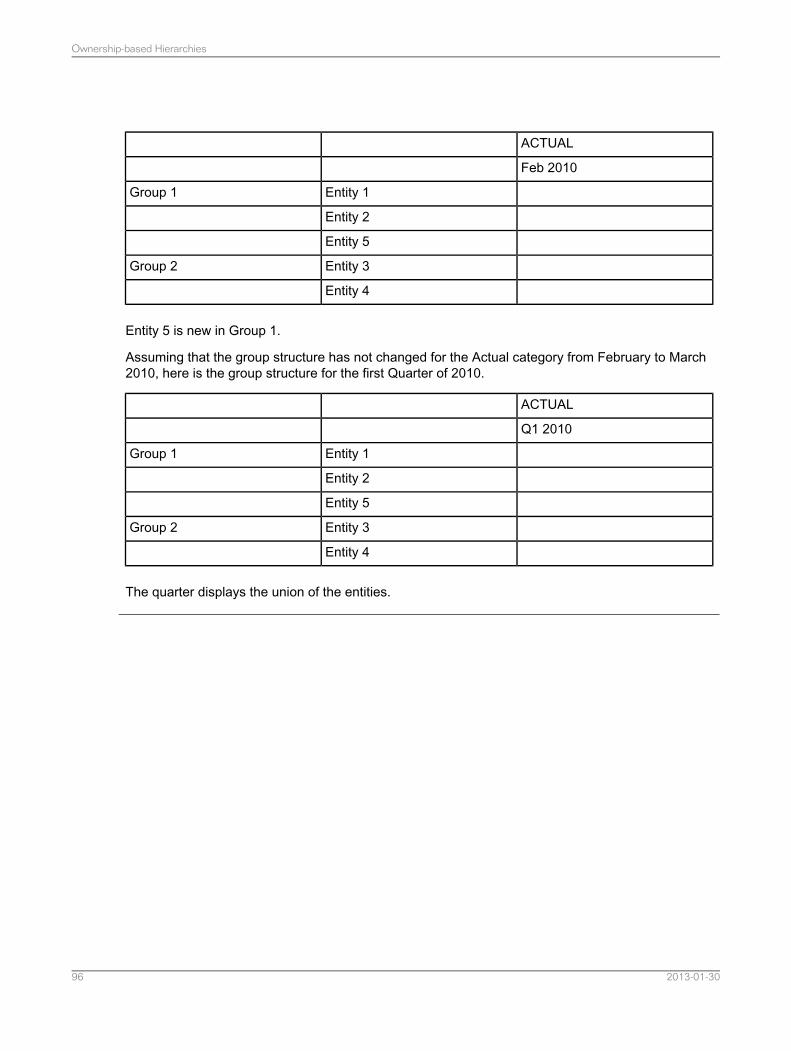
ACTUAL
Feb 2010
Entity 1Group 1
Entity 2
Entity 5
Entity 3Group 2
Entity 4
Entity 5 is new in Group 1.
Assuming that the group structure has not changed for the Actual category from February to March2010, here is the group structure for the first Quarter of 2010.
ACTUAL
Q1 2010
Entity 1Group 1
Entity 2
Entity 5
Entity 3Group 2
Entity 4
The quarter displays the union of the entities.
2013-01-3096
Ownership-based Hierarchies
Time-Dependent Hierarchies
Applies to:Planning and Consolidation, version for SAP NetWeaver, connections.
In order to use time-dependent hierarchies in the EPM add-in, they must have been previously set upin the Planning and Consolidation Administration view. For a specific dimension, you specify that youwant to use a time-dependent hierarchy. You then specify the various versions of the hierarchy, meaningthat each version of the hierarchy has a different structure, such as Sales by Region and Sales byManager, based on different periods of time.
In the EPM add-in, you can select a key date for your report: the version of the hierarchy that is usedis the one which contains the key date within the version.• In the EPM Context bar, the current date is the default for the key date. You can select another key
date by selecting the key date dropdown list, then selecting Select Another Key Date and specifyingthe date in the dialog box that opens.
Note:You can lock a key date. You can choose a color or not to display the key date dropdown list in theEPM Context bar. All these settings are defined in the Options > Context Options.
• In the Report Editor, the Key Date dropdown list is available in the Layout tab. The default dateis the date specified in the context. You can select another key date by selecting the key datedropdown list, then selecting Select Another Key Date and specifying the date in the dialog boxthat opens.
2013-01-3097
Time-Dependent Hierarchies

2013-01-3098
Time-Dependent Hierarchies
Actions and Options Specific to the Current Report
You can perform certain actions and specify certain options that are specific to the current report byusing the Report Editor.
16.1 Report Options
You can modify the options that are specific to the current report in the Options tab of the ReportEditor. By default, the report options are the ones defined for the current worksheet in the SheetOptions. You can do the following:• To keep the options as they are defined in the Sheet Options, leave the Inherit Sheet Options
option selected as it is by default in the Options tab of the Report Editor. All the options that areinherited from the sheet options are greyed out.
• To modify the options for the current report, deselect the Inherit Sheet Options option. All theoptions are made available for selection.
The following options are available for selection and are not necessarily related to the Sheet Options:• Freeze Data Refresh. Independently, this option can also be activated for any use of the EPM add-in
in the User Options.
Note:The option is always available for selection. Independently, this option can also be activated for anyuse of the EPM add-in in the User Options.
• Do not Store Connection and Do not Store Environment in the Connection. These options onlyapply to Planning and Consolidation connections.
• Display only Base Level Data. This option only applies to Planning and Consolidation, version forthe Microsoft platform, connections.
Note:
• For descriptions of the options that are common to the sheet and the report, see Sheet Options.• Depending on the cube or model to which the report is connected, the options displayed are not
always the same.
Related Topics• Sheet Options• Freeze Data Refresh
2013-01-3099
Actions and Options Specific to the Current Report
16.1.1 Freeze Data Refresh
You can deactivate the data refresh. Freezing the refresh of data enables you to navigate in a reporthowever you wish, and the data is not loaded from the data source. When you are finished navigatingin the report, you can re-activate the refresh and retrieve the latest data.
If you have selected Inherit Sheet Options in the Options tab of the Report Editor, the Freeze DataRefresh option is selected or not, depending on whether or not you selected the option in eitherEPM> More or inEPM > User Options.
Related Topics• Report Refresh
16.1.2 Display only Base Level Data
Applies to:Planning and Consolidation, version for the Microsoft platform, connections.
If you only want to display the data that is not aggregated (meaning data on base level members), selectthe Display only Base Level Data option. The data calculations will not be performed and the data forbase level members will be displayed more quickly.
16.1.3 Do not Store Connection and Do not Store Environment in the Connection
Applies to:Planning and Consolidation connections.
• You can save a report without storing the connection used to create the report, meaning withoutstoring the environment or the model of the connection. This way, you will then be able to use thereport on other connections, provided that the models have similar structures.
To do so, in the Options tab of the Report Editor, select the Do not Store Connection option.
Tip:Select this option for reports that you want to use as templates.
2013-01-30100
Actions and Options Specific to the Current Report
• You can also save a report without storing the environment of the connection used to create thereport. This way, you will then be able to use the report on other connections using otherenvironments, provided that the model environments have similar structures.
To do so, in the Options tab of the Report Editor, select the Do not Store Environment in theConnection option.
Note:If you have already selected the Do not Store Connection option, the Do not Store Environmentin the Connection option is greyed out.
Since the connection or the environment is not stored:• dimensions are identified with their types (for example: E for Entity) and not with their names.• dimension members are identified with their relationships (for example: context member + children)
and not with their names.
Note:As soon as you select (or manually enter) a member that is not a context member, a message warnsyou that, as the report contains at least one member that is not a context member, these membersmay not be recognized if you use the report later on with another connection.
If you do not want to show the message again, select the option in the message box and click OK(clicking Cancel will not take into account the option selection) or uncheck the Warn if Connectionor Environment in the Connection is not Stored option in the User Options: these two optionsare synchronized.
16.2 Data Sorting, Ranking and Filtering
You can sort, rank or filter the data of the current report. You define the sorting, ranking and filteringon data in three dedicated tabs of the Report Editor.
16.2.1 Data Sorting
You can sort the data of the current report using the Report Editor.
You can sort the data in your report in ascending or descending order, based on:• Either a specified dimension member and for each dimension in the column axis.
Note:You might sort by more than one column when you have data that you want to group by the samevalue in one column, and then sort another column within that group of equal values. For example,if you have a Department and Employee column, you can first sort by Department (to group all the
2013-01-30101
Actions and Options Specific to the Current Report
employees in the same department together), and then sort by name (to put the names in alphabeticalorder within each department).
• Or the first or the last column.
The Sort Inside Level option enables you to sort parent members and their children in each level ofthe hierarchy, while still preserving the hierarchy.
Note:
• The sorting inside the levels is performed if the row axis contains only one dimension.• Data sorting is not supported on local members.
16.2.1.1 Sorting Data
1. Select EPM > Edit Report.The Report Editor opens.
2. Select the Sorting tab.3. Select the Sort Data Using the Following Criteria option.
The rest of the tab is activated.
4. Select Member, First Column or Last Column.5. If you have selected Member:
a. By default, you sort data based only on a member that is displayed in the column axis of thereport. If you want to sort data based on a member that is not part of the column axis, deselectthe Show Only Members Displayed in the Report option.
b. Click the ellipsis button.c. In theColumn Selector dialog box that opens, select the member on which the sort will be based
and click on OK.d. Indicate whether data will be sorted in Ascending or Descending order by selecting one of the
options.e. If you want to sort data on another member, click Add Criteria and repeat step 5.
6. If you have selected First Column or Last Column, indicate whether data will be sorted inAscendingor Descending order by selecting one of the options.
Note:If you have selected First Column or Last Column, you cannot add criteria for the sorting.
7. To perform the sort in each level of the hierarchy, select the Sort Inside Level option.8. To delete the entire sorting query, click on the Clear Expression button.
Note:If the Sort Data Using the Following Criteria option is not selected, this tab is disabled. However,if you have already entered settings, they are not deleted.
2013-01-30102
Actions and Options Specific to the Current Report
16.2.2 Data Filtering
You can filter the data of the current report using the Report Editor.
You can specify one or more conditional dimension member value filters on the report. In the Filteringtab, you can specify the individual criteria and you can combine all the criteria into an expression.• By default, only the data in rows or columns that meet the filtering criteria will be displayed in the
report.• The system can also check if the criteria are met on each column or row in the report.
• When you select the Filter on all Columns/Rows option and the AND option, a row or columnis displayed if all the data of the row or column meet the filtering criteria.
• When you select the Filter on all Columns/Rows option and the OR option, a row or column isdisplayed if at least one data of the row or column meet the filtering criteria.
The following options enable you to define specific actions on top of the filtering criteria:• Retain Members option: you can select one or more specific members that you want to display in
the report, whether or not they meet the filtering criteria.• Keep Blocks option: when a member is displayed in the report because it meets the filtering criteria,
the whole block to which it belongs is displayed.
Note:The Keep Blocks option appears in the Filtering tab only if the row axis contains more than onedimension.
• Retain Members and Keep Blocks options both selected: In the case where the row axis containsmore than one dimension, you can also specify that not only the retained member be displayed inthe report, but also the block to which the selected member belongs.
Note:
• For more information about blocks, see Multidimensional or Nested Row Axis and Multidimensionalor Nested Column Axis .
• Data filtering is not supported on local members.
Related Topics• Multidimensional or Nested Row Axis• Multidimensional or Nested Column Axis
16.2.2.1 Filtering Data
1. Select EPM > Edit Report.
2013-01-30103
Actions and Options Specific to the Current Report
The Report Editor dialog box opens.
2. Select the Filtering tab.3. Select the Filter Data Using the Following Criteria option.
The rest of the tab is activated.
4. If you want that specific members appear in the report, regardless the filtering criteria, select RetainMembers.
Note:In case the row axis contains more than one dimension, the Keep Blocks option is available. If youwant that not only members appear in the report but also the block they belong to, select this option.
5. In the Filtering Criteria area, use the Based on drop-down menu to select Row or Column.6. By default, you filter data based only on a member that is displayed in the column or row axis of the
report. If you want to filter data based on a member that is not part of the column or row axis, deselectthe Show Only Members Displayed in the Report option.
7. Click on the ellipsis button at the end of the Based on field.The Column Selector dialog box opens.
Note:If there is more than one dimension in the column axis, you can select one member for each dimensionon which to be filtered.
8. Select the member in row or column on which the filter will be based and click on OK.9. So that none of the members are displayed in the report if at least one of the members does not
meet the filtering criteria, select the Filter on all Columns/Rows option.10. Define the filter criteria using the three radio buttons and the corresponding dropdown lists. The
square brackets show the choices available in the drop-down menus:• [is | is not] NULL (Empty).• [= | > | >= | < | <= | <>] a specified constant (must be numeric, i.e. real number).• [= | > | >= | < | <= | <>] another column specified using the Column Selector dialog box.
11. Click the Add Criteria button.The filter criteria defined are added to the Filter Expression area and the Filtering Criteria areais cleared.
12. If you want to add more filter criteria select the AND or the OR operator and repeat steps 5 to 11.Each expression will be entered on a new line in the Filter Expression area.
13. To delete the entire expression from the Filter Expression area, click the Clear All Expressionsbutton.
14. To modify a criteria, select the criteria line in the Filter Expression area, click Edit, modify thecriteria and click Modify Criteria.
Note:To cancel the modification of the criteria, click Cancel Edit.
15. To delete a criteria, select the criteria line in the Filter Expression area and click Delete.16. If you also define a ranking on data in the Ranking tab, to avoid any conflict, the filtering takes
precedence by default over the ranking. Therefore, the Perform Filtering, then Ranking option is
2013-01-30104
Actions and Options Specific to the Current Report
selected by default. You can deselect it to change the precedence and the Perform Ranking, thenFiltering option in the Ranking tab is automatically checked.
Note:If the Filter Data Using the Following Criteria option is not checked, this tab is disabled. However,if you have already entered settings, they are not deleted.
16.2.3 Data Ranking
You can rank the data of the current report using the Report Editor.
You can specify top or bottom 'N' ranking based on a specified dimension member and for eachdimension in the column axis. Only the top or bottom “N” rows will be displayed in the report.
Note:Data ranking is not supported on local members.
16.2.3.1 Ranking Data
1. Select EPM > Edit Report.The Report Editor dialog box opens.
2. Select the Ranking tab.3. Select the Rank Data Using the Following Criteria option.
The rest of the tab is activated.
4. Select Member, First Column or Last Column.5. If you have selected Member:
a. By default, you rank data based only on a member that is displayed in the column axis of thereport. If you want to rank data based on a member that is not part of the column axis, deselectthe Show Only Members Displayed in the Report option.
b. Click the ellipsis button.c. In the Column Selector dialog box that opens, select the member on which the ranking will be
based and click OK.
Note:If there is more than one dimension in the column axis, you can select one member for each dimensionto be ranked.
6. Indicate whether data will be ranked from the Top or the Bottom by selecting one of the options.7. Select how many items will be included in the ranking, for example, top 10 sales figures.
2013-01-30105
Actions and Options Specific to the Current Report
8. If you also define a filtering on data in the Filtering tab, to avoid any conflict, the filtering takesprecedence by default over the ranking. Therefore, the Perform Ranking, then Filtering option isnot selected by default. You can select it to change the precedence and the Perform Filtering, thenRanking option in the Filtering tab is automatically unchecked.
9. To delete the entire ranking query, click the Clear Expression button.
Note:
• 0 is not a valid value in this field.• If the Rank Data Using the Following Criteria option is not checked, this tab is disabled.
However, if you have already entered settings, they are not deleted.
16.3 Read-only Data
Applies to:Planning and Consolidation connections.
For a specific input form, you can choose not to save the data entered on:• Specific dimension members.• The intersection of specific members.
In the Read-only Data tab of the Report Editor, select a dimension, then click Select Members andselect the member(s) for which data will not be saved to the server. You can select one or more membersfor one or more dimensions.
Note:The member selection is always static.
So that only data at the intersection of the selected members is not saved, select the At IntersectionOnly option.
Note:As data can be entered and saved only on base members, selecting a node will have no consequence.You can also specify ranges in read-only. For more information, see EPMReadOnlyData.
Related Topics• Data Save
16.4 Local Members
2013-01-30106
Actions and Options Specific to the Current Report
You can create members mainly for calculations on the current report. These members are called "localmembers". Local members have the same behavior as any other member, but they contain standardMicrosoft Office Excel formula or EPM functions.
There are two ways of creating local members:• Enter a Microsoft Office Excel formula. When the Local Member Recognition is activated, all Microsoft
Office Excel formulas are automatically converted into "local members". You can then view andmodify the local member in the Local Members tab of the Report Editor.
• Create a local member directly in the Local Members tab of the Report Editor.
Note:You can also create a grouping local member in the Member Selector, when grouping members byproperty.
Note:
• Local members are specific to the current report. If you want to reuse a local member in other reportsfor the same sheet/connection couple, you can convert the local member into a custom member.To convert a local member into a custom member, right-click on the local member in the report andselect EPM > Convert to Custom Member. You can create custom members only when using alocal or SAP BusinessObjects Enterprise connection.
• Precedence rules: in case of conflicts between local members on row and column axis, local memberson the columns axis override the ones on the row axis.
• You can apply specific formatting to local members.
Keywords and AttachementA local member is identified by a formula using one of the keywords below:• EPMMEMBER, to attach the local member to a specific member.• EPMTUPLE, to attach the local member to a combination of members belonging to nested dimensions.• EPMSELECTEDMEMBERS, to perform a calculation (such as sum or average) on all the members
displayed in the report for a specific dimension. The axis in which the dimension is placed mustcontain only one dimension.
• EPMALLMEMBERS, to perform a calculation (such as sum or average) on all the members displayedin a row or column axis, whether the axis contains one or several dimensions.
• EPMDIM_CURRENT_MEMBER, to attach the local member to the current axis.• EPMPOSITION(n), to reference a row or column of the report, not a member.
A local member is attached to one of the following items:• Member combination. The axis to which the formula applies contains more than one dimension, and
you have entered a formula that references two different members in the outer dimension.• Row or column axis. A formula that gives information about the members in the opposite axis.• A member. The local member is displayed after the member to which it is attached.• A position. The local member is attached to a position in the report, not to a specific member.• Another local member. The local member is displayed after the local member to which it is attached.
For examples and explanations on how keywords and attachments are managed, see Local Members- Examples.
2013-01-30107
Actions and Options Specific to the Current Report
Use of Volatile FunctionsAs mentioned in the Microsoft Excel documentation, the use of too many volatile functions can lowerthe recalculation performances.
As a reminder, the following Microsoft Excel functions are volatile: NOW, TODAY, RAND, OFFSET,INDIRECT, INFO (depending on its arguments), CELL (depending on its arguments).
Related Topics• Dynamic Formatting Template Definition• Custom Members• Member Sorting and Grouping by Properties
16.4.1 Local Member Automatically Detected
You can insert a row or a column, enter text as the header of the row or column, then enter a formula.
When you enter in a report a Microsoft Office Excel formula, provided that the Activate Local MemberRecognition option is selected in the Sheet Options:• the formula is automatically converted into a local member using a specific keyword.• the local member is automatically attached to a specific item.
For examples and explanations on how keywords and attachments are managed, see Local Members- Examples.
Note:Once a formula has automatically been converted into a local member, you can edit the local memberin the Local Members tab of the Report Editor: you can see for example the keyword used in itsformula and the item to which the local member is attached.
Note:
• All Microsoft Office Excel formulas are converted into local members.• If you do not enter a text to describe the local member, a default name is generated, beginning with
(fn).• If a member refered to in a local member is deleted, the local member becomes invalid.• The local member position depends on the Totals Placement options selected in the Sheet Options.• A local member cannot be attached to a blank member. For more information about blank members,
see Blank Member.
Restriction:References to more than 100 cells are ignored.
2013-01-30108
Actions and Options Specific to the Current Report
Local Member AttachmentAny formula is converted into a local member and the local member is automatically attached to oneof these items: a specific member, a combination of members, the row axis, the column axis or a specificposition in the report.
Alternatively, you can ask that any formula is converted into a local member that is attached to the rowor column axis at a specific position, meaning the local member is automatically detected as anEPMPOSITION type of local member.
Note:However, this does not apply to the EPMDIM_CURRENT_MEMBER type of local member.
To do so, select the Use Position in Axis option in the Sheet Options.
To see an example of local members attached to a specific position in the row or column axis, see LocalMembers - Examples.
Note:When a local member references the current report and another cell outside of the report, the memberis automatically detected as an EPMPOSITION type of local member, even though the Use Positionin Axis option is not selected in the Sheet Options.
16.4.2 Local Member Creation
In the Local Members tab of the Report Editor, you can modify the automatically converted localmember or you can create a new local member.
To create a local member that answers your analysis needs, you must use appropriate keywords in theformula and you also need to attach the local member to the apropriate item. To see detailed examplesof local members, see Local Members - Examples.
You can perform the following actions in the Local Members tab:• Modify or select the item to which the formula is attached. See detailed examples here Local Members
- Examples.• Name the local member. The name will appear in the list of local members on the left side.• Enter a description. The description appears in the report. You can enter a suffix, a prefix and also
include the text of the outer member by selecting Outer Member in the dropdown list.
Note:When you have entered a formula in a cell and you have not entered a text to describe the localmember, a default name is generated, beginning with (fn).
• In the Formula field, enter a formula using the appropriate keyword. See detailed examples hereLocal Members - Examples.
Caution:If you reference a sheet in the formula, the local member is not created. For example: Sheet!C4.
2013-01-30109
Actions and Options Specific to the Current Report
• Change the position of the local member, after or before the item to which the formula is attached.
If the item to which the local member is attached is Dimension/Hierarchy (depending on the connectionyou use), Column Axis or Row Axis, you can also specify a position using the Insert at Positiondropdown list.
Note:The rows and columns that are used as separation (shift) between the data grid and the row orcolumn axis are ignored.
• Enable or disable a local member by checking the Enable option. When a local member is enabled,it is taken into account in the current report.
• When you have finished defining a local member, click Add.• When you have modified an existing local member, click Save to save your changes.
Note:You can also create a local member that inserts a blank row or column to a specific member for example.In the Local Members tab, simply enter a name for the local member, select the position where youwant to insert the row or column and select the member to which you want to attach the blank row orcolumn, using the ellipsis button. As this local member is attached to another member, it will movealong with the member. Note that you can also insert a blank member that behaves like any othermember and is not attached to a specific member. For more information, see Blank Member.
Caution:You can reference another worksheet in a local member formula, provided that the name of the worksheetdoes not contain any numbers.
Referencing an EPMOlapMemberOIn local member formulas, when you reference a cell that contains a member placed in one of the threeaxes of the report (meaning a member identified by =EPMOlapMemberO), you can specify that the"EPMMemberID" function be used automatically for members. To do so, select theUse EPMMemberIDin EPM formulas option in the User Options. For example, if you reference cell A6, when this optionis selected, A6 will be automatically replaced by EPMMemberID(A6) if A6 contains an EPMOlapMemberOfunction.
For all the local members that have been created when the option was not selected, you can scan allthe formulas of the current worksheet. For any cell reference containing members, the EPMMemberIDfunction is added. To scan all the formulas, select EPM > More > Insert EPMMemberID in Formulas.
Note:
• The Use EPMMemberID in EPM formulas option and the Insert EPMMemberID in Formulascommand apply to both EPM functions and local members.
• However, note that selecting this option may lower performances.
Local Member Creation using Excel Cell ReferencesYou can create local members whose formula use Microsoft Excel cell references and not EPM keywords(see above for keywords). Select the Use Excel Cell References option in the Local Members tab ofthe Report Editor. The formulas of local members that are repeated will adjust and behave accordingto the Microsoft Excel relative references feature.
2013-01-30110
Actions and Options Specific to the Current Report
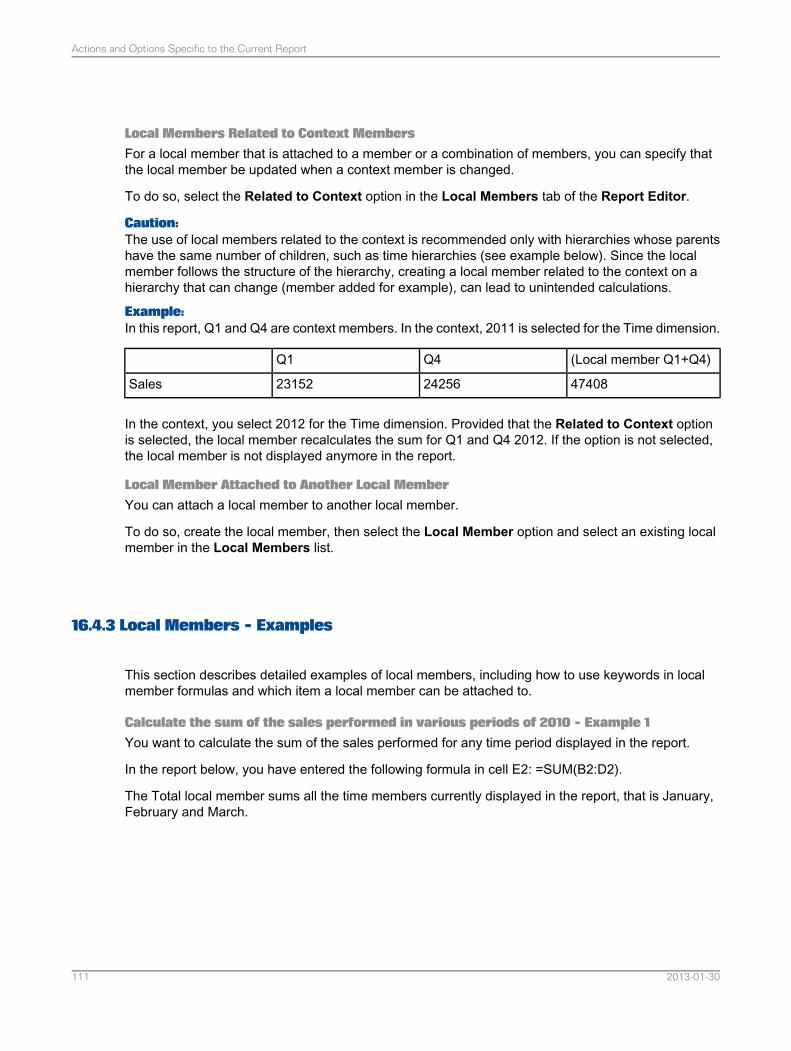
Local Members Related to Context MembersFor a local member that is attached to a member or a combination of members, you can specify thatthe local member be updated when a context member is changed.
To do so, select the Related to Context option in the Local Members tab of the Report Editor.
Caution:The use of local members related to the context is recommended only with hierarchies whose parentshave the same number of children, such as time hierarchies (see example below). Since the localmember follows the structure of the hierarchy, creating a local member related to the context on ahierarchy that can change (member added for example), can lead to unintended calculations.
Example:In this report, Q1 and Q4 are context members. In the context, 2011 is selected for the Time dimension.
(Local member Q1+Q4)Q4Q1
474082425623152Sales
In the context, you select 2012 for the Time dimension. Provided that the Related to Context optionis selected, the local member recalculates the sum for Q1 and Q4 2012. If the option is not selected,the local member is not displayed anymore in the report.
Local Member Attached to Another Local MemberYou can attach a local member to another local member.
To do so, create the local member, then select the Local Member option and select an existing localmember in the Local Members list.
16.4.3 Local Members - Examples
This section describes detailed examples of local members, including how to use keywords in localmember formulas and which item a local member can be attached to.
Calculate the sum of the sales performed in various periods of 2010 - Example 1You want to calculate the sum of the sales performed for any time period displayed in the report.
In the report below, you have entered the following formula in cell E2: =SUM(B2:D2).
The Total local member sums all the time members currently displayed in the report, that is January,February and March.
2013-01-30111
Actions and Options Specific to the Current Report
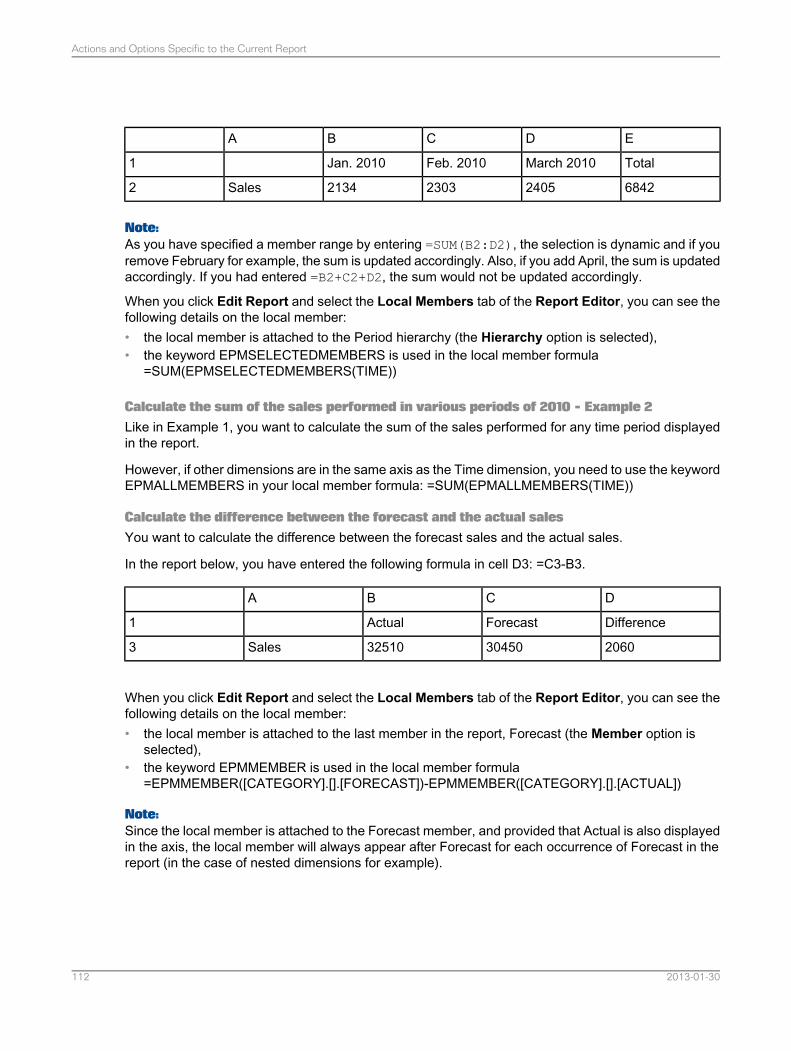
EDCBA
TotalMarch 2010Feb. 2010Jan. 20101
6842240523032134Sales2
Note:As you have specified a member range by entering =SUM(B2:D2), the selection is dynamic and if youremove February for example, the sum is updated accordingly. Also, if you add April, the sum is updatedaccordingly. If you had entered =B2+C2+D2, the sum would not be updated accordingly.
When you click Edit Report and select the Local Members tab of the Report Editor, you can see thefollowing details on the local member:• the local member is attached to the Period hierarchy (the Hierarchy option is selected),• the keyword EPMSELECTEDMEMBERS is used in the local member formula
=SUM(EPMSELECTEDMEMBERS(TIME))
Calculate the sum of the sales performed in various periods of 2010 - Example 2Like in Example 1, you want to calculate the sum of the sales performed for any time period displayedin the report.
However, if other dimensions are in the same axis as the Time dimension, you need to use the keywordEPMALLMEMBERS in your local member formula: =SUM(EPMALLMEMBERS(TIME))
Calculate the difference between the forecast and the actual salesYou want to calculate the difference between the forecast sales and the actual sales.
In the report below, you have entered the following formula in cell D3: =C3-B3.
DCBA
DifferenceForecastActual1
20603045032510Sales3
When you click Edit Report and select the Local Members tab of the Report Editor, you can see thefollowing details on the local member:• the local member is attached to the last member in the report, Forecast (the Member option is
selected),• the keyword EPMMEMBER is used in the local member formula
=EPMMEMBER([CATEGORY].[].[FORECAST])-EPMMEMBER([CATEGORY].[].[ACTUAL])
Note:Since the local member is attached to the Forecast member, and provided that Actual is also displayedin the axis, the local member will always appear after Forecast for each occurrence of Forecast in thereport (in the case of nested dimensions for example).
2013-01-30112
Actions and Options Specific to the Current Report
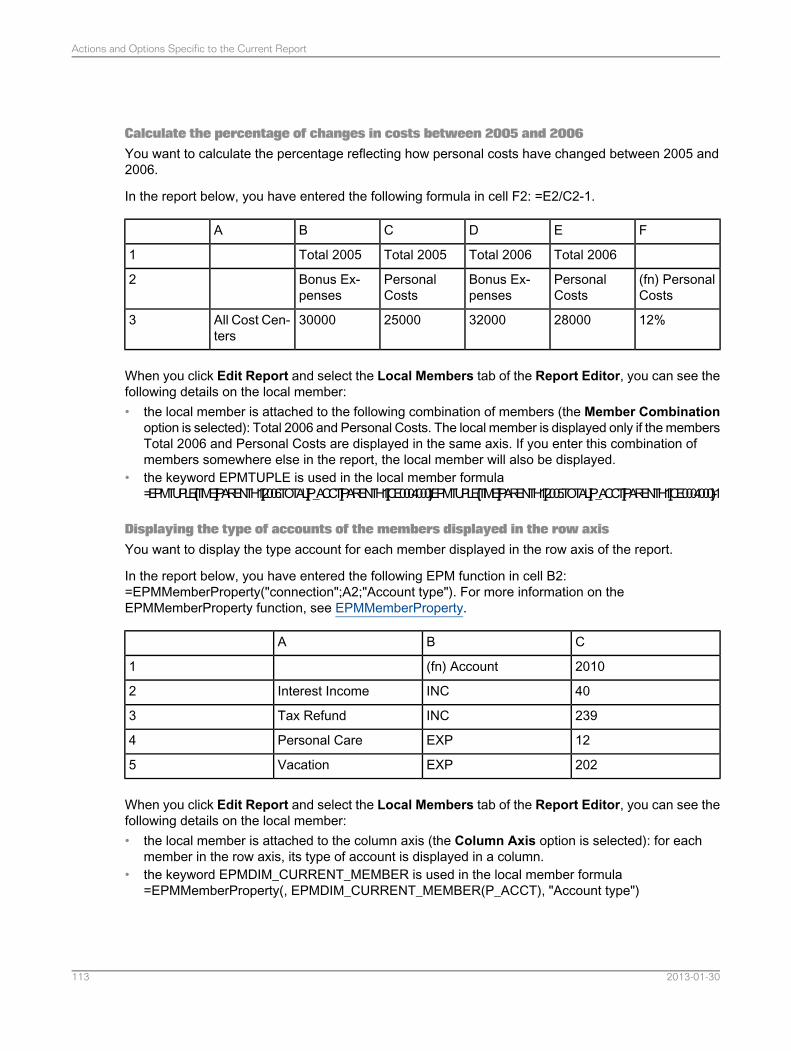
Calculate the percentage of changes in costs between 2005 and 2006You want to calculate the percentage reflecting how personal costs have changed between 2005 and2006.
In the report below, you have entered the following formula in cell F2: =E2/C2-1.
FEDCBA
Total 2006Total 2006Total 2005Total 20051
(fn) PersonalCosts
PersonalCosts
Bonus Ex-penses
PersonalCosts
Bonus Ex-penses
2
12%28000320002500030000All Cost Cen-ters
3
When you click Edit Report and select the Local Members tab of the Report Editor, you can see thefollowing details on the local member:• the local member is attached to the following combination of members (the Member Combination
option is selected): Total 2006 and Personal Costs. The local member is displayed only if the membersTotal 2006 and Personal Costs are displayed in the same axis. If you enter this combination ofmembers somewhere else in the report, the local member will also be displayed.
• the keyword EPMTUPLE is used in the local member formula=EPMTUPLE([TIME].[PARENTH1].[2006.TOTAL];[P_ACCT].[PARENTH1].[CE0004000];)/EPMTUPLE([TIME].[PARENTH1].[2005.TOTAL];[P_ACCT].[PARENTH1].[CE0004000];)-1
Displaying the type of accounts of the members displayed in the row axisYou want to display the type account for each member displayed in the row axis of the report.
In the report below, you have entered the following EPM function in cell B2:=EPMMemberProperty("connection";A2;"Account type"). For more information on theEPMMemberProperty function, see EPMMemberProperty.
CBA
2010(fn) Account1
40INCInterest Income2
239INCTax Refund3
12EXPPersonal Care4
202EXPVacation5
When you click Edit Report and select the Local Members tab of the Report Editor, you can see thefollowing details on the local member:• the local member is attached to the column axis (the Column Axis option is selected): for each
member in the row axis, its type of account is displayed in a column.• the keyword EPMDIM_CURRENT_MEMBER is used in the local member formula
=EPMMemberProperty(, EPMDIM_CURRENT_MEMBER(P_ACCT), "Account type")
2013-01-30113
Actions and Options Specific to the Current Report
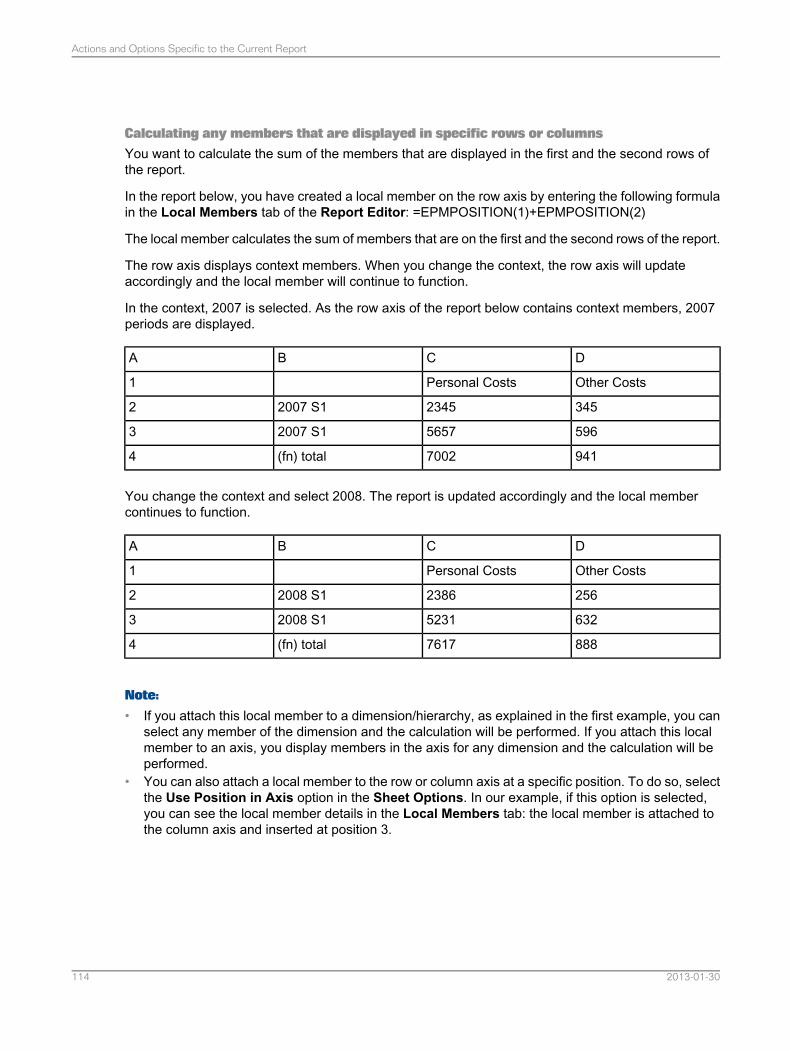
Calculating any members that are displayed in specific rows or columnsYou want to calculate the sum of the members that are displayed in the first and the second rows ofthe report.
In the report below, you have created a local member on the row axis by entering the following formulain the Local Members tab of the Report Editor: =EPMPOSITION(1)+EPMPOSITION(2)
The local member calculates the sum of members that are on the first and the second rows of the report.
The row axis displays context members. When you change the context, the row axis will updateaccordingly and the local member will continue to function.
In the context, 2007 is selected. As the row axis of the report below contains context members, 2007periods are displayed.
DCBA
Other CostsPersonal Costs1
34523452007 S12
59656572007 S13
9417002(fn) total4
You change the context and select 2008. The report is updated accordingly and the local membercontinues to function.
DCBA
Other CostsPersonal Costs1
25623862008 S12
63252312008 S13
8887617(fn) total4
Note:
• If you attach this local member to a dimension/hierarchy, as explained in the first example, you canselect any member of the dimension and the calculation will be performed. If you attach this localmember to an axis, you display members in the axis for any dimension and the calculation will beperformed.
• You can also attach a local member to the row or column axis at a specific position. To do so, selectthe Use Position in Axis option in the Sheet Options. In our example, if this option is selected,you can see the local member details in the Local Members tab: the local member is attached tothe column axis and inserted at position 3.
2013-01-30114
Actions and Options Specific to the Current Report
16.5 Renaming Members
For a specific report, you can define the name you want for any member. The name you choose for amember overrides all the other names of the member (such as caption or description) coming from thecube or model and available for selection in the Member Selector. Therefore, the customized nameis displayed in the report and in the Member Selector. If you delete the customized name, the namechosen in the Member Selector (such as caption or description) is displayed again.
In the Member Names tab of the Report Editor, select a dimension, then select the member for whichyou want to enter a name and click Override.
Note:In the Member Names tab, you can enter a name for each member contained in the cube or model,not only for members currently displayed in the report. Even though you do not use certain members,if you decide to display them later, the customized name will be displayed.
To delete the entered name, select the checkbox corresponding to the name you want to delete andclick Delete.
16.6 Excluding Members
For a specific report, you can choose not to display specific members.
There are two ways of excluding members:• You can exclude a member from a report by clicking the Exclude button in the ribbon. The excluding
member action is persistent and the excluded members automatically appear in the ExcludedMembers tab of the Report Editor. If you want to exclude a member and do not want to save thisaction in the current report, then delete the member row or column, and the member will appearagain as soon as you perform a Refresh.
• You can exclude a member or a combination of members using the Excluded Members tab of theReport Editor. Click the ellipsis button, then select a dimension and the member that you want toexclude and click OK. A field is automatically added to enable you to select another member. Thisway, you can specify a combination of members to exclude. When you have finished selecting thedimensions and members, click Add. The combination of members is added to the list on the leftpart of the tab.
Note:
• The members of a combination are excluded in the report if they belong to the same axis.• A combination of members must include members that do not belong to the same
dimension/hierarchy.
2013-01-30115
Actions and Options Specific to the Current Report
Related Topics• Exclude Member
16.7 Member Insertion Filtering
For a specific report, you can create filters in order to restrict the member selection list when using theInsert Members functionality.
You create the filters in the Member Insertion Filtering tab of the Report Editor. Select a dimension,then click Edit Filter. In the Member Selector that opens, select the members that will be possible toinsert in the current report. You can modify the filter by clicking Edit Filter or you can delete it by clickingRemove Filter.
Once you have created a filter on a specific dimension, you will be able to insert in the report themembers specified in the filter. For more information about how to insert members, see Member EntryUsing the Insert Members Dialog Box.
Note:Even if the worksheet or workbook is protected, you will be able to insert in the report, the membersspecified in the filter. For more information about protection, see Worksheet Protection.
Related Topics• Member Entry Using the Member Selector
16.8 Microsoft Excel Features for Report Layout
If you use the following standard Microsoft Excel features to modify the layout of a report, as soon asyou perform a refresh, the actions performed are not kept.• Sorting data• Filtering data
2013-01-30116
Actions and Options Specific to the Current Report
Several Reports in a Sheet
You can define several reports in the same sheet, whether the reports are connected to the samecube/model or not.
Once the first report has been added to a sheet, the New Report button is enabled. When selecting it,the Report Editor appears.
Before defining the content of the report, you need to connect the report.• By default, the report is created on the active connection. The active connection is the one selected
in the Active Connection dropdown list.• If you want to create the new report on a connection other than the current one, select it from the
Active Connection dropdown list. In this list, the connections that are available are the connectionsthat you have connected since you opened the current Microsoft Excel instance.
• If you want to create the new report on a connection that has not yet been connected, select SelectAnother Connection from theActive Connection dropdown list. TheConnectionManager opens.
The name of the connection the report is using is displayed in the Layout tab of the Report Editor andin the Current Report area of the EPM pane.
Each report has a name. A default name is given to each new report. The first report created in a sheetis named Default Report. You can modify the names of each report in the Name area of the Layouttab of the Report Editor. The names of the report will appear in the dialog box where you can deletethe reports.
You can define a shift between the data grid and the row and column axis using the Shift areas. Youcan enter negative numbers for the row axis only. In this case, the row axis will be positioned on theright side of the data grid. However, restrictions exist when sharing an axis.
Note:For optimal use of the EPM add-in, when using several reports in a worksheet, all the reports must beconnected.
Sharing AxesYou can share axes between several reports that belong to the same sheet, whether the reports usethe same connection or different connections.
You can share the row axis, the column axis or the page axis of another report, using the [...] AxisShared With dropdown lists.
Note:The three axes can be shared from three different reports as long as the page axis remains above thetwo other axes.
2013-01-30117
Several Reports in a Sheet
When sharing axes, the reports are aligned on the sheet for readability. However, it may not be easyto distinguish the different reports from one another. Use the icon under Current Report in the EPMpane to distinguish them at a glance. When mousing over the icon, a tooltip indicates that clicking theicon highlights the current report.
Any action performed on shared axes (such as expand or collapse) applies to all the reports using theshared axes. The Current Report dropdown list in the EPM pane enables you to determine to whichreport the selected cell belongs. You are therefore ensured of performing an action in the correct report.
Note:When you share an axis that contains a hierarchy or dimension that exists in the other report, the systemlooks for and re-organizes the members that have the same captions. If the system does not find amember, a text is displayed in the cell of the report instead of the data of the member. The text bydefault is #NOMEMBERFOUND. You can change it by using the option Set Default Value whenMember not Found in Shared Axis in the Sheet Options and also in the Options tab of the ReportEditor.
Restriction:on the No Data and Zero Value feature. Child reports inherit the No Data and Zero Values option thatis selected for the master report. You cannot change the No Data and Zero Values option for eachshared axis of child reports (depending on the axis that is shared, the Rows or Columns area is notdisplayed in theOptions tab of theReport Editor). For more information, see No Data and Zero Values.
Sharing Axis: " master report " and " child report "The "master report" is the report whose axes are shared with other reports, which are called "childreports".
Example:
• You have created report "R1".• On the same sheet, you create report "R2" by clicking New Report from the EPM tab of the Ribbon.• In the Layout tab of the Member Selector, you place dimensions in the row axis and you select
"R1" in the Row Axis Shared with dropdown list.• R1 is the master report; R2 is the child report.
Related Topics• Report Editor's Layout Tab Presentation• Delete Reports• Report Highlight• Connection Management• Active Connection for the Current Sheet
17.1 Restrictions with Several Reports in a Sheet
When a sheet contains several reports, you cannot use the hide empty rows or columns.
2013-01-30118
Several Reports in a Sheet
Restrictions exist when sharing axes between several reports:• Shift feature: you can enter a negative number for the row axis only in the report that is the owner
of its row axis. If the report uses the row axis of another report, the Shift feature is not applied.• Only the report (master report) on which the axes are shared can be moved in the sheet. The other
reports that are based on the master report axes are moved along with the master report.• Adding a dimension on a shared axis. Report 2 shares the row axis of report 1 (master report). When
adding a dimension in the column axis of report 2, report 1 is not moved along. Solution: add a shiftof 1 in the column axis of the report 1. Report 2 inherits the shift. A blank row is displayed in report2 and you can add a dimension on this row.
Related Topics• No Data and Zero Values
17.2 Report Highlight
When a sheet contains several reports, you can use the highlight icon below Current Report in thepane. When mousing over the icon, a tooltip indicates that clicking the icon highlight the current report.This feature enables you to differentiate reports from one another.
The different areas of the report are highlighted using colors: page axis, row axis, column axis and datagrid.
To highlight a report, select a cell belonging to the report you want to highlight and click the icon in theEPM pane.
17.3 Delete Reports
You can delete one or more reports from a sheet.
Note:Deleting rows or columns using standard Microsoft Excel commands does not delete a report from theworksheet.
To delete reports, select Report Actions > Delete Reports. The Delete Reports dialog box opens.In the Delete column, check the boxes corresponding to the reports you want to delete.
Note:The first report created in the sheet is considered as the default report and it cannot be deleted.
The Delete Reports dialog box is composed as follows:• In the Default Report column, the default report is checked. You cannot modify this.
2013-01-30119
Several Reports in a Sheet

• The Axis Shared By Reports column displays information when several reports share the sameheader in the sheet.
• The Clear Report Cells option is selected by default. If you uncheck this option, the reports will stillappear but they will be disconnected. For example, unchecking this option can be useful if you donot need to navigate in a report or refresh the data, but you still want to keep the data. This optionenables you to keep the report as a simple copy in the sheet.
2013-01-30120
Several Reports in a Sheet
Report Refresh
To populate or refresh your report with the currently connected data source, use theRefresh command.The Refresh command causes the application to scan the selected report or all the reports for validreports, formulate and execute the query and then retrieve the data into the corresponding data grid.
You can refresh:• Refresh Report Data only: Only the data for all the reports in the worksheet, except the data for
local members.• Refresh Selected Report: The data of the selected report, the report itself (including local member
data and formatting) and certain EPM functions contained in local members (whether an EPMfunction is refreshed or not with the Refresh Selected Report action, is indicated in each EPMfunction section of this documentation).
• Refresh Worksheet: Everything that is in the current worksheet: the data of the reports, the dataof the EPM functions, all the reports (including local member data and formatting) and all EPMfunctions. This is the default action when clicking the Refresh button directly.
• Refresh Workbook: Everything that is in the current workbook: the data of the reports, the data ofthe EPM functions, all the reports (including local member data and formatting) and all EPM functions.
• Refresh Selected Data: The selected data. For a report, you can refresh one cell range at a timeand all the cells of the range must belong to the same report. You can also refresh the EPM functionsselected.
Note:A report is not refreshed with data unless you connect it and perform a Refresh. This means you arein full control of when the data is updated and you can ensure that the data has not changed since youlast saved the workbook.
The application refreshes hidden rows and columns for valid members that may affect the layout.
When you perform a Refresh, and a report is not connected, the connection dialog box automaticallyopens.
Note:In the Report Refresh area of the User Options, you can specify if you want a warning message tobe displayed when the current report contains more cells than the authorized number you have specified.
A refresh of the selected report is automatically performed after navigational and layout operations thatapply to valid reports:• Expand• Collapse• Keep member• Exclude member
2013-01-30121
Report Refresh
• Changes in the Report Editor• Selection changes in the page axis
You can deactivate and reactivate the data refresh feature by selecting EPM > More > Freeze DataRefresh or by selecting the Freeze Data Refresh option in the EPM > User Options. Freezing therefresh of data enables you to navigate in a report as you wish and the data is not loaded from the datasource. When you are finished navigating in the report, you can activate the refresh again and retrievethe latest data.
Note:When you select Freeze Data Refresh from the More menu, it is automatically selected in the UserOptions, and vice versa. Both are synchronized.
Note:You can also freeze the data refresh for a specific report in the Options tab of the Report Editor.
When you have a very large asymmetric axis and an out-of-memory message appears when you refreshthe report, select the Force Symmetric Refresh for Large Asymmetric Axis option in the UserOptions dialog box.
Merged Cell Behavior after a Refresh• Only the row axis, column axis and data grid cells are unmerged after a refresh, if the option Apply
only Report Editor Definition for Faster Refresh is selected. Any other merged cells are leftmerged.
• All merged cells are left merged after a refresh, provided that the option Apply only Report EditorDefinition for Faster Refresh is not selected, and only if the report is not modified and not movedin the worksheet.
Caution:If you merge cells that are used by a local member formula, the formula will not work. This is a MicrosoftExcel limitation.
Related Topics• Freeze Data Refresh• Apply only Report Editor Definition for Faster Refresh
18.1 Refreshing Reports
1. If you want to refresh the current report and if the current sheet contains several reports, select acell belonging to the report you want to refresh. If you want to refresh specific data cells, select them.
Note:If the current sheet contains only one report, you do not need to select a cell. If the current sheetcontains several reports, and if you select a cell that does not belong to any report, the default reportwill be refreshed.
2013-01-30122
Report Refresh
2. Depending on what you want to refresh, select:• EPM > Refresh > Refresh Report Data only• EPM > Refresh > Refresh Selected Report.• EPM > Refresh > Refresh Worksheet.• EPM > Refresh > Refresh Workbook.• EPM > Refresh > Refresh Selected Data.
When you click the Refresh button (without selecting an option in the dropdown list), the worksheet isrefreshed, meaning the reports and the EPM functions.
Related Topics• EPM Functions
2013-01-30123
Report Refresh

2013-01-30124
Report Refresh
User Options
You can define options that will apply to any use of the EPM add-in. Changes to this option will persistwhen Microsoft Office Excel, Word or PowerPoint is closed and reopened.
Note:
• Some options are only related fo features available in Microsoft Office Excel and therefore have noimpact when using Microsoft Office Word or PowerPoint.
• All the user options are stored in the EPMClientPreference.xml file located in\Users\[ID]\AppData\Local\EPMOfficeClient. You can change the default values of any option directlyin the file.
The following options are described in other sections of the help documentation. For more informationabout these options, follow the associated links.
The options are organized into three tabs:• Navigation tab:
• Enable Double-Click. See Double-Click Actions.• Expand/Collapse on Single Member. See Expand on Nested Axis and Collapse on Nested
Axis.• Keep/Exclude on Single Member. See Keep Member, Exclude Member and Asymmetric Report
Creation.• Automatic Refresh on Context Changes. See Context.• Warn if Navigation will Break Dynamic Selection. See Report Navigation.• Freeze Data Refresh. See Freeze Data Refresh.
Note:When you select Freeze Data Refresh from the More menu, it is automatically selected in theUser Options, and vice versa. Both are synchronized.
• Activate Metadata Cache and Clear Metadata Cache Frequency. See Metadata Cache.• Refresh Charts Automatically. See Dynamic Charts .• Keep Rows and Columns of Unrecognized Members. See Open a Report when Dimensions
or Members have Changed.• Warn if Rows and Columns of Unrecognized Members Will be Kept. See Open a Report
when Dimensions or Members have Changed.• Apply Specific Formatting to UnrecognizedMembers. See Member Entry Directly in a Sheet.• Refresh only Expanded and Inserted Members. See Expand and Member Entry Using the
Insert Members Dialog Box.• Members per Page in Member Selector. See Member Entry Using the Member Selector (on
Large Volume Data Sources).
2013-01-30125
User Options
• Server Configuration tab:• SAPBusinessObjects Enterprise Server. Explained in the SAP BusinessObjects EPM Solutions,
add-in for Microsoft Office Installation Guide.• SAP Portal. Explained in the SAP BusinessObjects EPM Solutions, add-in for Microsoft Office
Installation Guide.• SMTP Server Configuration options. See Workbook Distribution.• Open/Save Root Folder area. See Open and Save Dialog Box Description and Actions .
• Display tab:• Quick Links and Link-Related EPM Functions options. See Quick Links, EPMLink and EPM
PathLink.• Languages option. See Languages.• Context Bar and Pane options. See Main Interface Areas.• Display Context inside EPM Pane. See Context and Main Interface Areas.• Display Local Connections. See Connection Management.• Display Warning when Saving Data or Comment. See Data Save and Comment Creation and
Modification.• Display Matrix SecurityWarning andUnauthorized Cell Text. See Security on Data (Planning
and Consolidation, version for SAP NetWeaver).• Display Warning when Process Takes Time. A warning message appears when the following
criteria are met:• The Display Warning when Process Takes Time option is selected (the option is selected
by default);• A large number of rows/columns (more than 5 000) are about to be displayed in the report.
This warning is displayed after the following actions: any refresh action, click OK in the ReportEditor, drag and drop of a dimension in an axis area in the EPM pane, member expansion (usingthe double-click on a member or the Expand button from the EPM tab).
The warning message indicates that a large number of rows or columns are about to be displayedin the report and that therefore, the process will take some time. As the Keep all feature isselected for an axis of the report, all rows or columns will be displayed even if they are empty orcontain zero values. If you still want to display all the rows or columns, you can click OK. If not,click Cancel and select an option different than Keep all in the No Data and Zero Values areain the General tab of the Sheet Options or in the Options tab of the Report Editor. You canselect Remove Empty or Remove Empty and Zero Values. Fewer rows or columns may bedisplayed and the process will be faster. For more information about No Data and Zero Valuesoptions, see No Data and Zero Values.
• Others tab:• Warn if Report Exceeds option. See Report Refresh .• Force Symmetric Refresh for Large Asymmetric Axis option. See Report Refresh .• Refresh only Data on "Save & Refresh Data" option. See Data Save.• Do not Protect Workbook option. See Offline Mode.• Load EV Functions. See EPM Functions.• Use EPMMemberID in EPM formulas. See EPM Functions and Local Member Creation.• Notify me when updates are available option. See Update.• Empty Comment option. See EPMSaveComment.
2013-01-30126
User Options

• Remove EPM Worksheets Before Generation option. See Workbook Sheet AutomaticGeneration.
2013-01-30127
User Options

2013-01-30128
User Options
Sheet Options
The sheet options apply to the current worksheet.
Note:The two following options apply to all the worksheets in the workbook: Refresh the Whole File whenOpening it and Clear Data on the Whole File when Saving it.
To apply all the options to any new sheet added to the workbook, click the Save as Default button.
The sheet options apply by default to any report on the sheet.
Note:The report options are accessible in the Options tab of the Report Editor.
The sheet options persist for the sheet when the workbook is saved.
If you copy a worksheet, then the sheet options will also be copied to the new sheet.
To access the Sheet Options dialog box, select EPM > Options > Sheet Options.
Note:All the sheet options are stored in the <DefaultSheetOptions> section of the EPMClientPreference.xmlfile located in \Users\[ID]\AppData\Local\EPMOfficeClient. You can change the default values of anyoption directly in the file.
20.1 General Sheet Options
20.1.1 Expand Options
This option controls what scope of member expansion occurs when you perform an expand on amember.
The options are as follows:• Member and Children. This is the default option.• Children
2013-01-30129
Sheet Options
• Member and Descendants• Descendants• Custom Expand. When you select Custom Expand, a dialog box opens and you can define the
levels you want to display and if you want to include the selected member or not. For example: onlylevel 4, the selected member and down to level 3, etc.
The option you select for the sheet applies by default when you perform an expand on a member in areport. However, using the Expand list in the EPM tab of the ribbon, you can apply another option.
Related Topics• Expand• Collapse
20.1.2 Use as Input Form
Applies to:Planning and Consolidation connections.
If you encounter long loading time when opening reports and if you do not want to use the reports asinput forms (to input and save data to the server), you can deselect the Use as Input Form option.
If you want to enter and save data, select the option, then perform a refresh on the sheet. You can thenenter data and save it to the server.
Related Topics• Data Save
20.1.3 Member Recognition Activation
The Member Recognition and the Local Member Recognition can independantly be activated ordeactivated.
Related Topics• Activating or Deactivating the Member Recognition Options• Local Member Automatically Detected
2013-01-30130
Sheet Options
20.1.4 EPM Worksheet
By default, any worksheet is considered as an EPM worksheet, meaning a worksheet that uses one ormore connections and on which you can use the EPM add-in features.
You can disconnect a worksheet by deselecting the EPM Worksheet option in the Sheet Options.Consequently, the checkbox corresponding to the current sheet is unchecked in theReport Connectionsdialog box.
You can reconnect a worksheet at any time by selecting the EPM Worksheet option, or by using theReport Connections dialog box.
Tip:Using the Report Connections dialog box, you can connect or disconnect several sheets at the sametime.
Note:However, if the AutoActiveEPMSheet parameter is set to TRUE in the FPMXLClient.dll.configfile, the worksheet from which you perform a log on is always considered as an EPM worksheet andthe sheet option EPM Worksheet is automatically selected.
Related Topics• Selectively connecting or disconnecting sheet/connection pairs
20.1.5 Totals Placement
By default, totals are displayed:• At the bottom on the row axis.• On the right side on the column axis.
You can change the totals placement for the current sheet in the General tab of the Sheet Options byusing the Totals Placement options. The changes will be taken into account by default for any reportin the sheet. You can then modify the totals placement for a specific report in the Options tab of theReport Editor.
Example:
If the Top and the Left options are selected, the data is displayed as shown below.
2013-01-30131
Sheet Options
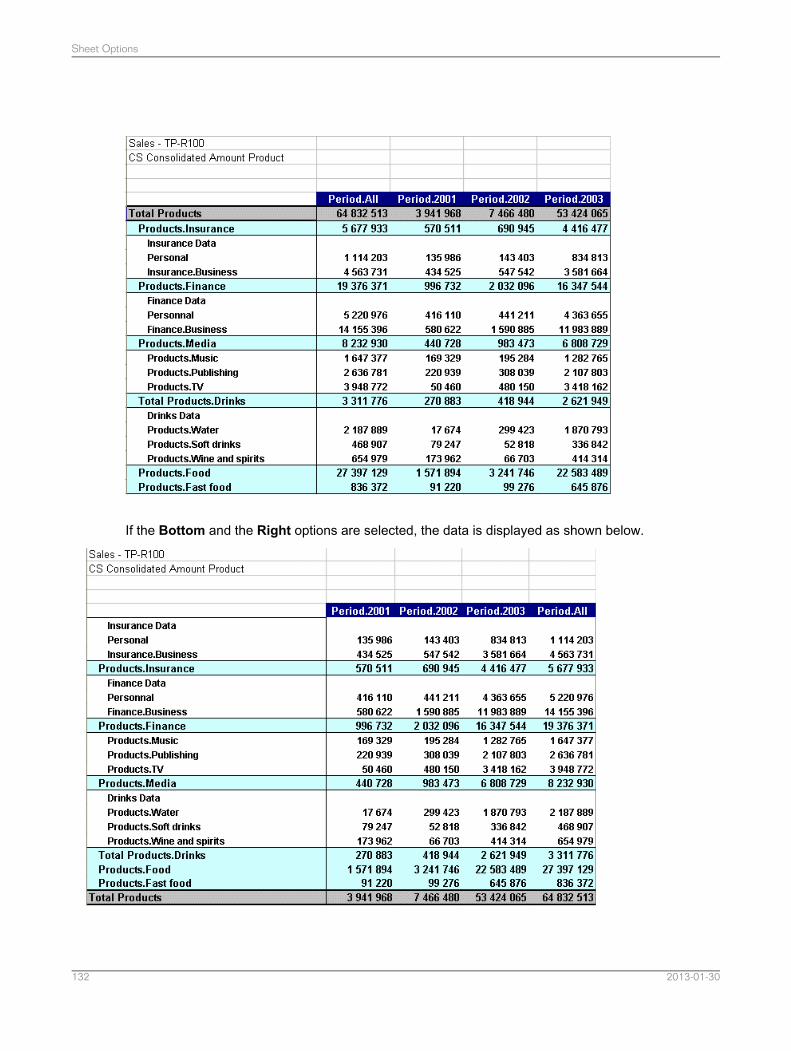
If the Bottom and the Right options are selected, the data is displayed as shown below.
2013-01-30132
Sheet Options
20.1.6 No Data and Zero Values
You can select options that deal with rows or columns that contain no data or zero values in the reports.
Note:
• By default, empty rows and empty columns are kept in the report.• Empty rows and columns behavior for inserted members. You have selected the Remove Empty
option for rows or columns in the Sheet Options. Then, you insert members using the InsertMembers dialog box. Some of the inserted members do not have any data. However, they remainin the report as long as you do not refresh the report. If you are using an input form (Use as InputForm option selected in the Options tab of the Report Editor), you can therefore enter data in rowsor columns that do not yet contain any data. Then, when you refresh the report, the columns or rowsfor the members that do not contain data are not displayed in the report. For more information onthe Insert Members feature, see Member Entry Using the Insert Members Dialog Box.
• In the case where several reports share an axis, child reports inherit the No Data and Zero Valuesoption that is selected for the master report. You cannot change the No Data and Zero Valuesoption for each shared axis of child reports (depending on the axis that is shared, the Rows orColumns area is not displayed in the Options tab of the Report Editor). For more information, seeSeveral Reports in a Sheet .
• The settings you define for the sheet apply to all the reports of the sheet. However, you can modifythe settings for a specific report in the Options tab of the Report Editor. Note that you cannot hidethe empty columns and the empty rows for a report. Only the Keep all and Remove Empty optionsare available.
• The Remove Empty option applied to rows or columns, automatically removes any row or columnin the report that has no data after every operation that refreshes the cube or model. It can be veryuseful when you expand to lower levels in a sparse portion of the cube or model that has a lot ofempty rows or columns.
Note:
• In a nested axis, this may result in an asymmetric report.• The removed rows or columns will not come back even if the missing rows or columns
subsequently contain data in the cube or model, for example the next month.• To avoid confusion, the Remove Empty option cannot be turned on for empty rows at the same
time as the Hide Empty option for empty rows.• To avoid confusion, the Remove Empty option cannot be turned on for empty columns at the
same time as the Hide Empty option for empty columns.• The Remove Empty and Zero Values option applied to rows or columns, automatically removes
any row or column in the report that has no data or that contains zero values after every operationthat refreshes the cube or model. It can be very useful when you expand to lower levels in a sparseportion of the cube or model that has a lot of empty rows or columns.
2013-01-30133
Sheet Options
• The Hide Empty option applied to rows or columns, automatically hides any row or column in thereport that has no data and unhides any row or column that does have data. This is a standardMicrosoft Office Excel hide (right-click on a Microsoft Office Excel row or column header and thenchoose the context command Hide Empty). The rows or columns can be manually unhidden usingthe regular Microsoft Office Excel commands.
Since the rows or columns are just hidden and therefore still read by the add-in, they will beautomatically unhidden if a subsequent Refresh is performed and they now contain data. For example,when you change a page axis member to a different product, region or time period.
This is useful to create more concise and printable reports that have a large percentage of rows orcolumns that are empty but may vary based on the page axis member selections.
Note:
• When the Hide Empty option is turned off for rows or columns, the add-in will not automaticallyunhide every row or column since you may have some rows or columns hidden for other reasons.Therefore, you must explicitly unhide them yourself if you want to redisplay all rows.
• To avoid confusion, the Hide Empty option cannot be turned on for rows or columns at the sametime as the Remove Empty option for rows or columns.
• When a sheet contains more than one report, the Hide Empty option is not available.• The Hide Empty and Zero Values option applied to rows or columns, automatically hides any row
or column in the report that has no data or that contains zero values and unhides any row or columnthat does have data. It can be very useful when you expand to lower levels in a sparse portion ofthe cube or model that has a lot of empty rows or columns. This is a standard Microsoft Office Excelhide (right-click on a Microsoft Office Excel row or column header and then choose the contextcommandHide Empty). The rows or columns can be manually unhidden using the regular MicrosoftOffice Excel commands.
Since the rows or columns are just hidden and therefore still read by the add-in, they will automaticallybe unhidden if a subsequent Refresh is performed and they now contain data other than zero. Forexample, when you change a page axis member to a different product, region or time period.
This is useful to create more concise and printable reports that have a large percentage of rows orcolumns that are empty or contain zero values, but may vary based on the page axis memberselections.
Related Topics• Asymmetric Report Creation
20.1.7 Show as Microsoft Excel Comments
Applies to:Planning and Consolidation connections.
2013-01-30134
Sheet Options
The Show as Microsoft Excel Comments option enables you to display comments as standardMicrosoft Office Excel comments: a small red triangle in the corner of a cell indicates that the cell hasa comment attached to it. When you rest the pointer over the red triangle, the comment is displayed ina tooltip.
When selected, this option displays the following Planning and Consolidation comments:• Outside of a report, when you use an EPM function that retrieves a comment, the comment is
displayed by default in the cell in which you have entered the fonction.• In a report, any comment at the intersection of members is displayed.
You can modify the comments directly in the tooltips.
Note:Even if the worksheet is protected, if you select Edit Objects in the Protection tab of the Sheet Options,you can still modify the comments directly in the tooltips.
Related Topics• Comment Display in a Cell• EPMCommentFullContext• EPMCommentPartialContext• Worksheet Protection
20.2 Formatting Sheet Options
20.2.1 Row Header Indentation
The Row Header Indentation options control the indention of child members relative to their parentsin the row axis of all the reports of the current sheet.
The options are as follows:• No Indentation• Indent Children. This is the default option.• Indent Parents
Indentation is very useful during ad-hoc navigation as a visual clue to the relationship of members. Theindentation is often kept in final reports as well. The indentation is achieved by modifying the indentsetting that can be seen in the Microsoft Office Excel menu Alignment tab of the Format Cells dialogbox. It can also be modified using the Microsoft Office Excel increase and decrease indent buttons.
2013-01-30135
Sheet Options
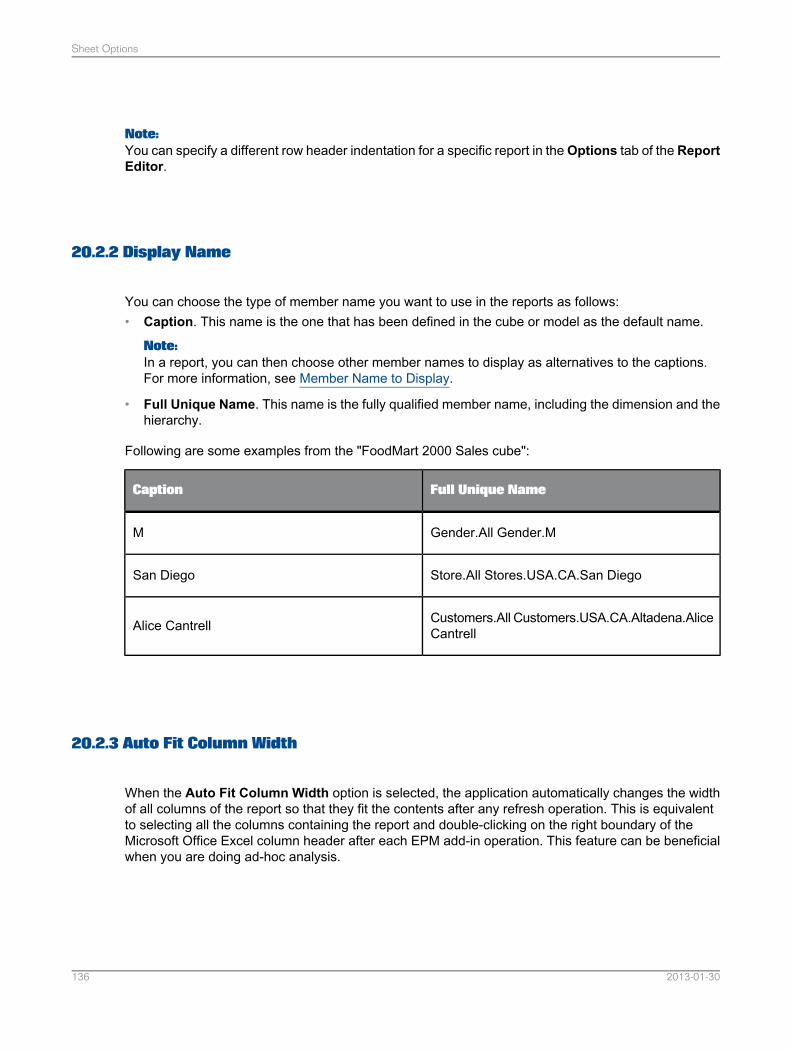
Note:You can specify a different row header indentation for a specific report in the Options tab of the ReportEditor.
20.2.2 Display Name
You can choose the type of member name you want to use in the reports as follows:• Caption. This name is the one that has been defined in the cube or model as the default name.
Note:In a report, you can then choose other member names to display as alternatives to the captions.For more information, see Member Name to Display.
• Full Unique Name. This name is the fully qualified member name, including the dimension and thehierarchy.
Following are some examples from the "FoodMart 2000 Sales cube":
Full Unique NameCaption
Gender.All Gender.MM
Store.All Stores.USA.CA.San DiegoSan Diego
Customers.All Customers.USA.CA.Altadena.AliceCantrellAlice Cantrell
20.2.3 Auto Fit Column Width
When the Auto Fit Column Width option is selected, the application automatically changes the widthof all columns of the report so that they fit the contents after any refresh operation. This is equivalentto selecting all the columns containing the report and double-clicking on the right boundary of theMicrosoft Office Excel column header after each EPM add-in operation. This feature can be beneficialwhen you are doing ad-hoc analysis.
2013-01-30136
Sheet Options
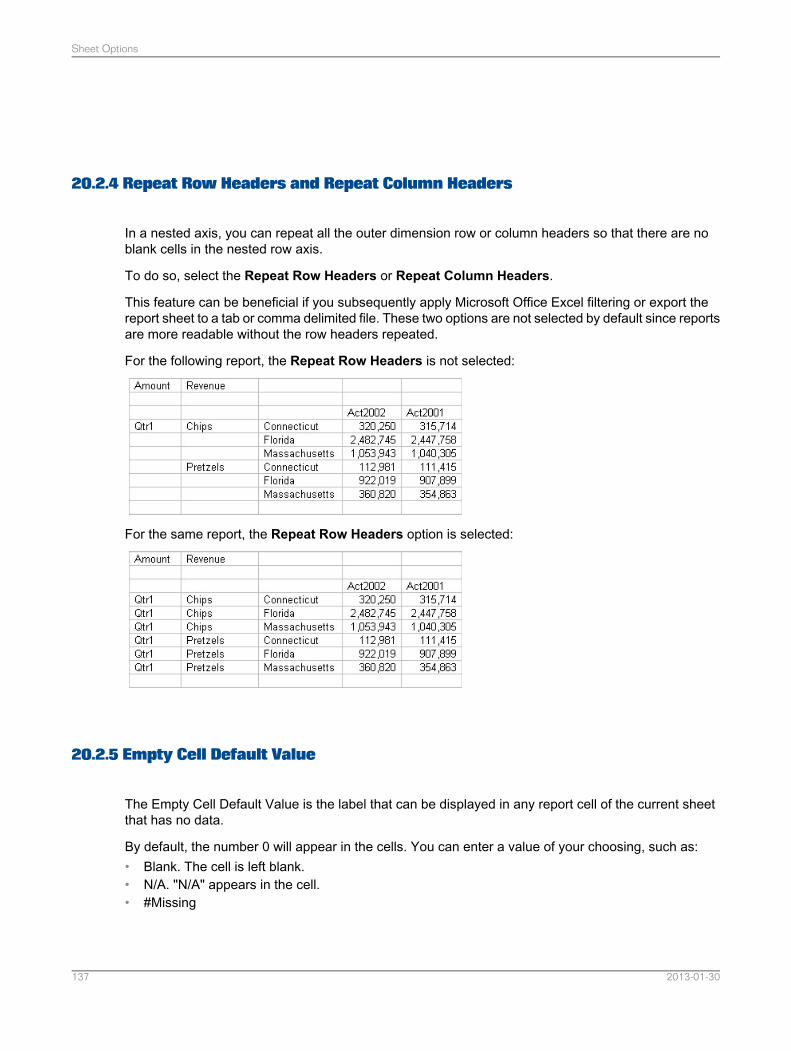
20.2.4 Repeat Row Headers and Repeat Column Headers
In a nested axis, you can repeat all the outer dimension row or column headers so that there are noblank cells in the nested row axis.
To do so, select the Repeat Row Headers or Repeat Column Headers.
This feature can be beneficial if you subsequently apply Microsoft Office Excel filtering or export thereport sheet to a tab or comma delimited file. These two options are not selected by default since reportsare more readable without the row headers repeated.
For the following report, the Repeat Row Headers is not selected:
For the same report, the Repeat Row Headers option is selected:
20.2.5 Empty Cell Default Value
The Empty Cell Default Value is the label that can be displayed in any report cell of the current sheetthat has no data.
By default, the number 0 will appear in the cells. You can enter a value of your choosing, such as:• Blank. The cell is left blank.• N/A. "N/A" appears in the cell.• #Missing
2013-01-30137
Sheet Options
Note:
• Empty cells (no data) are not the same as cells with zero in them, although it is recommended theybe treated as zero in calculations.
• You can specify a different empty cell value for a specific report in the Options tab of the ReportEditor.
20.2.6 Member not Found Default Value
The Member not Found Default Value is the label that can be displayed in any report cell of the currentsheet when a member is not found for the following reason: you share an axis that contains a hierarchyor dimension that exists in the other report, the system looks for and reorganizes the members thathave the same captions. If the system does not find a member, a text is displayed in the cell of thereport instead of the data of the member.
The text by default is #NOMEMBERFOUND. You can change this text.
Note:You can specify a different value for a specific report in the Options tab of the Report Editor.
20.2.7 Apply Dynamic Formatting
You can apply a specific dynamic formatting to the current sheet.
To do so, select the Apply Dynamic Formatting option. The Default Formatting Sheet dropdown listis made available. Select one of the dynamic formatting sheets you have defined, in order to apply itto the reports of the current sheet.
If the reports to which you want to apply dynamic formatting, already contain formatting applied byanother add-in than the EPM add-in, you can do as follows:• Keep the existing formatting and override it with the dynamic formatting. To do so, deselect the
Clear Report Format before Applying Dynamic Formatting option.• Clear the existing format so that only the EPM dynamic formatting is applied. To do so, select the
Clear Report Format before Applying Dynamic Formatting option.
Note:
• If the Apply Dynamic Formatting option is not available for selection, it means that you must firstdisplay at least the default formatting sheet by clicking View Formats in the EPM tab of the ribbon.
• You can specify a different dynamic formatting for a specific report in the Options tab of the ReportEditor.
2013-01-30138
Sheet Options
Related Topics• Dynamic Formatting
20.3 Refresh Sheet Options
20.3.1 Keep Formula on Data and Show Source Data in Comments
You can enter a formula in a cell that already contains data. When you perform a refresh, the formulais removed. If you want the formulas entered on data to remain after a refresh, select theKeep Formulaon Data option.
Note:The formulas are not kept in the following situations:• When you share an axis with another report.• When you change or add dimensions in the different axes.• When you have chosen a context member selection for a dimension in your report and you change
the context member using the EPM Context bar, then perform a refresh. To keep formulas in sucha case, you can use the Keep Formulas Static that Reference Report Cells option. See KeepFormulas Static that Reference Report Cells .
• When you switch the row and the column axes.• When you move the row axis on the other side of the data grid using the shift feature in the Report
Editor.
After a refresh, the data displayed is the result of the formula; it is no longer the source data from thecube or model. You can still display the source data as a Microsoft Office Excel comment (which youcan view by mousing over the cell). To do so, select the Show Source Data in Comments option andperform a refresh.
Note:
• Once you have displayed the source data in comments, if you uncheck the Show Source Data inComments option, the comments will still remain in the report. You must delete them manually.
• Comments displaying source data take precedence over all other comments in the report.
20.3.2 Calculate Parents in Hierarchies
2013-01-30139
Sheet Options
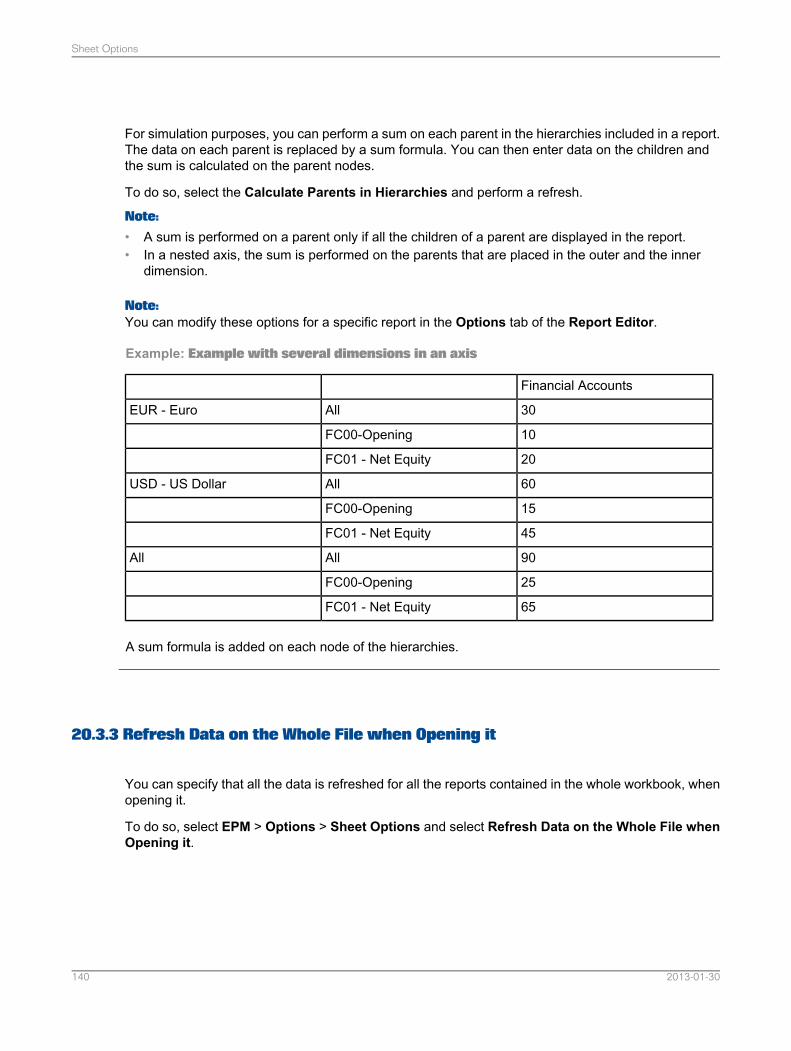
For simulation purposes, you can perform a sum on each parent in the hierarchies included in a report.The data on each parent is replaced by a sum formula. You can then enter data on the children andthe sum is calculated on the parent nodes.
To do so, select the Calculate Parents in Hierarchies and perform a refresh.
Note:
• A sum is performed on a parent only if all the children of a parent are displayed in the report.• In a nested axis, the sum is performed on the parents that are placed in the outer and the inner
dimension.
Note:You can modify these options for a specific report in the Options tab of the Report Editor.
Example: Example with several dimensions in an axis
Financial Accounts
30AllEUR - Euro
10FC00-Opening
20FC01 - Net Equity
60AllUSD - US Dollar
15FC00-Opening
45FC01 - Net Equity
90AllAll
25FC00-Opening
65FC01 - Net Equity
A sum formula is added on each node of the hierarchies.
20.3.3 Refresh Data on the Whole File when Opening it
You can specify that all the data is refreshed for all the reports contained in the whole workbook, whenopening it.
To do so, select EPM > Options > Sheet Options and select Refresh Data on the Whole File whenOpening it.
2013-01-30140
Sheet Options
20.3.4 Clear Data on the Whole File when Saving it
You can specify that all the data is cleared from the reports contained in the whole workbook, whensaving it.
To do so, select EPM > Options > Sheet Options and select Clear Data on the Whole File whenSaving it.
20.3.5 Show Unauthorized Cell Text
Applies to:Planning and Consolidation, version for SAP NetWeaver, connections.
If you are using a model on which security on data has been defined, in a report, the cells containingdata that you are not authorized to view are left blank by default. To display a text in the report cells,select theShowUnauthorized Cell Text option. The text that is displayed is defined in theUnauthorizedCell Text field in the User Options.
Related Topics• Security on Data (Planning and Consolidation, version for SAP NetWeaver)
20.3.6 Apply only Report Editor Definition for Faster Refresh
If you work with large reports that contain a lot of members, and for which the refresh time is too long,you can select the Apply only Report Editor Definition for Faster Refresh option in the SheetOptions; as a consequence, the reports are refreshed much faster.
However, each time you refresh the report, it is displayed as it is defined in the Report Editor. Anymanual modification in a report is just ignored (except for the expand and collapse action, see the notebelow):• If you insert Microsoft Excel empty rows and columns and then refresh the report, the empty rows
and columns are deleted.• If you create Microsoft Excel formulas that reference a member, the formula is not dynamic and
actually references the member cell. If you move the referenced member to another cell, the MicrosoftExcel formula will still reference the initial cell, not the member.
2013-01-30141
Sheet Options
Also, the EPMDimensionOverride and EPMAxisOverride functions cannot be used when this option isselected.
Note:
• When you perform an Expand or Collapse on a member, it is saved in the report definition. Whenyou open the Member Selector, you can see that the Expand or Collapse has been kept.
• When this option is selected, here is how merged cells behave after a refresh: Only the row axis,column axis and data grid cells are unmerged after a refresh. Any other merged cells are left merged.
Related Topics• EPMAxisOverride• EPMDimensionOverride
20.3.7 Restore Dynamic Selection on Refresh after Navigation
When you perform an expand or collapse, the dynamic selection is automatically broken.
For example, you perform a dynamic selection and select the member Europe with the Member andChildren relationship. When you perform a collapse on one of its children in your report, the selectionbecomes static (you can check this by opening the Member Selector).
However, to restore the dynamic selection, you can select theRestore Dynamic Selection on Refreshafter Navigation option in the Refresh tab of the Sheet Options. You must select this option beforeperforming an expand or collapse. Once you have performed an expand or collapse, refresh the report:the report is restored with the dynamic selection.
Note:If you open the Report Editor or the Member Selector and click OK, the current report definition(inluding the static selection) is saved and therefore the dynamic selection is not restored.
20.3.8 Keep Formulas Static that Reference Report Cells
If you use Microsoft Excel formulas that reference the cells (data or member) of a report, and if youwant those formulas to be static, you can select the option Keep Formulas Static that ReferenceReport Cells in the Sheet Options.
Consequently, when you create a Microsoft Excel formula that references a report cell, the formula isnot dynamic: it references the cell itself and not the cell content.• If the referenced member or data is moved to another cell after a refresh, the Microsoft Excel formula
will still reference the initial cell, and not the member/data.
2013-01-30142
Sheet Options

• Also, if you have chosen a context member selection for a dimension in your report and you changethe context member using the EPM Context bar, and you then perform a refresh, #REF will not bedisplayed in the cell instead of the formula. In the case where you do not select the Keep FormulasStatic that Reference Report Cells option, #REF will be displayed in the cell instead of the formula;this is the standard EPM add-in behavior.
If you select this option, it is recommended that you do not move your report. The report layout mustremain static, namely if you use the following features: Keep Formula on Data option, CalculateParents in Hierarchies option, and axis shared between several reports.
Note:If the Keep Formulas Static that Reference Report Cells option is selected, you cannot use theApply only Report Editor Definition for Faster Refresh sheet option (the option is greyed out) andselecting theRefresh only Expanded and InsertedMembers user option will not be taken into account.
2013-01-30143
Sheet Options

2013-01-30144
Sheet Options
Report Navigation
You can navigate in a report.
Note:When you perform an expand, collapse or keep operation, you can specify that a message warn youthat the operation will break the dynamic selection. To enable the warning message, select the Warnif Navigation will Break Dynamic Selection option in the User Options. For example, if you selectthe member Europe with the Member and Children relationship, and you perform a keep on one ofits children in your report, the message appears. If you click OK, the keep operation is performed butthe dynamic selection is broken. Click Cancel to cancel the keep operation.
21.1 Going Back in the Navigation Actions
The Back command will undo up to five of the most recent EPM add-in navigation operations that youhave performed on your Microsoft Office Excel spreadsheet, your Microsoft Office Word document oryour Microsoft Office PowerPoint presentation.
The Back command can undo the following navigation operations, even in the case where axes areshared between several reports:• Expand• Collapse• Keep Member• Exclude Member
Note:The four operations above do not apply to Microsoft Office Word nor to Microsoft Office PowerPoint.
• Entering a member when the Member Recognition is activated.• Row and column axes switch.• EPM pane changes.• Report Editor changes.• Member Selector changes.• Refresh data.
TheBack navigation action can be executed from the ribbon. It will persist (be enabled) on a spreadsheetuntil you do something else on the same spreadsheet using Excel, or another EPM add-in operationon any spreadsheet. Its purpose is to let you immediately back out of a navigational action, layoutchange, or refresh of the cube that was done in error or gave you undesirable results.
2013-01-30145
Report Navigation
21.2 Row and Column Axes Switch
You can invert the row and the column axes of a report.
To switch the report axes, click the button located between the Row Axis and Column Axis areas inthe EPM pane or right-click in the report and select EPM > Switch Axes.
Note:
• A message indicates that if you have defined sorting, ranking or filtering criteria in the report, thecriteria will be lost.
• You cannot switch the row and column axes of a report that shares an axis with another report. Inthis case, the button is deactivated.
21.3 Expand
The Expand command on a member selected in a report, drills down to the members below (dependingon the expansion relationship behavior chosen) and all occurrences of the same member. You canperform an expand on:• the children of the selected parent and the parent itself• the children of the selected parent• the descendants of the selected parent and the parent itself• the descendants of the selected parent
You can also define a custom expand. For example, you can drill down to all members at level 4, ordisplay only members at level 2.
To specify the expansion relationship behavior you want to apply by default, select an option in theExpand Options area in EPM > Options > Sheet options > General. The option selected is appliedby default:• When you click the Expand button in the EPM tab. However, using the Expand button list, you can
select other behaviors, the same as in the sheet options that are listed above.
Note:When you select Custom Expand, a dialog box opens and you can define the levels you want todisplay and if you want to include the selected member or not. So that the selection is taken intoaccount, you must select the Apply Custom Expand option.
• Also, if you select the Enable Double-Click option in the User Options, the fastest way to performan expand is to double-click on the member you want to expand. This allows you to quickly drilldown to find what you are looking for.
The expand action automatically refreshes the report after it has expanded.
2013-01-30146
Report Navigation
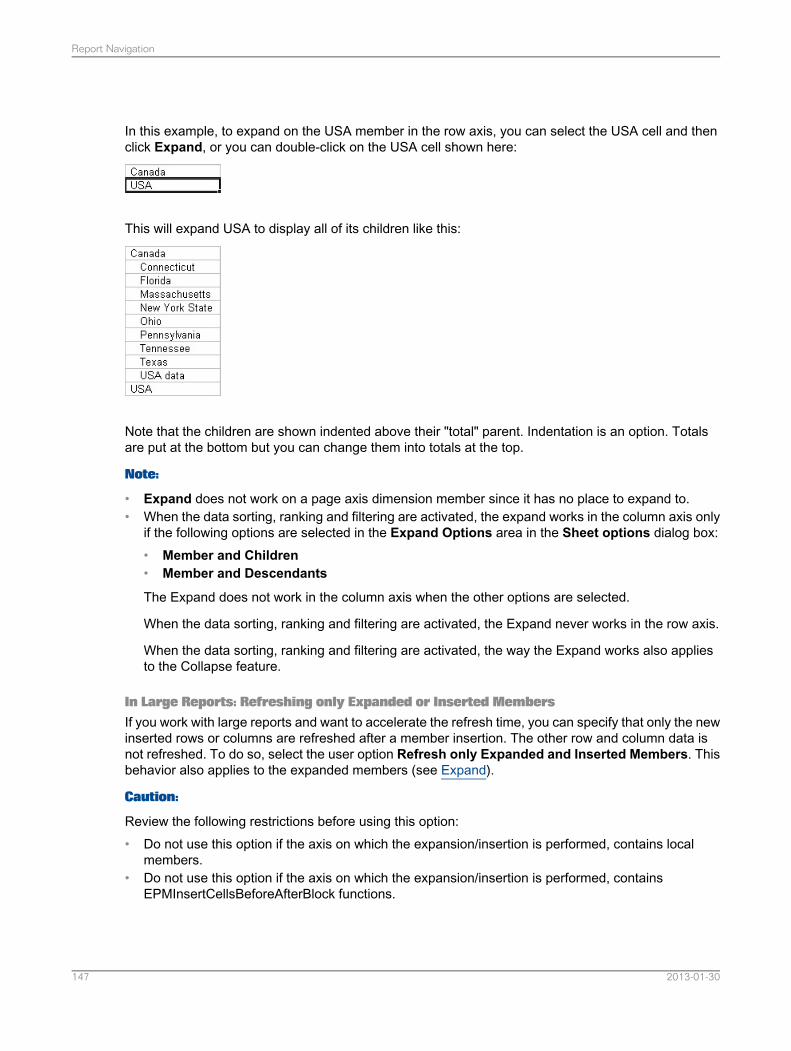
In this example, to expand on the USA member in the row axis, you can select the USA cell and thenclick Expand, or you can double-click on the USA cell shown here:
This will expand USA to display all of its children like this:
Note that the children are shown indented above their "total" parent. Indentation is an option. Totalsare put at the bottom but you can change them into totals at the top.
Note:
• Expand does not work on a page axis dimension member since it has no place to expand to.• When the data sorting, ranking and filtering are activated, the expand works in the column axis only
if the following options are selected in the Expand Options area in the Sheet options dialog box:• Member and Children• Member and Descendants
The Expand does not work in the column axis when the other options are selected.
When the data sorting, ranking and filtering are activated, the Expand never works in the row axis.
When the data sorting, ranking and filtering are activated, the way the Expand works also appliesto the Collapse feature.
In Large Reports: Refreshing only Expanded or Inserted MembersIf you work with large reports and want to accelerate the refresh time, you can specify that only the newinserted rows or columns are refreshed after a member insertion. The other row and column data isnot refreshed. To do so, select the user option Refresh only Expanded and Inserted Members. Thisbehavior also applies to the expanded members (see Expand).
Caution:
Review the following restrictions before using this option:• Do not use this option if the axis on which the expansion/insertion is performed, contains local
members.• Do not use this option if the axis on which the expansion/insertion is performed, contains
EPMInsertCellsBeforeAfterBlock functions.
2013-01-30147
Report Navigation
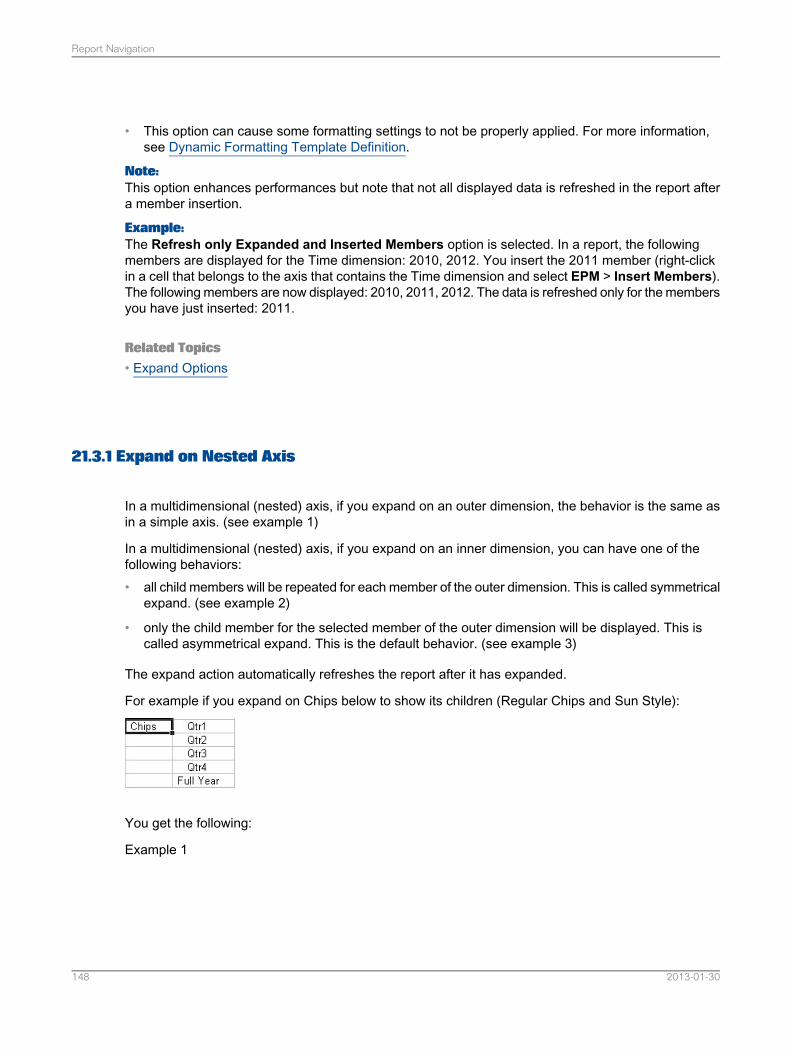
• This option can cause some formatting settings to not be properly applied. For more information,see Dynamic Formatting Template Definition.
Note:This option enhances performances but note that not all displayed data is refreshed in the report aftera member insertion.
Example:The Refresh only Expanded and Inserted Members option is selected. In a report, the followingmembers are displayed for the Time dimension: 2010, 2012. You insert the 2011 member (right-clickin a cell that belongs to the axis that contains the Time dimension and select EPM > Insert Members).The following members are now displayed: 2010, 2011, 2012. The data is refreshed only for the membersyou have just inserted: 2011.
Related Topics• Expand Options
21.3.1 Expand on Nested Axis
In a multidimensional (nested) axis, if you expand on an outer dimension, the behavior is the same asin a simple axis. (see example 1)
In a multidimensional (nested) axis, if you expand on an inner dimension, you can have one of thefollowing behaviors:• all child members will be repeated for each member of the outer dimension. This is called symmetrical
expand. (see example 2)
• only the child member for the selected member of the outer dimension will be displayed. This iscalled asymmetrical expand. This is the default behavior. (see example 3)
The expand action automatically refreshes the report after it has expanded.
For example if you expand on Chips below to show its children (Regular Chips and Sun Style):
You get the following:
Example 1
2013-01-30148
Report Navigation
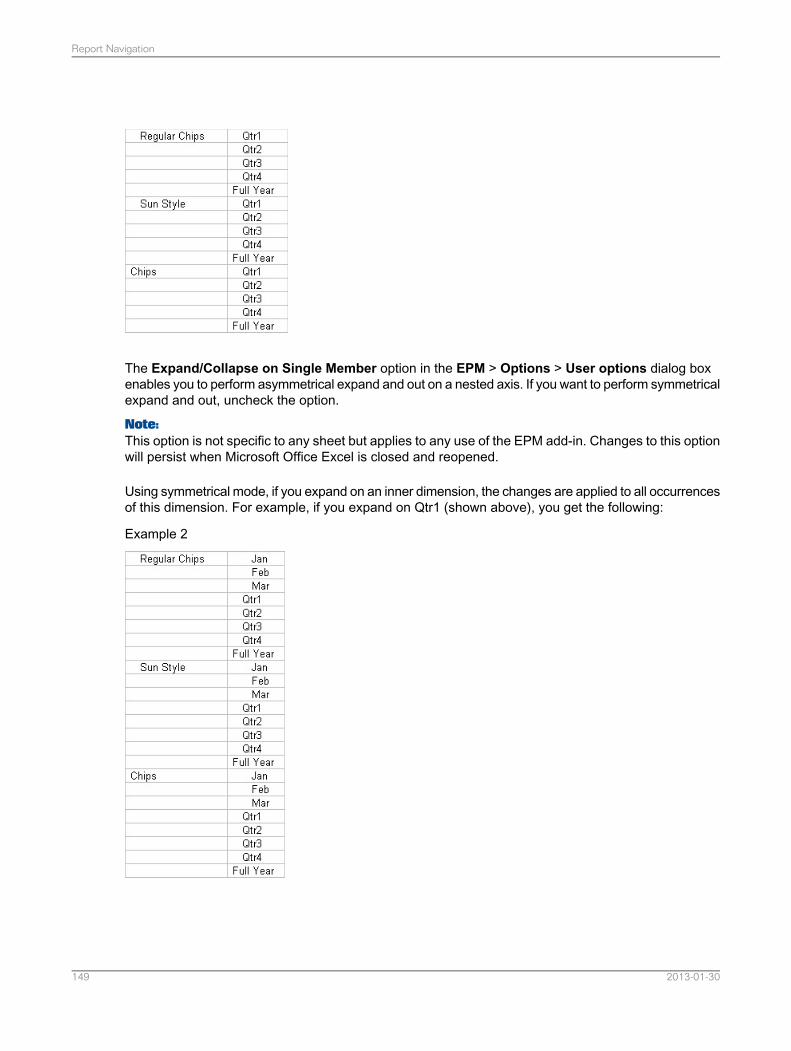
The Expand/Collapse on Single Member option in the EPM > Options > User options dialog boxenables you to perform asymmetrical expand and out on a nested axis. If you want to perform symmetricalexpand and out, uncheck the option.
Note:This option is not specific to any sheet but applies to any use of the EPM add-in. Changes to this optionwill persist when Microsoft Office Excel is closed and reopened.
Using symmetrical mode, if you expand on an inner dimension, the changes are applied to all occurrencesof this dimension. For example, if you expand on Qtr1 (shown above), you get the following:
Example 2
2013-01-30149
Report Navigation
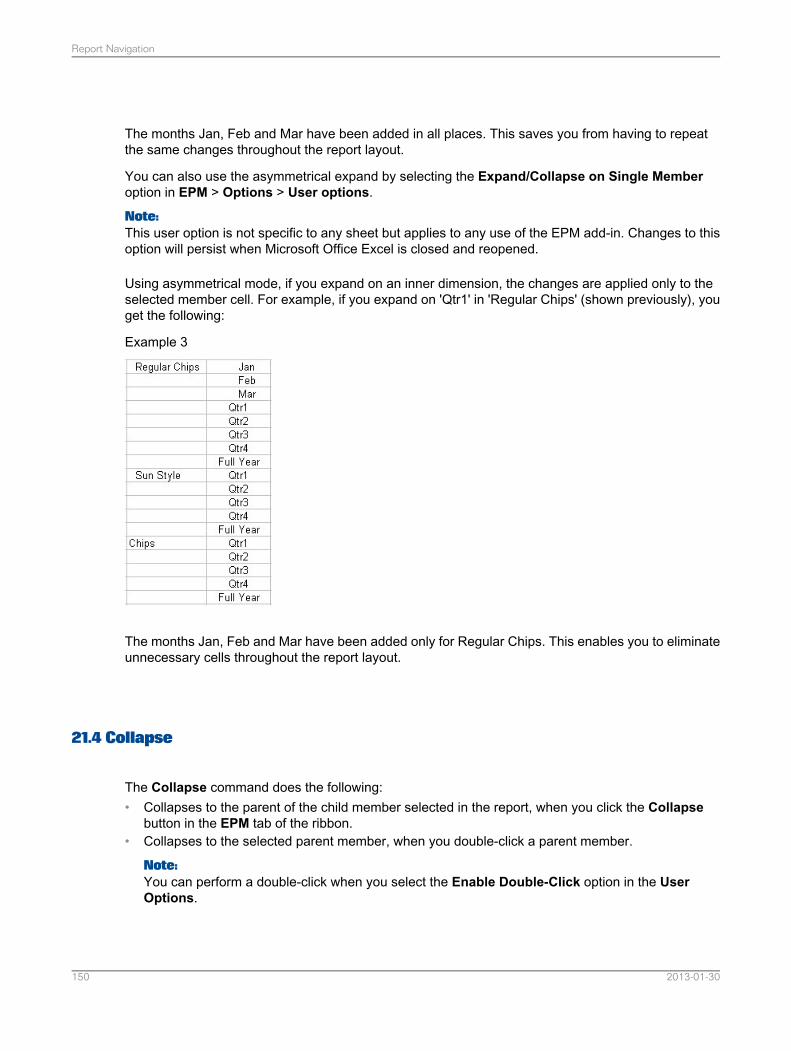
The months Jan, Feb and Mar have been added in all places. This saves you from having to repeatthe same changes throughout the report layout.
You can also use the asymmetrical expand by selecting the Expand/Collapse on Single Memberoption in EPM > Options > User options.
Note:This user option is not specific to any sheet but applies to any use of the EPM add-in. Changes to thisoption will persist when Microsoft Office Excel is closed and reopened.
Using asymmetrical mode, if you expand on an inner dimension, the changes are applied only to theselected member cell. For example, if you expand on 'Qtr1' in 'Regular Chips' (shown previously), youget the following:
Example 3
The months Jan, Feb and Mar have been added only for Regular Chips. This enables you to eliminateunnecessary cells throughout the report layout.
21.4 Collapse
The Collapse command does the following:• Collapses to the parent of the child member selected in the report, when you click the Collapse
button in the EPM tab of the ribbon.• Collapses to the selected parent member, when you double-click a parent member.
Note:You can perform a double-click when you select the Enable Double-Click option in the UserOptions.
2013-01-30150
Report Navigation
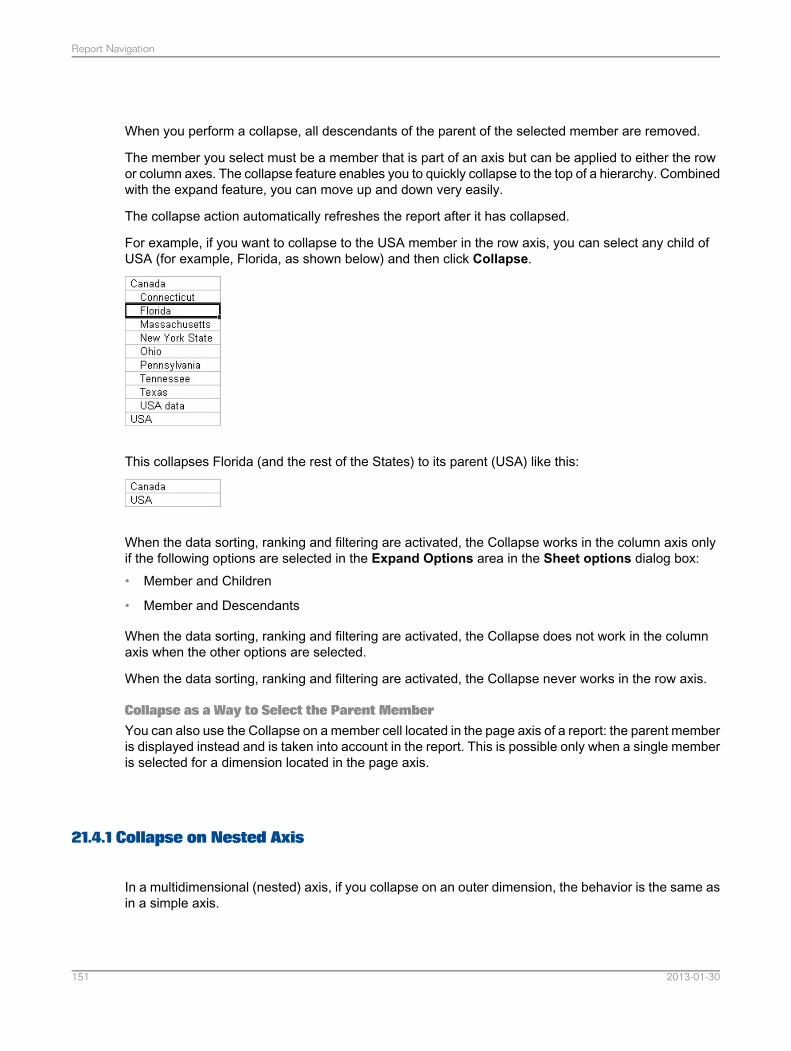
When you perform a collapse, all descendants of the parent of the selected member are removed.
The member you select must be a member that is part of an axis but can be applied to either the rowor column axes. The collapse feature enables you to quickly collapse to the top of a hierarchy. Combinedwith the expand feature, you can move up and down very easily.
The collapse action automatically refreshes the report after it has collapsed.
For example, if you want to collapse to the USA member in the row axis, you can select any child ofUSA (for example, Florida, as shown below) and then click Collapse.
This collapses Florida (and the rest of the States) to its parent (USA) like this:
When the data sorting, ranking and filtering are activated, the Collapse works in the column axis onlyif the following options are selected in the Expand Options area in the Sheet options dialog box:• Member and Children
• Member and Descendants
When the data sorting, ranking and filtering are activated, the Collapse does not work in the columnaxis when the other options are selected.
When the data sorting, ranking and filtering are activated, the Collapse never works in the row axis.
Collapse as a Way to Select the Parent MemberYou can also use the Collapse on a member cell located in the page axis of a report: the parent memberis displayed instead and is taken into account in the report. This is possible only when a single memberis selected for a dimension located in the page axis.
21.4.1 Collapse on Nested Axis
In a multidimensional (nested) axis, if you collapse on an outer dimension, the behavior is the same asin a simple axis.
2013-01-30151
Report Navigation
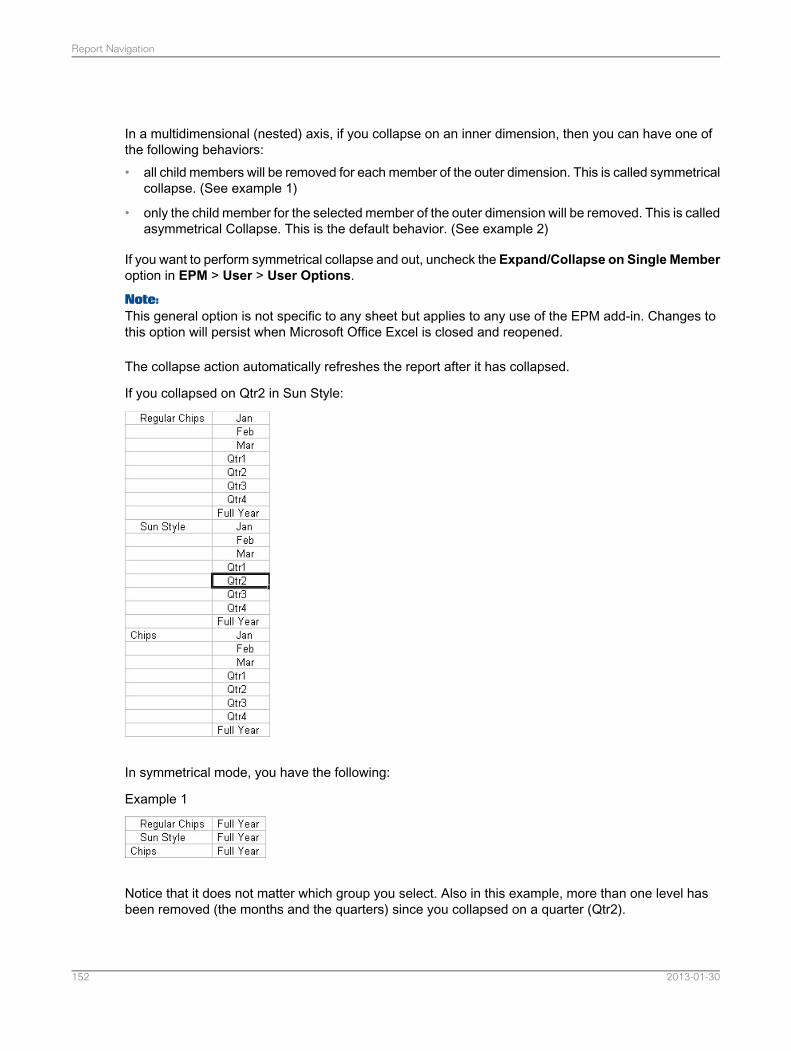
In a multidimensional (nested) axis, if you collapse on an inner dimension, then you can have one ofthe following behaviors:• all child members will be removed for each member of the outer dimension. This is called symmetrical
collapse. (See example 1)
• only the child member for the selected member of the outer dimension will be removed. This is calledasymmetrical Collapse. This is the default behavior. (See example 2)
If you want to perform symmetrical collapse and out, uncheck the Expand/Collapse on Single Memberoption in EPM > User > User Options.
Note:This general option is not specific to any sheet but applies to any use of the EPM add-in. Changes tothis option will persist when Microsoft Office Excel is closed and reopened.
The collapse action automatically refreshes the report after it has collapsed.
If you collapsed on Qtr2 in Sun Style:
In symmetrical mode, you have the following:
Example 1
Notice that it does not matter which group you select. Also in this example, more than one level hasbeen removed (the months and the quarters) since you collapsed on a quarter (Qtr2).
2013-01-30152
Report Navigation
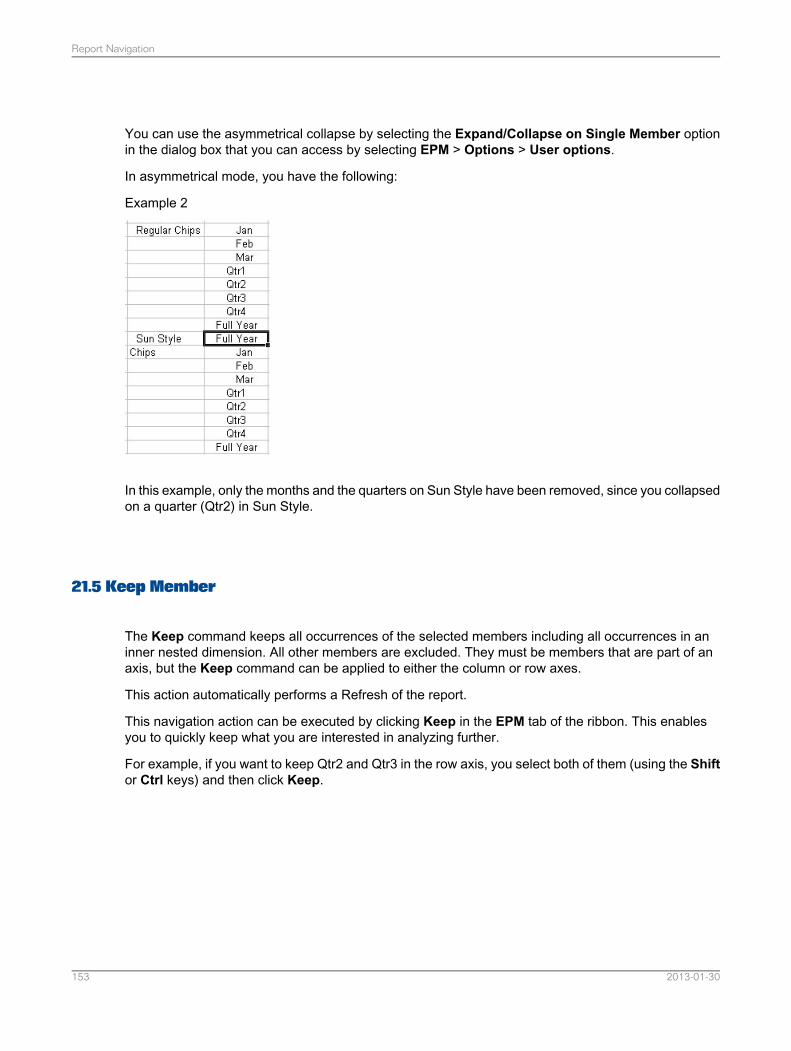
You can use the asymmetrical collapse by selecting the Expand/Collapse on Single Member optionin the dialog box that you can access by selecting EPM > Options > User options.
In asymmetrical mode, you have the following:
Example 2
In this example, only the months and the quarters on Sun Style have been removed, since you collapsedon a quarter (Qtr2) in Sun Style.
21.5 Keep Member
The Keep command keeps all occurrences of the selected members including all occurrences in aninner nested dimension. All other members are excluded. They must be members that are part of anaxis, but the Keep command can be applied to either the column or row axes.
This action automatically performs a Refresh of the report.
This navigation action can be executed by clicking Keep in the EPM tab of the ribbon. This enablesyou to quickly keep what you are interested in analyzing further.
For example, if you want to keep Qtr2 and Qtr3 in the row axis, you select both of them (using the Shiftor Ctrl keys) and then click Keep.
2013-01-30153
Report Navigation
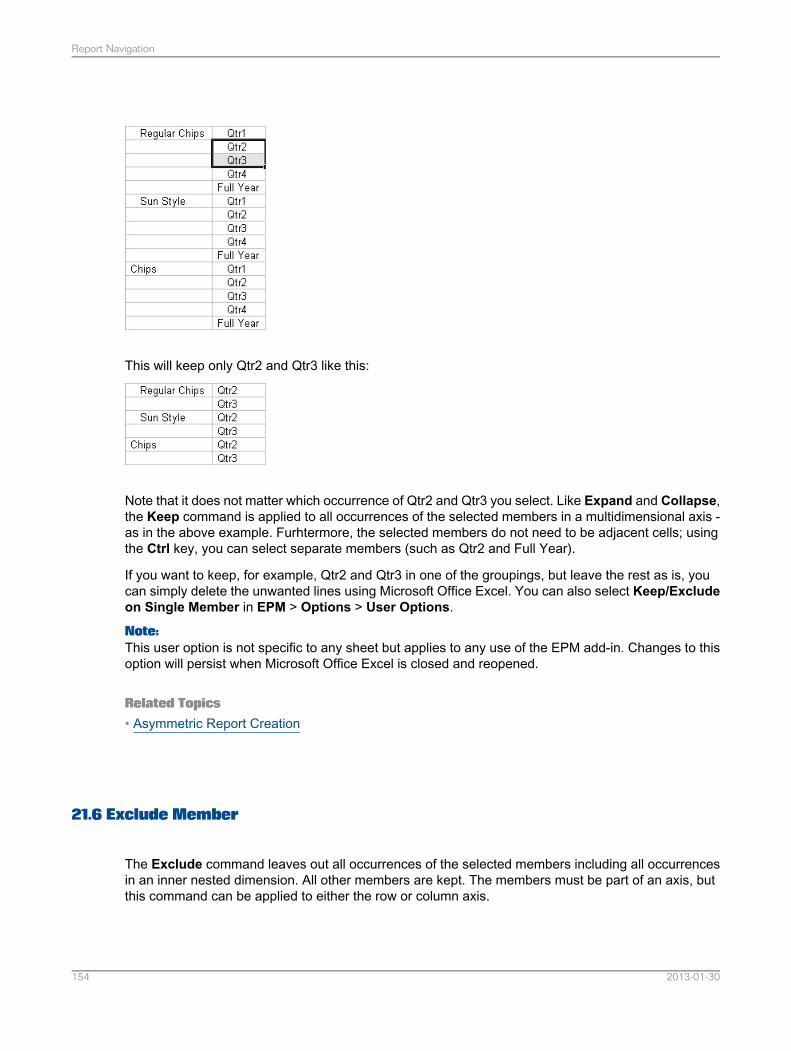
This will keep only Qtr2 and Qtr3 like this:
Note that it does not matter which occurrence of Qtr2 and Qtr3 you select. Like Expand and Collapse,the Keep command is applied to all occurrences of the selected members in a multidimensional axis -as in the above example. Furhtermore, the selected members do not need to be adjacent cells; usingthe Ctrl key, you can select separate members (such as Qtr2 and Full Year).
If you want to keep, for example, Qtr2 and Qtr3 in one of the groupings, but leave the rest as is, youcan simply delete the unwanted lines using Microsoft Office Excel. You can also select Keep/Excludeon Single Member in EPM > Options > User Options.
Note:This user option is not specific to any sheet but applies to any use of the EPM add-in. Changes to thisoption will persist when Microsoft Office Excel is closed and reopened.
Related Topics• Asymmetric Report Creation
21.6 Exclude Member
The Exclude command leaves out all occurrences of the selected members including all occurrencesin an inner nested dimension. All other members are kept. The members must be part of an axis, butthis command can be applied to either the row or column axis.
2013-01-30154
Report Navigation
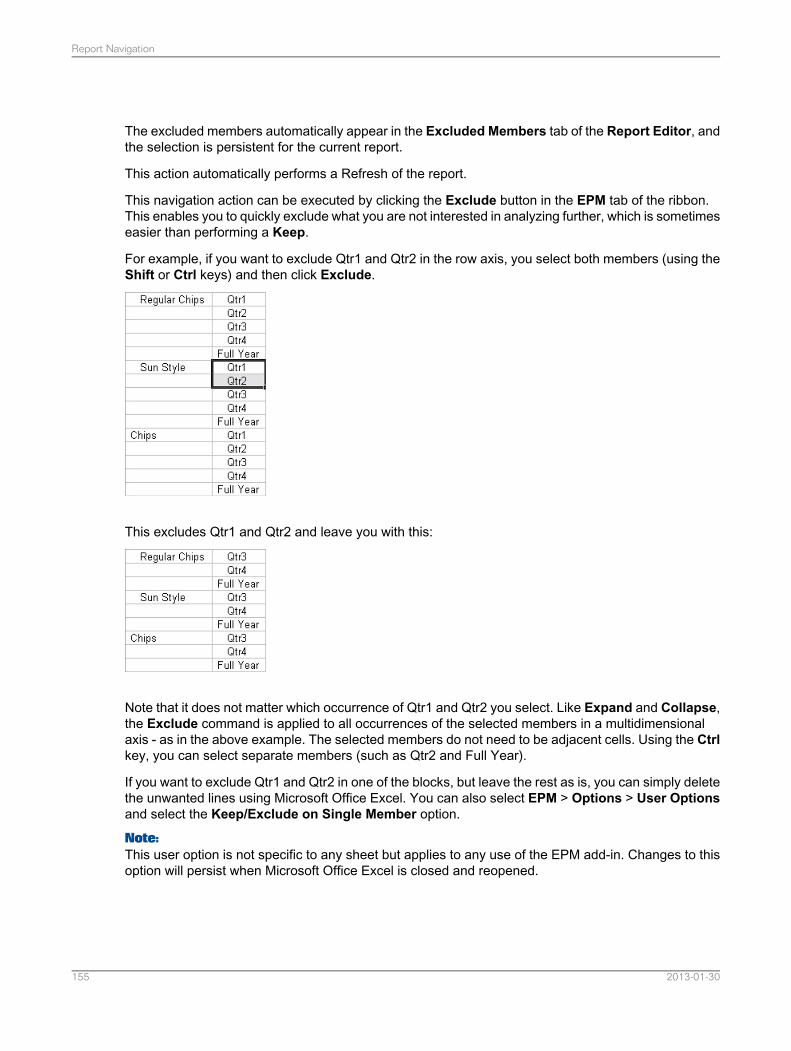
The excluded members automatically appear in the Excluded Members tab of the Report Editor, andthe selection is persistent for the current report.
This action automatically performs a Refresh of the report.
This navigation action can be executed by clicking the Exclude button in the EPM tab of the ribbon.This enables you to quickly exclude what you are not interested in analyzing further, which is sometimeseasier than performing a Keep.
For example, if you want to exclude Qtr1 and Qtr2 in the row axis, you select both members (using theShift or Ctrl keys) and then click Exclude.
This excludes Qtr1 and Qtr2 and leave you with this:
Note that it does not matter which occurrence of Qtr1 and Qtr2 you select. Like Expand and Collapse,the Exclude command is applied to all occurrences of the selected members in a multidimensionalaxis - as in the above example. The selected members do not need to be adjacent cells. Using the Ctrlkey, you can select separate members (such as Qtr2 and Full Year).
If you want to exclude Qtr1 and Qtr2 in one of the blocks, but leave the rest as is, you can simply deletethe unwanted lines using Microsoft Office Excel. You can also select EPM > Options > User Optionsand select the Keep/Exclude on Single Member option.
Note:This user option is not specific to any sheet but applies to any use of the EPM add-in. Changes to thisoption will persist when Microsoft Office Excel is closed and reopened.
2013-01-30155
Report Navigation
Related Topics• Asymmetric Report Creation• Excluding Members
21.7 Double-Click Actions
The double-click command allows you to control whether or not the EPM add-in assumes control overthe mouse double-click in Microsoft Office Excel. To enable double-click actions, select EnableDouble-Click in EPM > Options > User Options.
Note:This user option is not specific to any sheet but applies to any use of the EPM add-in. Changes to thisoption will persist when Microsoft Office Excel is closed and reopened.
If you are using other functionality or add-ins in Microsoft Office Excel that require the double-click thenyou should disable this.
However, if you enable double-click actions for the EPM add-in:• You will have quick access to three very useful features: expand, collapse and page axis selection.• You will be able to use the EPM functions that require double-click actions.
Related Topics• Expand• Collapse• Page Axis Dimension Members Modification using the Member Selector• EPM Functions
2013-01-30156
Report Navigation
Drill-Through
Applies to:Planning and Consolidation connections.
The drill-through feature enables you to view information on source data that make up the content ofa selected cell in a report in Microsoft Office Excel. Drill-through definitions are previously set up in thePlanning and Consolidation Administration view.
There are two types of drill-through: drill-through to URL and drill-through to table.
Drill-through to URLA drill-through to URL enables you to display information in a web browser, for any URL and specificparameters that have been specified in the Administration view. For example: a Planning andConsolidation web report; the URL to the SAP BusinessObjects Financial Information Managementserver (this particular case is called: Drill through to origin); a google page, a BEx report.
As soon as you are connected to a Planning and Consolidation model, if a drill-through to URL hasbeen defined in Planning and Consolidation Administration on this model, a command appears inEPM> Drill Through > Drill Through to URL. The command is named after the description entered inPlanning and Consolidation Administration.
To access the drill-through information, select a cell that belongs to the report, then select the commandfrom the ribbon. A web browser opens. The information displayed depends on the following items:• The URL that was previously specified in the Administration view.• The URL parameters that were previously specified in the Administration view.
Note:The URL and the URL parameters appear in the browser address bar.
• In some cases, the data cell that you selected in the report.
Note:If the cell you have selected in the worksheet is out of the report, an error message appears.
Example for a Google search on the account member description. The drill-through definition has beenset up as follows in the Administration view:• URL: http://www.google.com/search?• URL parameter 1: member description for the Account dimension. The member description will vary,
depending on the cell you select in the report.• URL parameter 2: 2010. The time period is hard-coded. Even if the report contains data on 2009,
the search is performed on 2010.
2013-01-30157
Drill-Through
In a report:• when you select a data cell for the Account member "Operating Costs", then select the drill-through
to URL command, the web browser opens and the results of the Google search on the"Operating+Costs+2010" terms are displayed.
• when you select a data cell for the Account member "Advertising Costs", then select the drill-throughto URL command, the web browser opens and the results of the Google search on the"Advertising+Costs+2010" terms are displayed.
Note:Even if the selected cell does not contain any data, the drill-through is performed.
Drill-through to tableApplies to:Planning and Consolidation, version for the Microsoft platform, connections.
A drill-through to table enables you to display information from external databases or the Journalsdatabase, for a specific query file and specific properties (called drillkeys) that have been specified ondimension members in the Administration view. You can display the table either in a web browser orin in a Microsoft Office Excel sheet.
When you connect to a Planning and Consolidation model, if a drill-through to table has been definedin Planning and Consolidation Administration on this model, two commands appear inEPM > DrillThrough > Drill Through to Table.
To access the drill-through information, select the appropriate cell. Then click one of the two commandsin the Drill Through to Table command in the ribbon. Depending on the link selected, the drill-throughinformation is displayed in a web browser or in another sheet of the current workbook. The informationdisplayed depends on:• The drillkey properties that have previously been specified in the Administration view. A drillkey is
defined for one or more members for a specific dimension.
Note:If several drillkeys have been defined on several dimensions, when you view the drill-throughinformation, a dialog box appears prompting you to select the dimension for which you want to viewthe information.
• The data cell that you have selected in the report.
Note:If the cell you have selected in the worksheet does not correspond to any member for which drillkeyshave been defined, a message appears, indicating that no drill-through information is available.
Example for viewing information from an external database on the Actual member of the Categorydimension. In the Administration view, the drillkey property has been added to the Actual member ofthe Category dimension, and the name of a query file has been specified.
In a report:• when you select a data cell for the Actual member, then select one of the drill-through to table
commands, the web browser or sheet opens and displays the table for Actual data.• when you select a data cell for the Budget member, then select one of the drill-through to table
commands, a message appears, indicating that no drill-through information is available.
2013-01-30158
Drill-Through

Note:For more information about drill-through setup, see the SAP BusinessObjects Planning and Consolidationhelp.
2013-01-30159
Drill-Through

2013-01-30160
Drill-Through
Quick Links
You can create quick links in a report to another report contained in another Microsoft Excel workbook,Microsoft Word document or Microsoft PowerPoint presentation. Quick links can be used to guide youthrough ad-hoc analysis.
You can define thee types of quick links, depending on your analysis needs:• Quick link defined on specific data. The linked workbook inherits the definition of the selected data
cell:• members at the cell intersection, meaning the member in the row axis and the member in the
column axis (or several members in the case of nested dimensions)• members in the context• members in the page axis
• Quick link defined on a specific member. The linked workbook inherits the definition of the membercell:• the selected member (or several members in the case of nested dimensions)• members in the context• members in the page axis
• Quick link defined on the current report. The linked workbook inherits the definition of the report:• members in the page axis• members in the context
Note:Since a link is always attached to a combination of members and not to a specific cell or cell range, ifyou move the members in the report, the links follow.
If you have defined a link to another workbook, the linked workbook opens in a new instance of MicrosoftExcel (the latest modification that you have made in the user context in the first workbook are takeninto account).
Precedence rules: a quick link defined on data takes precedence over a link defined on a member,which takes precedence over a link defined on the whole report.
The workbooks to be opened using the quick links can be located on:• the Planning and Consolidation server• another locationYou can select the workbook location in the User options dialog box. If you select the Planning andConsolidation Server option, when creating a quick link and specifying the workbook to be opened,the server file selection dialog box opens. If you select the Local option, when creating a quick link andspecifying the workbook to be opened, the standard file selection dialog box opens.
2013-01-30161
Quick Links
Symbols with default color-coding differentiate quick links defined on specific data and quick linksdefined on a specific member. You can change the colors in the User options dialog box.
You can hide the quick link symbols by clicking the Show Link Symbols button.
Note:
• When the symbols are hidden, the quick links are not active and therefore cannot be clicked on.• After clicking the Show Link Symbols button, you must perform a refresh.
You can open a linked workbook by clicking a quick link symbol or by clicking the link that appears inthe EPM pane. The link that appears in the EPM pane depends on the selected cell in the report sincethe precedence rules apply.
23.1 Creating Quick Links
1. Depending on your analysis needs, select a data cell, a member cell or any cell in your report andclick Quick Links in the ribbon, then select one of the following commands: Add Cell Link, AddMember Link or Add Report Link.
Note:You can also right-click on a cell and select the apropriate command from the EPM menu.
The file selection dialog box opens.
Note:In the User options dialog box, if you have selected the Planning and Consolidation Serveroption, the server file selection dialog box opens.
2. Select the workbook to which you want to link.If theQuick Links >ShowLink Symbols command is activated, the following symbols are displayed:• For a data link, the symbol — red by default — appears in the selected cell.• For a member link, the symbol — blue by default — appears in the cell of the selected member.
Note:If the Quick Links > Show Link Symbols command is not activated, select it and perform a refreshso that the link symbols are displayed in the report.
23.2 Deleting Quick Links
• Depending on the type of link you want to delete, select a data cell, a member cell or any cell in yourreport and click Quick Links, then Delete Data Link, Delete Member Link or Delete Report Link.
2013-01-30162
Quick Links
Custom Members
Applies to:Local and SAP BusinessObjects Enterprise connections.
Caution:Creating custom members may lower system performance.
You can create members for calculations on a specific sheet/connection pair. These members arecalled "custom members".
Custom members are not stored in the cube/model, they are created only for a sheet/connection andcan be shared with other users by sending the sheet.
Custom members have the same behavior as any other member on the sheet.
Custom members enable you to create simple calculations such as differences or relative periods. Theyalso enable you to create MDX queries.
You can either create a custom member in the dedicated dialog box or convert a local member into acustom member.• Custom member creation. Custom members are manually created in the Custom Member Editor
dialog box, which provides all MDX functions. When you insert a function, the whole syntax isprovided. You just need to insert the appropriate parameters inside the quotation marks. You canuse a button to insert dimension members. Auto-completion enables you to insert functions,dimensions, hierarchies and dimension members.• Color coding. Reading formulas is made easier with color coding. MDX functions, dimension
members and punctuation characters are displayed in different colors.• Auto-completion.
• For MDX functions: enter the first character of a function, then enterCrtl + Space. A contextualmenu automatically appears, displaying the list of MDX functions.
• For dimensions, hierarchies and dimension members: enter [. A contextual menu automaticallyappears, displaying the list of elements available, depending on the location in the formula.
Note:A tooltip displays the name of a member used in a formula.
Restriction:When connected to an SAP NetWeaver BW cube, the following custom member features are notsupported in the Expression area of theCustomMember Editor dialog box: auto-completion, colorcoding and tooltip that displays the name of a member used in a formula.
• Custom members converted from a local member. To convert a local member into a custom member,right-click on the local member in the report and select EPM > Convert to Custom Member.
2013-01-30163
Custom Members
Tip:Each time you select several dimension members for a page axis dimension, the total of the membersis calculated. If you often use a specific selection of members for a page axis dimension and if youwant to reuse it in other reports for the same sheet/connection pair, you can create a custom member.
Not all local members can be converted into custom members. The following functions and operatorsare supported:• +, -, *, /• MIN, MAX, MEDIAN• COUNT• SUM, AVERAGE• abs• >, <, =• AND, OR• IF, ISBLANK
Note:If you change the connection of a report, the EPM add-in merges all of the custom members (from theprevious and the new connection). If two custom members have the same name, the custom memberof the previous connection is deleted.
Once created, a custom member behaves like any other member. It can be displayed in the sheet byselecting it along with other members in the Member Selector dialog box, or by entering it completelyor partially in a cell (if the Member Recognition is activated, the member is recognized).
A custom member can be deleted, but it can also be deactivated and then reactivated.
Note:Limitations:• You cannot create a local member based on a custom member.• Custom members are not displayed for selection in the EPM Context pane.
Related Topics• Member Entry Using the Member Selector• Local Members
24.1 Creating custom members
1. Select EPM > Custom Members > Manage Custom Members.
The EPM - Custom Member Manager dialog box appears.
2. Choose how you want to display the sheet/connection pairs by clicking the Display by Sheet orDisplay by Connection button.
3. Select the sheet/connection pair for which you want to create the custom member.
2013-01-30164
Custom Members
4. Click the Add button.
The Custom Member Editor dialog box appears.
5. In the Name field, enter a name for the custom member, such as it will appear in the sheet.6. Click the Choose Dimension button.
The Dimension Selector dialog box opens.
7. Select the dimension for which you want to create the custom member.8. Click the OK button.9. In the Custom Member Editor dialog box, in the Expression field, enter the expression that will
perform the calculations you want.
To insert a function, drag and drop an MDX function from the MDX Functions section to theExpression section.
Tip:To display all the MDX functions, check the Show all functions option.
To insert a dimension member inside parameter quotation marks, select the parameter, then clickthe Insert Member button.
To insert functions, dimensions, hierarchies and dimension members, use the auto-completionfunction by entering specific characters. See Custom Members.
10. Click the Check Syntax button to check if the expression is correct.
Tip:To delete the expression, click the Clear Expression button.
11. Click the OK button.
Related Topics• Custom Members
24.2 Custom Members Order
When you create more than one custom member, it is very important that you order them according tothe calculations order you want.
You can define the order you want by using the arrow buttons on the right-hand side of the CustomMember Manager dialog box, which you can access by selecting EPM >CustomMembers >ManageCustom Members.
2013-01-30165
Custom Members
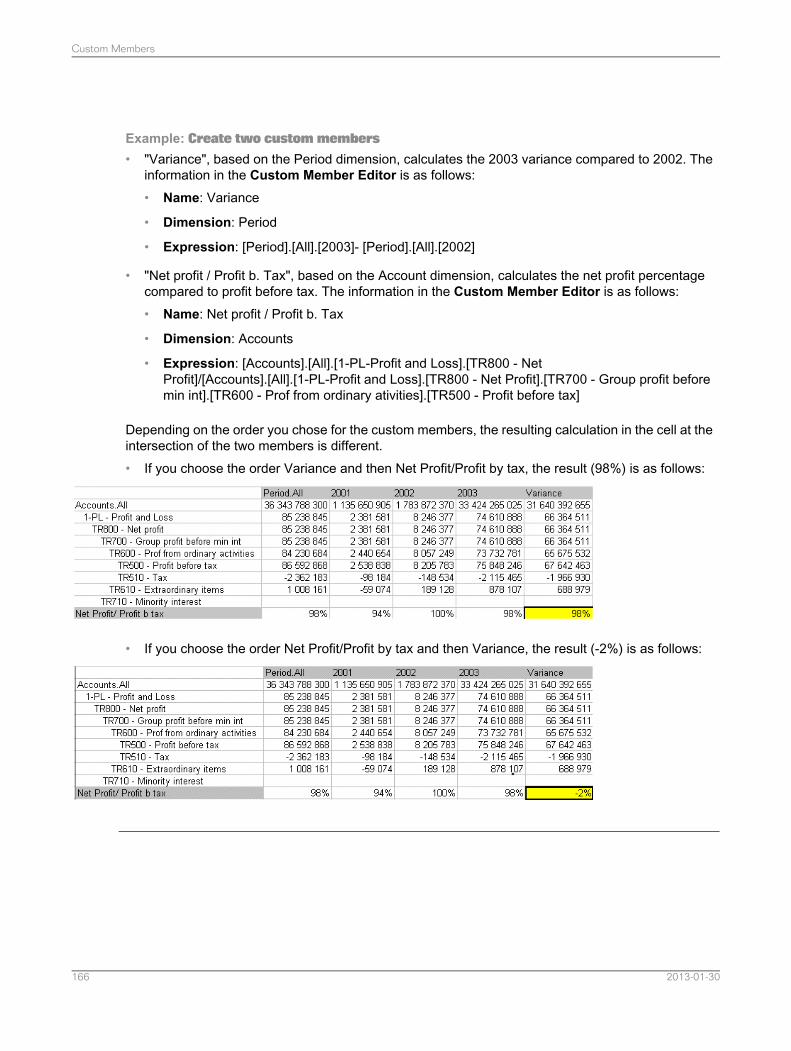
Example: Create two custom members
• "Variance", based on the Period dimension, calculates the 2003 variance compared to 2002. Theinformation in the Custom Member Editor is as follows:• Name: Variance
• Dimension: Period
• Expression: [Period].[All].[2003]- [Period].[All].[2002]
• "Net profit / Profit b. Tax", based on the Account dimension, calculates the net profit percentagecompared to profit before tax. The information in the Custom Member Editor is as follows:• Name: Net profit / Profit b. Tax
• Dimension: Accounts
• Expression: [Accounts].[All].[1-PL-Profit and Loss].[TR800 - NetProfit]/[Accounts].[All].[1-PL-Profit and Loss].[TR800 - Net Profit].[TR700 - Group profit beforemin int].[TR600 - Prof from ordinary ativities].[TR500 - Profit before tax]
Depending on the order you chose for the custom members, the resulting calculation in the cell at theintersection of the two members is different.• If you choose the order Variance and then Net Profit/Profit by tax, the result (98%) is as follows:
• If you choose the order Net Profit/Profit by tax and then Variance, the result (-2%) is as follows:
2013-01-30166
Custom Members
24.3 Modifying Custom Members
1. Select EPM > Custom Members > Manage Custom Members.
The EPM - Custom Member Manager dialog box appears.
2. Choose how you want to display the sheet/connection pairs by clicking the Display by Sheet orDisplay by Connection button.
3. Select the sheet/connection pair for which you want to modify the custom member.4. Select the custom member you want to modify.5. Click the Edit button.
The Custom Member Editor dialog box appears.
6. Make the changes you want.7. Click the OK button.
24.4 Enabling or Disabling all the Custom Members Defined for a Sheet/Connection
1. Select EPM > Custom Members > Manage Custom Members .
The EPM - Custom Member Manager dialog box appears.
2. Choose how you want to display the sheet/connection pairs by clicking the Display by Sheet orDisplay by Connection button.
3. Select the sheet/connection pair for which you want to enable or disable the custom members.4. Choose one of the following:
• To enable custom members, click the Enable All button. You will be able to select the custommembers in the reports.
• To disable custom members, click the Disable All button. You will not be able to select thedisabled custom members in the reports. But you may want to enable them again later on.
5. Click the OK button.
24.5 Deleting Custom Members
1. Select EPM > Custom Members > Manage Custom Members .The EPM - Custom Member Manager dialog box appears.
2013-01-30167
Custom Members
2. Choose how you want to display the sheet/connection pairs by clicking the Display by Sheet orDisplay by Connection button.
3. Select the sheet/connection pair for which you want to delete the custom members.4. Choose one of the following:
• To delete one specific custom member, select it, then click the Delete button.
• To delete all the custom members, click the Delete All button.
5. Click the OK button.
24.6 Custom Members Export
Custom members can be exported and stored in .xml files.
Once the custom members are stored in a file, they can be imported in other reports. You can alsore-use the formula for other purposes.
A dedicated wizard enables you to export custom members.The export can be performed for severalEPM sheets and connections at the same time.• For convenience, the connections, sheets and custom members are displayed in a tree view.
• You can choose the way you want to display them: by sheet or by connection.
• You can use the expand and collapse features.
• You can also display the formulas defined in the custom members, in addition to the custom membernames.
24.6.1 Exporting Custom Members
1. Select EPM > Custom Members > Export Custom Members....The EPM - Custom Member Export Wizard appears.
2. Choose how you want to display the sheet/connection pairs by clicking the Display by Sheet orDisplay by Connection button.
Tip:
• When the dialog box displays a certain number of items, for convenience, you can use the menudisplaying a + icon, and expand all the items, collapse to the sheet level or collapse to theconnection level.
• You can display the formulas defined in the custom members by clicking the ShowDetails button.
3. Check the boxes corresponding to the custom members you want to export.
2013-01-30168
Custom Members
Tip:To select all the members at the same time, click the Select All button.
4. Click the Next button.5. In the File Name area, enter the path and the name of the file to which you want to export the custom
members.6. Click the Finish button.
A message appears, informing you whether or not the export was successful.
7. Click the OK button.
24.7 Custom Members Import
You can import custom members that are stored in an XML file.
Once you have selected from the file the custom members you want to import, you must choose thesheet/connection pairs where you want to import the custom members.
A dedicated wizard enables you to import custom members.
The Source Custom Members screen of the wizard is the same as for the custom members export.In this screen, you choose the custom members you want to import.• For convenience, the connections, sheets and custom members are displayed in a tree view.
• You can choose the way you want to display them: by sheet or by connection.
• You can use the expand and collapse features.
• You can also display the formulas defined in the custom members, in addition to the custom membernames.
In the next screen of the wizard, Target Sheets/Connections, you choose the sheet/connection pairswhere you want to import the custom members.• If the custom members already exist, you can choose to replace them by the one you are importing.
To do this, select the Replace custom members if exist option.
In the next screen of the wizard, Syntax Check, you can see if there are errors on any of the custommembers.
Custom members with errors are indicated by a red cross. They are not imported.
Tip:To display only custom members with errors, click the Show only errors button.
2013-01-30169
Custom Members
24.7.1 Importing Custom Members
1. SelectEPM > Custom Members > Import Custom Members....The EPM - Custom Member Import Wizard appears.
2. In the File Name area, click the button and select the path and the file containing the custom membersyou want to import.
3. Click the Next button.The next screen of the wizard displays the custom members contained in the file.
4. Choose how you want to display the sheet/connection pairs by clicking the Display by Sheet orDisplay by Connection button.
Tip:
• When the dialog box displays a certain number of items, for convenience, you can use the menudisplaying a + icon, and expand all the items, collapse to the sheet level or collapse to theconnection level.
• You can display the formulas defined in the custom members by clicking the ShowDetails button.
5. Check the boxes corresponding to the custom members you want to import.
Tip:To select all the members at the same time, click the Select All button.
6. Click the Next button.The next screen of the wizard displays the sheet/connection pairs where you can import the selectedcustom members.
7. Check the boxes corresponding to the sheet/connection pairs where you can import the selectedcustom members.
8. If the custom members already exist, you can choose to replace them by the one you are importingby selecting the Replace custom members if exist option.
9. Click the Next button.
Tip:To only display custom members with errors, click the Show only errors button.
The next screen of the wizard displays the status of the custom members. The ones with errors areindicated by a red cross. They will not be imported.
10. Click the Finish button.A message appears, informing you whether or not the import was successful.
11. Click the OK button.
2013-01-30170
Custom Members
Flash Objects
By inserting Flash objects (files with the .swf extension), you can perform a powerful and graphicalanalysis of your reports and what-if analysis.
You can design a dashboard and export it in Flash format, in SAP BusinessObjects Dashboard Design.You can then insert the Flash object in a report in Microsoft Office Excel, Word or PowerPoint, usingthe EPM add-in.
25.1 Flash Object Creation, using EPM Connector
Applies to:Local or SAP BusinessObjects Enterprise connections.
You can design a dashboard and export it to Flash format in SAP BusinessObjects Dashboard Design,using EPM Connector.
EPM connector is a component of the EPM add-in. It is installed as an add-in to SAP BusinessObjectsDashboard Design.
Note:
• When you open the EPM add-in via SAP BusinessObjects Dashboard Design, the two followingEPM add-in interface areas are not displayed: the EPM Context bar and the EPM pane. Even thoughthe user options Display EPM Context Bar and Display EPM Pane are selected, the bar and thepane remain hidden.
• To design a dashboard, you must be familiar with the Dashboard Design application and functionality.
To create a dashboard and export it to Flash format, follow these steps:• If you want to retrieve data, create a report using the EPM add-in.• Create and configure a connection using EPM Connector. You specify the type of data, insert the
appropriate components in the dashboard and link the data to the dashboard components.• You can export the dashboard to Flash.
Note:For more information about exporting a dashboard to Flash, see the Dashboard Design user guide
Related Topics• Flash Object Insertion
2013-01-30171
Flash Objects
25.1.1 Connections and Operations
ConnectionsEach operation is specified in a connection. All the connections are created on the EPM Connectorconnection type, in the Data Manager dialog box of the Dashboard Design application. The DataManager is a centralized location where you can add and configure all external data sources.
You can retrieve data and metadata from any data source listed below into a Dashboard Design toolset:• SSAS cubes created with SAP BusinessObjects Financial Consolidation, cube designer.• SAP NetWeaver BW InfoCubes created with SAP BusinessObjects Financial Consolidation, cube
designer.• SAP BusinessObjects Planning and Consolidation, version for SAP NetWeaver, models.• SAP BusinessObjects Planning and Consolidation, version for the Microsoft platform, models.
You can also enter and save data using a Dashboard Design toolset, for the following:• SAP BusinessObjects Profitability and Cost Management models.• SAP BusinessObjects Planning and Consolidation, version for SAP NetWeaver, models.
Note:To be able to enter data on a model, you must select the Use as Source of Data for ExternalApplications option for a model in the Administration view.
• SAP BusinessObjects Planning and Consolidation, version for the Microsoft platform, models.
Creating a connection consists of the following steps:• Entering a name for the connection.• Selecting the application to which you want to connect.• Entering the host name.
Depending on the operation type you choose, you configure the connection with different information.
OperationsYou can perform the following operations and combine them:• Retrieve data, using a report created with the EPM add-in.• Retrieve the list of databases/environments/InfoAreas for a specific data source.• Retrieve the list of cubes/models/InfoProviders for a specific database/environment/InfoArea.• Retrieve the list of dimensions for a specific cube/model/InfoProvider.• Retrieve members/characteristic values for a specific dimension.
The following operation types are only available for SAP BusinessObjects Planning and Consolidation,version for the Microsoft platform and SAP BusinessObjects Planning and Consolidation, version forSAP NetWeaver:• Input and save data.• Retrieve Business Process Flows.
2013-01-30172
Flash Objects
Note:This operation is only available for SAP BusinessObjects Planning and Consolidation, version forthe Microsoft platform.
• Retrieve the list of context members.• Retrieve text contained in a text file from the Documents view.• Retrieve property values for dimension members.
Note:Some terms differ and are listed and separated by the / character (see above), depending on the source.
Features common to the operations• When a dropdown list contains a long list of items, you can enter the beginning of the item you want
to select, then press Enter. The list is filtered and displays only the items beginning with the charactersyou have just entered.
• The dropdown lists identified by a hand icon enable you to select or automatically retrieve items:• Bind enables you to select a cell in the sheet.• Retrieve automatically retrieves a list of items available for selection, depending on other filled
in areas. For example, in the Retrieve Dimension Members operation, if the Cube area isalready filled in, you can select Retrieve in the Member area and all the available dimensionsand members specific to this cube are retrieved and available for selection.
• In the Ouput section, you select two refresh options:• Refesh on Load, to automatically refesh the data before refreshing all the Dashboard Design
components.• Refresh Every [number] Second, to set an automatic refresh frequency.
Some behaviors and areas are common to all the operations.
25.1.2 Creating a Connection in Dashboard Design
1. Select Data > Connections.The Data Manager dialog box opens.
2. Click Add and select EPM Connector from the list.The connection created is called by default "Connection [number]".
3. Select the "Connection [number]" created in the connection list.4. In the Name area, enter a name for the connection you are creating.5. Select the application you want to connect to by selecting it from the Application list.6. In the home icon area, enter the URL to the server:
• For SSAS cubes, enter the URL to the Data Pump server. The syntax is: http://hostname/datapumpwebdirectory/msmdpump.dll
• For SAP BW InfoCubes, enter the URL to the XMLA provider.
2013-01-30173
Flash Objects
• For Planning and Consolidation models, enter the URL to the server. The syntax is:http://server:port/ or https://server:port/
Tip:If you often use the same server URL, you can enter the URL in the data sheet. Therefore, in thehome icon area, instead of entering the URL, you can click the cell selector button and select thecell in the data sheet. The cell reference automatically appears in the home icon area.
7. To display the list of all the OLAP server names available (all data sources), click Retrieve in theData Source dropdown list. If prompted, enter the user ID and the password to the server and clickOK.All the available data sources are automatically displayed in the Data Source list. Other elementscan be retrieved, depending on the operation type you choose.
8. Configure the connection, depending on the operation type you choose, as described further in thisdocumentation.
25.1.3 Retrieve Data Using a Report
You can create a connection to retrieve data using a report created with the EPM add-in.
Step 1 - Creating a reportBefore creating the connection, you first need to create a report using the EPM add-in.
In a cell of the sheet that contains the report, enter the following function: =GetReportDefinition()
This function enables you to link the default report and the connection. This function identifies the wholereport using XML and MDX languages.
Any report identified by the =GetReportDefinition() function must use a local or an SAP BusinessObjectsEnterprise connection.
Note:The =GetReportDefinition() function without anything inside the parentheses, identifies the defaultreport. If you create another report on the same sheet, you must re-enter the function, including thename of the report inside the parentheses and with quotation marks, as in this example where the reportis named sales2008: =GetReportDefinition("sales2008"). If the sheet contains several reports:• If the name of the report you have entered is not correct, the default report is taken into account.• If you do not enter the name of the report between the "", the default report is taken into account.
Step 2 - Creating the connectionYou can create the connection, using the Dashboard Design Data Manager dialog box, see Creatinga Connection in Dashboard Design.
Select the EPM Report operation.
2013-01-30174
Flash Objects
Then, use the Report Definition cell selector button to select the cell in which you have entered the=GetReportDefinition() function. All the following items for the report are automatically recognized: thename of the report, the database, the cube, members in the context, the page axis, the row axis andthe column axis.
Note:The Static Filters section includes the page axis members and the context members.
You can also select other members, including members based on properties, to filter the data to beretrieved. To do so, use the Dynamic Filters cell selector and select a range of cells in the sheet. Therange must contain one column containing the IDs and x rows. For example:
[Category].[H1].[ACTUAL]
[Category].[H1].[BUDGET]
Tip:You can use the Retrieve Dimension Members operation to retrieve members for a dimension in twocolumns, one for the names and one for the unique IDs. To select additional members for the EPMReport operation, using the Dynamic Filters cell selector, you can select the column displaying theIDs of members.
If needed, you can also select a cell using the cell selector button in the Message area of the Outputsection, so that any error message will be displayed.
Step 3 - Using Dashboard Design componentsOnce you have configured the operation, use the components that you think are the most appropriateto the final Flash object.
Related Topics• Creating a Connection in Dashboard Design• Retrieve Dimension Members/Characteristic Values
25.1.4 Retrieve Databases/Environments/InfoAreas
You can create a connection to retrieve the databases/environments/InfoAreas for a specific OLAPdata source.
Step 1- Creating the connectionTo create the connection, using the Dashboard Design Data Manager dialog box, see Creating aConnection in Dashboard Design.
Depending on the application you have selected, select the Retrieve Databases or RetrieveEnvironments or Retrieve InfoAreas operation.
2013-01-30175
Flash Objects
Select the data source for which you want to display the databases/environments/InfoAreas.
In the Result area of the Output section, use the cell selector button to select a destination cell range.It is recommended that you select two columns (the first one for the names and the second one for theunique IDs) and a large number of rows, so that all the databases/environments/InfoAreas will bedisplayed.
Tip:Apply a color to the selected cells so that you can easily identify them afterwards.
If needed, you can also select a cell using the cell selector button in the Message area, so that anyerror messages will be displayed.
Step 2 - Using Dashboard Design componentsNote:In this section, the recommended components are only suggestions. Use the components that youthink are the most appropriate to the final Flash object.
Once you have configured the operation, it is recommended that you place the appropriate componentsin the canvas area as follows:• Grid. In the Properties panel on the right, click the Data cell selector button to select the cells in the
spreadsheet that will contain the databases/environments/InfoAreas.• Input Text Area (if you have selected a cell for messages to be displayed). In the Properties panel
on the right, click the Link to Cell cell selector button to select the cell in the spreadsheet that willcontain the error message text.
• Connection Refresh Button. In the Properties panel on the right, check the box next to the connectionyou have created, so that the connection is refreshed when clicking the Refresh button.
Related Topics• Creating a Connection in Dashboard Design
25.1.5 Retrieve Cubes/Models/InfoProviders
You can create a connection to retrieve the cubes/models/InfoProviders for a specificdatabase/environment/InfoArea.
Step 1- Creating the connectionTo create the connection using the Dashboard Design Data Manager dialog box, see Creating aConnection in Dashboard Design.
Depending on the application you have selected, select the Retrieve Cubes or Retrieve Models orRetrieve InfoProviders operation.
Select the data source, then the database/environment/InfoArea for which you want to display thecubes/models/InfoProviders.
2013-01-30176
Flash Objects
In the Result area of the Output section, use the cell selector button to select a destination cell range.It is recommended that you select two columns (the first one for the names and the second one for theunique IDs) and a large number of rows, so that all the cubes/models/InfoProviders will be displayed.
Tip:Apply a color to the selected cells so that you can easily identify them.
If needed, you can also select a cell using the cell selector button in the Message area, so that anyerror messages will be displayed.
Step 2 - Using Dashboard Design componentsNote:In this section, the recommended components are only suggestions. Use the components that youthink are the most appropriate to the final Flash object.
Once you have configured the operation, it is recommended that you place the appropriate componentsin the canvas area as follows:• Grid. In the Properties panel on the right, click the Data cell selector button to select the cells in the
spreadsheet that will contain the cubes/models/InfoProviders.• Input Text Area (if you have selected a cell for messages to be displayed). In the Properties panel
on the right, click the Link to Cell cell selector button to select the cell in the spreadsheet that willcontain the error message text.
• Connection Refresh Button. In the Properties panel on the right, check the box next to the EPMconnection you have created, so that the connection is refreshed when clicking the Refresh button.
25.1.6 Retrieve Dimensions
You can create a connection to retrieve the dimensions for a specific cube/model/InfoProvider.
Step 1- Creating the connectionTo create the connection using the Dashboard Design Data Manager dialog box, see Creating aConnection in Dashboard Design.
Select the Retrieve Dimensions operation.
Select the data source, then the database/environment/InfoArea, then the cube for which you want todisplay the dimensions.
In the Result area of the Output section, use the cell selector button to select a destination cell range.It is recommended that you select two columns (the first one for the names and the second one for theunique IDs) and a large number of rows, so that all the dimensions will be displayed.
Tip:Apply a color to the selected cells so that you can easily identify them.
If needed, you can also select a cell using the cell selector button in the Message area, so that anyerror messages will be displayed.
2013-01-30177
Flash Objects
Step 2 - Using Dashboard Design componentsNote:In this section, the recommended components are only suggestions. Use the components that youthink are the most appropriate to the final Flash object.
Once you have configured the operation, it is recommended that you place the appropriate componentsin the canvas area as follows:• Grid. In the Properties panel on the right, click the Data cell selector button to select the cells in the
spreadsheet that will contain the dimensions.• Connection Refresh Button. In the Properties panel on the right, check the box next to the EPM
connection you have created, so that the connection is refreshed when clicking the Refresh button.
Related Topics• Creating a Connection in Dashboard Design
25.1.7 Retrieve Dimension Members/Characteristic Values
You can create a connection to retrieve the members/characteristic values for a specific dimension.
Step 1- Creating the connectionTo create the connection using the Dashboard Design Data Manager dialog box, see Creating aConnection in Dashboard Design.
Depending on the application you have selected, select the Retrieve Dimensions or RetrieveCharacteristic Values operation.
Select the data source, then the database/environment/InfoArea, then the cube/model/InfoProvider forwhich you want to display the dimension members/characteristic values.
Then, specify a member/characteristic value by selecting a cell or select Retrieve from the Memberdropdown list. A screen opens. Click the cube/model/InfoProvider, then the dimension, then the hierarchyfor which you want to display the members/characteristic values, then double-click amember/characteristic value. The member/characteristic value is displayed in theMember area. Selectthe option corresponding to the members you want to retrieve: only the member selected, the memberselected and its ascendants, the member selected and its children, or the member selected and itssiblings.
In the Result area of the Output section, use the cell selector button to select a destination cell range.It is recommended that you select two columns (the first one for the names and the second one for theunique IDs) and a large number of rows, so that all the dimension members/characteristic values willbe displayed.
Tip:Apply a color to the selected cells so that you can easily identify them.
2013-01-30178
Flash Objects
If needed, you can also select a cell using the cell selector button in the Message area, so that anyerror messages will be displayed.
Step 2 - Using Dashboard Design componentsNote:In this section, the recommended components are only suggestions. Use the components that youthink are the most appropriate to the final Flash object.
Once you have configured the Display dimension members operation type, it is recommended that youplace the appropriate components in the canvas area as follows:• Grid. In the Properties panel on the right, click the Data cell selector button to select the cells in the
spreadsheet that will contain the dimension members/characteristic values.• Connection Refresh Button. In the Properties panel on the right, check the box next to the EPM
connection you have created, so that the connection is refreshed when clicking the Refresh button.
Related Topics• Creating a Connection in Dashboard Design
25.1.8 Input Data
Applies to:SAP BusinessObjects Planning and Consolidation, version for the Microsoft platform and SAPBusinessObjects Planning and Consolidation, version for SAP NetWeaver.
You can create a connection to enter data on specific members.
Step 1- Creating the connectionTo create the connection using the Dashboard Design Data Manager dialog box, see Creating aConnection in Dashboard Design.
Select the Input Data operation.
Select the data source, then the environment, then the model for which you want to enter data.
In the Cell Definition area:• Static definition: use the menu and select Retrieve to retrieve the the list of dimensions. Click the
ellipsis button and select a member for each dimension. The member you select must a basemember, not a node. To select a member, double-click on it.
• Dynamic definition: use the menu and select Bind to reference a cell range in the worksheet. Therange you reference must contain four columns that include: the dimension name, the dimensionunique ID, the member name, the member unique ID. You can retrieve dimensions and dimensionmembers by using the appropriate operations. See Retrieve Dimensions and Retrieve DimensionMembers/Characteristic Values .
In the Cell Value area:
2013-01-30179
Flash Objects
• You can retrieve the data that exists on the server for the specified members. To do so, selectRetrieve from the menu.
• You can reference another cell from which the data will be taken. To do so, select Bind from themenu.
• You can enter the data you want for the specified members. It will then be saved to the server.
In the Result area of the Output section, use the cell selector button to select a destination cell range.Select one cell.
Tip:Apply a color to the selected cells so that you can easily identify them.
If needed, you can also select a cell using the cell selector button in the Message area, so that anyerror messages will be displayed.
Step 2 - Using Dashboard Design componentsNote:In this section, the recommended components are only suggestions. Use the components that youthink are the most appropriate to the final Flash object.
Once you have configured the operation type, it is recommended that you place the appropriatecomponents in the canvas area as follows:• Grid. In the Properties panel on the right, click the Data cell selector button to select the cells in the
spreadsheet that will contain the page axis dimensions.• Input Text. In the Properties panel on the right, click the Link to Cell cell selector button and select
the first cell of the data grid.• Connection Refresh Button. In the Properties panel on the right, check the box next to the EPM
connection you have created, so that the data will be sent when clicking the Refresh button.
Note:
• All the data is saved to the server, even if no changes are made.• Do not check theRefresh On Load option of the Connection Refresh button because unexpected
data might be saved.• In the Label area, "Refresh" appears by default. You can rename the button to "Save" for example.
25.1.9 Retrieve Business Process Flows
Applies to:SAP BusinessObjects Planning and Consolidation, version for the Microsoft platform.
You can create a connection in order to retrieve the Business Process Flows.
Step 1- Creating the connectionTo create the connection using the Dashboard Design Data Manager dialog box, see Creating aConnection in Dashboard Design.
2013-01-30180
Flash Objects
Select the Retrieve Business Process Flows operation.
Select the data source, then the environment, then the model, then the BPF model and the context forwhich you want to retrieve the business process flows.
Tip:You can bind the context area with the cells resulting from the Retrieve Context operation.
Select the Business Process Flow properties you want to display by checking the boxes in the Detailsarea.
In the Result area of the Output section, use the cell selector button to select a destination cell range.It is recommended that you select as many columns as the number of details checked, and a largenumber of rows so that all the Business Process Flows will be displayed .
Tip:Apply a color to the selected cells so that you can easily identify them.
If needed, you can also select a cell using the cell selector button in the Message area, so that anyerror messages will be displayed.
Step 2 - Using Dashboard Design componentsNote:In this section, the recommended components are only suggestions. Use the components that youthink are the most appropriate to the final Flash object.
Once you have configured the operation type, it is recommended that you place the appropriatecomponents in the canvas area as follows:• Grid. In the Properties panel on the right, click the Data cell selector button to select the cells in the
spreadsheet that will contain the Business Process Flows.• Connection Refresh Button. In the Properties panel on the right, check the box next to the EPM
connection you have created, so that the connection is refreshed when clicking the Refresh button.
25.1.10 Retrieve Context
Applies to:SAP BusinessObjects Planning and Consolidation, version for the Microsoft platform and SAPBusinessObjects Planning and Consolidation, version for SAP NetWeaver.
You can create a connection to retrieve the web context members for a specific model.
Step 1- Creating the connectionTo create the connection using the Dashboard Design Data Manager dialog box, see Creating aConnection in Dashboard Design.
Select the Retrieve Context operation.
2013-01-30181
Flash Objects
Select the data source, then the environment, then the model for which you want to retrieve the contextmembers.
In the Result area of the Output section, use the cell selector button to select a destination cell range.It is recommended that you select three columns (for the dimension name, the member name, themember unique ID) and a large number of rows, so that all the members will be retrieved. The membersthat are retrieved are the members defined as default members.
Tip:Apply a color to the selected cells so that you can easily identify them.
If needed, you can also select a cell using the cell selector button in the Message area, so that anyerror messages will be displayed.
Step 2 - Using Dashboard Design componentsNote:In this section, the recommended components are only suggestions. Use the components that youthink are the most appropriate to the final Flash object.
Once you have configured the operation type, it is recommended that you place the appropriatecomponents in the canvas area as follows:• Grid. In the Properties panel on the right, click the Data cell selector button to select the cells in the
spreadsheet that will contain the context members.• Input Text Area (if you have selected a cell for messages to be displayed). In the Properties panel
on the right, click the Link to Cell cell selector button to select the cell in the spreadsheet that willcontain the error message text.
• Connection Refresh Button. In the Properties panel on the right, check the box next to the EPMconnection you have created, so that the connection is refreshed when clicking the Refresh button.
25.1.11 Retrieve Text from Documents View
Applies to:SAP BusinessObjects Planning and Consolidation, version for the Microsoft platform and SAPBusinessObjects Planning and Consolidation, version for SAP NetWeaver.
You can create a connection to retrieve the text contained in a file stored in the Documents view.
Note:
• The file must have the .txt extension.• For SAP BusinessObjects Planning and Consolidation, version for SAP NetWeaver, you can only
display Unicode type text (UTF-8).
Step 1- Creating the connectionTo create the connection using the Dashboard Design Data Manager dialog box, see Creating aConnection in Dashboard Design.
2013-01-30182
Flash Objects
Select the Retrieve Text From Documents View operation.
Select the data source, then the environment, then the model for which you want to retrieve text.
Click in the File area: the list of files for the model is displayed. Select a file.
In the Result area of the Output section, use the cell selector button to select a destination cell range.Select one cell.
Tip:Apply a color to the selected cells so that you can easily identify them.
If needed, you can also select a cell using the cell selector button in the Message area, so that anyerror messages will be displayed.
Step 2 - Using Dashboard Design componentsNote:In this section, the recommended components are only suggestions. Use the components that youthink are the most appropriate to the final Flash object.
Once you have configured the operation type, it is recommended that you place the appropriatecomponent in the canvas area as follows:• Input Text Area. In the Properties panel on the right, click the Link to Cell cell selector button to
select the cell in the spreadsheet that will contain the text of the selected file.• Connection Refresh Button. In the Properties panel on the right, check the box next to the EPM
connection you have created, so that the connection is refreshed when clicking the Refresh button.
25.1.12 Retrieve Members Property Values
Applies to:SAP BusinessObjects Planning and Consolidation, version for the Microsoft platform and SAPBusinessObjects Planning and Consolidation, version for SAP NetWeaver.
You can create a connection to retrieve the values of a specific property for the members of a specificdimension.
For example, you want to retrieve the members that are calculated and the members for which you canenter data, using the CALC property.
Creating the connectionTo create the connection using the Dashboard Design Data Manager dialog box, see Creating aConnection in Dashboard Design.
Select the Retrieve Members Property Values operation.
Select the data source, then the environment, then the model for which you want to retrieve propertyvalues.
2013-01-30183
Flash Objects
Select a dimension, a property and one or more members for the selected dimension. To select members,click in the Members area. In the list of members, double-click on a member: the member is displayedin the bottom part of the window. If you want to remove a member from the selection, double-click onthe member in the bottom part of the window.
In the Result area of the Output section, use the cell selector button to select a destination cell range.It is recommended that you select three columns (for the member unique ID, the member name, theproperty value), and as many rows as the number of members you have selected.
Tip:Apply a color to the selected cells so that you can easily identify them.
If needed, you can also select a cell using the cell selector button in the Message area, so that anyerror messages will be displayed.
25.2 Flash Object Insertion
You can insert a Flash object in a report. The report in which you have created the Flash object andthe report in which you want to insert the Flash object should have a similar structure.
An inserted Flash object takes into account the active connection and the context dimensions. Forexample, if you change a dimension member in the context, the Flash object is updated accordingly inthe report.
To manage Flash objects, select EPM > More > Flash Objects. In the Flash Object Manager, you canperform the following actions:• Insert a Flash object. Click Add and select the Flash object you want to insert in your report. You
can also enter a name for the object.• Rename the Flash object by pressing F2.• Remove the selected Flash object from the sheet by clicking Remove.• Remove all the Flash objects from the sheet by clicking Remove all.
You can move a Flash object in the report and resize it to make it bigger or smaller. To do so, displaythe Developer tab and activate the Design Mode in Microsoft Office Excel or Microsoft Office Word(the design mode is native in Microsoft Office PowerPoint). You can move or resize the Flash objectas needed.
Note:The following functions are not supported: nested dimensions in a row or column axis, data sorting,data ranking and data filtering.
Related Topics• Flash Object Creation, using EPM Connector
2013-01-30184
Flash Objects
Dynamic Charts
Microsoft Office Excel enables you to insert charts. A chart automatically reflects the changes in thereport's data range.
Note:
• When adding a blank row or column, the Legend entries (Series) of the chart are not automaticallyrefreshed.
• Only two-axis charts are automatically refreshed.
To dynamically refresh the charts when performing actions in the report, such as expand or collapse,select the Refresh Charts Automatically in Options > User Options.
2013-01-30185
Dynamic Charts

2013-01-30186
Dynamic Charts
Dynamic Formatting
You can define specific dynamic formatting in a template to apply to sheets or reports.
Dynamic formatting is defined in dedicated sheets. A default template is provided with the add-in. Youcan create additional template sheets by copying the default sheet as you would copy a standardMicrosoft Office Excel worksheet.
Tip:As a dynamic formatting sheet is a standard Microsoft Office Excel sheet, you can copy or move thesheet to another Microsoft Office Excel workbook.
On each template, you can define a specific format (for example: font, color, size) for levels of a hierarchy,types of members, odd/even rows or columns and page axis dimensions.
27.1 Dynamic Formatting Template Definition
Dynamic formatting is defined in a dedicated sheet. A specific format (such as font, color, or size) canbe defined for levels of a hierarchy, types of members, odd/even rows or columns and page axisdimensions.
Precedence rules• If you check more than one formatting section, the format settings in lower sections override the
ones in upper sections in case of conflicts (for example: inconsistency between a member formatand a level format).
• Inside each section, if you check several Apply checkboxes, the format settings are applied fromthe lowest area to the upper area.
Common actions to several formatting sections• Checkboxes. Checkboxes enable you to specify the formatting sections (for example: Hierarchy
Level Formatting section) or formatting items inside a section (for example: Base Level Format)that you want to apply to the reports.
• Priority to column or row format. These options enable you to specify which one of the definedformats for rows or columns will be applied first in case of conflicts. When you click the Priority toColumn option, the Column section is displayed first in the formatting section and the Row sectionis displayed in second position in the formatting section and the precedence rules apply.
• Formatting. You can define the format you want by using the standard Microsoft Office Excel cellformatting features in the 1000 and Label cells. By default, all the format settings are applied and
2013-01-30187
Dynamic Formatting
ALL is displayed in the Use column. You can then specify which settings of the defined format youwant to apply, or define additional settings. To do so, directly enter the format settings in a Use cell,using a specific syntax - for example: (FontBold = Y) | (FontSize = 18), or double-click a Use celland define the format settings in the dialog box that opens. In the dialog box, all the format itemsthat you can override are displayed in red. Select one of them, click the Override Selected Itemoption, enter the format and click Override. To apply no formatting, leave the Use cell blank, ordouble-click the Use cell and select None in the dialog box.
Note:If you have specified the Frame setting and if you have selected the Refresh only Expanded andInserted Members option in the User Options, the frame setting may not be properly applied to therows or colums that are displayed consequent to a member expansion or a member insertion. Formore information about this option, see Expand or Member Entry Using the Insert Members DialogBox.
• Cell Protection: you can lock and unlock cells on which you define formats. To do so, right-click oneor more cells and select EPM > Lock Selected Cells or EPM > Unlock Selected Cells. As areminder of the standard Microsoft Excel behavior, locking cells will have no effect until you protectthe worksheet.
Example:You want to be able to enter data only in the inputable member cells and not in the other membercells of a report. Since the cells are unlocked by default in the EPM dynamic formatting sheet, youdo not need to unlock the inputable member cells. You want to lock the cells for the other types ofmembers. Therefore, use EPM > Lock Selected Cells in the other member sections of the EPMdynamic formatting sheet, such as the Calculated Member Default Format section. Then, protectthe worksheet. You will be able to enter data only in the inputable member cells. For more informationon how to protect a worksheet, see Worksheet Protection.
Hierarchy Level Formatting sectionThis section enables you to define the formatting of levels of hierarchies.
Note:In this particular section, the precedence rule is as follows: Base Level Format, then Formatting onSpecific Level, then Default Format.
Actions specific to the Hierarchy Level Formatting section:• Apply Format to option: If a row or column axis contains more than one dimension, you can specify
to which dimension you want the defined format to be applied; the inner dimension being the lastdimension, the outer dimension being the first dimension in the axis.
• In the Default Format area, you can define a default format for hierarchy levels.• In the Base Level Format area, you can define a specific format for base level members, meaning
members that are not nodes and not calculated.• You can define formatting on specific levels. To add a new level, click Add New Level. To remove
a level, click Remove Last Level.• By default, Level 1, Level 2 and so on are the hierarchy levels just like they are defined in the
structure of the source connection. The corresponding option is Structure Levels.• However, you can define format settings for the levels that are displayed in the reports. To do
so, use the Relative Levels option. For example, Country is the second level of the geographicalhierarchy in the structure, but it is the first level that is displayed in a report.
2013-01-30188
Dynamic Formatting
Note:When you select the Relative Levels option, the Start formatting from the lowest leveldisplayed option is displayed. This option enables you to invert the level order; the lowest levelis displayed in first position.
Dimension Member/Property Formatting sectionThis section enables you to define and apply the formatting defined to the following types of members:• Custom members, calculated members, local members, blank members when using any connection.• Inputable members and changed members, when using a Planning and Consolidation connection.
Note:An inputable member is a member on which you can enter data. A changed member is an inputablemember on which you have already entered data but have not yet saved.
You can also define specific formatting:• on a specific member, custom member, blank member, property or local member: To do so, click
the Add Member/Property cell and make your selection in the Select Member/Property dialogbox.
Note:In the Local/BlankMember Selection tab, the name you must enter is the name of the local memberas it appears in the Local Members tab of the Report Editor, or, for a grouping local member, asyou have named it in the Member Sorting & Grouping area of the Member Selector.
• on blank members: To do so, click the Add Member/Property cell, then click the Local/BlankMember Selection tab and select Blank Members.
• on a multiple item selection, that is a combination of any of these items: members, properties, localmembers. To do so, click the Add Member/Property cell and make your selection in the SelectMember/Property dialog box. In the first three tabs, the Add to Multiple Selection button enablesyou to add a member, a property or a local member (depending on the tab you are in) to the multipleselection. The item is automatically added to the Multiple Selection Overview tab.
Caution:
• To validate your multiple selection, you must select the Multiple Selection Overview tab andclick OK. If you click OK in one of the three other tabs, the multiple selection is not taken intoaccount.
• If you have selected the Refresh only Expanded and Inserted Members option in the UserOptions, not all the settings may be applied to the multiple selection. For more information onthis option, see Expand or Member Entry Using the Insert Members Dialog Box.
Tip:To remove an item from the selection in the Multiple Selection Overview tab, right-click in the taband select Remove Selected Item(s).
Example:You want to define a specific format for any data at the intersection of Actual and 2010 Total. Clickthe Add Member/Property. In the Member Selection tab, select Actual and click Add to MultipleSelection. Then, select 2010 Total and click Add to Multiple Selection. Select the Multiple
2013-01-30189
Dynamic Formatting
Selection Overview tab and click OK. A new row is added to the formatting sheet, displaying:Actual||2010 Total. Define the format you want for the data.
To remove a member or property from the formatting sheet, click on the Remove cell.
Row and Column Banding sectionThis section enables you to choose one or two alternating formats that will be applied to data or headersor both. The chosen format in Odd Formatting and Even Formatting will alternate in rows or columns.
Note:If you have defined formatting settings only for the odd rows/columns or only for the even rows/columns,and if you have selected the Refresh only Expanded and Inserted Members option in the UserOptions, the formatting settings may not be properly applied to the rows or colums that are displayedconsequently to a member expansion or a member insertion. For more information on this option, seeExpand or Member Entry Using the Insert Members Dialog Box.
Page Axis Formatting sectionThis section enables you to define the formatting for all the dimensions of the page axis. You can alsodefine formatting settings on specific dimensions that are part of the page axis, using theAddDimensionbutton.
27.1.1 Defining a Dynamic Formatting Template
1. Select EPM > View Formats.The dynamic formatting sheet appears. The sheet is named EPMFormattingSheet.
2. Define the format you want.
Related Topics• Dynamic Formatting Template Definition
27.2 Dynamic Formatting Applied to a Worksheet or to a Specific Report
You can apply a dynamic formatting template to:• the current worksheet. The chosen dynamic formatting template applies by default to all the reports
created in the worksheet.• a specific report. If a default template has been selected for the worksheet, you can however choose
another template to apply to a specific report. If a sheet contains several reports, you can apply adynamic formatting template by report.
2013-01-30190
Dynamic Formatting
If you modify a dynamic format which has already been applied to a specific worksheet, you must refreshthe report to which you applied the dynamic formatting.
If the reports to which you want to apply dynamic formatting, already contain formatting applied by anadd-in other than the EPM add-in, you can decide whether to keep the existing formatting and overrideit with the dynamic formatting, or to clear the existing format and only apply the dynamic formatting.
27.2.1 Applying a Default Dynamic Formatting Template to the Worksheet
1. SelectEPM > Options > Sheet Options.The Sheet Options dialog box opens.
2. Select the Formatting tab.3. Select the Apply Dynamic Formatting option.4. Select the template you want to apply to the worksheet from the Default Formatting Sheet list.5. If the reports to which you want to apply dynamic formatting, already contain formatting applied by
an add-in other than the EPM add-in, do one of the following:• To keep the existing formatting and override it with the dynamic formatting, deselect the Clear
report format before applying dynamic formatting option.• To clear the existing format so that only the EPM dynamic formatting is applied, select the Clear
report format before applying dynamic formatting option.
6. Click OK.
By default, the selected template applies to all reports in the worksheet.
To display the formatting on your report, refresh the report.
27.2.2 Applying a Default Dynamic Formatting Template to a report
1. Select a cell in the report to which you want to apply a dynamic formatting template.2. SelectEPM > Edit Report.
The Report Editor opens.
3. Select the Options tab.If a default dynamic formatting template has been selected for the whole workbook in the SheetOptions, then the Apply Dynamic Formatting option is already checked.
4. Select the template you want to apply.5. If the report to which you want to apply dynamic formatting, already contains formatting applied by
an add-in other than the EPM add-in, do one of the following actions:• To keep the existing formatting and override it with the dynamic formatting, deselect the Clear
report format before applying dynamic formatting option.
2013-01-30191
Dynamic Formatting

• To clear the existing format so that only the EPM dynamic formatting is applied, select the Clearreport format before applying dynamic formatting option.
6. Click OK.
2013-01-30192
Dynamic Formatting
Workbook Sheet Automatic Generation
You can automatically generate several reports in several sheets within the current workbook, basedon an existing report.
This feature helps you to quickly create several worksheets inside a single workbook, based on aspecific report but including variable dimension members, and it saves you from having to create severalreports for different dimension members.
Note:Each sheet is automatically named with the dimension member combinations.
To automatically generate several sheets in the current workbook, follow these steps:1. Create a report.2. For each dimension of the report, leave the context members selected by default, do not select other
members.3. SelectEPM > Report Actions > Worksheet Generation. The Worksheet Generation dialog box
opens.4. Select the dimension, then clickSelect Members and select the members you want for the dimension.
If needed, repeat the selection for the other dimensions.
Note:The number of selected members for all dimensions is displayed. Each time you select an additionalmember, the number is updated.
Each automatically created sheet displays the initial report, but with different dimension members: themembers you have selected. The dimensions for which you have selected members are automaticallylocked in the context bar on each worksheet. You can then unlock the dimension. For more informationabout the context lock, see Context.
Example:Creating as many reports as quarters:
For the year 2009, you want to create one sheet per quarter. Create a report that meets your needs.SelectEPM >Report Actions >Worksheet Generation. In the dialog box that opens, select the Perioddimension, then select the four quarters and click OK. Four sheets are automatically created in thecurrent workbook. Each one contains the same report, except for the period members. The first sheetcontains the report displaying data for quarter 1 of 2009; the second sheet contains the report displayingdata for quarter 2 of 2009, and so on.
The resulting workbook can contain different worksheets, depending on theRemove EPMWorksheetsBefore Generation user option (Options > User Options > Others):• If the Remove EPM Worksheets Before Generation option is selected:
2013-01-30193
Workbook Sheet Automatic Generation

The workbook will contain the worksheets resulting from the generation, the dynamic formattingsheet (if any) and any other Microsoft Excel sheets (if any).
•
• The workbook will not contain any of the EPM worksheets existing in the workbook before youlaunch the generation, including the current worksheet.
• If the Remove EPM Worksheets Before Generation option is not selected, the workbook willcontain all the worksheets existing in the workbook before you launch the generation and all theworksheets resulting from the generation.
2013-01-30194
Workbook Sheet Automatic Generation
Offline Mode
You can make the current workbook an offline workbook so that any user can access it, even userswho do not have the EPM add-in installed. An offline workbook behaves like a standard Microsoft OfficeExcel workbook.
To switch to offline mode, select EPM > Offline Mode. The context bar and the pane are automaticallyhidden. You can make your workbook available to any user.• By default, the worksheets of an offline workbook are automatically protected. This is to prevent
important elements of the reports from being changed, moved or deleted. For more informationabout worksheet protection, see Worksheet Protection.
• If you do not want the worksheets to be protected, select the Do not Protect Workbook option inthe Others tab of the User Options before switching to offline mode. All the EPM member formulasare converted into text. The reports can be modified by using standard Microsoft Excel features.When switching back to online mode, the modifications are not kept and the initial reports aredisplayed.
Note:The offline feature is used in an automatic way when distributing reports.
Related Topics• Workbook Distribution
2013-01-30195
Offline Mode

2013-01-30196
Offline Mode
Worksheet Protection
To prevent a user from changing, moving, or deleting important elements of the report, you can protectthe current worksheet or the whole workbook. You can also protect certain elements of the currentworksheet or workbook, with a password.
Note:
• Even if a worksheet or workbook is protected, you may be able to insert certain members in thereport, provided that member insertion filters have been defined. For more information on how toinsert members, see Member Entry Using the Insert Members Dialog Box.
• If you protect a worksheet containing reports in which a user will enter data, you can lock certainand unlock other cells of the report. For more information, see Dynamic Formatting TemplateDefinition.
To protect the sheet, the workbook or only certain elements, and to enter a password, select EPM >Options > Sheet Options, then select the Protection tab.
Note:For details about the elements you can protect, see the Microsoft Excel documentation.
Tip:Choose a password that is easy to remember, because if you lose the password, you can no longeraccess the protected worksheet or workbook.
Note:When you make a workbook an offline workbook, its worksheets are automatically protected. For moreinformation about offline mode, see Offline Mode.
To unprotect a worksheet or worbook, select EPM > Options > Sheet Options. A message appearsin which you can enter the protection password. In the Protection tab of the Sheet Options, select NoProtection.
Note:The Microsoft Excel sheet protection always overrides the EPM add-in sheet protection. You canunprotect a sheet using the Microsoft Excel feature or the EPM add-in feature. However, to protect asheet, you must use the EPM add-in feature.
2013-01-30197
Worksheet Protection

2013-01-30198
Worksheet Protection
Collaboration
There are different ways to make the reports available to other users:• You can publish all the reports as they are on two web portals:
• The BI launch pad, which is the web portal of SAP BusinessObjects Enterprise.• The SAP BusinessObjects Planning and Consolidation Documents view.
• You can publish automatically generated books based on a selection of variable members. At onetime, you can export all the books to PDF format or print them. You can schedule the publication.
• You can distribute automatically generated reports based on a selection of variable members. Atone time, you can make all the workbooks containing reports available to users by sending all theworkbooks by email or by storing the workbooks at a specific location that users can access. Youcan schedule the distribution.
31.1 Report Publication to a Web Portal
You can publish all the reports of a workbook on two web portals:• The BI launch pad, which is the web portal of SAP BusinessObjects Enterprise.• The SAP BusinessObjects Planning and Consolidation Documents view.
Publish Reports to BI launch padApplies to:SAP BusinessObjects Enterprise connections.
The published reports will be available on the BI launch pad to users who have the necessary accessrights.
Note:You cannot publish reports on the BI launch pad:• If you are using the EPM add-in in standalone mode.• If you do not have the Publish right set in the Central Management Console for the EPM connection
manager. For more information about rights, see the SAP BusinessObjects Financial ConsolidationSecurity Guide.
To publish a workbook containing reports, select EPM > Portal Publication > Publish to BI launchpad. The dialog box that opens displays the folders that exist in the BI launch pad. The four buttons onthe left part of the dialog box enable you to perform the following actions:• Refresh the BI launch pad folder tree.
2013-01-30199
Collaboration
• Create a new folder in the BI launch pad.• Rename an existing folder in the BI launch pad.• Delete a folder from the BI launch pad.
You can search for a specific folder by selecting a search criteria from the dropdown list and by clickingthe Search button.
The Description field enables you to enter a description for the workbook. The description appearsalong with the workbook in the BI launch pad.
Note:In the BI launch pad, you can add your comments on each workbook in the dedicated Discussionsarea. All the comments are historized.
Publish reports to Planning and Consolidation Documents ViewApplies to:Planning and Consolidation connections.
To publish a workbook containing reports, selectEPM > Portal Publication > Open Planning andConsolidation Documents View. The Planning and Consolidation web client opens, displaying theDocuments view. You can then publish a report by using the web client dedicated features. For moreinformation, see the SAP BusinessObjects Planning and Consolidation Help.
31.2 Publication and Distribution Connection
Both publication and distribution are performed on one specific connection.
By default, the connection on which publication and distribution actions are performed is the connectionthat is currently displayed in the Active Connection of the EPM pane.
If you want to perform publication and distribution actions on a different connection than the activeconnection, choose one of the following actions:• Select EPM > Book Publication > Change Connection or EPM > Distribution > Change
Connection, then select the connection in the Change Connection dialog box.• Or select the connection from the Active Connection dropdown list of the EPM pane.
Note:The connection selected from the Active Connection dropdown list is automatically taken intoaccount in the Change Connection dialog box.
31.2.1 Book Publication
Using a template, you can generate books (meaning static reports), based on:
2013-01-30200
Collaboration
• one or more reports,• one or more variable members for one or more dimensions.
Each automatically created book displays the initial report(s), but with a different dimension member(or a combination of dimension members) of the dimension(s) for which variable dimension membershave been defined.
At one time, you can export all the generated books to PDF format, or you can print them. You canlaunch the book publication or you can schedule it (for example, every Friday at 11:00 PM).
31.2.1.1 Book Publication Template
Before launching a book publication, you must create a book publication template in which you specifythe information you want to include in the books, including specific settings on dimension members.
Note:Choose carefully the names you enter for the publication template, the sections and the report workbookdescriptions, as they will appear as the names of the folders if you then choose to generate the booksin PDF format. Take into account the following:• You should not use the following characters as they are changed into the _ character in the folders
and book names: \ / : * ? " < > | & + = ( ) { } [ ] $ %• You should not enter a space at the beginning or the end of the names.• A section name and a workbook description must be unique within a template. Otherwise, you cannot
save the template.
Book Publication Template for a Local or SAP BusinessObjets Enterprise ConnectionCreating or modifying a template consists of the following steps:• Enter a name for the template.• Section definition. A template can include one or more sections. A section is a part of the template.
Each section includes at least a selection of variable dimension members. When launching thereport generation, you will be able to select the sections of the template you want to take into account.
Note:The tab of a section has no name until you enter it in the Section Name area.
• Enter a name for the section. The entered name is displayed on the section tab.• Report workbook selection. Select the workbook containing the reports you want to generate
using the current template.
Note:The workbooks you select must contain reports that have the same connection as the template.
• Enter a description for the workbook you have selected.• Dimension member selection:
• One or more dimensions for which one or several members are variables. For a specificdimension, the members selected as variables will override the members if the dimension is
2013-01-30201
Collaboration
displayed in the page axis or in the context of the report. One report is created for each memberselected.
• One or more dimensions for which only one member is fixed. This is optional. A fixed memberoverrides any other member of the same dimension that is part of the report in the context orthe page axis. For example, if you select the period 2009 as a fixed member and the period2008 is displayed in the page axis of the report, 2009 will be taken into account.
Note:
• A suppressed member behaves exactly like a fixed member, but this feature remains forhistorical reasons.
• You cannot select fixed, suppressed and variable members for one dimension. All of themare mutually exclusive.
In the published reports, the members will be displayed according to the following precedencerule:1. members in the row and column axes.2. members selected as fixed members or as variable members in the publication template.3. members in the page axis.4. members in the context.
Note:The template is saved as an .xlt or .xltx file, by default to the following local folder: C:\Documentsand Settings\[UserWindows]\My Documents\PC_LOC\[login]\books\[appset]\[application]\[team or localTeam]\WebExcel\ManageBook
Other actions available on a template include:• You can open an existing template, modify it and save it with a different name by selectingEPM >
Book Publication > Open Template.
Note:If a report workbook specified in the template does not contain valid reports, the template opens butthe report workbook area is empty. If you want to save your template, you need to specify anotherworkbook that contains valid reports.
• You can create a new section or a section based on an existing one. You can also delete a sectionfrom the template. These actions are available in the template dialog box, under the section tab.
Book Publication Template for a Planning and Consolidation connectionCreating or modifying a template consists of the following steps:• Enter a name for the template.• When modifying a template, if you intend to generate the reports in PDF format, you can select an
option in the Add/Replace dropdown list. These options enable you to replace or add sections to atemplate based on the selected variable members. You can choose:• Add, to add new books (with different member combinations) to the current template. This means
that new PDFs are created and the former ones remain. This option applies to all the sectionsof the template.
2013-01-30202
Collaboration
• Replace, to replace books of the existing template with new books. This means that if a specifiedmember combination is found, it overwrites the existing section. Therefore, the existing PDF fileswith the initial variable member selection are deleted on the server and replaced by the onesgenerated from the latest variable member selection. This option applies to all the sections ofthe template.
Note:When you create a new template, you must select Replace.
• Specify by Section. Select this option if you want to specify the Add or Replace settings bysection, and not for the whole template.
• The Variable Time field is displayed. If no member is selected for the Time dimension in a sectionof the template as a variable or fixed member, the time member selected here applies to all thesections of the template and is hard-coded. If you select a Time member in a section, it overridesthe member selected in the Variable Time field for this section.
• Section definition. A template can include one or several sections. A section is a part of the template.Each section includes at least a selection of variable dimension members. When launching thereport generation, you will be able to select the sections of the template you want to take into account.
Note:The tab of a section has no name until you enter it in the Section Name area.
• Enter a name for the section. The entered name is displayed on the section tab.
Note:If you have selected the Specify by Section option in the Add/Replace dropdown list at thetemplate level, select the setting you want to apply to the current section.
• Report workbook selection. Select the workbook containing the reports you want to generateusing the current template.
Note:The workbooks you select must contain reports that have the same connection as the template.
• Enter a description for the workbook you have selected.• Dimension member selection:
• One or more dimensions for which one or several members are variables. For a specificdimension, the members selected as variables will override the members if the dimension isdisplayed in the page axis or in the context of the report. One report is created for each memberselected.
• One or more dimensions for which only one member is fixed. This is optional. A fixed memberoverrides any other member of the same dimension that is part of the report in the context orthe page axis. For example, if you select the period 2009 as a fixed member and the period2008 is displayed in the page axis of the report, 2009 will be taken into account.
Note:
• A suppressed member behaves exactly like a fixed member, but this feature remains forhistorical reasons.
• You cannot select fixed, suppressed and variable members for one dimension. All of themare mutually exclusive.
2013-01-30203
Collaboration
In the published reports, the members are displayed according to the following precedencerule:1. members in the row and column axes.2. members selected as fixed members or as variable members in the publication template.3. members in the page axis.4. members in the context.
Note:The template is saved as an .xlt or xltx file.
Other actions available on a template include:• You can open an existing template, modify it and save it with a different name by selectingEPM >
Book Publication > Open Template.
Note:
• If a report workbook specified in the template does not contain valid reports, the template opensbut the report workbook area is empty. If you want to save your template, you need to specifyanother workbook that contains valid reports.
• The Save the template in a different location is available and enables you to choose anotherlocation on the server to save the template.
• You can create a new section or a section based on an existing one. You can also delete a sectionfrom the template. These actions are available in the template dialog box, under the section tab.
• If you have opened a Plannning and Consolidation publication template using the EPM > Open >Open Server Root Folder, meaning without using the dialog box dedicated to the publicationtemplate, you can then use the Save, Save as and Validate commands available inEPM > BookPublication. See Open Actions.
31.2.1.1.1 Creating Publication Templates for a Local or SAP BusinessObjects EnterpriseConnection
Note:
• You must be granted the right to create a book publication template or you will not be able to savethe template.
• A template is created by default on the first connection used in the workbook. If you want to createa template on a different connection, selectEPM > Book Publication > Change Connection. Atemplate can only apply to reports using the same connection.
• Choose carefully the names you enter for the publication template, the sections and the reportworkbook description, as they will appear as the names of the folders if you publish the reports inPDF format.• You should not use the following characters, as they are changed into the _ character in the
folders and book names: \ / : * ? " < > | & + = ( ) { } [ ] $ %• You should not enter a space at the beginning or the end of the names.• A section name and a workbook description must be unique within a template. If not, you cannot
save the template.
2013-01-30204
Collaboration
1. Select EPM > Book Publication > New Template.The Book Publication Template dialog box opens.
2. Enter a name for the template.3. Enter a name for the section.
The entered name is displayed on the tab of the section.
4. Select a workbook that contains the reports you want to publish and enter a description for the reportworkbook.
Note:
• The workbook you select must contain reports that use the same connection as the template.• When clicking the arrow next to the ellipsis button, the Local Browser is selected by default.
5. You can select other workbooks and enter a description for them by clicking the green cross icon.6. Click Select Dimensions.
The Dimension Selector opens.
7. Select the checkbox for a dimension and click the Add button of the area you want. You must addat least one dimension in the Variable Members area. The selection of dimensions for the fixedand the suppressed members is optional.
8. Click OK.9. For each dimension selected, click the button next to it and select the members you want in the
Member Selector. You can only select one member per dimension as a fixed or suppressed member.
Note:Once a dimension has been selected, you can select an additional member by clicking the greencross icon.
10. You can create one or several sections by clicking theAdd New Section button and repeating steps3 to 9.
11. Click Save.
Note:If the Save button is disabled: check that you have performed all the above steps; check also thatthe names of the sections and the workbook descriptions you have entered are unique within thetemplate; and check that you are granted the right for creating a book publication template.
12. In the Save As dialog box, select a format (.xlt or .xltx) and enter a name for the template file.The template is saved to the following local folder: C:\Documents andSettings\[UserWindows]\My Documents\PC_LOC\[login]\books\[appset]\[application]\[team orlocalTeam]\WebExcel\ManageBook.
31.2.1.1.2 Creating Publication Templates for a Planning and Consolidation connection
Note:
• You must be granted the right to create a book publication template or you will not be able to savethe template.
2013-01-30205
Collaboration
• A template is created by default on the first connection used in the workbook. If you want to createa template on a different connection, select EPM > Book Publication > Change Connection. Atemplate can only apply to reports using the same connection.
• Choose carefully the names you enter for the publication template, the sections and the reportworkbook description, as they will appear as the names of the folders if you publish the reports inPDF format.• You should not use the following characters, as they are changed into the _ character in the
folders and book names: \ / : * ? " < > | & + = ( ) { } [ ] $ %• You should not enter a space at the beginning or the end of the names.• A section name and a workbook description must be unique within a template. Otherwise, you
cannot save the template.
1. Select EPM > Book Publication > New Template.The Book Publication Template dialog box opens.
2. Enter a name for the template.3. If you intend to publish the books in PDF format, select an option in the Add/Replace dropdown
list.4. You can select a member of the Time dimension using the Variable Time field.5. Enter a name for the section.
The entered name is displayed on the tab of the section.
6. If you have selected Specify by Section in the Add/Replace dropdown list at the template level,select Add or Replace for the current section.
7. Select a workbook that contains the reports you want to publish and enter a description for the reportworkbook.
Note:
• The workbook you select must contain reports that use the same connection as the template.• When clicking the arrow next to the ellipsis button, the Server Browser is selected by default.
8. You can select other workbooks and enter a description for them by clicking the green cross icon.9. Click Select Dimensions.
The Dimension Selector opens.
10. Select the checkbox for a dimension and click the Add button of the area you want. You must addat least one dimension in the Variable Members area. The selection of dimensions for the fixedand the suppressed members is optional.
11. Click OK.12. For each dimension selected, click the button next to it and select the members you want in the
Member Selector. You can only select one member per dimension as a fixed or suppressed member.
Note:Once a dimension has been selected, you can select an additional member by clicking the greencross icon.
13. You can create one or several sections by clicking theAdd New Section button and repeating steps5 to 12.
2013-01-30206
Collaboration
14. Click Save.
Note:If the Save button is disabled: check that you have performed all the above steps; check also thatthe names of the sections and the workbook descriptions you have entered are unique within thetemplate; and check that you are granted the right for creating a book publication template.
The Save dialog box opens.
15. Select a format (.xlt or .xltx) and enter a name for the template file.
31.2.1.2 Book Publishing
Once you have created a template, you can publish the books right away or schedule the publication,as books to print or as PDF files.
Book Publication Scheduling• The schedules you create are automatically saved for the current connection in the Microsoft Windows
Scheduled Tasks.• As you use Microsoft Windows Scheduled Tasks to schedule a book publication, you need to be
administrator of your machine. If you are not (for security reasons), you can still use WindowsScheduled Tasks if you are granted certain Windows rights. For more information, see http://support.microsoft.com/kb/883273/en-us.
Book PrintingIf you choose to print the books, you can use the following options:• Print one sheet for all dimensions members combination. This option enables you to define the
printing order. This option is not checked by default. For example, a workbook contains two sheetsand the variable members that you have selected in the template are: Spain, Italy.• If you select this option, the printing is performed in the following order: 'Sheet 1 - Spain', 'Sheet
1 - Italy', 'Sheet 2 - Spain', 'Sheet 2 - Italy'.• If you do not select this option, the printing is performed in the following order: 'Sheet 1 - Spain',
'Sheet 2 - Spain', 'Sheet 1 - Italy', 'Sheet 2 - Italy'.• Print sheets with no data. This option enables you to specify that a sheet be printed even if none
of the books in the sheet contain any data. This option is not checked by default.
Book in PDF FormatIf you export the books in PDF format, note that by default, one PDF file is generated by combinationof variable members. If you want to generate all the books in one single PDF, select the Single PDFoption.
The books in PDF format are stored at the following location, depending on the connection you use:
2013-01-30207
Collaboration
• If you use a Local or an SAP BusinessObjects Enterprise connection, the books are stored at thefollowing local location: C:\Documents and Settings\[UserWindows]\LocalSettings\Temp\_PATH_PUBLISH
• If you use a Planning and Consolidation connection, the books are stored on the server. You canthen view the books from the Planning and Consolidation web client. For more information, see theSAP BusinessObjects Planning and Consolidation Help.
31.2.1.2.1 Launching Book Publication
Before launching a publication, you must have defined a publication template.1. SelectEPM > Book Publication > Publish Books.
The Book Publication Wizard opens.
2. Select Publish Now and click Next.3. To print the books:
a. Select Printer.b. Enter the printer path or select it, using the ellipsis button.c. Depending on the printing order you want, you can select the Print one sheet for all dimensions
members combination option.d. To specify that a sheet be printed even if none of the reports in the sheet contain any data, select
the Print sheets with no data option.
4. To generate the books in PDF format:a. Select Publish to PDF Format.b. By default, one PDF file by combination of variable members is generated. If you want to generate
all the reports in one single PDF, select the Single PDF option.c. If you are using a Planning and Consolidation connection and you have not selected Single PDF,
select the location where the template you want use is stored (Public or a specific team).d. If you are using a Planning and Consolidation connection and you have selected Single PDF,
specify if the PDF files should be accessible only to you (select Private), to all the users (selectPublic) or to a specific team (select Team and select the team from the dropdown list).
5. Select the templates, then the template sections you want to use to generate the books.When using a Planning and Consolidation connection, you can select a team so that all the templatesfor the selected team are displayed. You can then select the template and sections you want.A summary displays information about the books to be generated.
6. Click Next.The report generation is launched and the process steps are displayed.
When using a Local or an SAP BusinessObject Enterprise connection, the books in PDF format arestored by default at the following local location: C:\Documents and Settings\[UserWindows]\LocalSettings\Temp\_PATH_PUBLISH.
31.2.1.2.2 Scheduling Book Publication
• Before launching a publication, you must have defined a publication template.
2013-01-30208
Collaboration
• Since you use Microsoft Windows Scheduled Tasks to schedule a book publication, you need to bean administrator of your machine or you need to be granted certain Windows rights.
1. SelectEPM > Book Publication > Publish Books.The Book Publication Wizard opens.
2. Select Schedule the Publication and click Next. If a schedule has already been defined for thecurrent connection, the schedule is displayed.
Note:You can only use one Windows Sheduled Task per connection.
• If no schedule exists for the current connection or if you want to modify the schedule, click Next,enter the schedule information, enter your Windows account password twice, and click Nextagain.
Note:
• The Enable Schedule option is selected by default, meaning that Windows Sheduled Taskis activated by default.
• The schedules you create are automatically saved for the current connection in the WindowsScheduled Tasks.
• If you want to deactivate the current Windows Sheduled Task, click the Windows SheduledTasks button. The Scheduled Tasks screen opens. Follow the Windows standard procedure:right-click the sheduled task, then select Properties. In the Task tab, uncheck the Enabledoption.
3. To print the books:a. Select Printer.b. Enter the printer path or select it, using the ellipsis button.c. Depending on the printing order you want, you can select the Print all sheets for one dimensions
members combination option.d. To specify that a sheet be printed even if none of the reports in the sheet contain any data, select
the Print sheets with no data option.
4. To generate the books in PDF format:a. Select Publish to PDF Format.b. By default, one PDF file by combination of variable members is generated. If you want to generate
all the books in one single PDF, select the Single PDF option and click Next. Enter a name forthe PDF and select the local folder in which you want the PDF to be generated.When using a Planning and Consolidation connection, you can specify other folders than a localfolder, in which you want the PDF to be generated, depending on your rights: public, private,team.
5. Select the templates, then the template sections you want to use to generate the books.When using a Planning and Consolidation connection, you can select a team so that all the templatesfor the selected team are displayed. You can then select the template and sections you want.A summary displays information about the books to be generated.
6. Click Next.7. Click Process.
2013-01-30209
Collaboration
When using a Local or an SAP BusinessObject Enterprise connection, if one PDF by combination ofmembers has been generated (and not one single PDF), by default, the books in PDF format are storedat the following local location: C:\Documents and Settings\[UserWindows]\LocalSettings\Temp\_PATH_PUBLISH.
31.2.2 Distribution and Data Collection
Applies to:The Data Collection feature only applies to Planning and Consolidation connections.
You can make workbooks (containing reports or input forms) available to a set of users:• You can send the workbooks as attachments in emails.• You can store the workbooks to a specific location.
Using a template, you can generate workbooks, based on:• one or more reports,• one or more variable members for one or more dimensions.
Each automatically created workbook displays the initial report(s), but with a different dimension member(or a combination of dimension members) of the dimension(s) for which variable dimension membershave been defined.
Then, at one time, you can launch the distribution or you can schedule it (for example, every Friday at11:00 PM).
The workbooks are stored in the specified folder or they are sent by email to the recipients you havespecified in the template.
Data Collection PurposesWhen using a Planning and Consolidation connection for data collection purposes, you make availableto users workbooks that contain input forms.
Caution:To save the entered data to the server for the appropriate members, you must ensure that the membersare specified and fixed for all dimensions in all of the input forms you distribute. You do not want todepend on the context. To do so, apply one of the two following procedures:• First possibility:
1. When creating your input forms, place the dimensions you want in the various axes.2. Take all the remaining dimensions - meaning the dimensions that are not placed in any of the
three axes - and place them in the page axis.3. In the distribution template, specify the members that you set as variable.4. Specify all the other dimensions as fixed members.
In a nutshell, you must use all the dimensions in your input forms and in the distribution template.
2013-01-30210
Collaboration
• Second possibility: you lock the dimensions for the workbooks, using the Context Options dialogbox. However, note that users who do not have the EPM add-in installed and who will enter data,will not view the dimensions and members that are not included in the input forms. This may beconfusing. For more information about the context lock, see Context.
The users then enter data in the distributed workbooks and make them available: if the input formshave been sent to them by email, they can send them back by email once they have finished enteringdata.
The user that has distributed the workbooks can then collect the workbooks. The data entered by thevarious users is automatically saved to the server.
31.2.2.1 Distribution Template
Before distributing workbooks, you must create a distribution template. The template specifies theinformation you want to include in the workbooks, including specific settings on dimension members.
Caution for data collection purposes:To save the entered data to the server for the appropriate members, you must ensure that the membersare specified and fixed for all dimensions in all of the input forms you distribute. You do not want todepend on the context. To do so, apply one of the following two procedures:• First possibility:
1. When creating your input forms, place the dimensions you want in the various axes.2. Take all the remaining dimensions - meaning the dimensions that are not placed in any of the
three axes - and place them in the page axis.3. In the distribution template, specify the members that you set as variable.4. Specify all the other dimensions as fixed members.
You must use all the dimensions in your input forms and in the distribution template.
• Second possibility: you lock the dimensions for the workbook, using the Context Options dialogbox. However, note that users who do not have the EPM add-in installed and who will enter data,will not view the dimensions and members that are not included in the input forms. This may beconfusing. For more information about the context lock, see Context.
Note:Choose carefully the names you enter for the distribution template, the sections and the report workbookdescriptions, since they appear as the names of the folders.• You should not use the following characters, as they are changed into the _ character in the folders
and book names: \ / : * ? " < > | & + = ( ) { } [ ] $ %• You should not enter a space at the beginning or the end of the names.• A section name and a workbook description must be unique within a template. Otherwise, you cannot
save the template.
Creating or modifying a template consists of the following steps:• Enter a name for the template.
2013-01-30211
Collaboration
• When using a Planning and Consolidation connection, the Variable Time field is displayed. If nomember is selected for the Time dimension in a section of the template as a variable or fixed member,the time member selected here applies to all the sections of the template and is hard-coded. If youselect a Time member in a section, it overrides the member selected in the Variable Time field forthis section.
• Section definition. A template can include one or more sections. A section is a part of the template.Each section includes at least a selection of variable dimension members. When launching thedistribution, you will be able to select the sections of the template you want to take into account.
Note:The tab of a section has no name until you enter it in the Section Name area.
• Enter a name for the section. The entered name is displayed on the section tab.• Workbook selection. Select the workbooks containing the reports or input forms you want to
generate using the current template.
Note:The workbooks you select must contain reports or input forms that have the same connectionas the template.
• Enter a description for the workbook you have selected.• Dimension member selection:
• One or more dimensions for which one or several members are variables. For a specificdimension, the members selected as variable will override the members if the dimension isdisplayed in the page axis or in the context of the report. One workbook is created for eachmember selected.
• One or more dimensions for which only one member is fixed. A fixed member overrides anyother member of the same dimension that is part of the report in the context or the page axis.For example, if you select the period 2009 as a fixed member and the period 2008 is displayedin the page axis of the report, 2009 will be taken into account.
A user is associated to each variable member.• When using a Local or SAP BusinessObjects Enterprise connection, enter the email
addresses of the users.• When using a Planning and Consolidation connection, enter the user names.
The user you specify receives the report that is generated on this variable member.
Note:You cannot select fixed and variable members for one dimension. They are mutually exclusive.
• In the workbooks, the members are displayed according to the following precedence rule:1. members in the row and column axes.2. members selected as fixed members or as variable members in the distribution template.3. members in the page axis.4. members in the context.
Note:Once you have created a template, it is saved as an .xlt or xltx file.
2013-01-30212
Collaboration
Other actions are available on a template, including:• You can open an existing template, modify it and save it with a different name by selectingEPM >
Distribution > Open Template.
Note:
• If a report workbook specified in the template does not contain valid reports, the template opensbut the report workbook area is empty. If you want to save your template, you must specifyanother workbook that contains valid reports.
• In the template dialog box of a template created on a Planning and Consolidation connection,the Save the template in a different location is available and enables you to choose anotherlocation on the server to save the template.
• You can create a blank section or a section based on an existing one. You can also delete a sectionfrom the template. These actions are available in the template dialog box, under the section tab.
• If you have opened a Plannning and Consolidation publication template using the EPM > Open >Open Server Root Folder, meaning without using the dialog box dedicated to the publicationtemplate, you can use the Save, Save as and Validate commands available inEPM > Distribution.See Open Actions.
31.2.2.1.1 Creating Distribution Templates
Note:
• A template is created by default on the first connection used in the workbook. If you want to createa template on a different connection, selectEPM > Distribution > Change Connection. A templatecan only apply to reports or input forms using the same connection.
• Choose carefully the names you enter for the distribution template, the sections and the workbookdescriptions, since they appear as the names of the folders.• You should not use the following characters, as they are changed into the _ character in the
folders and book names: \ / : * ? " < > | & + = ( ) { } [ ] $ %• You should not enter a space at the beginning or the end of the names.• A section name and a workbook description must be unique within a template. Otherwise, you
cannot save the template.
1. Select EPM > Distribution > New Template.The Distribution Template dialog box opens.
2. Enter a name for the template.3. If you are using a Planning and Consolidation connection, you can select a member of the Time
dimension using the Variable Time field.4. Enter a name for the section.
The entered name is displayed on the tab of the section.
5. Select a workbook that contain the reports or input forms you want to generate and distribute andenter a description for the workbook.
Note:The reports or input forms and the template must be connected to the same source.
6. You can select other workbooks and enter a description for them by clicking the green cross icon.
2013-01-30213
Collaboration
7. Click Select Dimensions.The Dimension Selector opens.
8. Select the checkbox for a dimension and click the Add button of the area you want. You must addat least one dimension in the Variable Members area. Then, you can select dimensions for fixedmembers.Click OK.
9. For each dimension selected, click the button next to it and select the members you want in theMember Selector. You can only select one member per dimension as a fixed member.
Note:Once a dimension has been selected, you can select an additional member by clicking the greencross icon.
10. For each variable dimension, enter:• the email address of the user, when using a Local or SAP BusinessObjects Enterprise connection.• the user name when using a Planning and Consolidation connection.The user you specify receives the report that is generated on this variable member.
11. You can create one or more sections by clicking the Add New Section button and repeat steps 4to 10.
12. Click Save.
Note:If the Save button is disabled, check that you have performed all the above steps and check alsothat the names of the sections and the workbook descriptions you have entered are unique withinthe template.
13. Depending on the connection you are using, perform the following action:• When using a Planning and Consolidation connection, in the Save As dialog box, select a format
(.xlt or .xltx) and enter a name for the template file.• When using a Local or SAP BusinessObjects Enterprise connection, in the Save dialog box,
select a format (.xlt or .xltx) and enter a name for the template file. The template is saved to thefollowing local folder: C:\Documents and Settings\[UserWindows]\MyDocuments\PC_LOC\ [login]\books\[appset]\[application]\[team orlocalTeam]\WebExcel\ManageBook C:\Documents and Settings\[UserWindows]\MyDocuments\PC_LOC\ [login]\books\[appset]\[application]\[team ou localTeam]\WebExcel\ManageDistributionList.
31.2.2.2 Workbook Distribution
Once you have created a template, you can distribute the workbooks now or schedule the distribution.You can send the workbooks by email as attachments, or store them at a specific location.
2013-01-30214
Collaboration
The workbooks are automatically switched to offline, meaning that the users will be able to work witha workbook in a disconnected state without using the EPM add-in.
Distribution Scheduling• The schedules you create are automatically saved for the current connection in the Microsoft Windows
Scheduled Tasks.• As you use Windows Scheduled Tasks to schedule a book publication, you need to be administrator
of your machine. If you are not (for security reasons), you can still use Windows Scheduled Tasksif you are granted certain Windows rights. For more information, see http://support.microsoft.com/kb/883273/en-us.
Distribution by EmailsIf you want to send the workbooks by email, so that the distribution can be performed, you must enterthe required information about the SMTP server you use to send the emails.
SelectEPM > Options > User Options.
Note:If you work on a Planning and Consolidation connection and if this connection returns the SMTP serverinformation, you do not need to enter the SMTP information in the User Options.
Enter the following information in the SMTP Server Configuration area of the User Options dialogbox:• The SMTP server address.• The port number. As a general rule, the port number is 25.• Select the authentication type:
• Anonymous. If you select this type, no authentication is required and you do not need to enterthe information in the Authentication area.
• Basic• NTML
• If you have selected the basic or the NTML authentication type, you must enter the login and passwordof the SMTP server.
• Select the Enable SSL option if needed.
31.2.2.2.1 Launching Distribution
• Before launching a distribution, you must have defined a distribution template.• If you want to send the workbooks by email (and if you do not work on a Planning and Consolidation
connection that returns the SMTP server information), so that the distribution can be performed, youmust enter the required information about the SMTP server you use to send the emails. SelectEPM> Options > User Options and enter the SMTP information in the SMTP Server Configurationarea.
1. SelectEPM > Distribution > Distribute.The Distribution Wizard opens.
2. Select Distribute Now and click Next.3. To send the workbooks by email:
2013-01-30215
Collaboration
a. Select Switch to offline mode and send by email and click Next.b. Enter standard email information.
4. To save the workbooks to a specific folder:a. Select Switch to offline mode and save to folder and click Next.b. In the Folder Location area, enter the path to the folder in which you want to save the workbooks
or select the path by using the ellipsis button.
5. If you are using a Planning and Consolidation connection, select the location where the templateyou want to use is stored (Public or a specific team).
6. Select the templates, then the template sections you want to use to generate the workbooks.When using a Planning and Consolidation connection, you can select a team so that all the templatesfor the selected team are displayed. You can then select the template and sections you want.A summary displays information about the workbooks to be generated.
7. Click Next.The distribution is launched and the process steps are displayed.
The workbooks are generated and stored in the specified folder or the workbooks are sent by email asattachments, according to the users specified for each variable member in the distribution template.
31.2.2.2.2 Scheduling Distribution
• Before launching a distribution, you must have previously defined a distribution template.• Since you use MIcrosoft Windows Scheduled Tasks to schedule a distribution, you need to be
administrator of your machine or you must be granted certain Windows rights.1. SelectEPM > Distribution > Distribute.
The Distribution Wizard opens.
2. Select Schedule the Distribution and click Next. If a schedule has already been defined for thecurrent connection, the schedule is displayed.
Note:You can only use one Windows Sheduled Task per connection.
• If no schedule exists for the current connection or if you want to modify the schedule: click Next,enter the schedule information, enter your Windows account password twice, and click Nextagain.
Note:
• The Enable Schedule option is selected by default, meaning that Windows Sheduled Taskis activated by default.
• The schedules you create are automatically saved for the current connection in the WindowsScheduled Tasks.
• If you want to deactivate the current Windows Sheduled Task, click the Windows SheduledTasks button. The Scheduled Tasks screen opens. Follow the Windows standard procedure:right-click the sheduled task, then select Properties. In the Task tab, uncheck the Enabledoption.
3. To send the workbooks by email:
2013-01-30216
Collaboration
a. Select Switch to offline mode and send by email and click Next.b. Enter standard email information.
4. To save the workbooks in a specific folder:a. Select Switch to offline mode and save to folder and click Next.b. In the Folder Location area, enter the path to the folder in which you want to save the workbooks
or select the path by using the ellipsis button.
5. Select the templates, then the template sections you want to use to generate the workbooks.When using a Planning and Consolidation connection, you can select a team so that all the templatesfor the selected team are displayed. You can then select the template and sections you want.A summary displays information about the reports to be generated.
6. Click Next.7. Click Process.
31.2.2.3 Data Collection
Applies to:Planning and Consolidation connections.
If users have entered data in the distributed workbooks, they can either email the workbooks back tothe sender, or replace the workbooks in the specified distribution folder.
The sender can then collect the workbooks from the specified folder or the email folder.
The entered data is automatically saved to the server.
31.2.2.3.1 Collecting Data
To collect data, you must have previously performed a workbook distribution on the same connection.1. SelectEPM > Distribution > Collect.
The Collection Wizard opens.
2. Do one of the following:• To collect data entered in workbooks that users have sent you by email, select the Outlook
Mailbox option, then click the ellipsis button in theWorking Folder area. In the Microsoft Outlookdialog box, select the Outlook folder in which the emails with the workbooks are stored. Back inthe Collection Wizard, select the emails containing workbooks that you want to collect and clickNext twice.
• To collect data entered in workbooks that users have stored in a specific folder, select the LocalFolder option, then click the ellipsis button in the Working Folder area. In the dialog box thatopens, select the folder containing the workbooks you want to collect. Back in the CollectionWizard, select the workbooks that you want to collect and click Next twice.
The workbooks are automatically connected and the data is saved to the server.
2013-01-30217
Collaboration

2013-01-30218
Collaboration
EPM Functions
The EPM functions are formulas that enable you to retrieve specific information or data and to make areport behave in a certain way, providing power and flexibility to reports.• You can enter an EPM function directly in the formula bar.
To make it easier to create and edit formulas and minimize typing and syntax errors, use MicrosoftOffice Excel Formula AutoComplete. After you type =epm (or =EPM, as it is not case-sensitive), adynamic dropdown list of all the EPM functions is displayed below the cell.
• You can also use the Microsoft Office Excel standard Insert Function dialog box by clicking theInsert Function button from the EPM tab of the ribbon.
The EPM dedicated functions are gathered under the EPMFunctions category.
Note:
• You should deactivate the Member Recognition and the Local Member Recognition functions whenusing the EPM functions.
• General notes:• The text entered in formulas is not case-sensitive.• The string parameters must be entered between the "" characters. For example: "account".• The separator character used to separate the parameters of a function depends on the "list
separator" defined in your local settings.
An EPM function is created by default on the active connection of the sheet. The default connection isdisplayed in the Active Connection dropdown list of the EPM pane. Using this dropdown list, you candirectly select another connection or you can select the command Select Another Connection, thenselect another connection in the Connection Manager that opens.
Note:
• For technical reasons, the functions that are not supported on a specific data source are not greyedout or hidden in the EPMFunctions category. All the functions are available for selection, regardlessof the data source.
• The FPMXLClient.TechnicalCategory category is only used internally and must not be used byother users.
• If you work with reports that have been created with previous versions of Planning and Consolidation(before version 10), some functions beginning with Ev continue to work but their names are notautomatically converted into EPM. From version 10, the names of the functions begin with EPM. Allthe functions beginning with Ev are grouped under the EVFunctions (Deprecated) category. Formore information on the former names and the corresponding new names, see the SAPBusinessObjects EPM Solutions, add-in for Microsoft Office What's New guide.
2013-01-30219
EPM Functions
• This note applies to Planning and Consolidation Local connections. However, when using bothadd-ins, Planning and Consolidation Interface for Excel 7.5 (on a 7.5 Planning and Consolidationmodel) and EPM add-in 10.0 (on a 10.0 Planning and Consolidation model), uncheck the Load EVFunctions option in the User Options of the EPM tab. The EVFunctions (Deprecated) categorydoes not appear. This prevents conflicts between EV function names.
• • The following Ev functions are not supported in the EPM add-in: EvALK, EvASV, EvBLK, EvCLK,EvDLK, EvENE, EvEXP, EvINP, EvLIK, EvLST, EvMEM, EvMSG, EvNXP, EvPLK, EvPOV,EvPXR, EvSEN, EvSET, EvSLK, OsAMT.
• EvMNU name is still supported but its former parameters are not recognized by the EPM add-in.For more information about the new parameters, EPMExecuteAPI.
EPM Function RefreshWhen creating or modifying EPM functions, they are executed immediately, with the exception of severalfunctions.
The EPM functions that need to retrieve information from the server are executed only when you refreshthe worksheet or the workbook by selecting Refresh or Refresh > Refresh Worksheet or Refresh >Refresh Workbook. A simple refresh of the report does not execute the EPM function, and EPMfunction data is not displayed in the report until you perform a refresh of the worksheet or workbook.See the example below.
Note:The following actions automatically refresh the selected report (not the whole worksheet): Expand,Collapse, Keep Member, Exclude Member, changes in the Report Editor, changes in the page axis.
Example:You want to retrieve the comments for the accounts that are placed in the rows of the report. You createa local member that contains the EPMCommentPartialContext function.
Click Refresh or Refresh > Refresh Worksheet or Refresh > Refresh Workbook. The data andcomments are displayed from the server.
fn (local member with EPMCommentPartialContext)2011 Total
ok2356Personnel Costs
You expand "Personnel Costs". The expand action automatically performs a refresh of the current reportand not of the current worksheet. As the EPMCommentPartialContext retrieves comments from theserver, the comments are not displayed at this stage. It is the same for the data. #RFR is displayedinstead in the cells. Therefore, your report contains a mix of data, comments and #RFR: this is thestandard behavior. To display all data and comments, you need to perform a refresh of the wholeworksheet or workbook.
2013-01-30220
EPM Functions
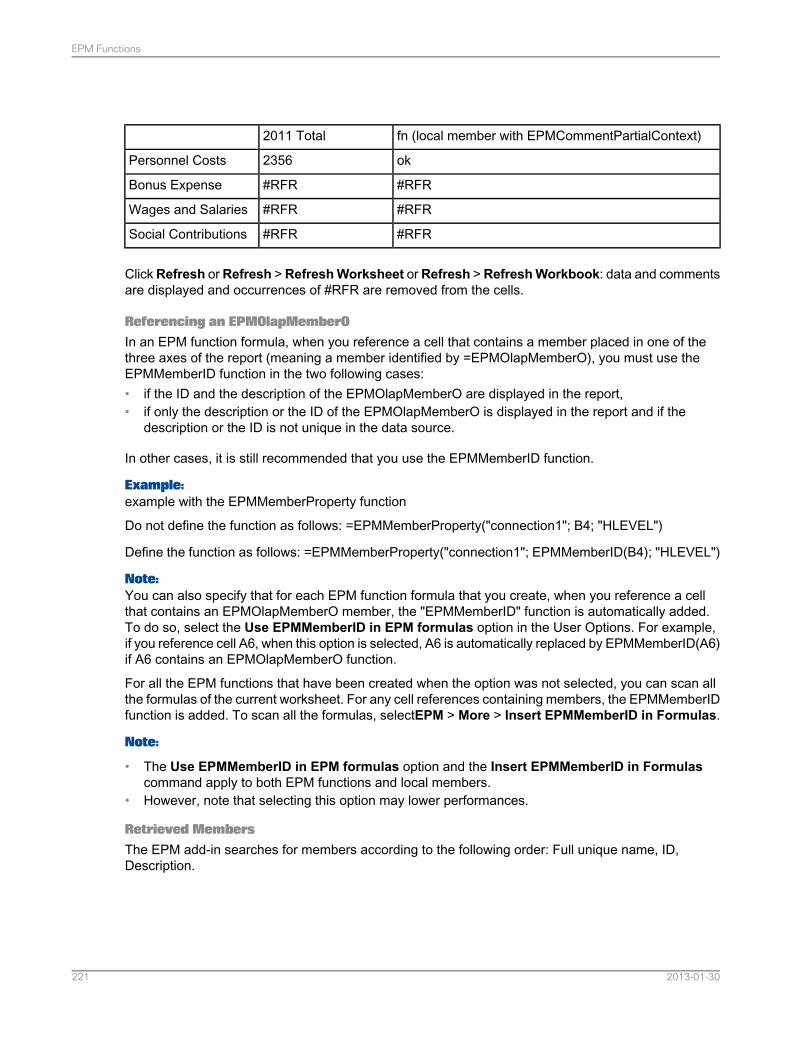
fn (local member with EPMCommentPartialContext)2011 Total
ok2356Personnel Costs
#RFR#RFRBonus Expense
#RFR#RFRWages and Salaries
#RFR#RFRSocial Contributions
ClickRefresh orRefresh >RefreshWorksheet orRefresh >RefreshWorkbook: data and commentsare displayed and occurrences of #RFR are removed from the cells.
Referencing an EPMOlapMemberOIn an EPM function formula, when you reference a cell that contains a member placed in one of thethree axes of the report (meaning a member identified by =EPMOlapMemberO), you must use theEPMMemberID function in the two following cases:• if the ID and the description of the EPMOlapMemberO are displayed in the report,• if only the description or the ID of the EPMOlapMemberO is displayed in the report and if the
description or the ID is not unique in the data source.
In other cases, it is still recommended that you use the EPMMemberID function.
Example:example with the EPMMemberProperty function
Do not define the function as follows: =EPMMemberProperty("connection1"; B4; "HLEVEL")
Define the function as follows: =EPMMemberProperty("connection1"; EPMMemberID(B4); "HLEVEL")
Note:You can also specify that for each EPM function formula that you create, when you reference a cellthat contains an EPMOlapMemberO member, the "EPMMemberID" function is automatically added.To do so, select the Use EPMMemberID in EPM formulas option in the User Options. For example,if you reference cell A6, when this option is selected, A6 is automatically replaced by EPMMemberID(A6)if A6 contains an EPMOlapMemberO function.
For all the EPM functions that have been created when the option was not selected, you can scan allthe formulas of the current worksheet. For any cell references containing members, the EPMMemberIDfunction is added. To scan all the formulas, selectEPM > More > Insert EPMMemberID in Formulas.
Note:
• The Use EPMMemberID in EPM formulas option and the Insert EPMMemberID in Formulascommand apply to both EPM functions and local members.
• However, note that selecting this option may lower performances.
Retrieved MembersThe EPM add-in searches for members according to the following order: Full unique name, ID,Description.
2013-01-30221
EPM Functions
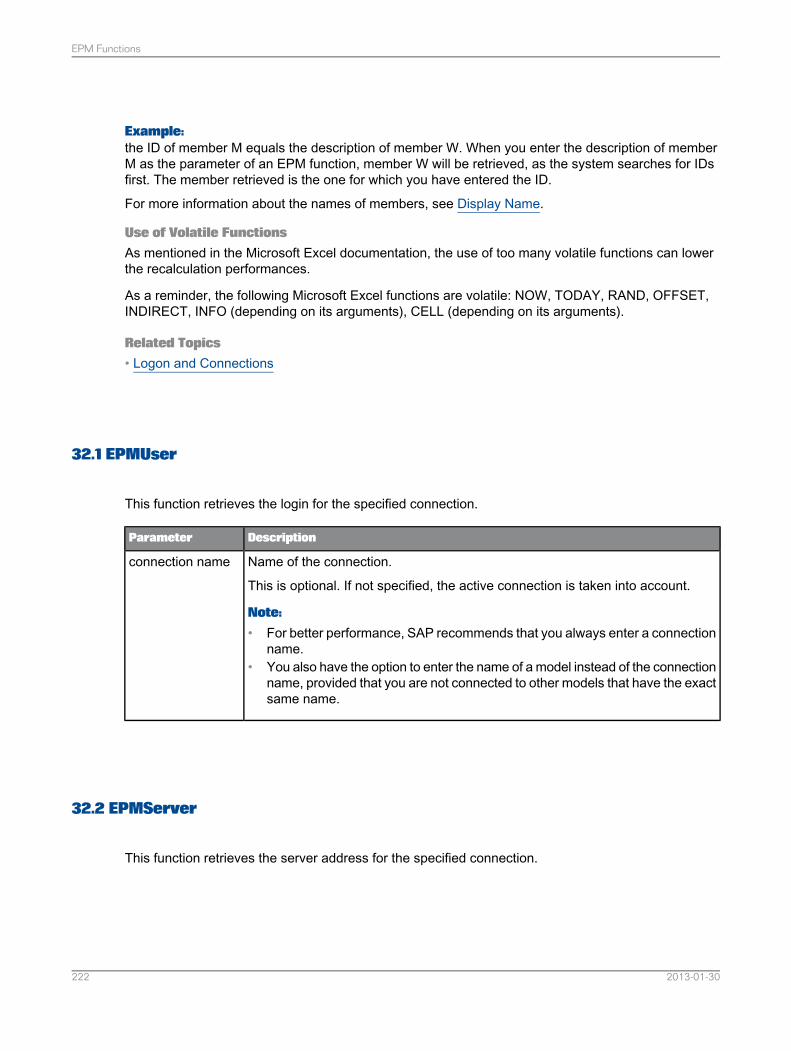
Example:the ID of member M equals the description of member W. When you enter the description of memberM as the parameter of an EPM function, member W will be retrieved, as the system searches for IDsfirst. The member retrieved is the one for which you have entered the ID.
For more information about the names of members, see Display Name.
Use of Volatile FunctionsAs mentioned in the Microsoft Excel documentation, the use of too many volatile functions can lowerthe recalculation performances.
As a reminder, the following Microsoft Excel functions are volatile: NOW, TODAY, RAND, OFFSET,INDIRECT, INFO (depending on its arguments), CELL (depending on its arguments).
Related Topics• Logon and Connections
32.1 EPMUser
This function retrieves the login for the specified connection.
DescriptionParameter
Name of the connection.
This is optional. If not specified, the active connection is taken into account.
Note:
• For better performance, SAP recommends that you always enter a connectionname.
• You also have the option to enter the name of a model instead of the connectionname, provided that you are not connected to other models that have the exactsame name.
connection name
32.2 EPMServer
This function retrieves the server address for the specified connection.
2013-01-30222
EPM Functions
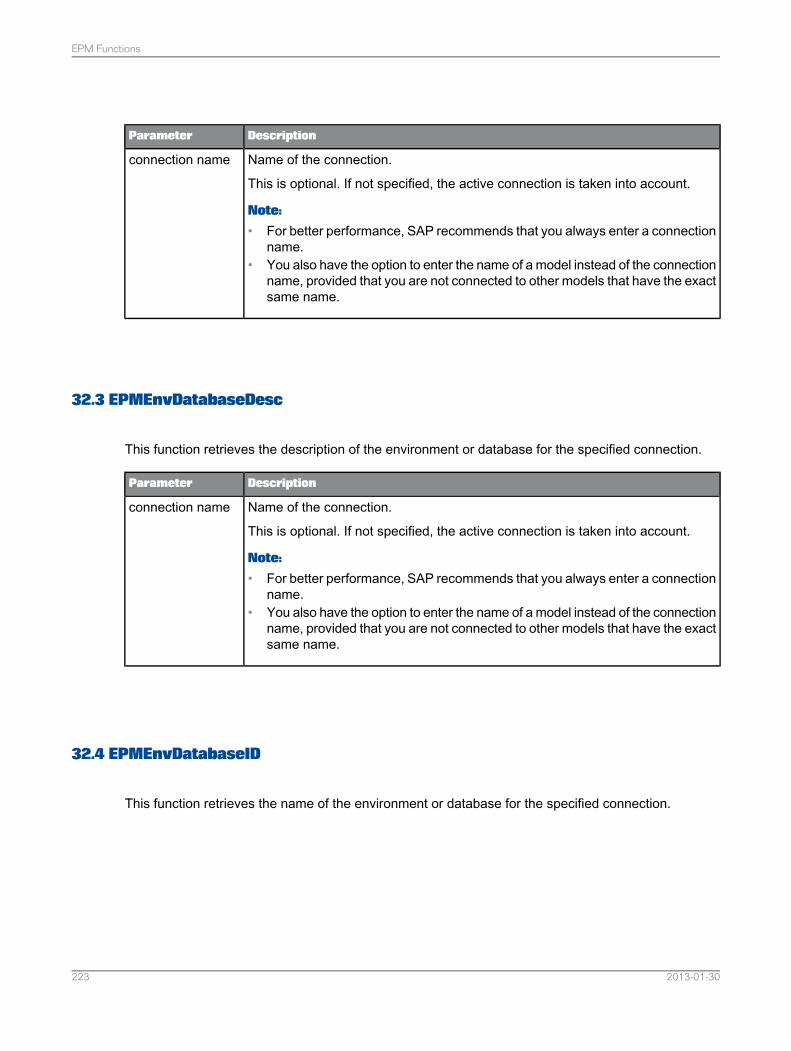
DescriptionParameter
Name of the connection.
This is optional. If not specified, the active connection is taken into account.
Note:
• For better performance, SAP recommends that you always enter a connectionname.
• You also have the option to enter the name of a model instead of the connectionname, provided that you are not connected to other models that have the exactsame name.
connection name
32.3 EPMEnvDatabaseDesc
This function retrieves the description of the environment or database for the specified connection.
DescriptionParameter
Name of the connection.
This is optional. If not specified, the active connection is taken into account.
Note:
• For better performance, SAP recommends that you always enter a connectionname.
• You also have the option to enter the name of a model instead of the connectionname, provided that you are not connected to other models that have the exactsame name.
connection name
32.4 EPMEnvDatabaseID
This function retrieves the name of the environment or database for the specified connection.
2013-01-30223
EPM Functions
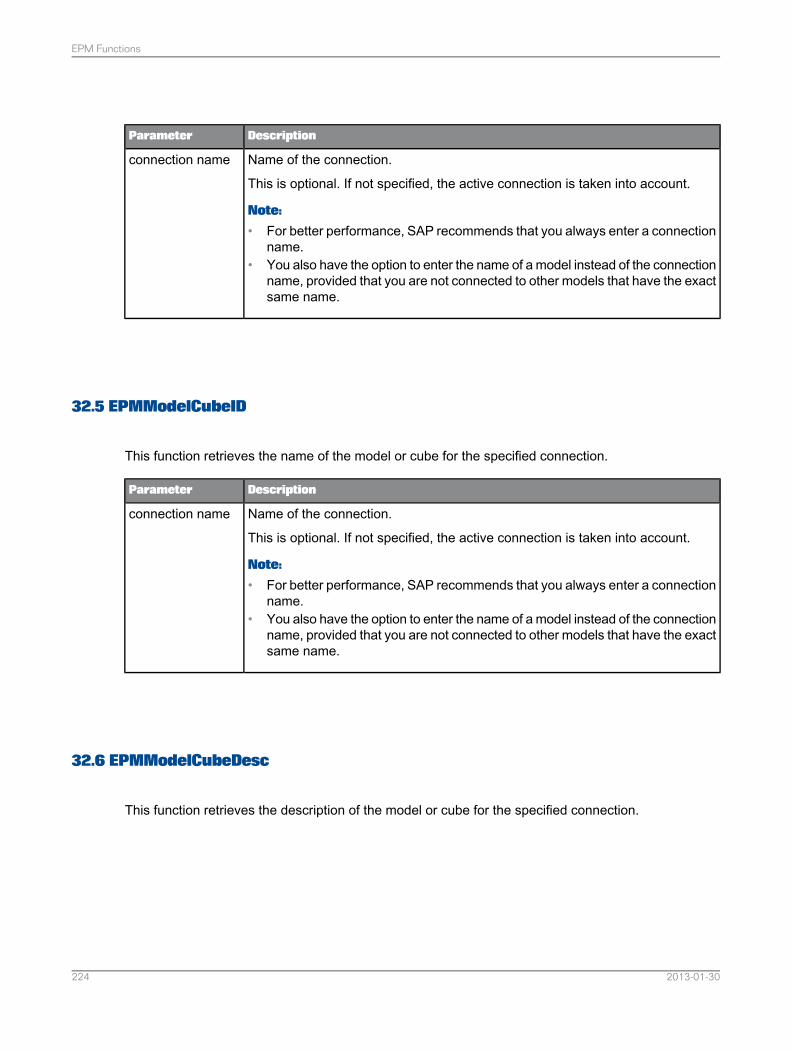
DescriptionParameter
Name of the connection.
This is optional. If not specified, the active connection is taken into account.
Note:
• For better performance, SAP recommends that you always enter a connectionname.
• You also have the option to enter the name of a model instead of the connectionname, provided that you are not connected to other models that have the exactsame name.
connection name
32.5 EPMModelCubeID
This function retrieves the name of the model or cube for the specified connection.
DescriptionParameter
Name of the connection.
This is optional. If not specified, the active connection is taken into account.
Note:
• For better performance, SAP recommends that you always enter a connectionname.
• You also have the option to enter the name of a model instead of the connectionname, provided that you are not connected to other models that have the exactsame name.
connection name
32.6 EPMModelCubeDesc
This function retrieves the description of the model or cube for the specified connection.
2013-01-30224
EPM Functions
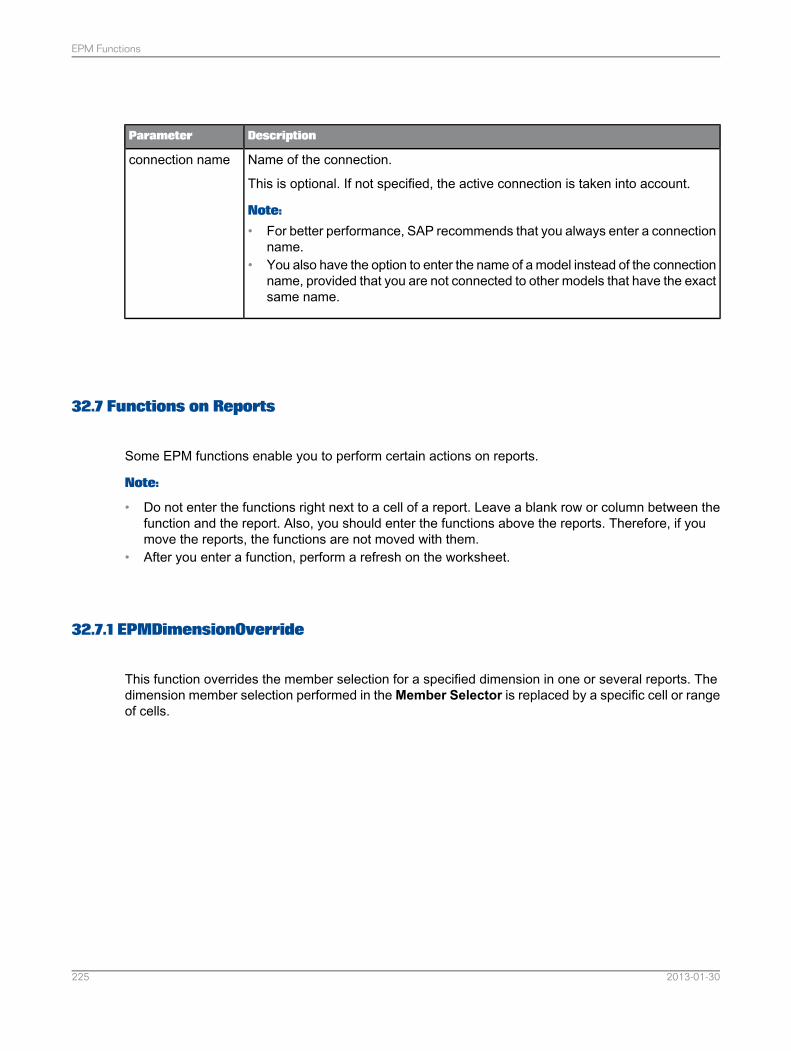
DescriptionParameter
Name of the connection.
This is optional. If not specified, the active connection is taken into account.
Note:
• For better performance, SAP recommends that you always enter a connectionname.
• You also have the option to enter the name of a model instead of the connectionname, provided that you are not connected to other models that have the exactsame name.
connection name
32.7 Functions on Reports
Some EPM functions enable you to perform certain actions on reports.
Note:
• Do not enter the functions right next to a cell of a report. Leave a blank row or column between thefunction and the report. Also, you should enter the functions above the reports. Therefore, if youmove the reports, the functions are not moved with them.
• After you enter a function, perform a refresh on the worksheet.
32.7.1 EPMDimensionOverride
This function overrides the member selection for a specified dimension in one or several reports. Thedimension member selection performed in the Member Selector is replaced by a specific cell or rangeof cells.
2013-01-30225
EPM Functions
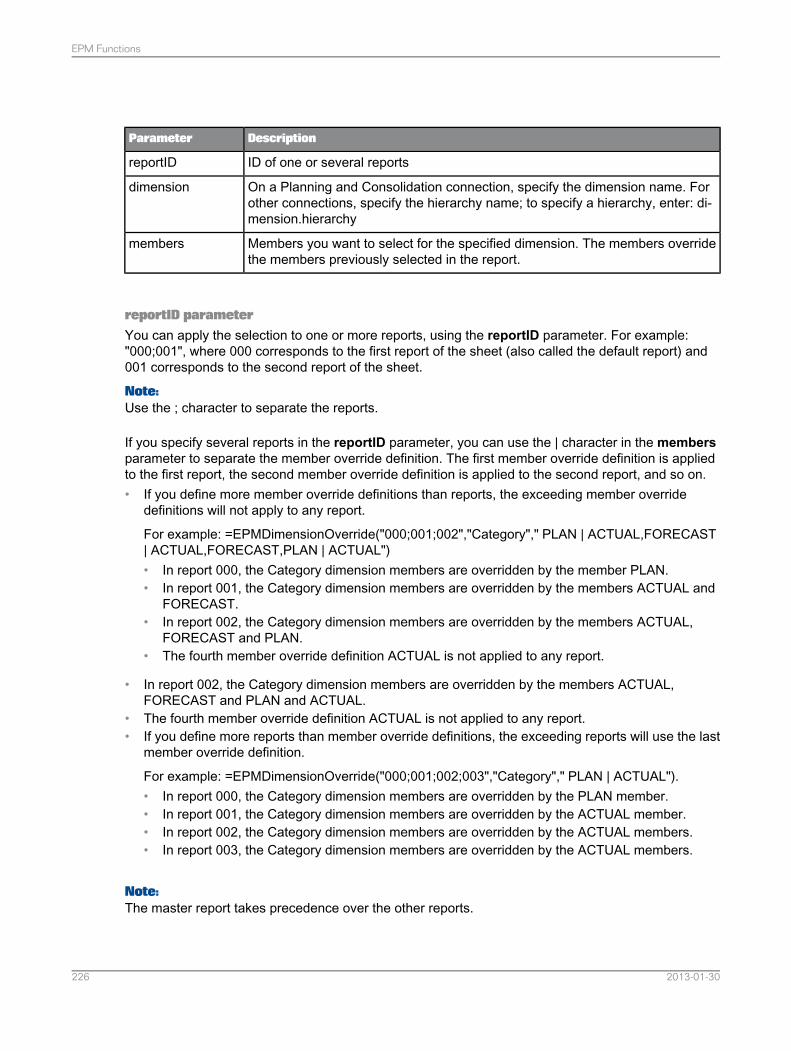
DescriptionParameter
ID of one or several reportsreportID
On a Planning and Consolidation connection, specify the dimension name. Forother connections, specify the hierarchy name; to specify a hierarchy, enter: di-mension.hierarchy
dimension
Members you want to select for the specified dimension. The members overridethe members previously selected in the report.
members
reportID parameterYou can apply the selection to one or more reports, using the reportID parameter. For example:"000;001", where 000 corresponds to the first report of the sheet (also called the default report) and001 corresponds to the second report of the sheet.
Note:Use the ; character to separate the reports.
If you specify several reports in the reportID parameter, you can use the | character in the membersparameter to separate the member override definition. The first member override definition is appliedto the first report, the second member override definition is applied to the second report, and so on.• If you define more member override definitions than reports, the exceeding member override
definitions will not apply to any report.
For example: =EPMDimensionOverride("000;001;002","Category"," PLAN | ACTUAL,FORECAST| ACTUAL,FORECAST,PLAN | ACTUAL")• In report 000, the Category dimension members are overridden by the member PLAN.• In report 001, the Category dimension members are overridden by the members ACTUAL and
FORECAST.• In report 002, the Category dimension members are overridden by the members ACTUAL,
FORECAST and PLAN.• The fourth member override definition ACTUAL is not applied to any report.
• In report 002, the Category dimension members are overridden by the members ACTUAL,FORECAST and PLAN and ACTUAL.
• The fourth member override definition ACTUAL is not applied to any report.• If you define more reports than member override definitions, the exceeding reports will use the last
member override definition.
For example: =EPMDimensionOverride("000;001;002;003","Category"," PLAN | ACTUAL").• In report 000, the Category dimension members are overridden by the PLAN member.• In report 001, the Category dimension members are overridden by the ACTUAL member.• In report 002, the Category dimension members are overridden by the ACTUAL members.• In report 003, the Category dimension members are overridden by the ACTUAL members.
Note:The master report takes precedence over the other reports.
2013-01-30226
EPM Functions
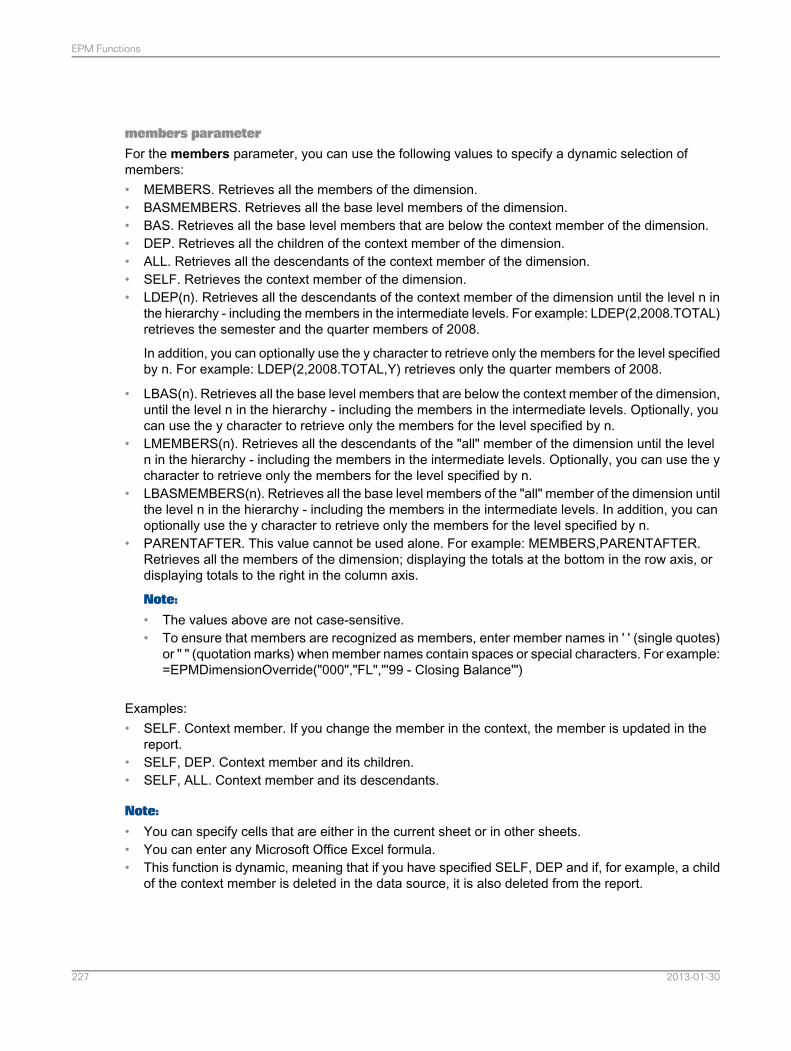
members parameterFor the members parameter, you can use the following values to specify a dynamic selection ofmembers:• MEMBERS. Retrieves all the members of the dimension.• BASMEMBERS. Retrieves all the base level members of the dimension.• BAS. Retrieves all the base level members that are below the context member of the dimension.• DEP. Retrieves all the children of the context member of the dimension.• ALL. Retrieves all the descendants of the context member of the dimension.• SELF. Retrieves the context member of the dimension.• LDEP(n). Retrieves all the descendants of the context member of the dimension until the level n in
the hierarchy - including the members in the intermediate levels. For example: LDEP(2,2008.TOTAL)retrieves the semester and the quarter members of 2008.
In addition, you can optionally use the y character to retrieve only the members for the level specifiedby n. For example: LDEP(2,2008.TOTAL,Y) retrieves only the quarter members of 2008.
• LBAS(n). Retrieves all the base level members that are below the context member of the dimension,until the level n in the hierarchy - including the members in the intermediate levels. Optionally, youcan use the y character to retrieve only the members for the level specified by n.
• LMEMBERS(n). Retrieves all the descendants of the "all" member of the dimension until the leveln in the hierarchy - including the members in the intermediate levels. Optionally, you can use the ycharacter to retrieve only the members for the level specified by n.
• LBASMEMBERS(n). Retrieves all the base level members of the "all" member of the dimension untilthe level n in the hierarchy - including the members in the intermediate levels. In addition, you canoptionally use the y character to retrieve only the members for the level specified by n.
• PARENTAFTER. This value cannot be used alone. For example: MEMBERS,PARENTAFTER.Retrieves all the members of the dimension; displaying the totals at the bottom in the row axis, ordisplaying totals to the right in the column axis.
Note:
• The values above are not case-sensitive.• To ensure that members are recognized as members, enter member names in ' ' (single quotes)
or " " (quotation marks) when member names contain spaces or special characters. For example:=EPMDimensionOverride("000","FL","'99 - Closing Balance'")
Examples:• SELF. Context member. If you change the member in the context, the member is updated in the
report.• SELF, DEP. Context member and its children.• SELF, ALL. Context member and its descendants.
Note:
• You can specify cells that are either in the current sheet or in other sheets.• You can enter any Microsoft Office Excel formula.• This function is dynamic, meaning that if you have specified SELF, DEP and if, for example, a child
of the context member is deleted in the data source, it is also deleted from the report.
2013-01-30227
EPM Functions
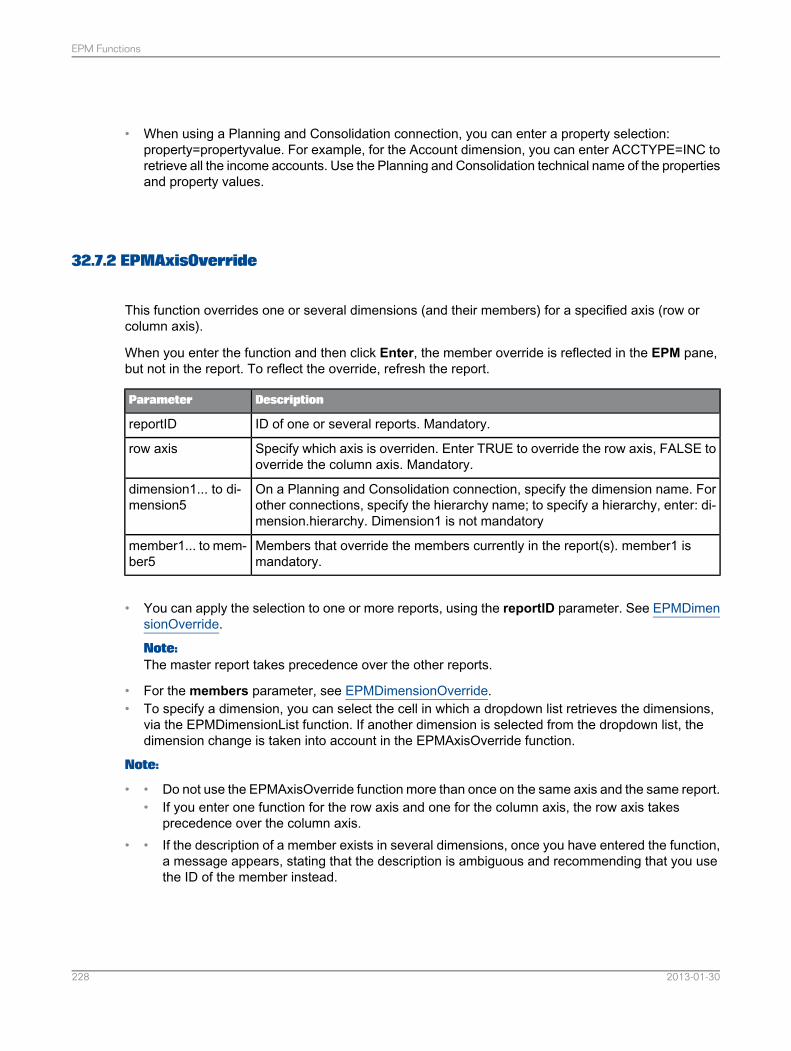
• When using a Planning and Consolidation connection, you can enter a property selection:property=propertyvalue. For example, for the Account dimension, you can enter ACCTYPE=INC toretrieve all the income accounts. Use the Planning and Consolidation technical name of the propertiesand property values.
32.7.2 EPMAxisOverride
This function overrides one or several dimensions (and their members) for a specified axis (row orcolumn axis).
When you enter the function and then click Enter, the member override is reflected in the EPM pane,but not in the report. To reflect the override, refresh the report.
DescriptionParameter
ID of one or several reports. Mandatory.reportID
Specify which axis is overriden. Enter TRUE to override the row axis, FALSE tooverride the column axis. Mandatory.
row axis
On a Planning and Consolidation connection, specify the dimension name. Forother connections, specify the hierarchy name; to specify a hierarchy, enter: di-mension.hierarchy. Dimension1 is not mandatory
dimension1... to di-mension5
Members that override the members currently in the report(s). member1 ismandatory.
member1... to mem-ber5
• You can apply the selection to one or more reports, using the reportID parameter. See EPMDimensionOverride.
Note:The master report takes precedence over the other reports.
• For the members parameter, see EPMDimensionOverride.• To specify a dimension, you can select the cell in which a dropdown list retrieves the dimensions,
via the EPMDimensionList function. If another dimension is selected from the dropdown list, thedimension change is taken into account in the EPMAxisOverride function.
Note:
• Do not use the EPMAxisOverride function more than once on the same axis and the same report.•• If you enter one function for the row axis and one for the column axis, the row axis takes
precedence over the column axis.• • If the description of a member exists in several dimensions, once you have entered the function,
a message appears, stating that the description is ambiguous and recommending that you usethe ID of the member instead.
2013-01-30228
EPM Functions
• If the ID of a member exists in several dimensions, once you have entered the function, a messageappears, stating that the ID is ambiguous and recommending that you use the full unique nameof the member instead.
Related Topics• EPMDimensionOverride• EPMDimensionList
32.7.3 EPMCopyRange
This function enables you to add and repeat the content of a range of cells until the bottom (columns)or the right side (rows) of a report is reached. The range is added to the data grid and in the shift zones(if there are any), starting after the row axis and below the column axis.• The following content of the specified source range is added to the report cells that do not contain
any data: all the format settings; formulas, data, fixed text and data validation settings.• By default, the following content of the specified source range is added to the report cells that contain
data: all the format settings and formulas. If you want to add the following content to the report cellsthat contain data, enter TRUE in the copyAllOnCopyRange parameter: all the format settings;formulas, data, fixed text and data validation settings. Only empty cells will not be added to datacells.
• If the source range that you want to add is smaller than the report range, the following content ofthe source range is duplicated as long as the report range has not been reached: all the formatsettings; formulas, fixed text and data validation settings, in the report cells that do not contain anydata.
• If the source range is added to a blank zone (shift) of the report, and if the source range is largerthan the blank zone, the beginning of the source range is added to the blank zone and the rest ofthe source range is duplicated in the data grid.
You can add the range to one or more reports, using the reportID parameter. For example: "000;001",where 000 corresponds to the first report of the sheet (also called the default report) and 001 correspondsto the second report of the sheet.
Note:Use the ; character to separate the reports.
2013-01-30229
EPM Functions
DescriptionParameter
ID of one or several reportsreportID
Specify where the range will be added. Enter TRUE to add the cells in rows,FALSE to add the cells in columns.
Rows
Specify the cell range containing the content that will be added to the rows orcolumns.
SourceRange
Specify if all content types are added to the report data. Enter TRUE to copy allcontent types. Otherwise, enter FALSE.
copyAllOnReport-Data
Note:When several reports share an axis, here is how the EPMCopyRange function behaves: if the axis thatis specified in the EPMCopyRange function (using the Rows parameter) is not the master axis, theEPMCopyRange function is simply ignored.
32.7.4 EPMInsertCellsBeforeAfterBlock
This function inserts cells before or after a block of members for a specified dimension.
If the source range that you want to insert is smaller than the destination range in the report:• the first cells of the source range are inserted before the block of members.• the subsequent exceeding cells of the source range are copied and duplicated in all the cells of the
destination range until the end of the report is reached.
Note:The inserted cells are considered as "false" members. An inserted member is identified by a formulabeginning with =EPMInsertedMember(.
DescriptionParameter
ID of one or several reportsreportID
On a Planning and Consolidation connection, specify the dimension name. Forother connections, specify the hierarchy name; to specify a hierarchy, enter: di-mension.hierarchy
Dimension
Specify where the cells must be inserted. Enter TRUE to insert the cells beforethe members, FALSE to insert the cells after the members.
Before
Specify the cell range containing the content that you want to insertRange
Note:When several reports share an axis, here is how the EPMInsertCellsBeforeAfterBlock function behaves:if you want to insert the cells in the master report only, you specify only the master report ID (using thereportID parameter); if you want to insert the cells only in a child report, you must specify both IDs (using
2013-01-30230
EPM Functions
the reportID parameter): the ID of the master report and the ID of the child report; if you want to insertthe cells in several child reports, you must specify all IDs (using the reportID parameter): the ID of themaster report and the IDs of the child reports. You must always specify the master report ID.
32.7.5 EPMMemberID
This function retrieves the unique name of a specified dimension member that is included in a report.
A unique name includes the following: [dimension name].[hierarchy name].[member name]
DescriptionParameter
Member for which you want to retrieve the unique name. Mandatory.member
32.7.6 EPMReportOptions
This function overrides the options for one or more reports. The override applies to a report only if theInherit Sheet Options option is not selected in the Options tab of the Report Editor.
DescriptionParameter
ID of one or several reports. Mandatory.reportID
Specify the options that will override the existing ones. Mandatory.options
In the options parameter, you can specify one or more options. Use the ; character to separate theoptions.
Note:All the report options are not described in this section. Follow the links for descriptions of the options.
Following is the list of values correponding to the report options:• CalculateParentsInHierarchies. To activate this option, enter: " CalculateParentsInHierarchies=true".
To deactivate it, enter: " CalculateParentsInHierarchies=false"
For more information, see Calculate Parents in Hierarchies.
• KeepFormulaOnData. To activate this option, enter: "KeepFormulaOnData=true". To deactivate it,enter: "KeepFormulaOnData=false".
For more information, see Keep Formula on Data and Show Source Data in Comments .
2013-01-30231
EPM Functions
• ShowSourceDataInComments. To activate this option, enter: "ShowSourceDataInComments=true".To deactivate it, enter: "ShowSourceDataInComments=false"
For more information, see Keep Formula on Data and Show Source Data in Comments .
• KeepEmptyRows. To activate this option, enter: "KeepEmptyRows=true ". To deactivate it, enter:"KeepEmptyRows=false"
For more information, see No Data and Zero Values.
• KeepEmptyColumns. To activate this option, enter: "KeepEmptyColumns=true". To deactivate it,enter: "KeepEmptyColumns=false"
For more information, see No Data and Zero Values.
• RepeatRowHeaders. To activate this option, enter: "RepeatRowHeaders=true". To deactivate it,enter: "RepeatRowHeaders=false"
For more information, see Repeat Row Headers and Repeat Column Headers.
• RepeatColumnHeaders. To activate this option, enter: "RepeatColumnHeaders=true". To deactivateit, enter: "RepeatColumnHeaders=false"
For more information, see Repeat Row Headers and Repeat Column Headers.
• FreezeDataRefresh. To activate this option, enter: "FreezeDataRefresh=true". To deactivate it, enter:"FreezeDataRefresh=false"
For more information, see Freeze Data Refresh.
• SetDefaultValueInEmptyCell and EmptyCellDefaultValue. To activate the option, enter:"SetDefaultValueInEmptyCell=true". To deactivate it, enter: "SetDefaultValueInEmptyCell=false"
Then, to define a default value, enter: "EmptyCellDefaultValue=[string]"
For example, you want that "no data" appears in any cell that contains no value. Enter what followsin the options parameter: "SetDefaultValueInEmptyCell=true";"EmptyCellDefaultValue=no data"
For more information, see Empty Cell Default Value .
• RowHeaderIndentation. Three values are possible.• No indentation. Enter: "RowHeaderIndentation=0"• Indent the children. Enter: "RowHeaderIndentation=1"• Indent the parents. Enter: "RowHeaderIndentation=2"
For more information, see Row Header Indentation .
• TotalAtLeft. To activate this option, enter: "TotalAtLeft=true". To deactivate it, enter: "TotalAtLeft=false"
For more information, see Totals Placement .
• TotalAtTop. To activate this option, enter: "TotalAtTop=true". To deactivate it, enter: "TotalAtTop=false"
For more information, see Totals Placement .
• ApplyDynamicFormatting and FormattingSheet. To activate the option, enter: "ApplyDynamicFormatting=true".
Then, to specify the sheet to apply, enter: "FormattingSheet=[name of the sheet]"
2013-01-30232
EPM Functions
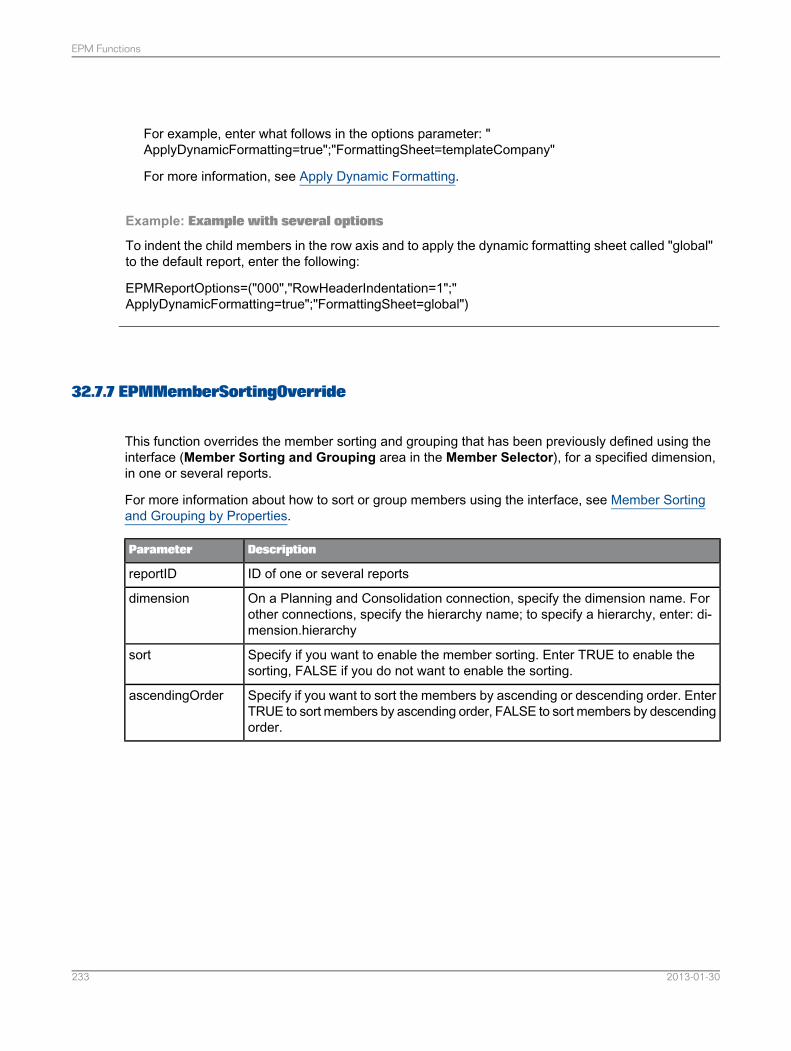
For example, enter what follows in the options parameter: "ApplyDynamicFormatting=true";"FormattingSheet=templateCompany"
For more information, see Apply Dynamic Formatting.
Example: Example with several options
To indent the child members in the row axis and to apply the dynamic formatting sheet called "global"to the default report, enter the following:
EPMReportOptions=("000","RowHeaderIndentation=1";"ApplyDynamicFormatting=true";"FormattingSheet=global")
32.7.7 EPMMemberSortingOverride
This function overrides the member sorting and grouping that has been previously defined using theinterface (Member Sorting and Grouping area in the Member Selector), for a specified dimension,in one or several reports.
For more information about how to sort or group members using the interface, see Member Sortingand Grouping by Properties.
DescriptionParameter
ID of one or several reportsreportID
On a Planning and Consolidation connection, specify the dimension name. Forother connections, specify the hierarchy name; to specify a hierarchy, enter: di-mension.hierarchy
dimension
Specify if you want to enable the member sorting. Enter TRUE to enable thesorting, FALSE if you do not want to enable the sorting.
sort
Specify if you want to sort the members by ascending or descending order. EnterTRUE to sort members by ascending order, FALSE to sort members by descendingorder.
ascendingOrder
2013-01-30233
EPM Functions
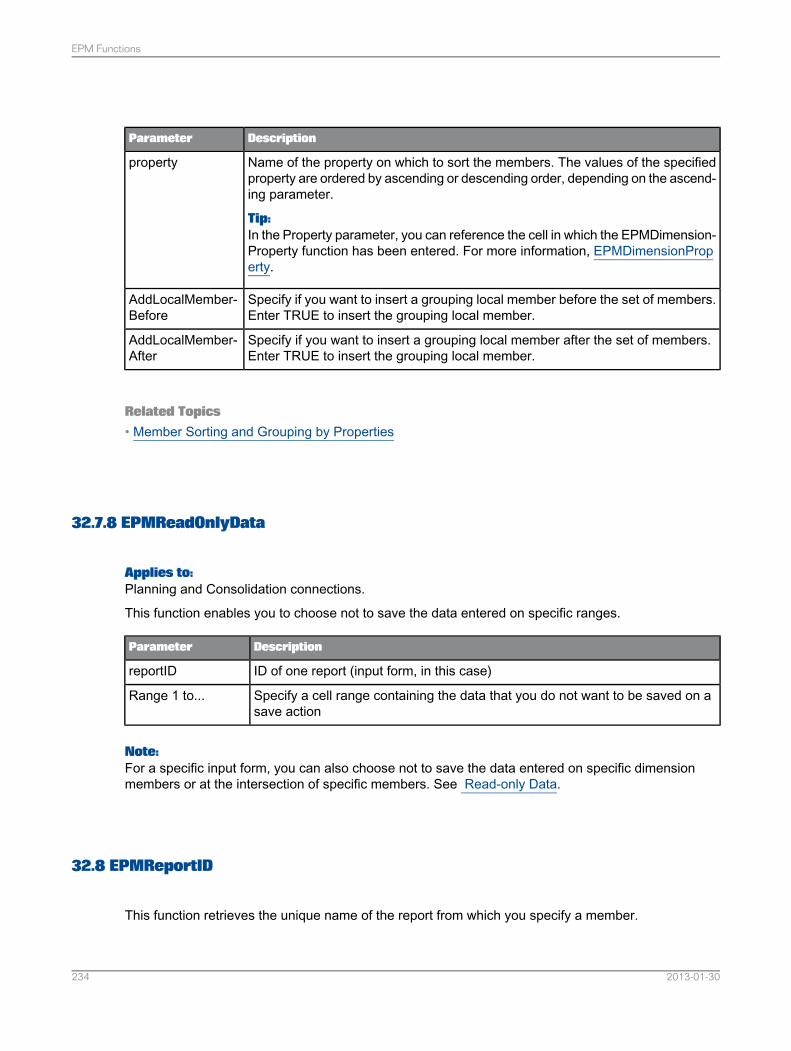
DescriptionParameter
Name of the property on which to sort the members. The values of the specifiedproperty are ordered by ascending or descending order, depending on the ascend-ing parameter.
Tip:In the Property parameter, you can reference the cell in which the EPMDimension-Property function has been entered. For more information, EPMDimensionProperty.
property
Specify if you want to insert a grouping local member before the set of members.Enter TRUE to insert the grouping local member.
AddLocalMember-Before
Specify if you want to insert a grouping local member after the set of members.Enter TRUE to insert the grouping local member.
AddLocalMember-After
Related Topics• Member Sorting and Grouping by Properties
32.7.8 EPMReadOnlyData
Applies to:Planning and Consolidation connections.
This function enables you to choose not to save the data entered on specific ranges.
DescriptionParameter
ID of one report (input form, in this case)reportID
Specify a cell range containing the data that you do not want to be saved on asave action
Range 1 to...
Note:For a specific input form, you can also choose not to save the data entered on specific dimensionmembers or at the intersection of specific members. See Read-only Data.
32.8 EPMReportID
This function retrieves the unique name of the report from which you specify a member.
2013-01-30234
EPM Functions
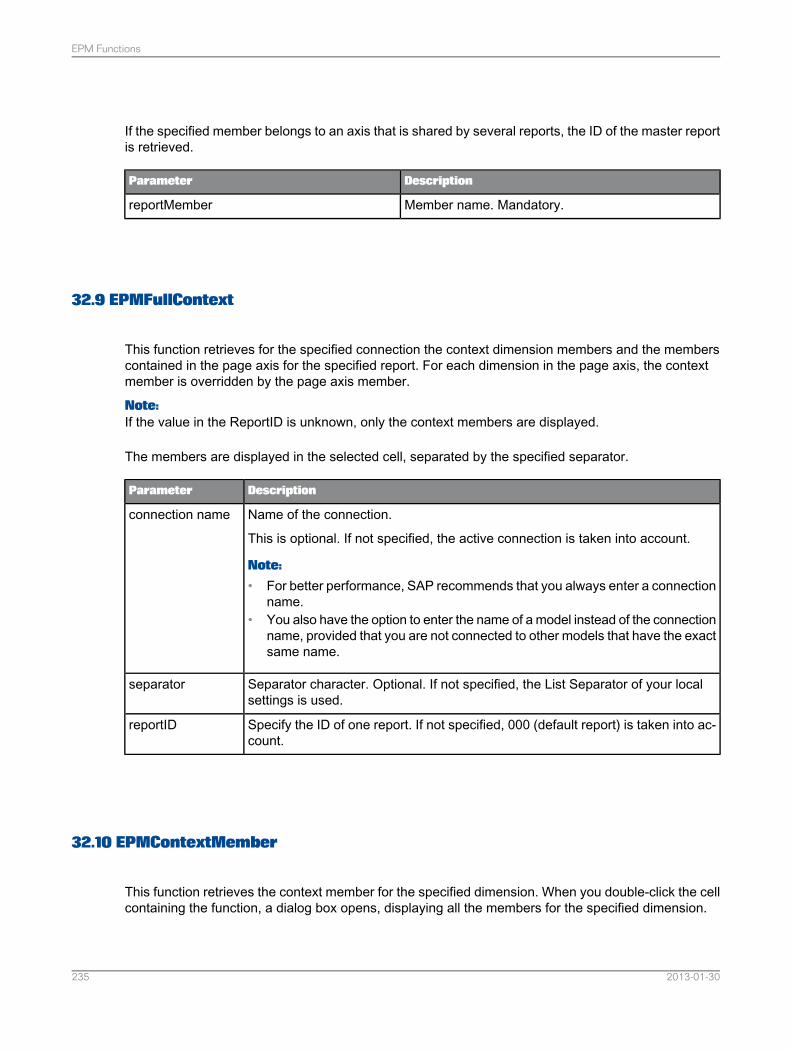
If the specified member belongs to an axis that is shared by several reports, the ID of the master reportis retrieved.
DescriptionParameter
Member name. Mandatory.reportMember
32.9 EPMFullContext
This function retrieves for the specified connection the context dimension members and the memberscontained in the page axis for the specified report. For each dimension in the page axis, the contextmember is overridden by the page axis member.
Note:If the value in the ReportID is unknown, only the context members are displayed.
The members are displayed in the selected cell, separated by the specified separator.
DescriptionParameter
Name of the connection.
This is optional. If not specified, the active connection is taken into account.
Note:
• For better performance, SAP recommends that you always enter a connectionname.
• You also have the option to enter the name of a model instead of the connectionname, provided that you are not connected to other models that have the exactsame name.
connection name
Separator character. Optional. If not specified, the List Separator of your localsettings is used.
separator
Specify the ID of one report. If not specified, 000 (default report) is taken into ac-count.
reportID
32.10 EPMContextMember
This function retrieves the context member for the specified dimension. When you double-click the cellcontaining the function, a dialog box opens, displaying all the members for the specified dimension.
2013-01-30235
EPM Functions
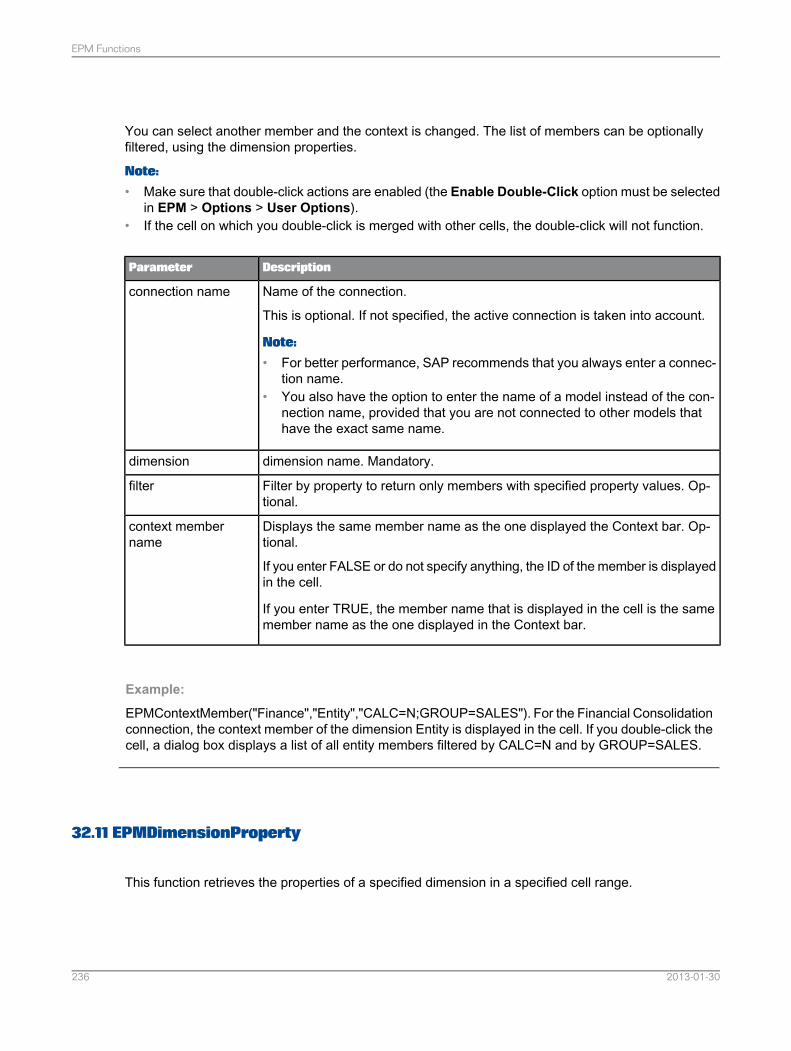
You can select another member and the context is changed. The list of members can be optionallyfiltered, using the dimension properties.
Note:
• Make sure that double-click actions are enabled (the Enable Double-Click option must be selectedin EPM > Options > User Options).
• If the cell on which you double-click is merged with other cells, the double-click will not function.
DescriptionParameter
Name of the connection.
This is optional. If not specified, the active connection is taken into account.
Note:
• For better performance, SAP recommends that you always enter a connec-tion name.
• You also have the option to enter the name of a model instead of the con-nection name, provided that you are not connected to other models thathave the exact same name.
connection name
dimension name. Mandatory.dimension
Filter by property to return only members with specified property values. Op-tional.
filter
Displays the same member name as the one displayed the Context bar. Op-tional.
If you enter FALSE or do not specify anything, the ID of the member is displayedin the cell.
If you enter TRUE, the member name that is displayed in the cell is the samemember name as the one displayed in the Context bar.
context membername
Example:
EPMContextMember("Finance","Entity","CALC=N;GROUP=SALES"). For the Financial Consolidationconnection, the context member of the dimension Entity is displayed in the cell. If you double-click thecell, a dialog box displays a list of all entity members filtered by CALC=N and by GROUP=SALES.
32.11 EPMDimensionProperty
This function retrieves the properties of a specified dimension in a specified cell range.
2013-01-30236
EPM Functions
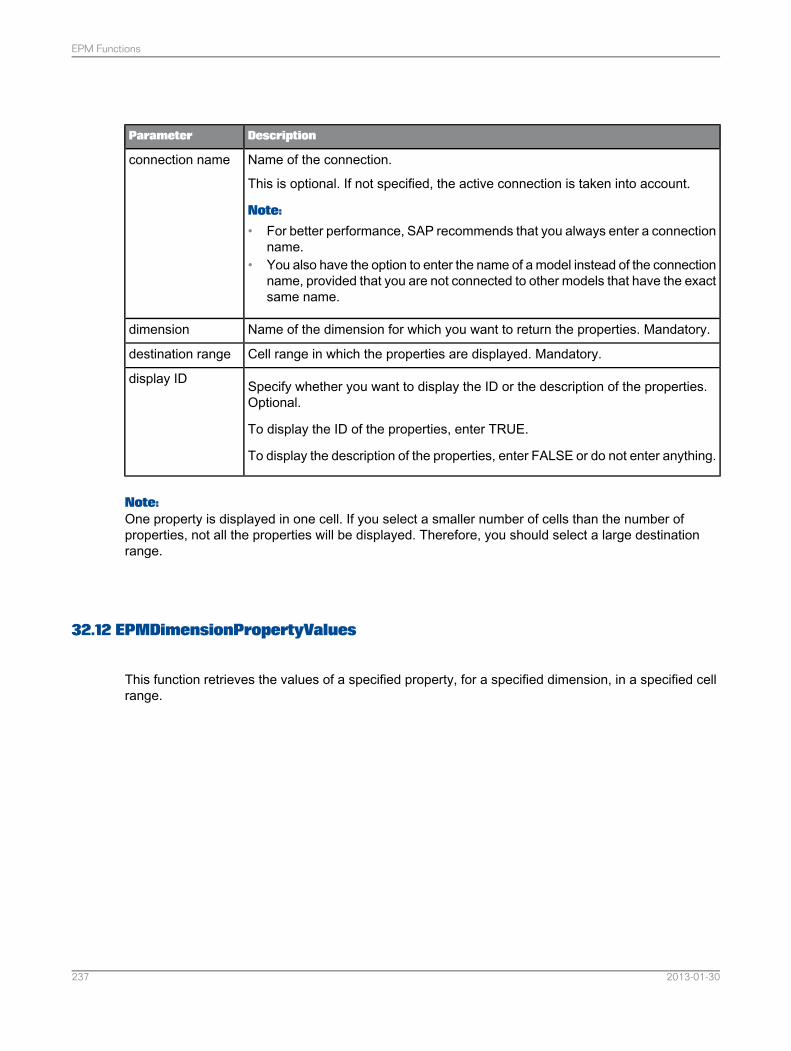
DescriptionParameter
Name of the connection.
This is optional. If not specified, the active connection is taken into account.
Note:
• For better performance, SAP recommends that you always enter a connectionname.
• You also have the option to enter the name of a model instead of the connectionname, provided that you are not connected to other models that have the exactsame name.
connection name
Name of the dimension for which you want to return the properties. Mandatory.dimension
Cell range in which the properties are displayed. Mandatory.destination range
Specify whether you want to display the ID or the description of the properties.Optional.
To display the ID of the properties, enter TRUE.
To display the description of the properties, enter FALSE or do not enter anything.
display ID
Note:One property is displayed in one cell. If you select a smaller number of cells than the number ofproperties, not all the properties will be displayed. Therefore, you should select a large destinationrange.
32.12 EPMDimensionPropertyValues
This function retrieves the values of a specified property, for a specified dimension, in a specified cellrange.
2013-01-30237
EPM Functions
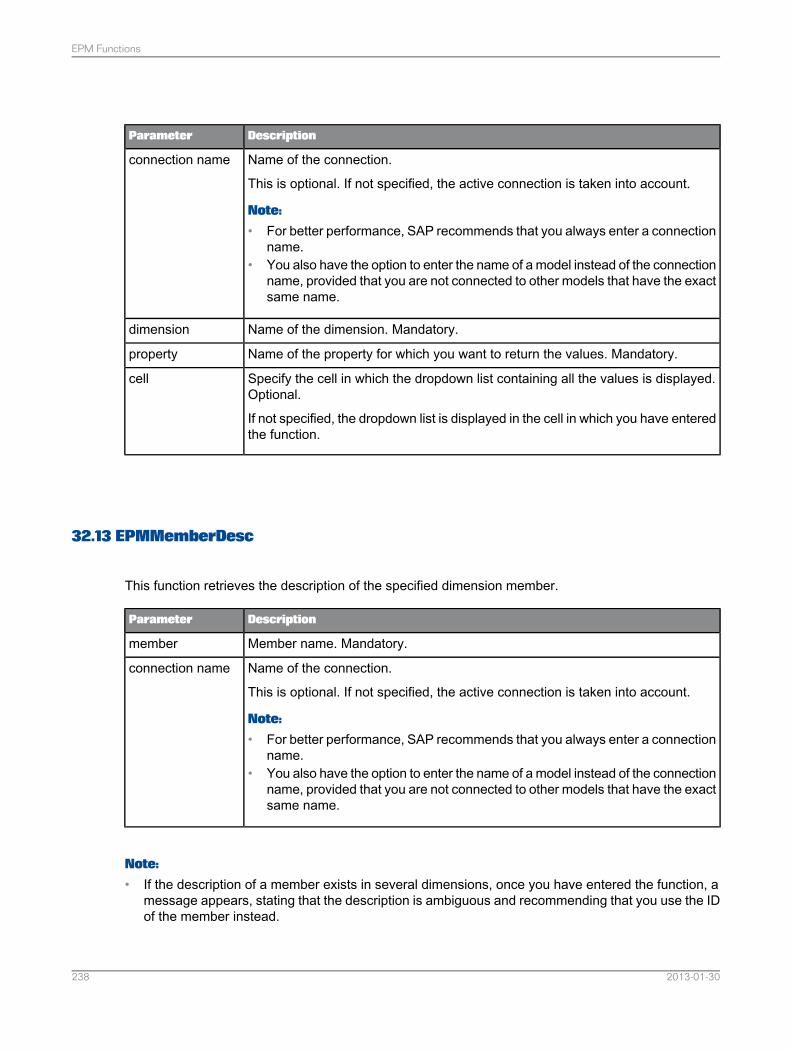
DescriptionParameter
Name of the connection.
This is optional. If not specified, the active connection is taken into account.
Note:
• For better performance, SAP recommends that you always enter a connectionname.
• You also have the option to enter the name of a model instead of the connectionname, provided that you are not connected to other models that have the exactsame name.
connection name
Name of the dimension. Mandatory.dimension
Name of the property for which you want to return the values. Mandatory.property
Specify the cell in which the dropdown list containing all the values is displayed.Optional.
If not specified, the dropdown list is displayed in the cell in which you have enteredthe function.
cell
32.13 EPMMemberDesc
This function retrieves the description of the specified dimension member.
DescriptionParameter
Member name. Mandatory.member
Name of the connection.
This is optional. If not specified, the active connection is taken into account.
Note:
• For better performance, SAP recommends that you always enter a connectionname.
• You also have the option to enter the name of a model instead of the connectionname, provided that you are not connected to other models that have the exactsame name.
connection name
Note:
• If the description of a member exists in several dimensions, once you have entered the function, amessage appears, stating that the description is ambiguous and recommending that you use the IDof the member instead.
2013-01-30238
EPM Functions
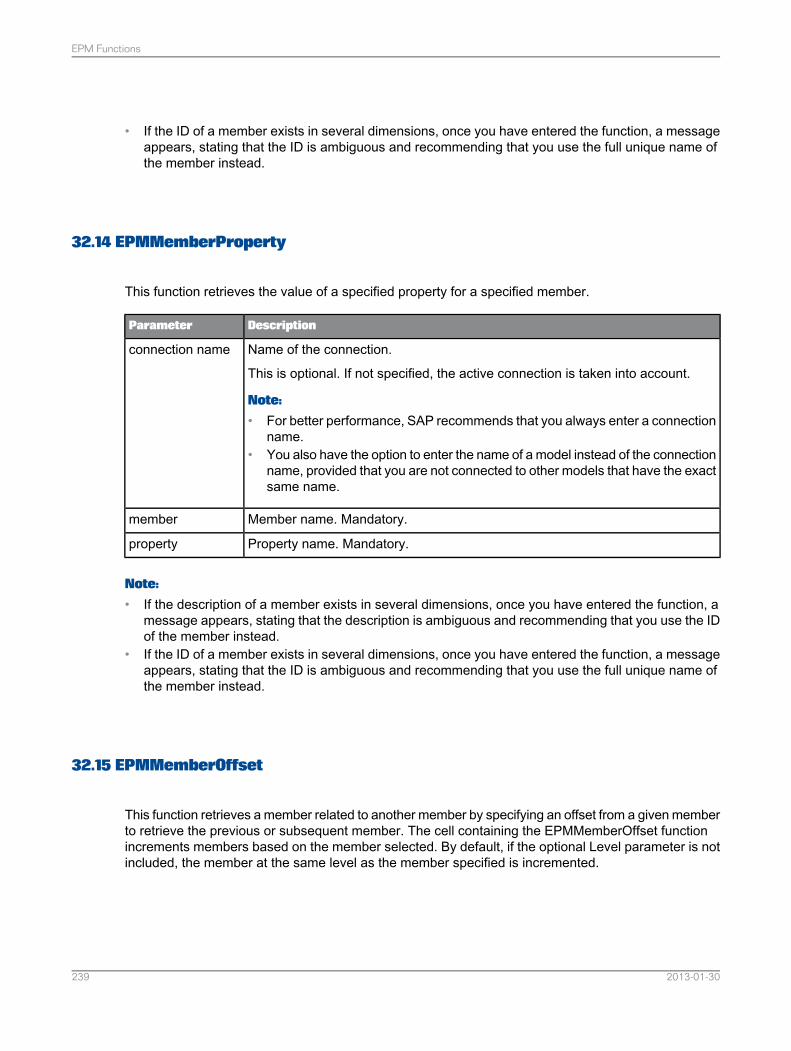
• If the ID of a member exists in several dimensions, once you have entered the function, a messageappears, stating that the ID is ambiguous and recommending that you use the full unique name ofthe member instead.
32.14 EPMMemberProperty
This function retrieves the value of a specified property for a specified member.
DescriptionParameter
Name of the connection.
This is optional. If not specified, the active connection is taken into account.
Note:
• For better performance, SAP recommends that you always enter a connectionname.
• You also have the option to enter the name of a model instead of the connectionname, provided that you are not connected to other models that have the exactsame name.
connection name
Member name. Mandatory.member
Property name. Mandatory.property
Note:
• If the description of a member exists in several dimensions, once you have entered the function, amessage appears, stating that the description is ambiguous and recommending that you use the IDof the member instead.
• If the ID of a member exists in several dimensions, once you have entered the function, a messageappears, stating that the ID is ambiguous and recommending that you use the full unique name ofthe member instead.
32.15 EPMMemberOffset
This function retrieves a member related to another member by specifying an offset from a given memberto retrieve the previous or subsequent member. The cell containing the EPMMemberOffset functionincrements members based on the member selected. By default, if the optional Level parameter is notincluded, the member at the same level as the member specified is incremented.
2013-01-30239
EPM Functions
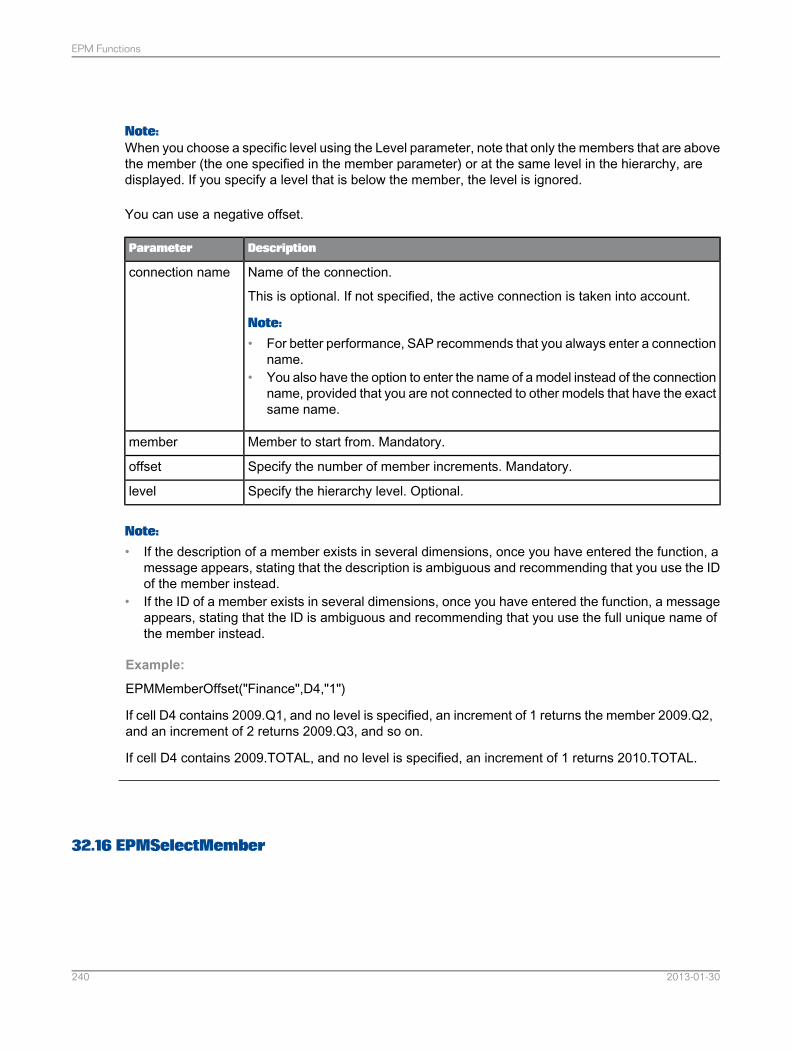
Note:When you choose a specific level using the Level parameter, note that only the members that are abovethe member (the one specified in the member parameter) or at the same level in the hierarchy, aredisplayed. If you specify a level that is below the member, the level is ignored.
You can use a negative offset.
DescriptionParameter
Name of the connection.
This is optional. If not specified, the active connection is taken into account.
Note:
• For better performance, SAP recommends that you always enter a connectionname.
• You also have the option to enter the name of a model instead of the connectionname, provided that you are not connected to other models that have the exactsame name.
connection name
Member to start from. Mandatory.member
Specify the number of member increments. Mandatory.offset
Specify the hierarchy level. Optional.level
Note:
• If the description of a member exists in several dimensions, once you have entered the function, amessage appears, stating that the description is ambiguous and recommending that you use the IDof the member instead.
• If the ID of a member exists in several dimensions, once you have entered the function, a messageappears, stating that the ID is ambiguous and recommending that you use the full unique name ofthe member instead.
Example:
EPMMemberOffset("Finance",D4,"1")
If cell D4 contains 2009.Q1, and no level is specified, an increment of 1 returns the member 2009.Q2,and an increment of 2 returns 2009.Q3, and so on.
If cell D4 contains 2009.TOTAL, and no level is specified, an increment of 1 returns 2010.TOTAL.
32.16 EPMSelectMember
2013-01-30240
EPM Functions
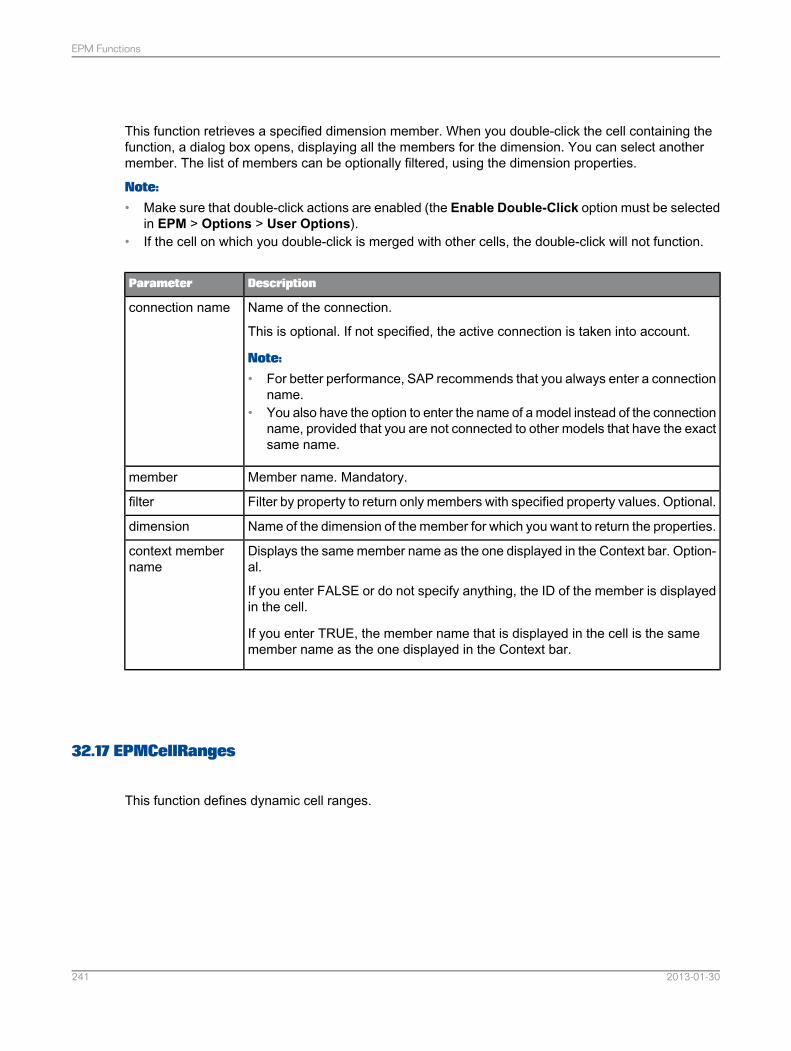
This function retrieves a specified dimension member. When you double-click the cell containing thefunction, a dialog box opens, displaying all the members for the dimension. You can select anothermember. The list of members can be optionally filtered, using the dimension properties.
Note:
• Make sure that double-click actions are enabled (the Enable Double-Click option must be selectedin EPM > Options > User Options).
• If the cell on which you double-click is merged with other cells, the double-click will not function.
DescriptionParameter
Name of the connection.
This is optional. If not specified, the active connection is taken into account.
Note:
• For better performance, SAP recommends that you always enter a connectionname.
• You also have the option to enter the name of a model instead of the connectionname, provided that you are not connected to other models that have the exactsame name.
connection name
Member name. Mandatory.member
Filter by property to return only members with specified property values. Optional.filter
Name of the dimension of the member for which you want to return the properties.dimension
Displays the same member name as the one displayed in the Context bar. Option-al.
If you enter FALSE or do not specify anything, the ID of the member is displayedin the cell.
If you enter TRUE, the member name that is displayed in the cell is the samemember name as the one displayed in the Context bar.
context membername
32.17 EPMCellRanges
This function defines dynamic cell ranges.
2013-01-30241
EPM Functions
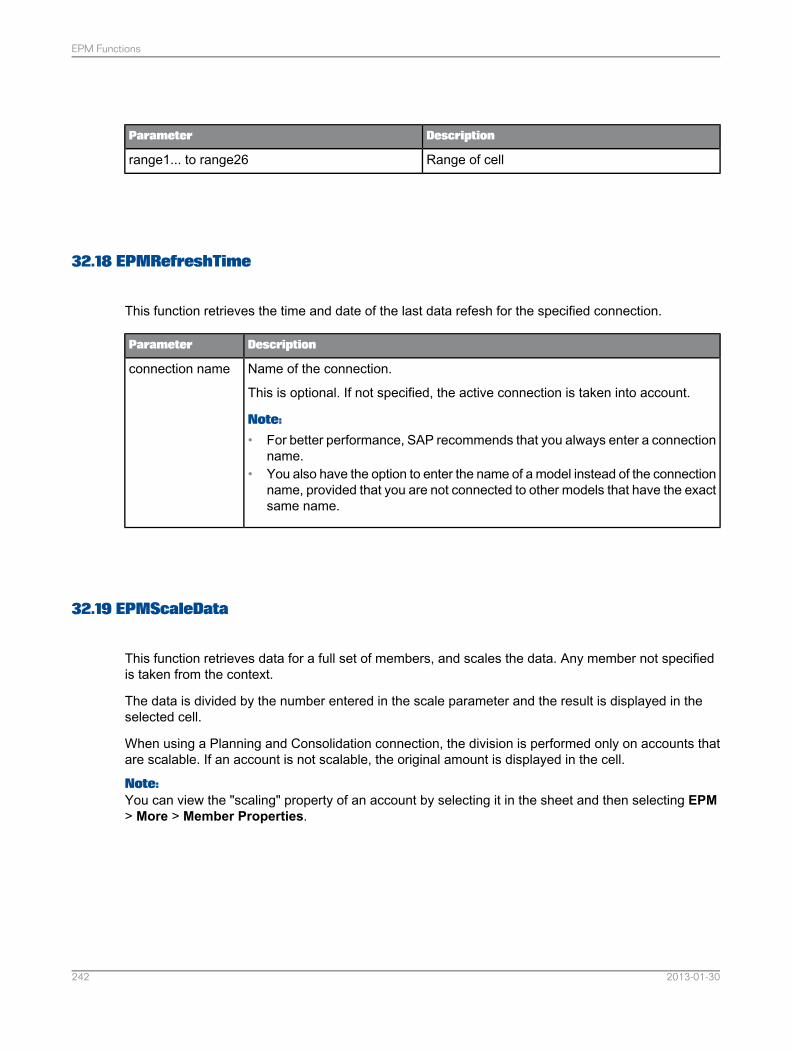
DescriptionParameter
Range of cellrange1... to range26
32.18 EPMRefreshTime
This function retrieves the time and date of the last data refesh for the specified connection.
DescriptionParameter
Name of the connection.
This is optional. If not specified, the active connection is taken into account.
Note:
• For better performance, SAP recommends that you always enter a connectionname.
• You also have the option to enter the name of a model instead of the connectionname, provided that you are not connected to other models that have the exactsame name.
connection name
32.19 EPMScaleData
This function retrieves data for a full set of members, and scales the data. Any member not specifiedis taken from the context.
The data is divided by the number entered in the scale parameter and the result is displayed in theselected cell.
When using a Planning and Consolidation connection, the division is performed only on accounts thatare scalable. If an account is not scalable, the original amount is displayed in the cell.
Note:You can view the "scaling" property of an account by selecting it in the sheet and then selecting EPM> More > Member Properties.
2013-01-30242
EPM Functions
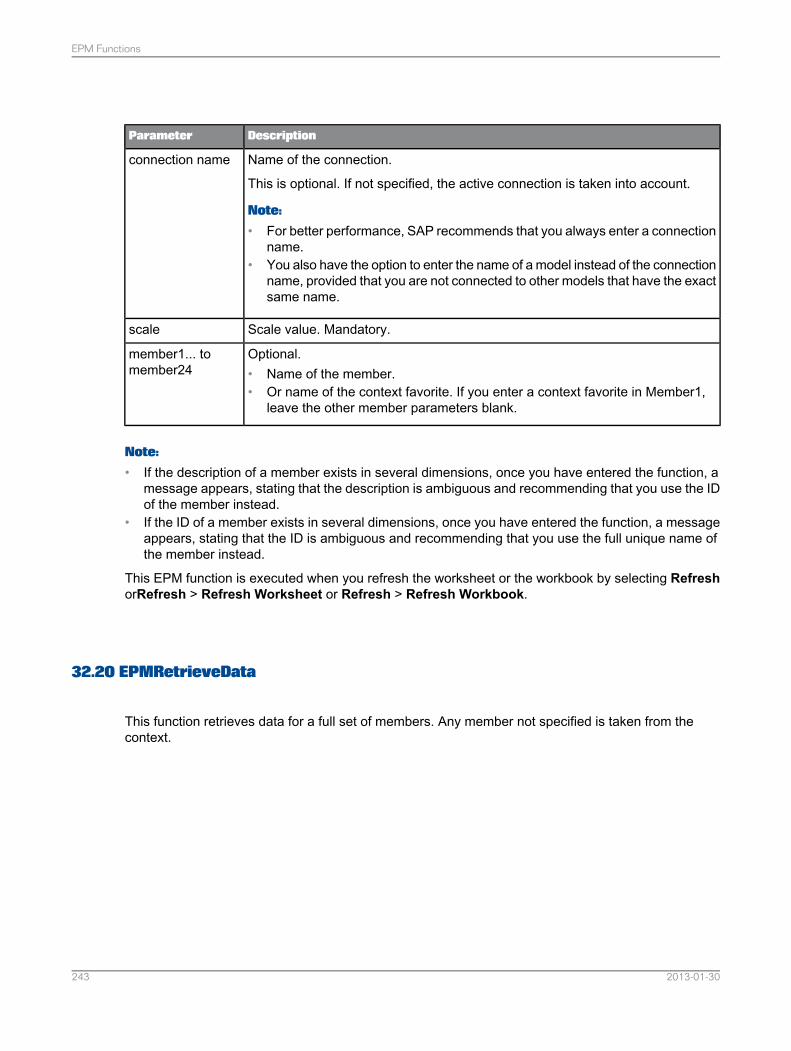
DescriptionParameter
Name of the connection.
This is optional. If not specified, the active connection is taken into account.
Note:
• For better performance, SAP recommends that you always enter a connectionname.
• You also have the option to enter the name of a model instead of the connectionname, provided that you are not connected to other models that have the exactsame name.
connection name
Scale value. Mandatory.scale
Optional.• Name of the member.• Or name of the context favorite. If you enter a context favorite in Member1,
leave the other member parameters blank.
member1... tomember24
Note:
• If the description of a member exists in several dimensions, once you have entered the function, amessage appears, stating that the description is ambiguous and recommending that you use the IDof the member instead.
• If the ID of a member exists in several dimensions, once you have entered the function, a messageappears, stating that the ID is ambiguous and recommending that you use the full unique name ofthe member instead.
This EPM function is executed when you refresh the worksheet or the workbook by selecting RefreshorRefresh > Refresh Worksheet or Refresh > Refresh Workbook.
32.20 EPMRetrieveData
This function retrieves data for a full set of members. Any member not specified is taken from thecontext.
2013-01-30243
EPM Functions
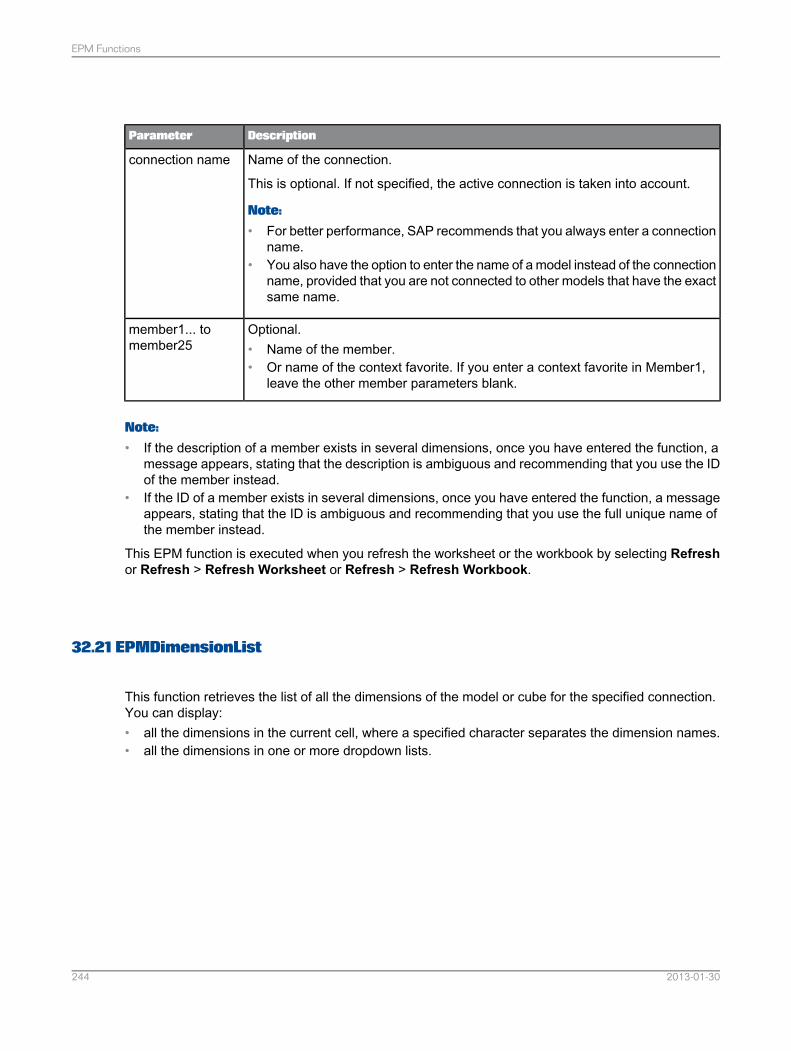
DescriptionParameter
Name of the connection.
This is optional. If not specified, the active connection is taken into account.
Note:
• For better performance, SAP recommends that you always enter a connectionname.
• You also have the option to enter the name of a model instead of the connectionname, provided that you are not connected to other models that have the exactsame name.
connection name
Optional.• Name of the member.• Or name of the context favorite. If you enter a context favorite in Member1,
leave the other member parameters blank.
member1... tomember25
Note:
• If the description of a member exists in several dimensions, once you have entered the function, amessage appears, stating that the description is ambiguous and recommending that you use the IDof the member instead.
• If the ID of a member exists in several dimensions, once you have entered the function, a messageappears, stating that the ID is ambiguous and recommending that you use the full unique name ofthe member instead.
This EPM function is executed when you refresh the worksheet or the workbook by selecting Refreshor Refresh > Refresh Worksheet or Refresh > Refresh Workbook.
32.21 EPMDimensionList
This function retrieves the list of all the dimensions of the model or cube for the specified connection.You can display:• all the dimensions in the current cell, where a specified character separates the dimension names.• all the dimensions in one or more dropdown lists.
2013-01-30244
EPM Functions
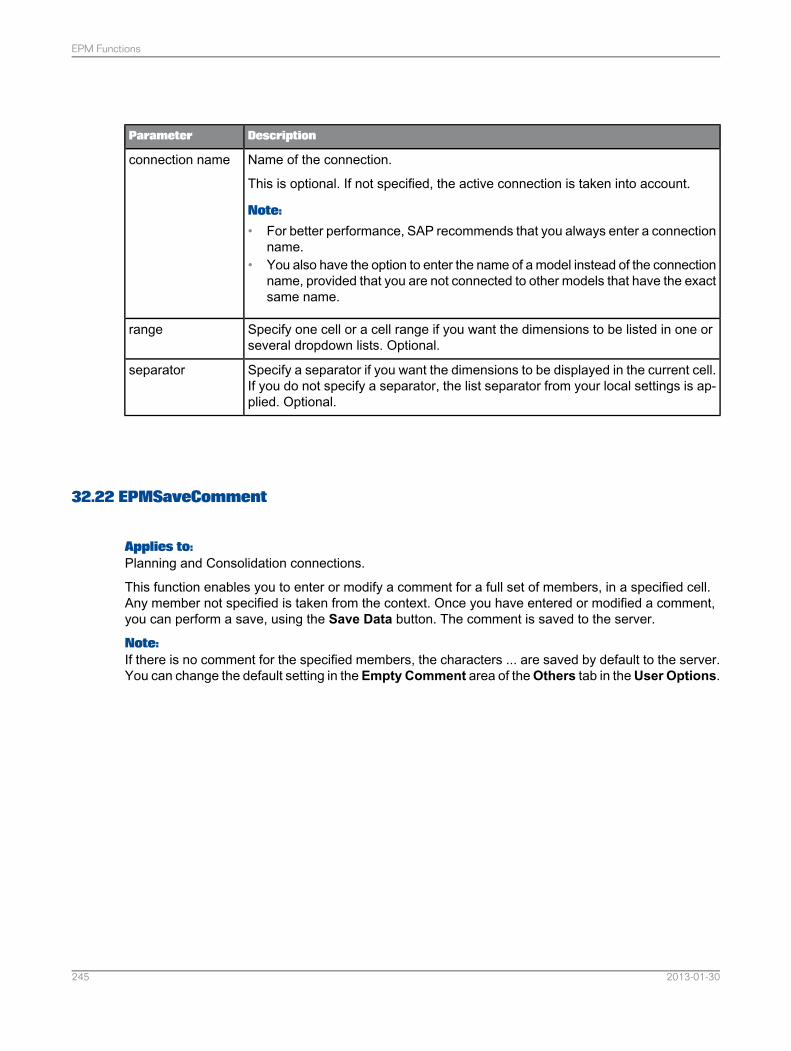
DescriptionParameter
Name of the connection.
This is optional. If not specified, the active connection is taken into account.
Note:
• For better performance, SAP recommends that you always enter a connectionname.
• You also have the option to enter the name of a model instead of the connectionname, provided that you are not connected to other models that have the exactsame name.
connection name
Specify one cell or a cell range if you want the dimensions to be listed in one orseveral dropdown lists. Optional.
range
Specify a separator if you want the dimensions to be displayed in the current cell.If you do not specify a separator, the list separator from your local settings is ap-plied. Optional.
separator
32.22 EPMSaveComment
Applies to:Planning and Consolidation connections.
This function enables you to enter or modify a comment for a full set of members, in a specified cell.Any member not specified is taken from the context. Once you have entered or modified a comment,you can perform a save, using the Save Data button. The comment is saved to the server.
Note:If there is no comment for the specified members, the characters ... are saved by default to the server.You can change the default setting in the Empty Comment area of theOthers tab in theUser Options.
2013-01-30245
EPM Functions
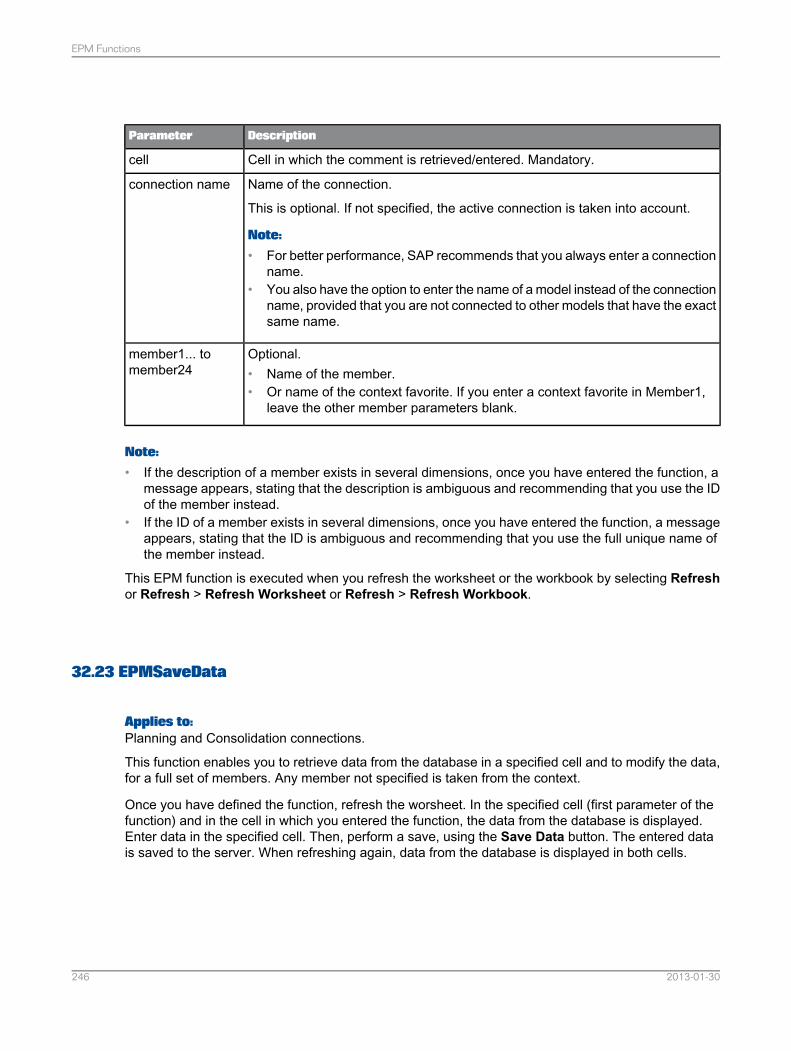
DescriptionParameter
Cell in which the comment is retrieved/entered. Mandatory.cell
Name of the connection.
This is optional. If not specified, the active connection is taken into account.
Note:
• For better performance, SAP recommends that you always enter a connectionname.
• You also have the option to enter the name of a model instead of the connectionname, provided that you are not connected to other models that have the exactsame name.
connection name
Optional.• Name of the member.• Or name of the context favorite. If you enter a context favorite in Member1,
leave the other member parameters blank.
member1... tomember24
Note:
• If the description of a member exists in several dimensions, once you have entered the function, amessage appears, stating that the description is ambiguous and recommending that you use the IDof the member instead.
• If the ID of a member exists in several dimensions, once you have entered the function, a messageappears, stating that the ID is ambiguous and recommending that you use the full unique name ofthe member instead.
This EPM function is executed when you refresh the worksheet or the workbook by selecting Refreshor Refresh > Refresh Worksheet or Refresh > Refresh Workbook.
32.23 EPMSaveData
Applies to:Planning and Consolidation connections.
This function enables you to retrieve data from the database in a specified cell and to modify the data,for a full set of members. Any member not specified is taken from the context.
Once you have defined the function, refresh the worsheet. In the specified cell (first parameter of thefunction) and in the cell in which you entered the function, the data from the database is displayed.Enter data in the specified cell. Then, perform a save, using the Save Data button. The entered datais saved to the server. When refreshing again, data from the database is displayed in both cells.
2013-01-30246
EPM Functions
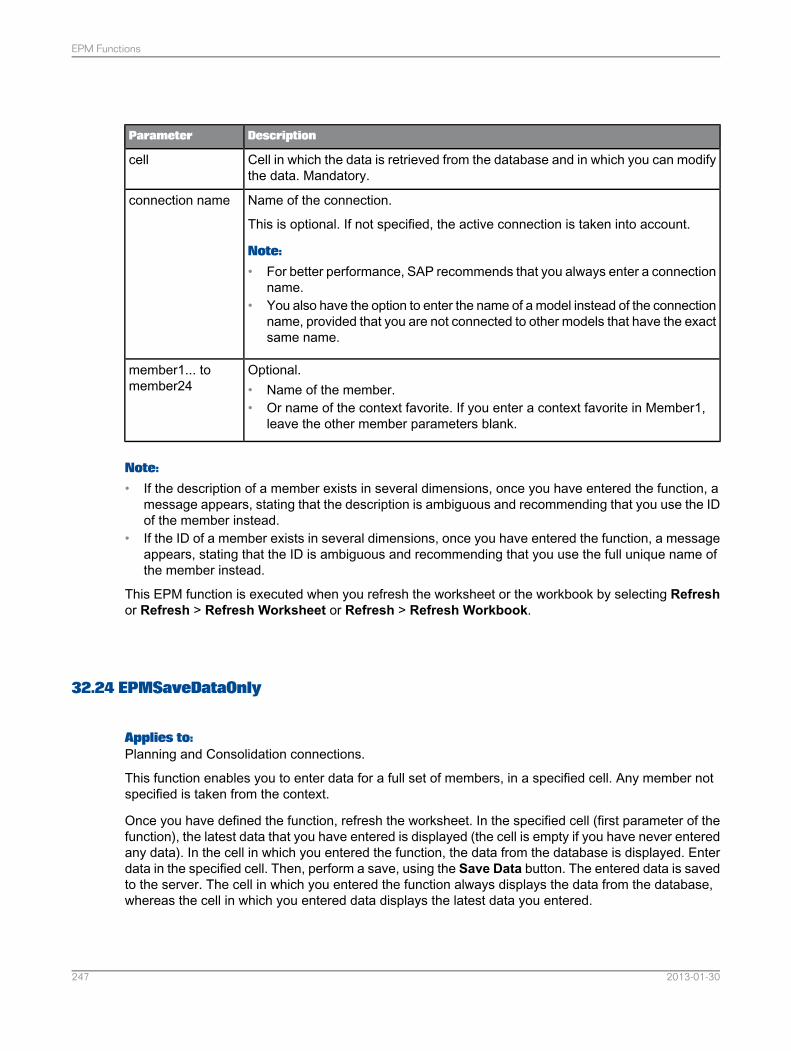
DescriptionParameter
Cell in which the data is retrieved from the database and in which you can modifythe data. Mandatory.
cell
Name of the connection.
This is optional. If not specified, the active connection is taken into account.
Note:
• For better performance, SAP recommends that you always enter a connectionname.
• You also have the option to enter the name of a model instead of the connectionname, provided that you are not connected to other models that have the exactsame name.
connection name
Optional.• Name of the member.• Or name of the context favorite. If you enter a context favorite in Member1,
leave the other member parameters blank.
member1... tomember24
Note:
• If the description of a member exists in several dimensions, once you have entered the function, amessage appears, stating that the description is ambiguous and recommending that you use the IDof the member instead.
• If the ID of a member exists in several dimensions, once you have entered the function, a messageappears, stating that the ID is ambiguous and recommending that you use the full unique name ofthe member instead.
This EPM function is executed when you refresh the worksheet or the workbook by selecting Refreshor Refresh > Refresh Worksheet or Refresh > Refresh Workbook.
32.24 EPMSaveDataOnly
Applies to:Planning and Consolidation connections.
This function enables you to enter data for a full set of members, in a specified cell. Any member notspecified is taken from the context.
Once you have defined the function, refresh the worksheet. In the specified cell (first parameter of thefunction), the latest data that you have entered is displayed (the cell is empty if you have never enteredany data). In the cell in which you entered the function, the data from the database is displayed. Enterdata in the specified cell. Then, perform a save, using the Save Data button. The entered data is savedto the server. The cell in which you entered the function always displays the data from the database,whereas the cell in which you entered data displays the latest data you entered.
2013-01-30247
EPM Functions
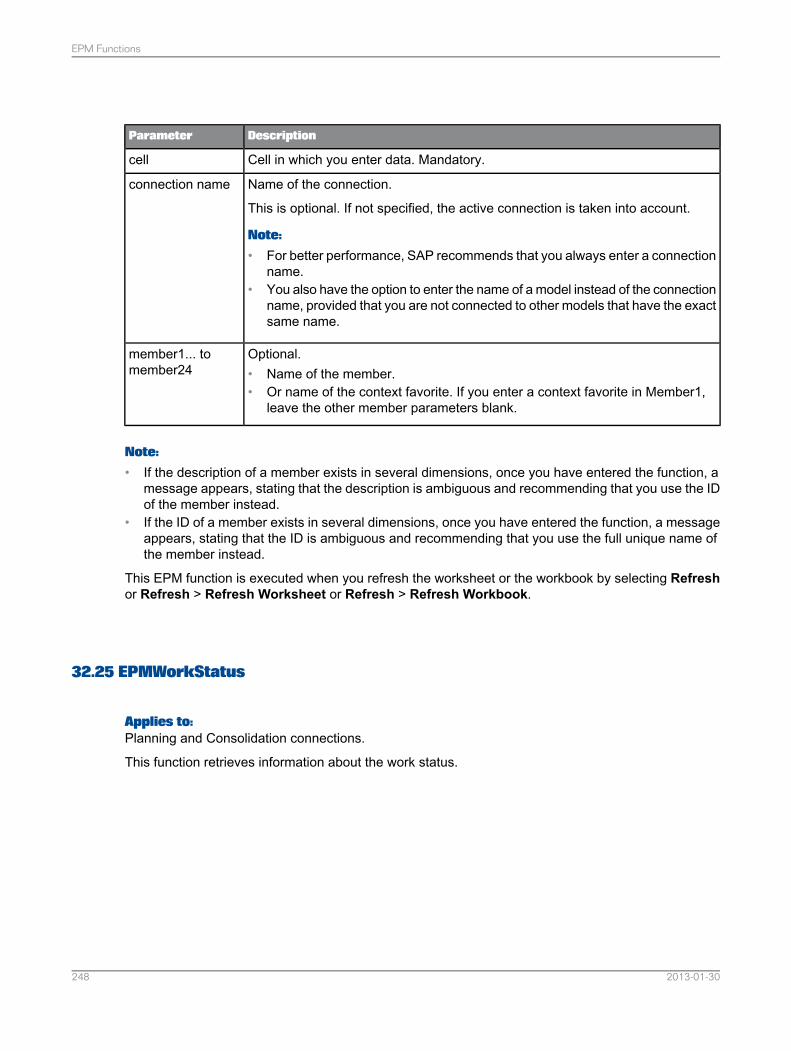
DescriptionParameter
Cell in which you enter data. Mandatory.cell
Name of the connection.
This is optional. If not specified, the active connection is taken into account.
Note:
• For better performance, SAP recommends that you always enter a connectionname.
• You also have the option to enter the name of a model instead of the connectionname, provided that you are not connected to other models that have the exactsame name.
connection name
Optional.• Name of the member.• Or name of the context favorite. If you enter a context favorite in Member1,
leave the other member parameters blank.
member1... tomember24
Note:
• If the description of a member exists in several dimensions, once you have entered the function, amessage appears, stating that the description is ambiguous and recommending that you use the IDof the member instead.
• If the ID of a member exists in several dimensions, once you have entered the function, a messageappears, stating that the ID is ambiguous and recommending that you use the full unique name ofthe member instead.
This EPM function is executed when you refresh the worksheet or the workbook by selecting Refreshor Refresh > Refresh Worksheet or Refresh > Refresh Workbook.
32.25 EPMWorkStatus
Applies to:Planning and Consolidation connections.
This function retrieves information about the work status.
2013-01-30248
EPM Functions
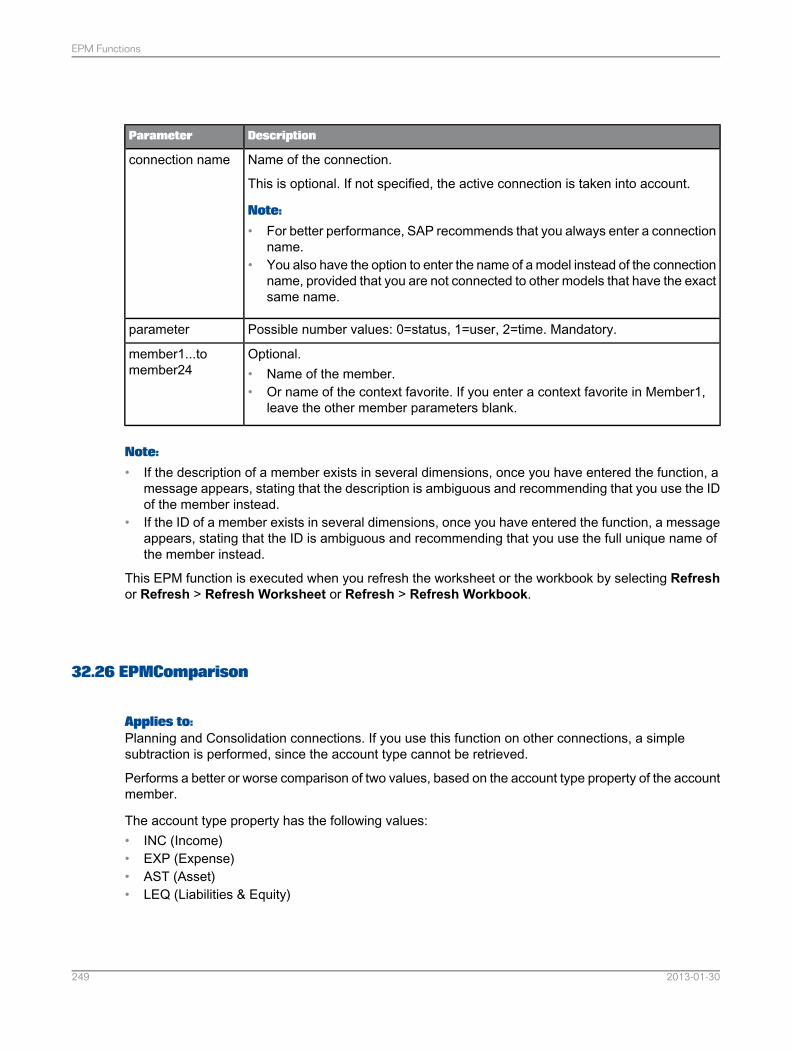
DescriptionParameter
Name of the connection.
This is optional. If not specified, the active connection is taken into account.
Note:
• For better performance, SAP recommends that you always enter a connectionname.
• You also have the option to enter the name of a model instead of the connectionname, provided that you are not connected to other models that have the exactsame name.
connection name
Possible number values: 0=status, 1=user, 2=time. Mandatory.parameter
Optional.• Name of the member.• Or name of the context favorite. If you enter a context favorite in Member1,
leave the other member parameters blank.
member1...tomember24
Note:
• If the description of a member exists in several dimensions, once you have entered the function, amessage appears, stating that the description is ambiguous and recommending that you use the IDof the member instead.
• If the ID of a member exists in several dimensions, once you have entered the function, a messageappears, stating that the ID is ambiguous and recommending that you use the full unique name ofthe member instead.
This EPM function is executed when you refresh the worksheet or the workbook by selecting Refreshor Refresh > Refresh Worksheet or Refresh > Refresh Workbook.
32.26 EPMComparison
Applies to:Planning and Consolidation connections. If you use this function on other connections, a simplesubtraction is performed, since the account type cannot be retrieved.
Performs a better or worse comparison of two values, based on the account type property of the accountmember.
The account type property has the following values:• INC (Income)• EXP (Expense)• AST (Asset)• LEQ (Liabilities & Equity)
2013-01-30249
EPM Functions
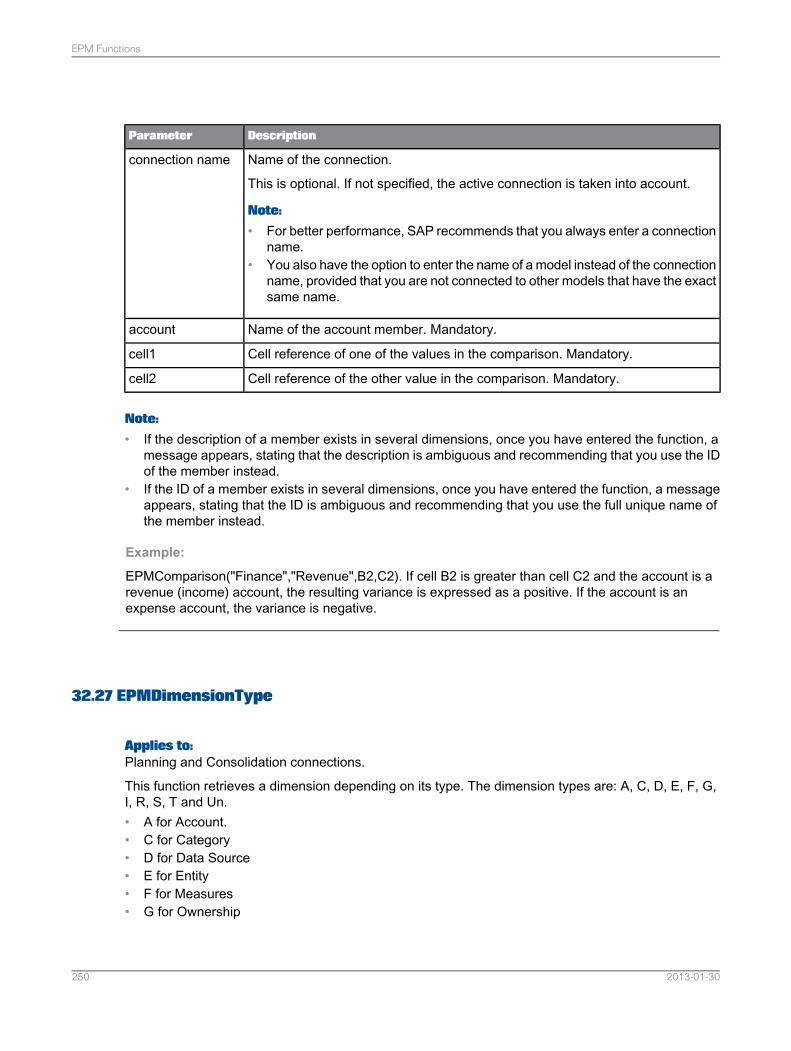
DescriptionParameter
Name of the connection.
This is optional. If not specified, the active connection is taken into account.
Note:
• For better performance, SAP recommends that you always enter a connectionname.
• You also have the option to enter the name of a model instead of the connectionname, provided that you are not connected to other models that have the exactsame name.
connection name
Name of the account member. Mandatory.account
Cell reference of one of the values in the comparison. Mandatory.cell1
Cell reference of the other value in the comparison. Mandatory.cell2
Note:
• If the description of a member exists in several dimensions, once you have entered the function, amessage appears, stating that the description is ambiguous and recommending that you use the IDof the member instead.
• If the ID of a member exists in several dimensions, once you have entered the function, a messageappears, stating that the ID is ambiguous and recommending that you use the full unique name ofthe member instead.
Example:
EPMComparison("Finance","Revenue",B2,C2). If cell B2 is greater than cell C2 and the account is arevenue (income) account, the resulting variance is expressed as a positive. If the account is anexpense account, the variance is negative.
32.27 EPMDimensionType
Applies to:Planning and Consolidation connections.
This function retrieves a dimension depending on its type. The dimension types are: A, C, D, E, F, G,I, R, S, T and Un.• A for Account.• C for Category• D for Data Source• E for Entity• F for Measures• G for Ownership
2013-01-30250
EPM Functions
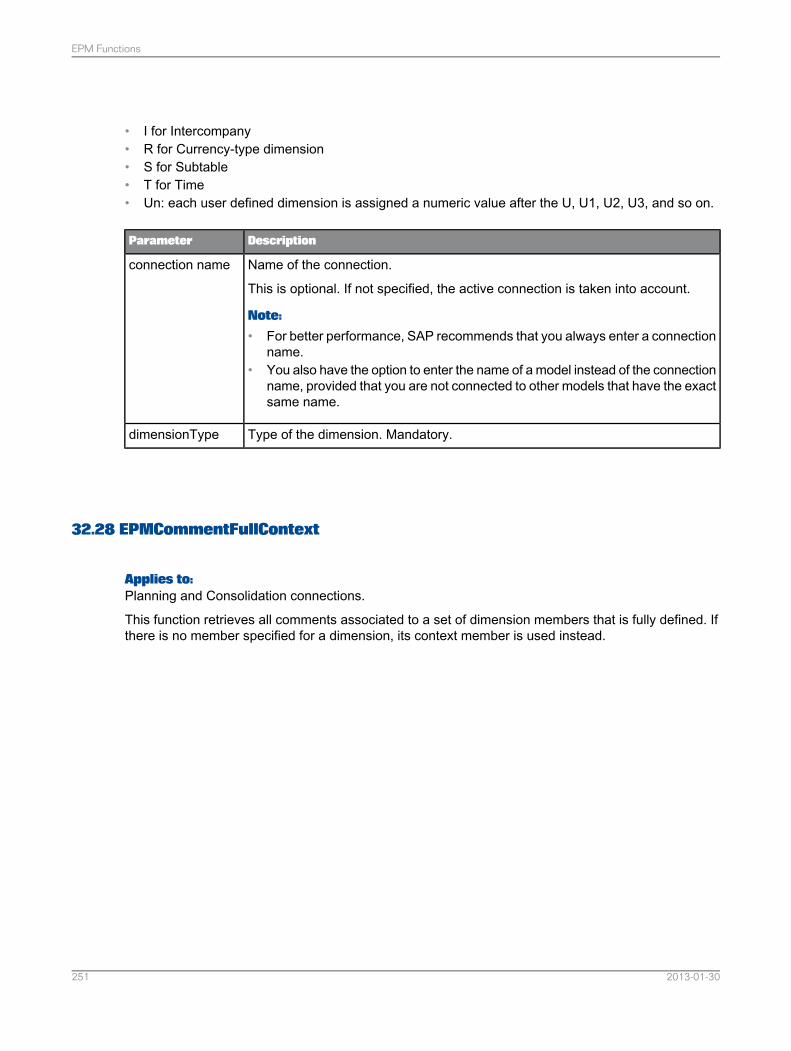
• I for Intercompany• R for Currency-type dimension• S for Subtable• T for Time• Un: each user defined dimension is assigned a numeric value after the U, U1, U2, U3, and so on.
DescriptionParameter
Name of the connection.
This is optional. If not specified, the active connection is taken into account.
Note:
• For better performance, SAP recommends that you always enter a connectionname.
• You also have the option to enter the name of a model instead of the connectionname, provided that you are not connected to other models that have the exactsame name.
connection name
Type of the dimension. Mandatory.dimensionType
32.28 EPMCommentFullContext
Applies to:Planning and Consolidation connections.
This function retrieves all comments associated to a set of dimension members that is fully defined. Ifthere is no member specified for a dimension, its context member is used instead.
2013-01-30251
EPM Functions
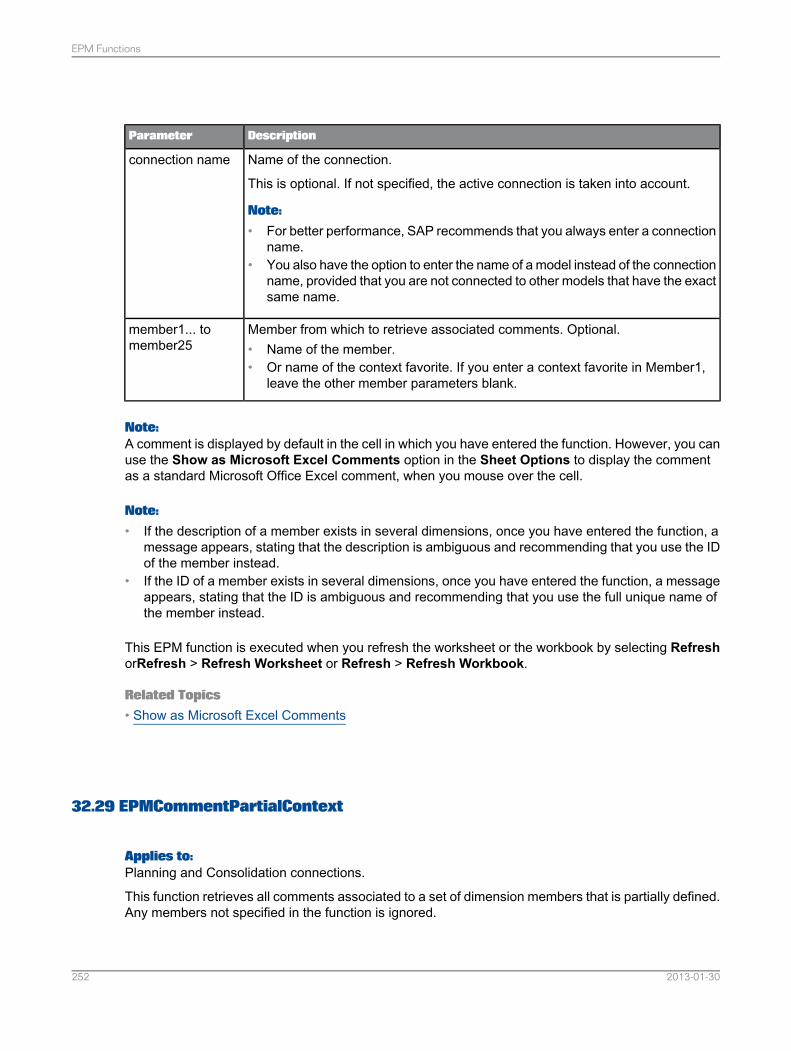
DescriptionParameter
Name of the connection.
This is optional. If not specified, the active connection is taken into account.
Note:
• For better performance, SAP recommends that you always enter a connectionname.
• You also have the option to enter the name of a model instead of the connectionname, provided that you are not connected to other models that have the exactsame name.
connection name
Member from which to retrieve associated comments. Optional.• Name of the member.• Or name of the context favorite. If you enter a context favorite in Member1,
leave the other member parameters blank.
member1... tomember25
Note:A comment is displayed by default in the cell in which you have entered the function. However, you canuse the Show as Microsoft Excel Comments option in the Sheet Options to display the commentas a standard Microsoft Office Excel comment, when you mouse over the cell.
Note:
• If the description of a member exists in several dimensions, once you have entered the function, amessage appears, stating that the description is ambiguous and recommending that you use the IDof the member instead.
• If the ID of a member exists in several dimensions, once you have entered the function, a messageappears, stating that the ID is ambiguous and recommending that you use the full unique name ofthe member instead.
This EPM function is executed when you refresh the worksheet or the workbook by selecting RefreshorRefresh > Refresh Worksheet or Refresh > Refresh Workbook.
Related Topics• Show as Microsoft Excel Comments
32.29 EPMCommentPartialContext
Applies to:Planning and Consolidation connections.
This function retrieves all comments associated to a set of dimension members that is partially defined.Any members not specified in the function is ignored.
2013-01-30252
EPM Functions
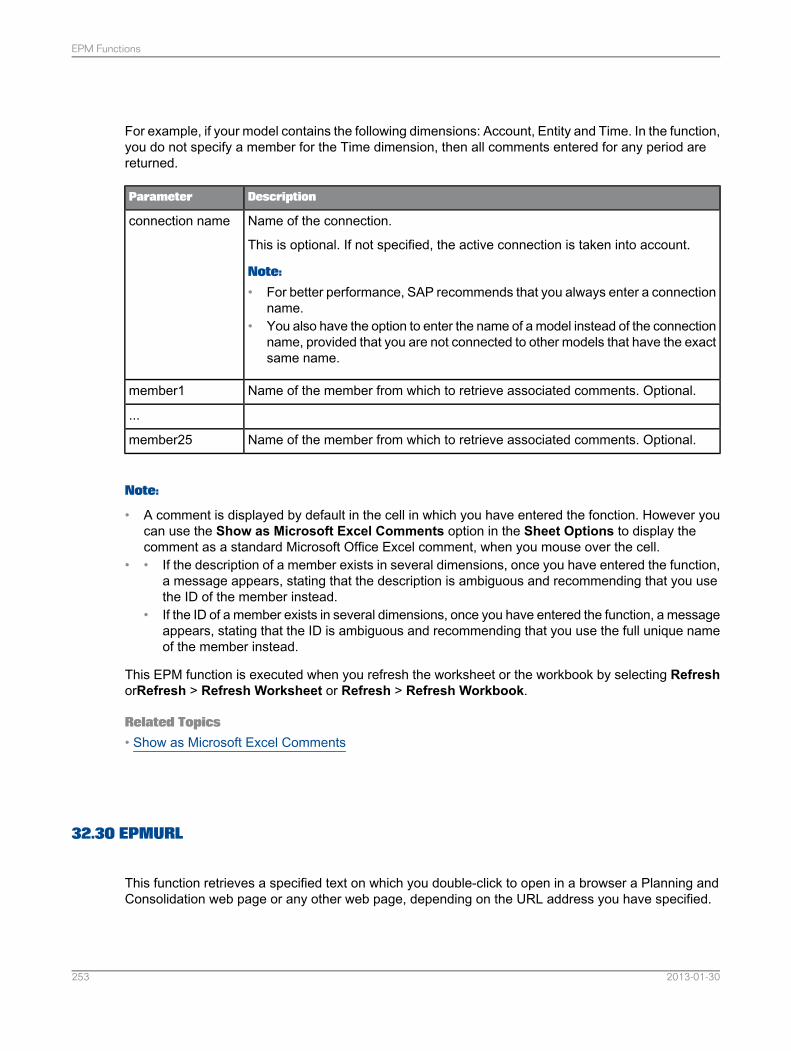
For example, if your model contains the following dimensions: Account, Entity and Time. In the function,you do not specify a member for the Time dimension, then all comments entered for any period arereturned.
DescriptionParameter
Name of the connection.
This is optional. If not specified, the active connection is taken into account.
Note:
• For better performance, SAP recommends that you always enter a connectionname.
• You also have the option to enter the name of a model instead of the connectionname, provided that you are not connected to other models that have the exactsame name.
connection name
Name of the member from which to retrieve associated comments. Optional.member1
...
Name of the member from which to retrieve associated comments. Optional.member25
Note:
• A comment is displayed by default in the cell in which you have entered the fonction. However youcan use the Show as Microsoft Excel Comments option in the Sheet Options to display thecomment as a standard Microsoft Office Excel comment, when you mouse over the cell.
• • If the description of a member exists in several dimensions, once you have entered the function,a message appears, stating that the description is ambiguous and recommending that you usethe ID of the member instead.
• If the ID of a member exists in several dimensions, once you have entered the function, a messageappears, stating that the ID is ambiguous and recommending that you use the full unique nameof the member instead.
This EPM function is executed when you refresh the worksheet or the workbook by selecting RefreshorRefresh > Refresh Worksheet or Refresh > Refresh Workbook.
Related Topics• Show as Microsoft Excel Comments
32.30 EPMURL
This function retrieves a specified text on which you double-click to open in a browser a Planning andConsolidation web page or any other web page, depending on the URL address you have specified.
2013-01-30253
EPM Functions
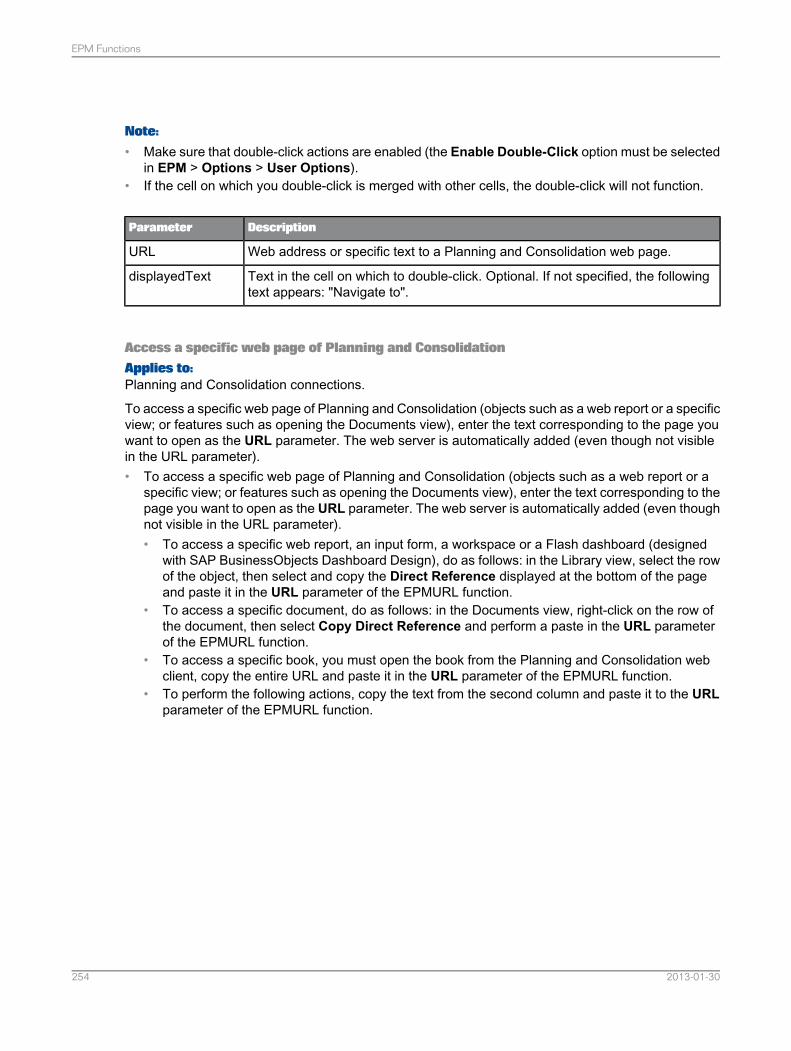
Note:
• Make sure that double-click actions are enabled (the Enable Double-Click option must be selectedin EPM > Options > User Options).
• If the cell on which you double-click is merged with other cells, the double-click will not function.
DescriptionParameter
Web address or specific text to a Planning and Consolidation web page.URL
Text in the cell on which to double-click. Optional. If not specified, the followingtext appears: "Navigate to".
displayedText
Access a specific web page of Planning and ConsolidationApplies to:Planning and Consolidation connections.
To access a specific web page of Planning and Consolidation (objects such as a web report or a specificview; or features such as opening the Documents view), enter the text corresponding to the page youwant to open as the URL parameter. The web server is automatically added (even though not visiblein the URL parameter).• To access a specific web page of Planning and Consolidation (objects such as a web report or a
specific view; or features such as opening the Documents view), enter the text corresponding to thepage you want to open as the URL parameter. The web server is automatically added (even thoughnot visible in the URL parameter).• To access a specific web report, an input form, a workspace or a Flash dashboard (designed
with SAP BusinessObjects Dashboard Design), do as follows: in the Library view, select the rowof the object, then select and copy the Direct Reference displayed at the bottom of the pageand paste it in the URL parameter of the EPMURL function.
• To access a specific document, do as follows: in the Documents view, right-click on the row ofthe document, then select Copy Direct Reference and perform a paste in the URL parameterof the EPMURL function.
• To access a specific book, you must open the book from the Planning and Consolidation webclient, copy the entire URL and paste it in the URL parameter of the EPMURL function.
• To perform the following actions, copy the text from the second column and paste it to the URLparameter of the EPMURL function.
2013-01-30254
EPM Functions
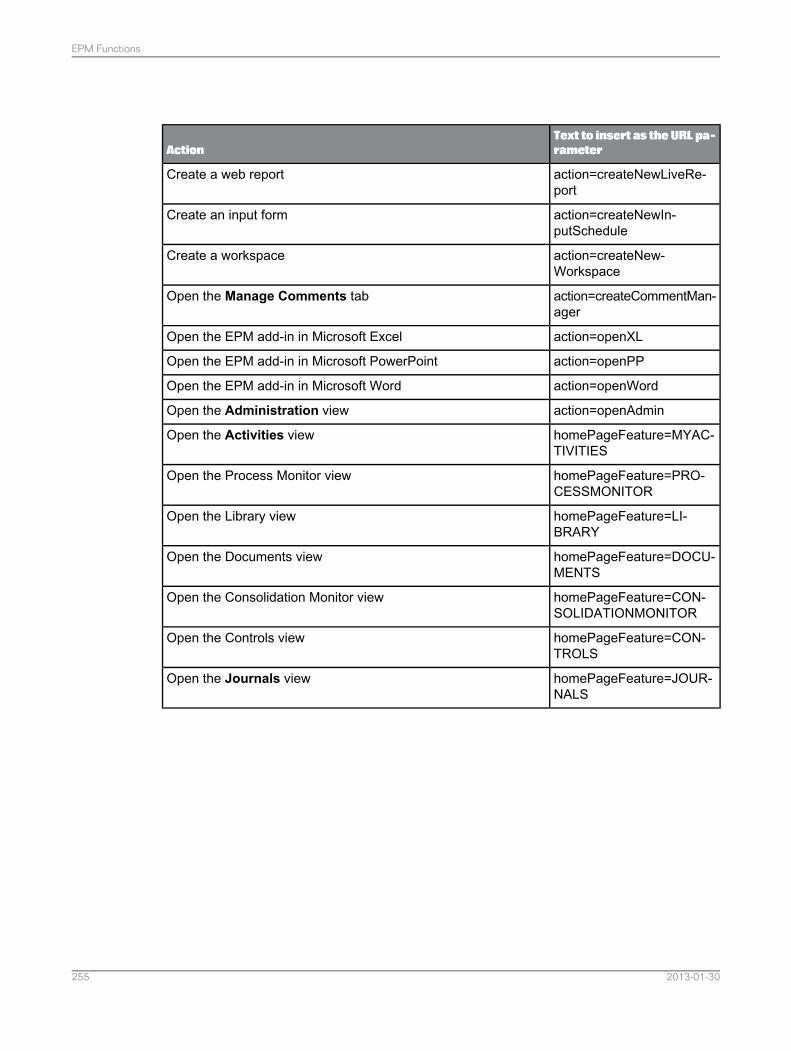
Text to insert as the URL pa-rameterAction
action=createNewLiveRe-port
Create a web report
action=createNewIn-putSchedule
Create an input form
action=createNew-Workspace
Create a workspace
action=createCommentMan-ager
Open the Manage Comments tab
action=openXLOpen the EPM add-in in Microsoft Excel
action=openPPOpen the EPM add-in in Microsoft PowerPoint
action=openWordOpen the EPM add-in in Microsoft Word
action=openAdminOpen the Administration view
homePageFeature=MYAC-TIVITIES
Open the Activities view
homePageFeature=PRO-CESSMONITOR
Open the Process Monitor view
homePageFeature=LI-BRARY
Open the Library view
homePageFeature=DOCU-MENTS
Open the Documents view
homePageFeature=CON-SOLIDATIONMONITOR
Open the Consolidation Monitor view
homePageFeature=CON-TROLS
Open the Controls view
homePageFeature=JOUR-NALS
Open the Journals view
2013-01-30255
EPM Functions
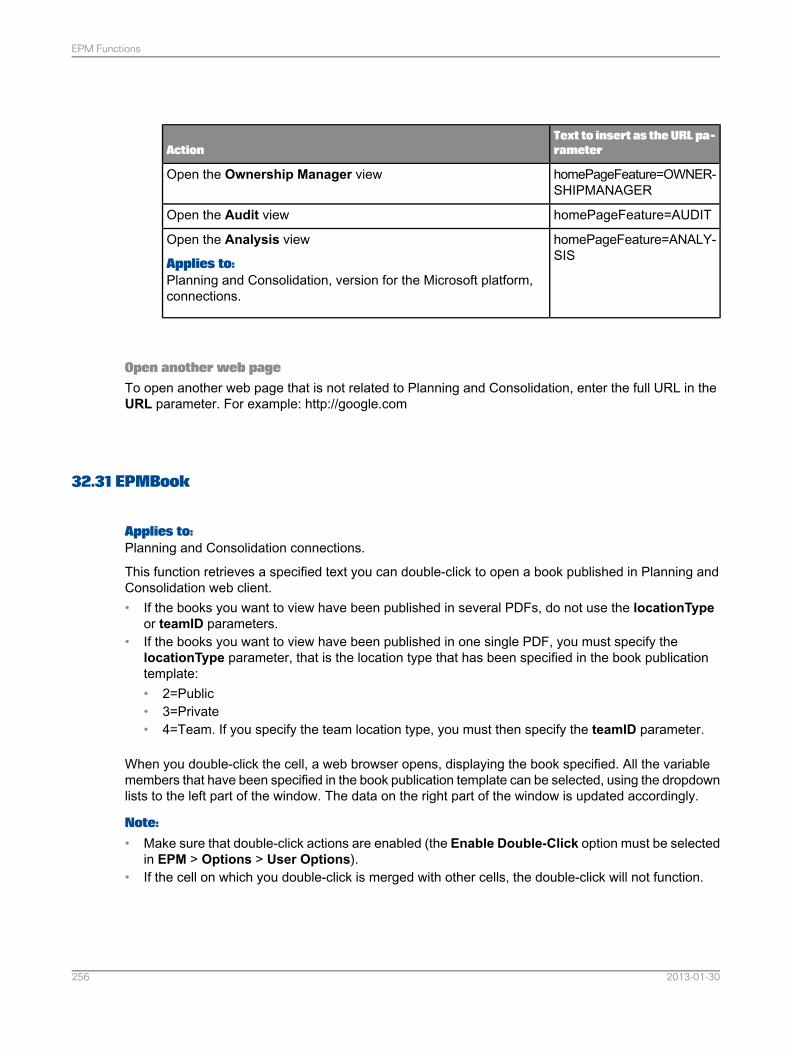
Text to insert as the URL pa-rameterAction
homePageFeature=OWNER-SHIPMANAGER
Open the Ownership Manager view
homePageFeature=AUDITOpen the Audit view
homePageFeature=ANALY-SIS
Open the Analysis view
Applies to:Planning and Consolidation, version for the Microsoft platform,connections.
Open another web pageTo open another web page that is not related to Planning and Consolidation, enter the full URL in theURL parameter. For example: http://google.com
32.31 EPMBook
Applies to:Planning and Consolidation connections.
This function retrieves a specified text you can double-click to open a book published in Planning andConsolidation web client.• If the books you want to view have been published in several PDFs, do not use the locationType
or teamID parameters.• If the books you want to view have been published in one single PDF, you must specify the
locationType parameter, that is the location type that has been specified in the book publicationtemplate:• 2=Public• 3=Private• 4=Team. If you specify the team location type, you must then specify the teamID parameter.
When you double-click the cell, a web browser opens, displaying the book specified. All the variablemembers that have been specified in the book publication template can be selected, using the dropdownlists to the left part of the window. The data on the right part of the window is updated accordingly.
Note:
• Make sure that double-click actions are enabled (the Enable Double-Click option must be selectedin EPM > Options > User Options).
• If the cell on which you double-click is merged with other cells, the double-click will not function.
2013-01-30256
EPM Functions
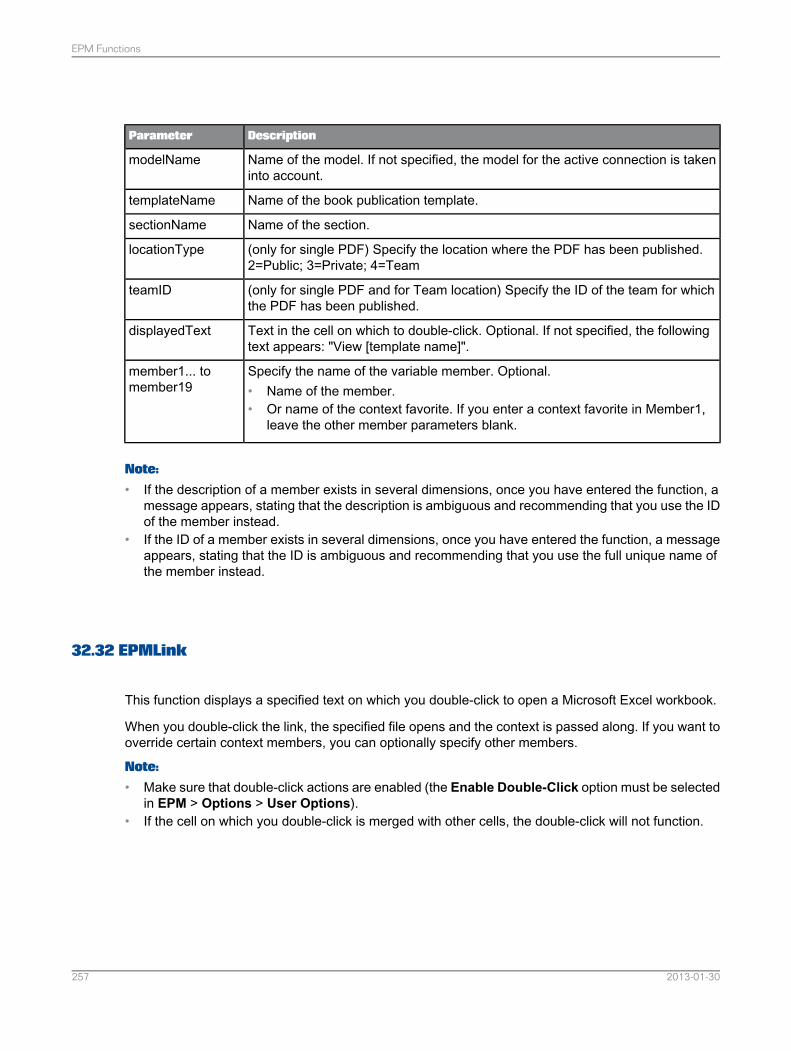
DescriptionParameter
Name of the model. If not specified, the model for the active connection is takeninto account.
modelName
Name of the book publication template.templateName
Name of the section.sectionName
(only for single PDF) Specify the location where the PDF has been published.2=Public; 3=Private; 4=Team
locationType
(only for single PDF and for Team location) Specify the ID of the team for whichthe PDF has been published.
teamID
Text in the cell on which to double-click. Optional. If not specified, the followingtext appears: "View [template name]".
displayedText
Specify the name of the variable member. Optional.• Name of the member.• Or name of the context favorite. If you enter a context favorite in Member1,
leave the other member parameters blank.
member1... tomember19
Note:
• If the description of a member exists in several dimensions, once you have entered the function, amessage appears, stating that the description is ambiguous and recommending that you use the IDof the member instead.
• If the ID of a member exists in several dimensions, once you have entered the function, a messageappears, stating that the ID is ambiguous and recommending that you use the full unique name ofthe member instead.
32.32 EPMLink
This function displays a specified text on which you double-click to open a Microsoft Excel workbook.
When you double-click the link, the specified file opens and the context is passed along. If you want tooverride certain context members, you can optionally specify other members.
Note:
• Make sure that double-click actions are enabled (the Enable Double-Click option must be selectedin EPM > Options > User Options).
• If the cell on which you double-click is merged with other cells, the double-click will not function.
2013-01-30257
EPM Functions
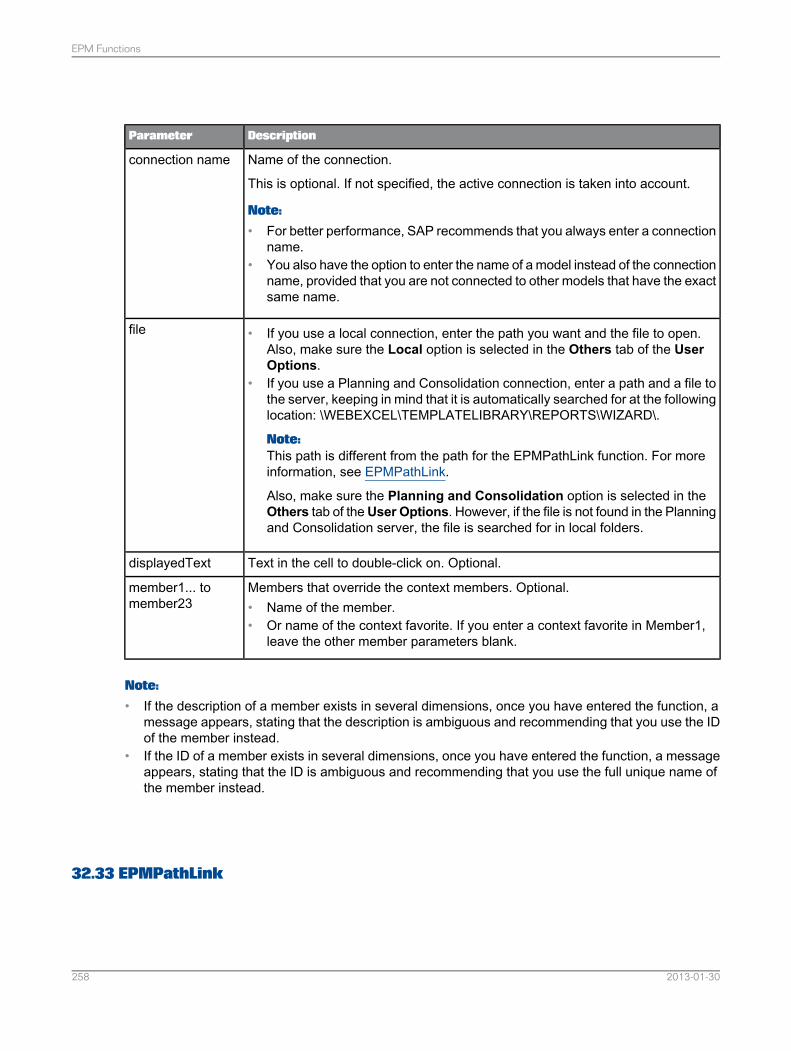
DescriptionParameter
Name of the connection.
This is optional. If not specified, the active connection is taken into account.
Note:
• For better performance, SAP recommends that you always enter a connectionname.
• You also have the option to enter the name of a model instead of the connectionname, provided that you are not connected to other models that have the exactsame name.
connection name
• If you use a local connection, enter the path you want and the file to open.Also, make sure the Local option is selected in the Others tab of the UserOptions.
• If you use a Planning and Consolidation connection, enter a path and a file tothe server, keeping in mind that it is automatically searched for at the followinglocation: \WEBEXCEL\TEMPLATELIBRARY\REPORTS\WIZARD\.
Note:This path is different from the path for the EPMPathLink function. For moreinformation, see EPMPathLink.
Also, make sure the Planning and Consolidation option is selected in theOthers tab of theUser Options. However, if the file is not found in the Planningand Consolidation server, the file is searched for in local folders.
file
Text in the cell to double-click on. Optional.displayedText
Members that override the context members. Optional.• Name of the member.• Or name of the context favorite. If you enter a context favorite in Member1,
leave the other member parameters blank.
member1... tomember23
Note:
• If the description of a member exists in several dimensions, once you have entered the function, amessage appears, stating that the description is ambiguous and recommending that you use the IDof the member instead.
• If the ID of a member exists in several dimensions, once you have entered the function, a messageappears, stating that the ID is ambiguous and recommending that you use the full unique name ofthe member instead.
32.33 EPMPathLink
2013-01-30258
EPM Functions
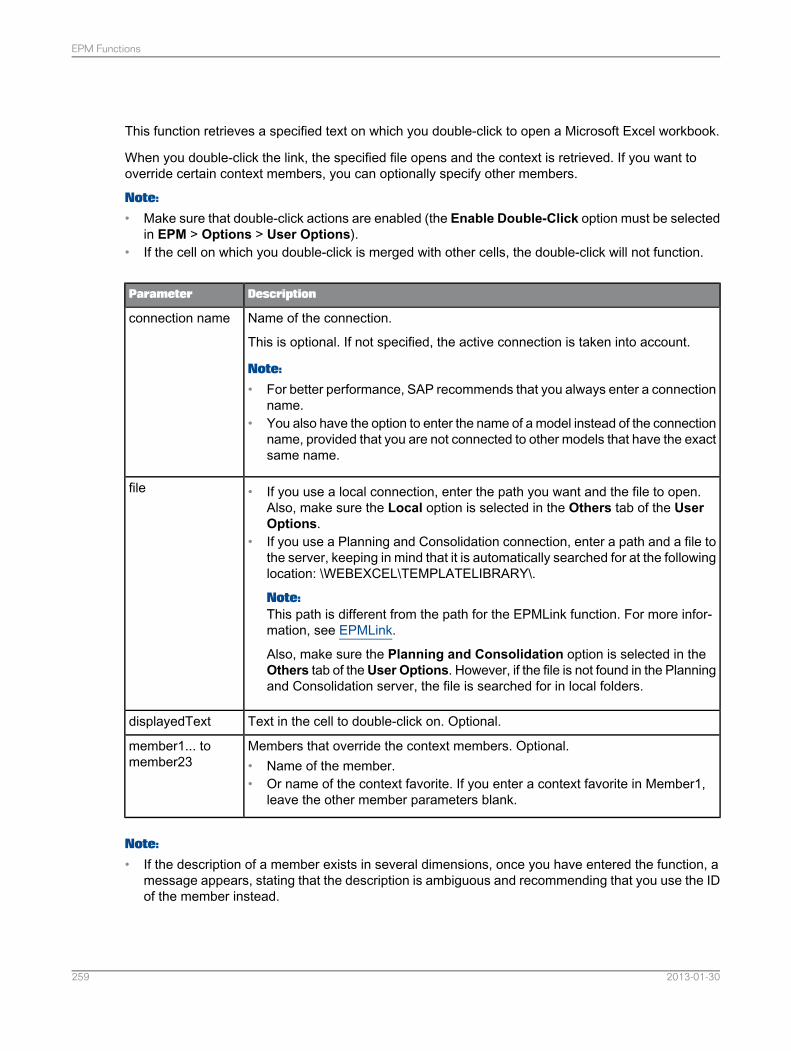
This function retrieves a specified text on which you double-click to open a Microsoft Excel workbook.
When you double-click the link, the specified file opens and the context is retrieved. If you want tooverride certain context members, you can optionally specify other members.
Note:
• Make sure that double-click actions are enabled (the Enable Double-Click option must be selectedin EPM > Options > User Options).
• If the cell on which you double-click is merged with other cells, the double-click will not function.
DescriptionParameter
Name of the connection.
This is optional. If not specified, the active connection is taken into account.
Note:
• For better performance, SAP recommends that you always enter a connectionname.
• You also have the option to enter the name of a model instead of the connectionname, provided that you are not connected to other models that have the exactsame name.
connection name
• If you use a local connection, enter the path you want and the file to open.Also, make sure the Local option is selected in the Others tab of the UserOptions.
• If you use a Planning and Consolidation connection, enter a path and a file tothe server, keeping in mind that it is automatically searched for at the followinglocation: \WEBEXCEL\TEMPLATELIBRARY\.
Note:This path is different from the path for the EPMLink function. For more infor-mation, see EPMLink.
Also, make sure the Planning and Consolidation option is selected in theOthers tab of theUser Options. However, if the file is not found in the Planningand Consolidation server, the file is searched for in local folders.
file
Text in the cell to double-click on. Optional.displayedText
Members that override the context members. Optional.• Name of the member.• Or name of the context favorite. If you enter a context favorite in Member1,
leave the other member parameters blank.
member1... tomember23
Note:
• If the description of a member exists in several dimensions, once you have entered the function, amessage appears, stating that the description is ambiguous and recommending that you use the IDof the member instead.
2013-01-30259
EPM Functions
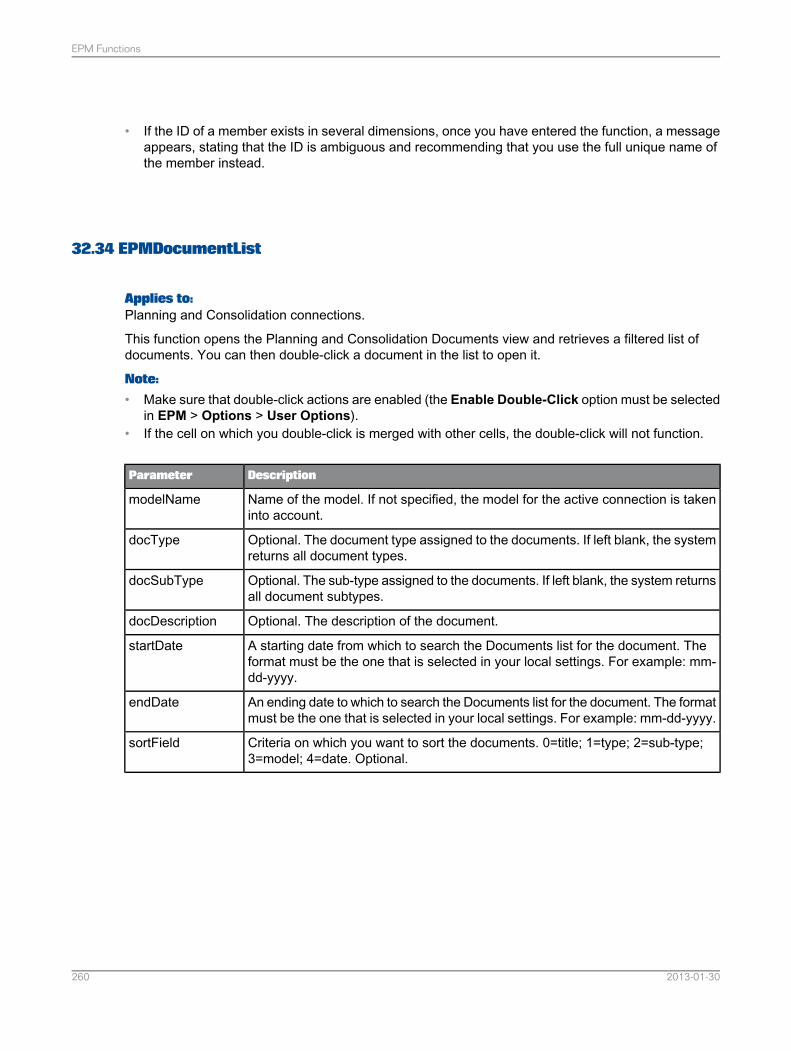
• If the ID of a member exists in several dimensions, once you have entered the function, a messageappears, stating that the ID is ambiguous and recommending that you use the full unique name ofthe member instead.
32.34 EPMDocumentList
Applies to:Planning and Consolidation connections.
This function opens the Planning and Consolidation Documents view and retrieves a filtered list ofdocuments. You can then double-click a document in the list to open it.
Note:
• Make sure that double-click actions are enabled (the Enable Double-Click option must be selectedin EPM > Options > User Options).
• If the cell on which you double-click is merged with other cells, the double-click will not function.
DescriptionParameter
Name of the model. If not specified, the model for the active connection is takeninto account.
modelName
Optional. The document type assigned to the documents. If left blank, the systemreturns all document types.
docType
Optional. The sub-type assigned to the documents. If left blank, the system returnsall document subtypes.
docSubType
Optional. The description of the document.docDescription
A starting date from which to search the Documents list for the document. Theformat must be the one that is selected in your local settings. For example: mm-dd-yyyy.
startDate
An ending date to which to search the Documents list for the document. The formatmust be the one that is selected in your local settings. For example: mm-dd-yyyy.
endDate
Criteria on which you want to sort the documents. 0=title; 1=type; 2=sub-type;3=model; 4=date. Optional.
sortField
2013-01-30260
EPM Functions
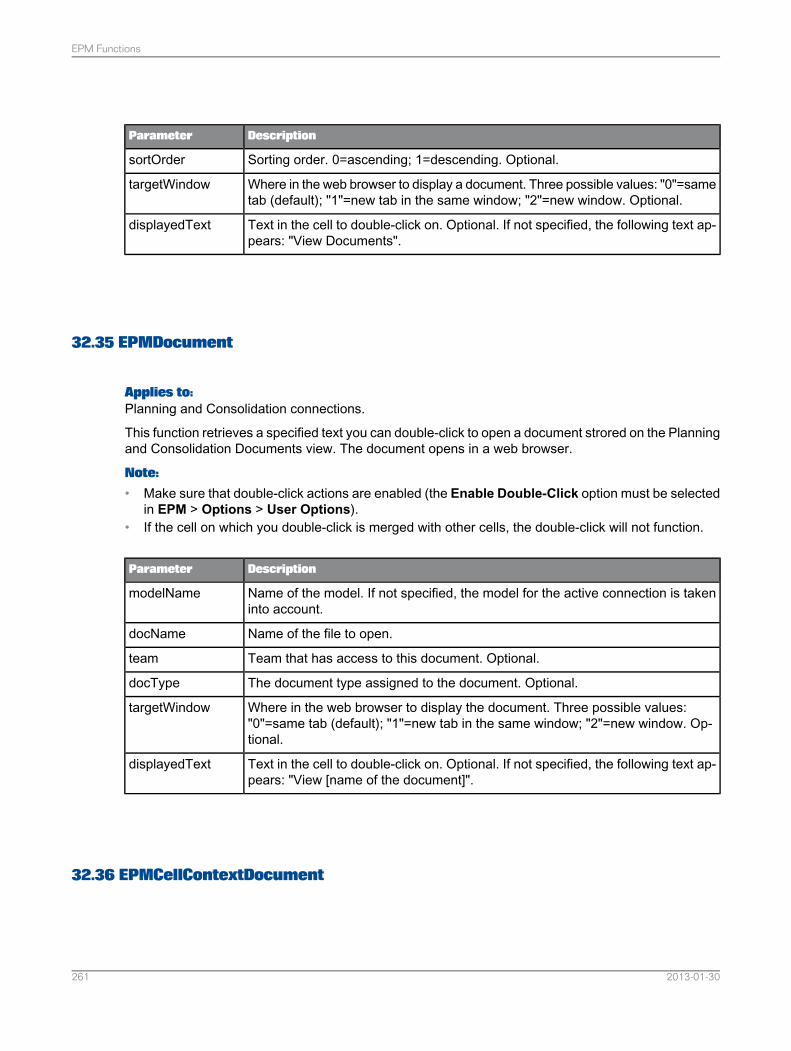
DescriptionParameter
Sorting order. 0=ascending; 1=descending. Optional.sortOrder
Where in the web browser to display a document. Three possible values: "0"=sametab (default); "1"=new tab in the same window; "2"=new window. Optional.
targetWindow
Text in the cell to double-click on. Optional. If not specified, the following text ap-pears: "View Documents".
displayedText
32.35 EPMDocument
Applies to:Planning and Consolidation connections.
This function retrieves a specified text you can double-click to open a document strored on the Planningand Consolidation Documents view. The document opens in a web browser.
Note:
• Make sure that double-click actions are enabled (the Enable Double-Click option must be selectedin EPM > Options > User Options).
• If the cell on which you double-click is merged with other cells, the double-click will not function.
DescriptionParameter
Name of the model. If not specified, the model for the active connection is takeninto account.
modelName
Name of the file to open.docName
Team that has access to this document. Optional.team
The document type assigned to the document. Optional.docType
Where in the web browser to display the document. Three possible values:"0"=same tab (default); "1"=new tab in the same window; "2"=new window. Op-tional.
targetWindow
Text in the cell to double-click on. Optional. If not specified, the following text ap-pears: "View [name of the document]".
displayedText
32.36 EPMCellContextDocument
2013-01-30261
EPM Functions

Applies to:Planning and Consolidation connections.
This function enables you to upload or view a web document for a combination of members specifiedby a cell you double-click in.
The document can be used as a comment attached to a combination of members.
Note:
• Make sure that double-click actions are enabled (the Enable Double-Click option must be selectedin EPM > Options > User Options).
• If the cell on which you double-click is merged with other cells, the double-click will not function.
DescriptionParameter
Enter 1 to open the window that enables you to upload the document.
Enter 2 to open the window that enables you to view the document.
action name
Specify the cell for which you want to upload or view a web document. By selectinga cell, you are specifying the context, the report members and the connection.
cell
Specify the text in the cell to double-click on.display name
Name of the dimension that you want to override.dimension1 ... di-mension5
Name of the member that you want to override.member1 ... mem-ber5
32.37 EPMExecuteAPI
This function enables you to execute APIs directly from a worksheet cell. When clicking the cell in whichyou insert the function, the API is executed.
DescriptionParameter
Name of the API. Mandatory.APIname
Specify the text the user selects to execute the API.DisplayedText
API parameter name. Mandatory (if the API has parameters). When several pa-rameters, use the list separator that is specified in your local settings.
Parameter
Note:The APIs are available in the IEPMExecuteAPI class.
2013-01-30262
EPM Functions

Related Topics• APIs
2013-01-30263
EPM Functions

2013-01-30264
EPM Functions
Data Input and Save
Applies to:Planning and Consolidation connections.
Following is the workflow for the overall data input and save feature, provided that the appropriate taskprofiles are assigned to you:• Enter data in an input form. You can use planning features to help you enter your data.
Note:A report is called an input form when you can both enter data in it and save it to the server.
• Add comments to the data.
Note:You can add comments using the EPM add-in in Microsoft Office Excel, Word or PowerPoint.
• Save the data entered. The data is written in the database.• Validate data. This is only available in Planning and Consolidation, version for the Microsoft platform,
connection.• Change the work status so that you can lock a specific data region.
Note:Task profiles are assigned in the Administration section of Planning and Consolidation.
33.1 Data Input
Applies to:Planning and Consolidation connections.
There are two ways of entering data:• Enter data directly in the cells of an input form.
Note:To help you enter your data in an input form, you can:• Use planning features. For more information, see Planning Features.• Use the Keep Formula on Data option. For more information, see Keep Formula on Data and
Show Source Data in Comments .• Perform a sum on each parent in the hierarchies. For more information, see Calculate Parents
in Hierarchies.
2013-01-30265
Data Input and Save
• Insert members that are not displayed in the input form. For more information about how to insertmembers, see Member Entry Using the Insert Members Dialog Box
• Enter data for a fully specified data region, using the EPMSaveData function. For more information,see EPMSaveData.
You can save the data you enter in an input form only if you meet the following criteria:• You can enter data for a fully specified data region where each member - for each dimension of the
model - is an inputable member, meaning a base level member (or not a calculated member).
Tip:To quickly and easily view for which members you can enter data, use the dynamic formatting sheet,select theDimensionMember/Property Formatting section, define a specific format in the InputableMember Default Format row and perform a refresh on your input form worksheet. For moreinformation, see Dynamic Formatting Template Definition.
Note:To find out if a member is inputable or not, you can also select a member in your input form andselect More > Member Properties. In the "CALC" property, "Y" indicates that the member iscalculated and therefore not inputable; "N" indicates that the member is a base level member andis therefore inputable.
• You can enter data if you have been granted the appropriate profiles in the Administration view ofPlanning and Consolidation.
Related Topics• Member Properties
33.2 Planning Features
Applies to:Planning and Consolidation connections.
You can use planning features to help you enter your data in an input form.
You can use the following planning features:• Spread. The spread feature enables you to take a value and allocate it among selected destination
cells.• Trend. The trend feature takes a value or percentage and grows it by a factor among selected cells.
This option places the source value in the first cell of the destination range. Each subsequent cellin the destination increases by the amount or percentage specified.
• Weight. The weight feature lets you allocate a set of values by weighted factors in your spreadsheet.
2013-01-30266
Data Input and Save
33.2.1 Spread
Applies to:Planning and Consolidation connections.
The spread feature enables you to take a value and allocate it among selected destination cells.
The value can be allocated equally, or it can be weighted by a range of values. For example, you cantake the value 100,000 and spread it across a number of columns that represent each month of theyear.
To perform a spread, selectPlanning > Spread and specify the following items in the Spread dialogbox:• Source Value. Specify the total value to be spread.• Destination. Specify the destination cells in which the system writes the results of the spread.• Weights. This is optional. Specify a range containing weight values upon which to base the spread.
This range must contain the same number of cells as the destination range. The source value isspread based on the selected weights. If you do not specify weights, the source value is spreadevenly.
• Select one of the Spread Result options:• To take the spread amount to each cell and add it to any existing values already in the destination
range, select the Add to Existing Values option.• So that the amount spread to each cell overwrites the amounts in the destination cells, select
the Overwrite Existing Values option.
33.2.2 Trend
Applies to:Planning and Consolidation connections.
The trend feature takes a value or percentage and grows it by a factor among selected cells.
This feature places the source value in the first cell of the destination range. Each subsequent cell inthe destination increases by the amount or percentage specified.
To perform a trend, selectPlanning > Trend and specify the following items in the Trend dialog box:• Source Value. Specify the initial value from which the trend begins.• Specify a value or a percentage:
• By Percentage: Specify a percentage of the previous value (previous cell) in the destinationrange. To create an increasing trend, use a positive percentage. To create a declining trend, usea negative percentage.
2013-01-30267
Data Input and Save
• By Value: Specify an amount over the previous value (previous cell) in the destination range.To create an increasing trend, enter a positive value. To create a declining trend, enter a negativevalue.
• Destination. Specify the destination cells in which the system writes the results of the trend.• Weights. This is optional. Specify a range containing weight values upon which to base the spread.
This range must contain the same number of cells as the destination range. The source value isspread based on the selected weights. If you do not specify weights, the source value is spreadevenly.
• Select one of the Trend Result options:• To take the trend amount to each cell and add it to any existing values already in the destination
range, select the Add to Existing Values option.• To ensure that the amount trend to each cell overwrites the amounts in the destination cells,
select the Overwrite Existing Values option.
33.2.3 Weight
Applies to:Planning and Consolidation connections.
The weight feature lets you allocate a set of values by weighted factors in your spreadsheet.
It enables you to take a set of values, grow them if desired, and then allocate the new amount basedon the relative weights of the selected cells. The destination range is the same as the weight range.For example, you can weigh 12 months of revenue based on 12 months of cost of sales.
To perform a weight, select Planning > Weight and specify the following items in the Weight dialogbox:• Sum to allocate. Specify the initial sum from which the allocation begins. This amount defaults to
the sum of the selected cells.• Specify a value or a percentage:
• By Percentage: Specify a percentage so that the sum to allocate is increased by the specifiedpercentage before allocating.
• By Value: Specify an amount so that the sum to allocate is increased by the specified valuebefore allocating.
• None. Select this option so that the sum to allocate remains unchanged before allocating.• Destination. Specify a range of cells that contain relative weights, to which the results of the allocation
are written.
33.3 Comments
2013-01-30268
Data Input and Save
Applies to:Planning and Consolidation connections.
Comments provide a vehicle for submitting, storing, and retrieving text commentary associated withreport data cells. This allows users to annotate data so other users can view supporting informationassociated with a particular data point.
You can perform the following actions on comments, using the EPM add-in:• Add or modify a comment to a specific data region.• Retrieve a comment in a cell, for a specific data region.• Search for comments that meet specific criteria.
Note:
• You can also view a history of the comments and delete comments, in the web client of Planningand Consolidation.
• You can add or search for comments using the EPM add-in in Microsoft Office Excel, Word orPowerPoint.
33.3.1 Comment Creation and Modification
Applies to:Planning and Consolidation connections.
Note:When using a Planning and Consolidation, version for the NetWeaver platform, connection, to add ormodify a comment, the option enabling comment creation in the Administration view must be selected.
There are two ways of adding a comment:
Add a comment using the dedicated dialog boxYou can add a comment, using a dedicated dialog box.
Select Comments > Add Comment and specify the following items in the Add Comment dialog box:• Select the desired priority level. The reports show comments in order of their priority level.• Enter your comment. A comment is limited to 512 characters.• Enter one or more keywords to organize and search for comments in the database.
Do not use special characters for the keywords. The separator character used to separate thekeywords is the comma.
• Select to which of the following you want to associate the comment:• The active cell. The comment is applied to the data region associated with the selected cell.• The current context. The comment is applied to the context displayed in the EPM Context bar.• A context favorite. The comment is applied to the context specified in the context favorite. For
more information on context favorites, see Context Favorites.
2013-01-30269
Data Input and Save
• A custom context. This option allows you to specify a different context than the current one, towhich to associate the comment. For each dimension, select: a member or none of the members.If you select None, the comment applies to any member for that dimension.
When you click Save in the Add Comment dialog box, unless there is an error, the comment is savedto the server.
Note:If you want the save result to be displayed, select theDisplayWarning when Saving Data or Commentoption in the User Options. If the option is selected, as soon as you click Save in the Add Commentdialog box, a message appears, informing you whether or not the comment has been saved.
Add or modify a comment using the EPMSaveComment functionYou can add or modify a comment for a full set of members, using the EPMSaveComment function.For more information, see EPMSaveComment.
Note:If comments have already been entered on a combination of members, entering a comment on thesame combination of members does not overwrite the previous comments. You can view a history ofthe comments in the web client of Planning and Consolidation.
Modify a comment using the Excel standard tooltipsIf you have selectedSheet Options > General > Show as Microsoft Excel Comments, commentsare displayed as standard Microsoft Office Excel comments, which are in tooltips that appear when youmouse over the cells. For more information, see Show as Microsoft Excel Comments.
You can modify a comment directly in a tooltip and save it locally when saving your workbook.
Note:Even if the worksheet is protected, if you select Edit Objects in the Protection tab of the Sheet Options,you can still modify the comments directly in the tooltips.
Related Topics• Worksheet Protection
33.3.2 Comment Display in a Cell
Applies to:Planning and Consolidation connections.
You can retrieve comments in cells for specific combinations of members, using the following EPMfunctions:• EPMCommentFullContext. For more information, see EPMCommentFullContext.• EPMCommentPartialContext. For more information, see EPMCommentPartialContext.
2013-01-30270
Data Input and Save
Note:
• The comment is displayed by default in the cell in which you have entered the function. If you displaythe comment as a standard Microsoft Office Excel comment (displayed when you mouse over thecell), select Sheet Options > General > Show as Microsoft Excel Comments.
• if several comments have been entered on the combination of members specified in either one ofthe EPM functions, the latest comment entered is displayed.
Related Topics• EPMCommentFullContext• EPMCommentPartialContext• Show as Microsoft Excel Comments
33.3.3 Comment Search
Applies to:Planning and Consolidation connections.
You can retrieve comments that meet specific criteria.
Select Comments > Find Comments and specify the following search items in the Find Commentsdialog box:• Enter one or more keywords to return only comments with matching keywords.
If you enter more than one keyword, use the comma as the separator character. You can only enterthe beginning of a keyword and the search is performed on all keywords beginning with what youentered.
• Select one or more priority options to return comments associated with that priority.• Specify the author of the comment:
• Anyone. This option returns comments entered by all users.• Myself. This option returns comments that you have entered.• Specific Users. This option returns comments entered by one or more users. To select the users,
click the ellipsis button.• Specify a date range for which to return comments. Use the From and To dropdown lists to specify
the desired date range and select the checkboxes.• Select which of the following is associated to the comments you are searching for:
• The active cell. Returns comments associated with the members for the active cell.• The current context. Returns comments associated with the active context.• A context favorite. Returns comments associated with the context defined in the context favorite.
For more information on context favorites, see Context Favorites.• A custom context. Returns comments associated with a different context than the current one.
For each dimension, select: a member or all members.
2013-01-30271
Data Input and Save
When you click Find, the list of comments found is displayed in the web client of Planning andConsolidation that opens.
33.4 Data Save
Applies to:Planning and Consolidation connections.
To write data to the server, use the Save Data command in the EPM tab of the ribbon.
You can perform the following save-related actions:• Save the data entered in the current worksheet.• Save the data entered in the current workbook.• Save the data entered in the current worksheet and then perform a refresh.
Data is first saved to the server, then data is refreshed in your input form, taking into account thedata you have saved and recalculating the amounts accordingly. For example: you enter data forJanuary, February and March. You select EPM > Save Data > Save and RefreshWorksheet Data.As the data form is refreshed from the server, the sum of the three months you have entered isdisplayed for Quarter 1 in the input form.• If the option Refresh only Data on "Save & Refresh Data" is not selected in the User Options,
everything that is in the current worksheet is refreshed: the data of the reports, the data of theEPM functions, all the reports (including local member data, formatting, and so on).
• If the option Refresh only Data on "Save & Refresh Data" is selected in the User Options, onlythe data for all EPM functions and all the reports (except the data for local members) in theworksheet is refreshed.
Note:The Save and Refresh Worksheet Data is the default save action when you directly click the SaveData button.
• Save data entered on the current workbook and then perform a refresh.• If the option Refresh only Data on "Save & Refresh Data" is not selected in the User Options,
everything that is in the current workbook is refreshed: the data of the reports, the data of theEPM functions, all the reports (including local member data, formatting, and so on).
• If the option Refresh only Data on "Save & Refresh Data" is selected in the User Options,everything that is in the current workbook is refreshed: only the data for all EPM functions andall the reports (except the data for local members) in the worksheet is refreshed.
Data is first saved to the server, then data is refreshed in your input form, taking into account the datayou have saved and recalculating the amounts accordingly.
Either of the above save actions writes to the server all the following records that have been changedon the current worksheet or workbook:• Data, whether the data has been entered directly in cells or by using the EPMSaveData function.• Comments that have been entered using the EPMSaveComment function.
2013-01-30272
Data Input and Save
Note:If you want the save-related messages to be displayed, select the Display Warning when SavingData or Comment option in the User Options. If the option is selected, as soon as you perform a datasave, a dialog box opens, prompting you to confirm if you want to save x data (if there is no data tosave, the message says so); if you confirm, a message appears, informing you if the data has beensaved or not.
For a specific input form, you can choose not to save the data entered on specific members. For moreinformation, see Read-only Data.
Note:If you cannot save data, check that your administrator has granted you the appropriate rights and makesure that the Use as Input Form is selected in the current report options. For more information, seeUse as Input Form.
Related Topics• EPMSaveData• EPMSaveComment
33.5 Data Validation
Applies to:Planning and Consolidation, version for the Microsoft platform, connections.
Once you have entered and saved data, you can launch a data validation.
When launching a data validation, the system checks to make sure there are no work status locks orvalidity issues, respectively, on the data region. The validity check consists in checking that the Validationaccount equals 0.
Before launching a data validation, you must perform the following actions:• Create a workbook (the validation report) and save it to one of the following locations on the server:
Input Schedules or Input Schedules/Wizard• In the Planning and Consolidation Administration, enter the name of the workbook as the value of
the LOCKREPORT parameter.
To validate data, select Save Data > Validate Data.
If the data does not pass the validation, a message appears and prompts you to run and open thevalidation report that will show you what is incorrect. You can then modify the data accordingly, saveit and revalidate it.
When the data is validated, you can change the work status.
2013-01-30273
Data Input and Save
33.6 Work Status
Applies to:Planning and Consolidation connections.
Once you have entered and saved data, you can modify the work status for a specific data region. Thework status feature enables you to apply a label to a data region and lock it for review, approval, andso on. For example, after saving data, you can set the work status to "Saved". This locks the data regionfrom being overwritten.
Note:The work status is set up in the Administration view.
To change the work status for a data region, selectSave Data > Change Work Status. The ChangeWork Status dialog box opens.• In theChange Status for area, you define for which data region you want to change the work status.
From three to five dimensions are available. For each dimension, the context member is displayedby default. You can select another member for a dimension by clicking the ellipsis button.
Note:
• For the first dimension, which is defined as the owner dimension in the Administration view, youcan include in the selection all the descendant members of the specified member by selectingthe Include all Descendants option.
• If you are working with Planning and Consolidation, for SAP NetWeaver, you must only select abase member for each dimension or you will not be able select another work status.
• You can change the work status only for members of which you are the owner or manager. Thisis defined in the Administration view.
• In the New Work Status area, the current status for the specified data region is displayed. You canselect a work status that reflects the state of data.
Note:The work statuses that are available for selection have been defined in the Administration view.
2013-01-30274
Data Input and Save
Accessing Journals
Applies to:Planning and Consolidation connections.
You use journals to record and make adjustments to data in the database. This is typically done as partof the month-end or quarter-end process.
From the EPM tab in Microsoft Office Excel, you can access the Journals view of SAP BusinessObjectsPlanning and Consolidation by clicking Journals. Planning and Consolidation opens in a web browser,displaying the Journals view, and the context for the model to which you are connected is retrieved.
For more information, see the SAP BusinessObjects Planning and Consolidation help.
2013-01-30275
Accessing Journals

2013-01-30276
Accessing Journals
Business Process Flows
Applies to:Planning and Consolidation connections.
Business Process Flows guide you through a sequence of tasks within a defined business process. ABusiness Process Flow is set up for a specific environment in Planning and Consolidation.
In the Planning and Consolidation web client, when you click an activity or process covering actionsthat are to be performed using the EPM add-in in Microsoft Office Excel, the application opens, and thededicated Process tab is displayed in the EPM pane. It is the same for Microsoft Office Word andMicrosoft Office PowerPoint when the actions must be performed in these applications.
Note:If Microsoft Excel, Word or Powerpoint is already opened, a new instance of the application opens.
A list of actions is available. When you click an action, the sub-actions that are related to the action aredisplayed below the list of actions. When you click a sub-action link, it takes you to the place where youcan perform the action.
When you are finished performing all the actions, click the button at the bottom of the tab to go back toPlanning and Consolidation.
2013-01-30277
Business Process Flows

2013-01-30278
Business Process Flows

Report and Input Form Templates
Applies to:Planning and Consolidation connections.
In the "Shell" environment, dynamic templates are available within Microsoft Office Excel workbooks.• For the "Finance" model:
• 10 templates designed for reports.• 5 templates designed for input forms.
• For the "Rate" model:• 4 templates designed for reports.• 3 templates designed for input forms.
• For the "Ownership" model:• 2 templates designed for reports.• No template designed for input forms.
You can find the templates in the following folders on the Planning and Consolidation server:• Templates for input forms are stored in the "Templates" folder of the "Input Schedules" folder.• Templates for reports are stored in the "Templates" of the "Reports" folder.
Each workbook contains two worksheets:• One sheet contains the template: you can connect the template to any model, then change the
context members and the dynamic template continues to be valid.• One sheet contains a dynamic formatting sheet that is applied to the template.
Note:Since a template can be used with various connections, the Do not Store Connection option in EPM> Edit Report > Options is selected by default.
Related Topics• Do not Store Connection and Do not Store Environment in the Connection
2013-01-30279
Report and Input Form Templates

2013-01-30280
Report and Input Form Templates
Other Features
37.1 Metadata Cache
The metadata cache behavior is different, depending on the types of connections.
Metadata Cache for Local and SAP BusinessObjects Enterprise ConnectionsApplies to:Local and SAP BusinessObjects Enterprise connections.
The metadata cache feature is not activated by default, meaning that the dimensions and membersare loaded each time you connect to a data source.
You can activate the cache, meaning that the metadata is copied locally and not loaded each time youconnect to a data source. Using the cache enables you to improve the connection time. To activate thecache, select EPM > User Options, then select the Activate Metadata Cache option.
You can clear the metadata cache. When the cache is cleared, the structure of the data source youare connected to is synchronized with the structure copied locally; which means that the members ofdimensions that have been added, modified or deleted in the data source are loaded.• You can define the frequency at which the cache is automatically cleared. Select EPM > User
Options, then select the Clear Metadata Cache Frequency option and enter a number in the field.If you enter 1, the cache is cleared once a day.
• You can clear the cache whenever you want. Select EPM > More > Clear Metadata Cache or clickthe Clear Metadata Cache button in the Edit Connection and Create Connection dialog boxes,when editing and creating a connection.
Metadata Cache for Planning and Consolidation ConnectionsApplies to:Planning and Consolidation connections.
The metadata cache feature is always activated for Planning and Consolidation connections. Each timeyou connect to a data source, the structure of the data source you are connected to is synchronizedwith the structure copied locally.
You can clear the metadata cache. When the cache is cleared, all the local structure files are deletedand all the files of the structure of the data source are loaded locally. To do so, select EPM > More >Clear Metadata Cache.
2013-01-30281
Other Features
37.2 Log File
The log can contain three types of information, including Planning and Consolidation EvDRE migrationinformation:• Infos• Errors• Warnings
Note:
• By default, the log file contains the errors for any use of the EPM add-in and all types of informationrelated to the Planning and Consolidation EvDRE migration.
• The content of the log depends on what has been defined in the configuration file. For moreinformation, see the SAP BusinessObjects EPM Solutions, add-in for Microsoft Office Installationguide.
To view the log, select EPM > More > Log.
Only the last 100 rows of the log files are displayed in this screen. You can view all the log rows in thefollowing log files:• FPMXLClient.dll.Excel.log.• FPMXLClient.dll.Migration.log. This log file contains all the information related to the EvDRE
migration.
The log files are stored locally at the following default location. In your file explorer, enter: %temp%/log.
Note:This location is displayed in the Log screen.
37.3 Information on Cubes
Applies to:Financial Consolidation SSAS cubes.
You can display the following information on a cube:• The name of the cube.• The name of the database.• The last time the cube was deployed.• The last time the cube was processed.
To view the information on a cube, select a report that is connected to the cube for which you want tosee information and selectEPM > More > Cube Information.
2013-01-30282
Other Features
37.4 MDX Display
Applies to:Local and SAP BusinessObjects Enterprise connections.
You can display the MDX query for the current data sheet. You can then copy the MDX query and reuseit.
To display the MDX query, select EPM > More > Display MDX.
2013-01-30283
Other Features

2013-01-30284
Other Features
EPM Add-in for Microsoft Office Word and PowerPoint
In this section, you will find:• A list of the features that are common to the add-in for Microsoft Office Excel, Word and PowerPoint.• Features that are specific to the add-in for Microsoft Office Word and PowerPoint.• The list of options available for the add-in for Microsoft Office Word and PowerPoint.
38.1 Common Features to the Add-in for Microsoft Office Excel, Word and PowerPoint
Using the add-in for Microsoft Office Word and in Microsoft Office PowerPoint, you can perform theactions listed below. These features behave just as they do in the add-in for Microsoft Office Excel.Therefore, to read more about the features, follow the links.• Logon and connections. See Logon and Connections.• Open and Save actions. See Open and Save a File.• Report creation and member selection. You can create a report using the Report Editor and the
EPM pane. You can also copy and paste reports. You can select dimension members in theMemberSelector dialog box. See Report Creation .
Note:Asymmetric reports are not supported in Microsoft Office Word and in Microsoft Office PowerPoint.
• Several reports in a document or presentation. See Several Reports in a Sheet .• Report refresh. You can refresh the selected report or all the reports in the entire file. See Report
Refresh .• Publication on a portal. See Report Publication to a Web Portal.• Custom members. See Custom Members.• Flash object insertion. See Flash Object Insertion.• Comment creation and search, using the dialog boxes that open when selectingEPM > Comments
> Add Comment or Find Comments. See Comments.• Back command. See Going Back in the Navigation Actions.• Display MDX. See MDX Display.• Cube information. See Information on Cubes .• Log. See Log File.• Clear metadata cache. See Metadata Cache.
2013-01-30285
EPM Add-in for Microsoft Office Word and PowerPoint
38.2 Additional Features in the Add-in for Microsoft Office Word and PowerPoint
Additionally, you can perform the following actions:• insert data (one value):
• for the context dimension members.• for a context favorite.• for a specified set of dimension members. If you do not specify a member for all the dimensions
of the cube or model, the context members are taken into account for the unspecified dimensions.
To insert data, select Insert > Insert Data from the EPM tab in the ribbon. The Insert Data dialogbox opens.• To insert data for the current context dimension members, select a dimension, then Context.
Then select the other dimensions and their context member and click OK.• To insert data for a context favorite, select Context Favorite and select the favorite from the list,
then click OK.• To insert data for other members, select a dimension, then a member for the dimension. Then
select the other dimensions and other members, then click OK.
When you select the data in the document or presentation, the dimensions and members selectedor the context favorite name are displayed in the EPM pane. You can change the selection by clickinga member or the context favorite.
• insert a context member:
To insert the context member for a specific dimension, select Insert > Insert Context Member fromthe EPM tab in the ribbon. The Insert Context Member dialog box opens.• To insert the current context member of a dimension, select the dimension, then select Current
Context. You can then select the member name you want to display in the document orpresentation (ID, Description, etc), using the dropdown list. By default, the member name that isapplied is the one that is currently used in the context bar.
• To insert a context member defined in a context favorite, select the dimension, then selectContextFavorite and select the context favorite from the dropdown list. You can then select the membername you want to display in the document or presentation (ID, Description, etc), using thedropdown list. By default, the member name that is applied is the one that is currently used inthe context bar.
When you select the context member name in the document or presentation, the context memberis displayed in the EPM pane. You can click on it and change the dimension and the member nameto display.
Restriction:In Microsoft Office Word, you cannot insert data or insert a context member in the following types ofobject: table and shape.
2013-01-30286
EPM Add-in for Microsoft Office Word and PowerPoint
38.3 Options in the Add-in for Microsoft Office Word and PowerPoint
Document or Presentation OptionsIn the Document Options or Presentation Options, the following options area available:
Note:All the other options are greyed out.
• Totals options. See Totals Placement .• No Data or Zero Values. See No Data and Zero Values. However, note that the Hide Empty and
Hide Empty and Zero Values features are not available in the dropdown lists.• Display Name. See Display Name.• Auto Fit Column Width. See Auto Fit Column Width.• Repeat RowHeaders andRepeat ColumnHeaders. See Repeat Row Headers and Repeat Column
Headers.• Set Default Value in Empty Cell and Empty Cell Default Value options. See Empty Cell Default
Value .• Number Format option. The area enables you to enter how you want the data numbers to be
displayed, including or not a 1000 separator and a decimal number. The default format is the following:0.## (no 1000 separator and 2 decimal numbers).
You can change this format. All the characters that are supported are listed here: http://msdn.microsoft.com/en-us/library/dwhawy9k.aspx, http://msdn.microsoft.com/en-us/library/0c899ak8.aspx.
• Refresh Data on the Whole File when Opening it. See Refresh Data on the Whole File whenOpening it.
• Clear Data on the Whole File when Saving it. See Clear Data on the Whole File when Saving it.• Show Unauthorized Cell Text. Show Unauthorized Cell Text
Report OptionsBy default, the report options are the ones defined for the current file in the Document Options orPresentation Options. You can modify the options for the current report in the Options tab of theReport Editor. To do so, deselect Inherit Document Options or Inherit Presentation Options. Allthe options that remain greyed out are the ones that are greyed out in the Document Options orPresentation Options.
Note:Some options are always available for selection. See Report Options.
2013-01-30287
EPM Add-in for Microsoft Office Word and PowerPoint

2013-01-30288
EPM Add-in for Microsoft Office Word and PowerPoint
Data Manager
39.1 About Data Manager
39.1.1 About Data Manager
The Data Manager is a Planning and Consolidation module that helps you move data into the system,copy or move data within and across applications, and export data from an application for use in anexternal tool. In addition, the Data Manager supports mapping and complex transformations of data.
The Data Manager also allows you to export transactional and master data from an application withinPlanning and Consolidation to a file that you can use in an external tool.
The Data Manager is used with both• SAP BusinessObjects Planning and Consolidation, version for the Microsoft platform• SAP BusinessObjects Planning and Consolidation, version for SAP NetWeaver
The Data Manager is integrated with the Excel interface. Click the Data Manager tab to start the DataManager.
You can set up system logic to work together with packages in the Data Manager. When you importdata, most packages automatically run default logic, which is contained in the default.lgf file, foryour application. You can also include logic files in packages, or you can prompt users for logic filesthat they would like to use.
39.1.1.1 About Packages
A package is a set of specific tasks that define the work to be done. These tasks are based on informationyou provide either by entering information in Data Manager package prompts. When using the DataManager with SAP BusinessObjects Planning and Consolidation 10, version for the Microsoft Platform,you can also modify packages directly through Microsoft SQL Server.
2013-01-30289
Data Manager
Packages allow you to move data among your Planning and Consolidation databases and to effectbusiness processes, such as legal consolidation and intercompany booking. By default, there are threetypes of packages within the Data Manager:
• Data Management• Financial Processes• System Administration
Note:By definition, a package in the Data Manager is anything that has been added either by default or asthe result of customization in the "Run Package" dialog box.
Packages in the Data Manager are standard and shared among all models within all environments ina given Planning and Consolidation installation.
The packages that come with Planning and Consolidation are designed to be dynamic, which meansthat you are not required to modify them in order for the packages to work with your models anddimensions. You can modify packages to behave differently or to perform additional functions. In the"Organize Package List" dialog box you can do the following:• Add a package• Modify a package• Remove a package• Copy a package• Move a package
The planning and consolidation application version for Microsoft relies on SSIS packages whereas theversion for SAP NetWeaver relies on process chains.
Related Topics• Running a Copy Package• Running Packages
39.1.1.2 About Process Chains
A process chain is a sequence of processes that are scheduled to wait in the background for an event.Some of these processes trigger a separate event that can in turn start other processes. A process inthe context of process chains is a procedure inside of or external to an SAP system with a definedbeginning and end.
Related Topics• Load Process Chain Examples• About the Import and Send Email Process Chain• Using the SendMail Process Chain
2013-01-30290
Data Manager
• Using the FTP Process Chain
39.1.1.3 About the Data Manager Connection
The data manager connection is used to launch actions related to Data Manager, such as running,organizing, or launching packages.
If you change the data manager connection from the Data Manager menu you do not change thecurrent connection used to create reports.
39.2 Standard Packages
39.2.1 Standard Data Management Packages
You can use the packages provided in the Data Management package group to perform general datamanagement tasks. If a file has an associated transformation file, you can modify the file or assign itdirectly to the package.
2013-01-30291
Data Manager
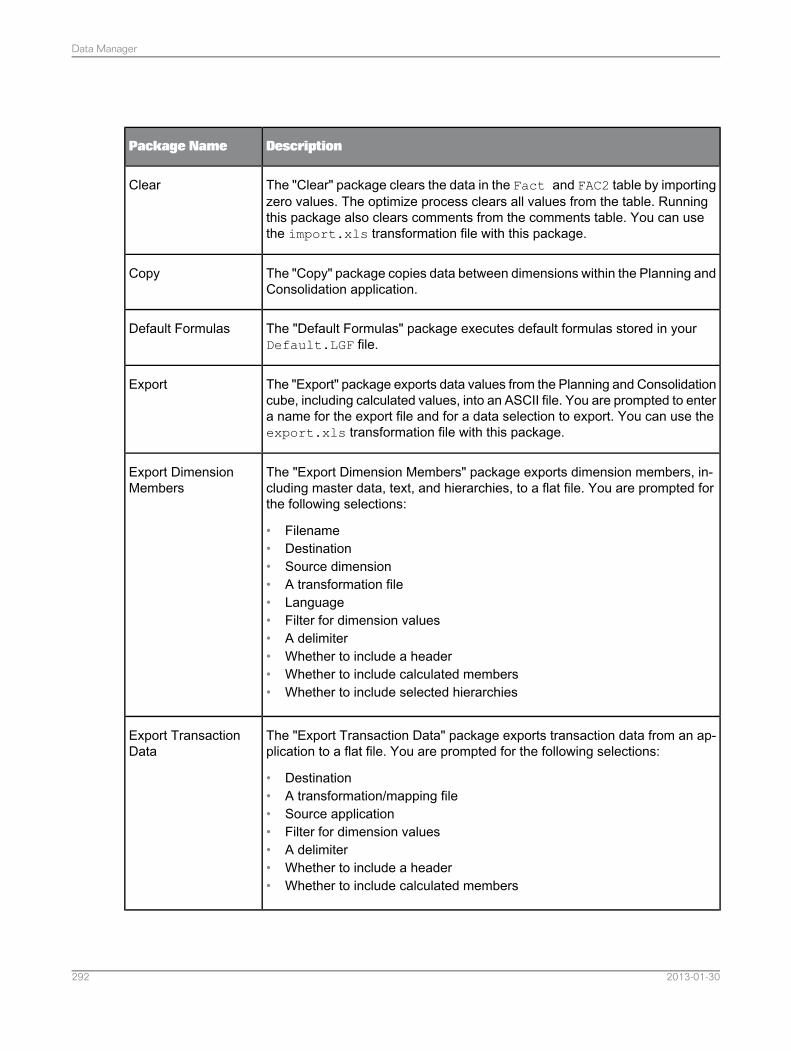
DescriptionPackage Name
The "Clear" package clears the data in the Fact and FAC2 table by importingzero values. The optimize process clears all values from the table. Runningthis package also clears comments from the comments table. You can usethe import.xls transformation file with this package.
Clear
The "Copy" package copies data between dimensions within the Planning andConsolidation application.
Copy
The "Default Formulas" package executes default formulas stored in yourDefault.LGF file.
Default Formulas
The "Export" package exports data values from the Planning and Consolidationcube, including calculated values, into an ASCII file. You are prompted to entera name for the export file and for a data selection to export. You can use theexport.xls transformation file with this package.
Export
The "Export Dimension Members" package exports dimension members, in-cluding master data, text, and hierarchies, to a flat file. You are prompted forthe following selections:
• Filename• Destination• Source dimension• A transformation file• Language• Filter for dimension values• A delimiter• Whether to include a header• Whether to include calculated members• Whether to include selected hierarchies
Export DimensionMembers
The "Export Transaction Data" package exports transaction data from an ap-plication to a flat file. You are prompted for the following selections:
• Destination• A transformation/mapping file• Source application• Filter for dimension values• A delimiter• Whether to include a header• Whether to include calculated members
Export TransactionData
2013-01-30292
Data Manager
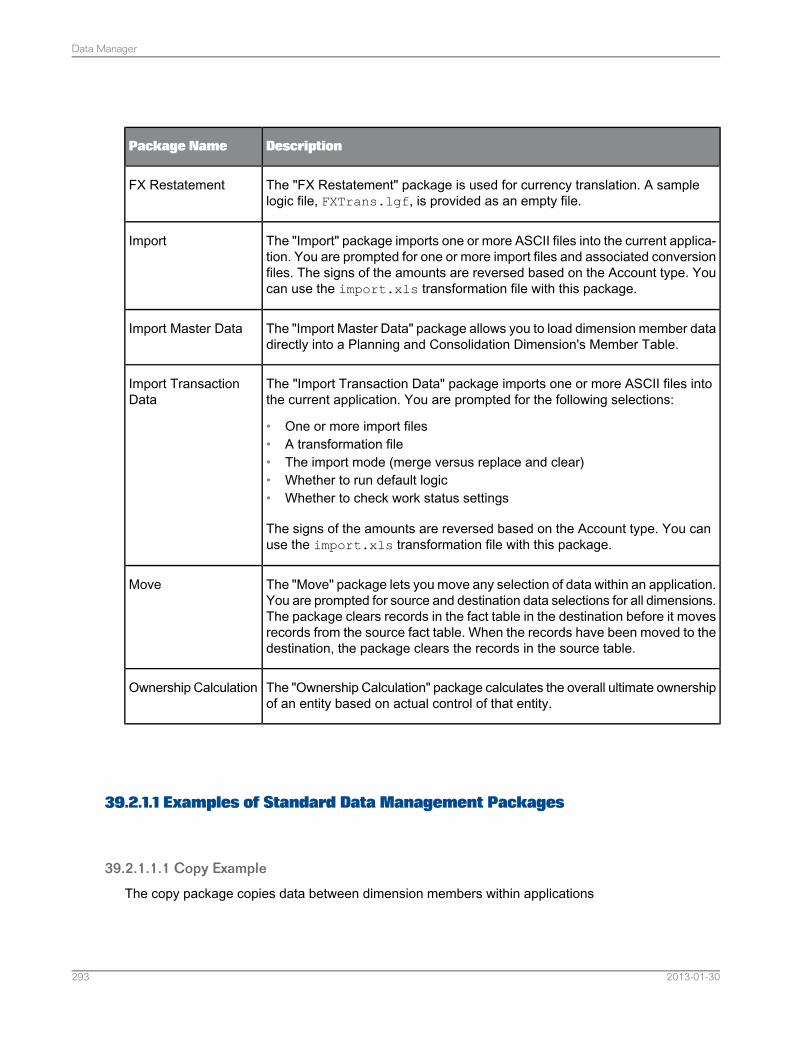
DescriptionPackage Name
The "FX Restatement" package is used for currency translation. A samplelogic file, FXTrans.lgf, is provided as an empty file.
FX Restatement
The "Import" package imports one or more ASCII files into the current applica-tion. You are prompted for one or more import files and associated conversionfiles. The signs of the amounts are reversed based on the Account type. Youcan use the import.xls transformation file with this package.
Import
The "Import Master Data" package allows you to load dimension member datadirectly into a Planning and Consolidation Dimension's Member Table.
Import Master Data
The "Import Transaction Data" package imports one or more ASCII files intothe current application. You are prompted for the following selections:
• One or more import files• A transformation file• The import mode (merge versus replace and clear)• Whether to run default logic• Whether to check work status settings
The signs of the amounts are reversed based on the Account type. You canuse the import.xls transformation file with this package.
Import TransactionData
The "Move" package lets you move any selection of data within an application.You are prompted for source and destination data selections for all dimensions.The package clears records in the fact table in the destination before it movesrecords from the source fact table. When the records have been moved to thedestination, the package clears the records in the source table.
Move
The "Ownership Calculation" package calculates the overall ultimate ownershipof an entity based on actual control of that entity.
Ownership Calculation
39.2.1.1 Examples of Standard Data Management Packages
39.2.1.1.1 Copy Example
The copy package copies data between dimension members within applications
2013-01-30293
Data Manager
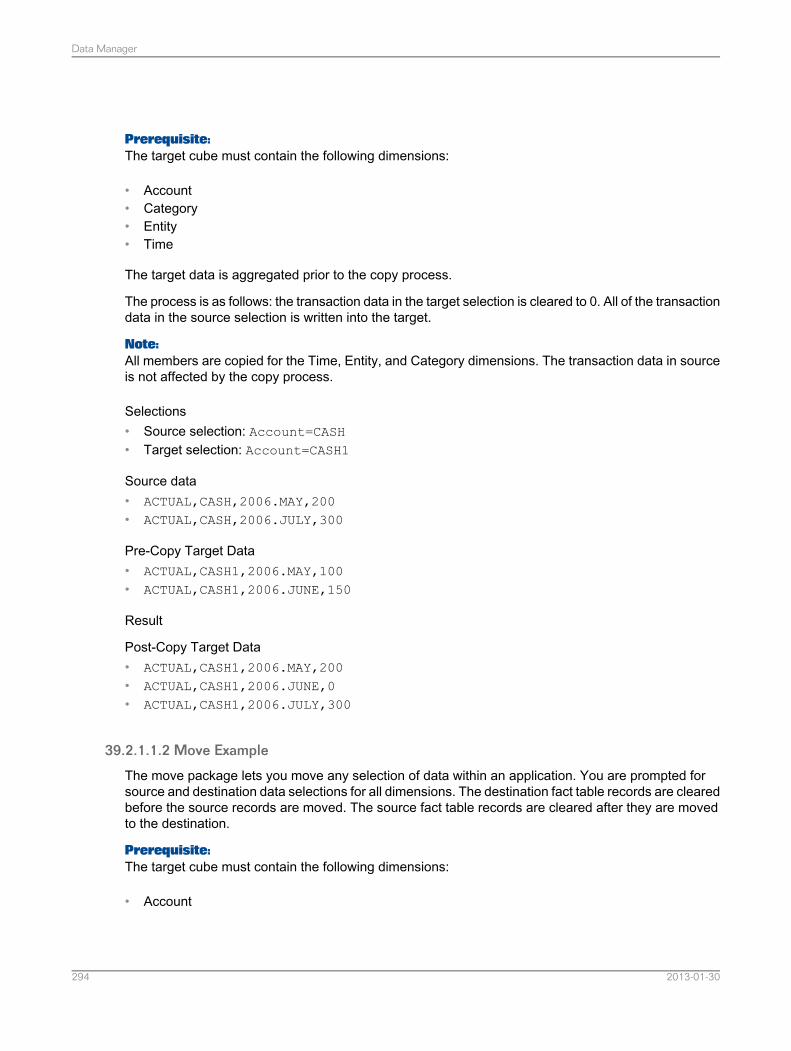
Prerequisite:The target cube must contain the following dimensions:
• Account• Category• Entity• Time
The target data is aggregated prior to the copy process.
The process is as follows: the transaction data in the target selection is cleared to 0. All of the transactiondata in the source selection is written into the target.
Note:All members are copied for the Time, Entity, and Category dimensions. The transaction data in sourceis not affected by the copy process.
Selections• Source selection: Account=CASH• Target selection: Account=CASH1
Source data• ACTUAL,CASH,2006.MAY,200• ACTUAL,CASH,2006.JULY,300
Pre-Copy Target Data• ACTUAL,CASH1,2006.MAY,100• ACTUAL,CASH1,2006.JUNE,150
Result
Post-Copy Target Data• ACTUAL,CASH1,2006.MAY,200• ACTUAL,CASH1,2006.JUNE,0• ACTUAL,CASH1,2006.JULY,300
39.2.1.1.2 Move Example
The move package lets you move any selection of data within an application. You are prompted forsource and destination data selections for all dimensions. The destination fact table records are clearedbefore the source records are moved. The source fact table records are cleared after they are movedto the destination.
Prerequisite:The target cube must contain the following dimensions:
• Account
2013-01-30294
Data Manager
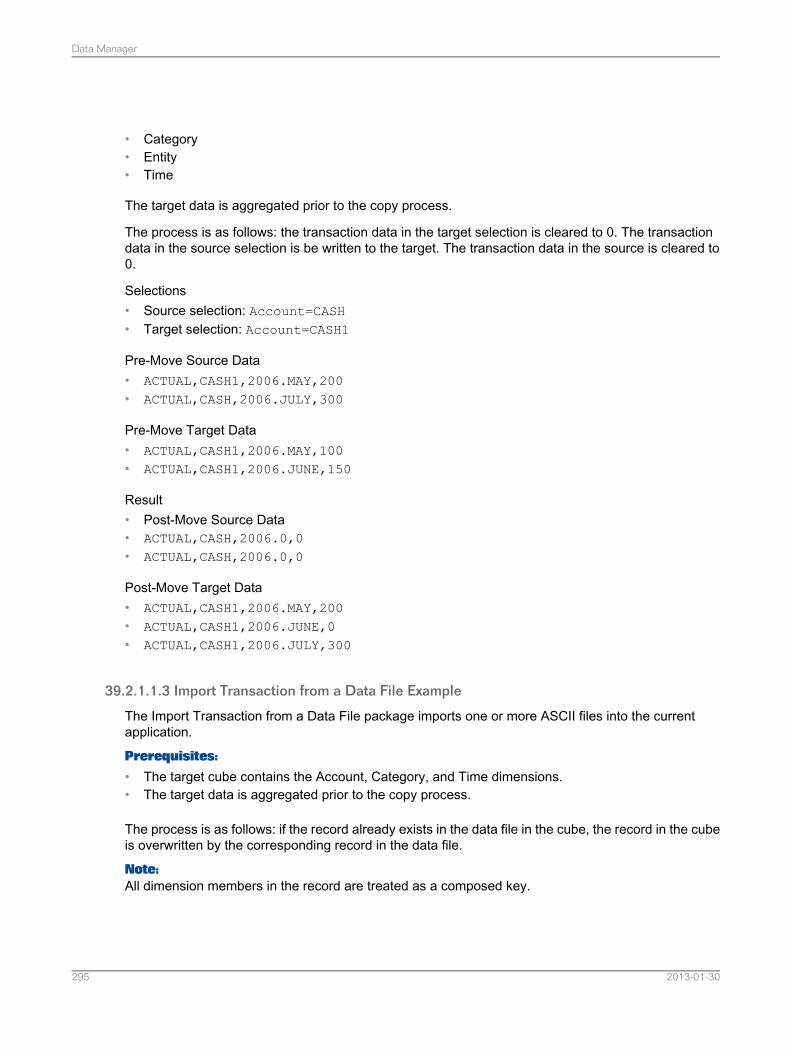
• Category• Entity• Time
The target data is aggregated prior to the copy process.
The process is as follows: the transaction data in the target selection is cleared to 0. The transactiondata in the source selection is be written to the target. The transaction data in the source is cleared to0.
Selections• Source selection: Account=CASH• Target selection: Account=CASH1
Pre-Move Source Data• ACTUAL,CASH1,2006.MAY,200• ACTUAL,CASH,2006.JULY,300
Pre-Move Target Data• ACTUAL,CASH1,2006.MAY,100• ACTUAL,CASH1,2006.JUNE,150
Result• Post-Move Source Data• ACTUAL,CASH,2006.0,0• ACTUAL,CASH,2006.0,0
Post-Move Target Data• ACTUAL,CASH1,2006.MAY,200• ACTUAL,CASH1,2006.JUNE,0• ACTUAL,CASH1,2006.JULY,300
39.2.1.1.3 Import Transaction from a Data File Example
The Import Transaction from a Data File package imports one or more ASCII files into the currentapplication.
Prerequisites:
• The target cube contains the Account, Category, and Time dimensions.• The target data is aggregated prior to the copy process.
The process is as follows: if the record already exists in the data file in the cube, the record in the cubeis overwritten by the corresponding record in the data file.
Note:All dimension members in the record are treated as a composed key.
2013-01-30295
Data Manager
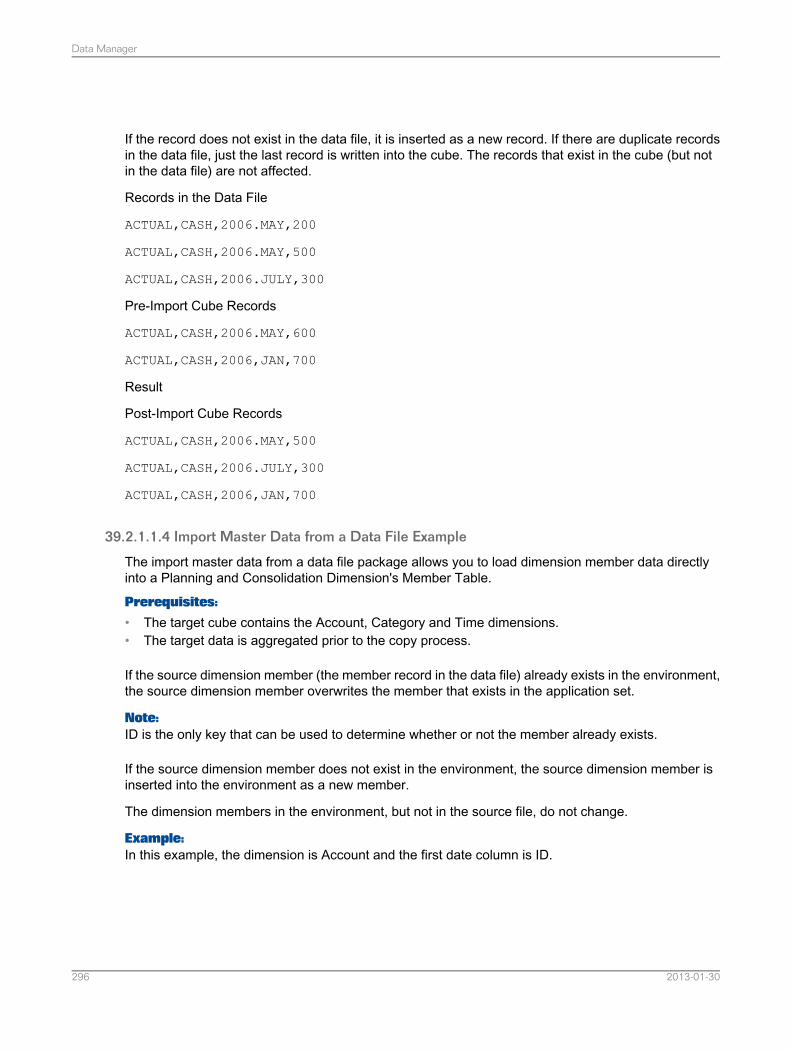
If the record does not exist in the data file, it is inserted as a new record. If there are duplicate recordsin the data file, just the last record is written into the cube. The records that exist in the cube (but notin the data file) are not affected.
Records in the Data File
ACTUAL,CASH,2006.MAY,200
ACTUAL,CASH,2006.MAY,500
ACTUAL,CASH,2006.JULY,300
Pre-Import Cube Records
ACTUAL,CASH,2006.MAY,600
ACTUAL,CASH,2006,JAN,700
Result
Post-Import Cube Records
ACTUAL,CASH,2006.MAY,500
ACTUAL,CASH,2006.JULY,300
ACTUAL,CASH,2006,JAN,700
39.2.1.1.4 Import Master Data from a Data File Example
The import master data from a data file package allows you to load dimension member data directlyinto a Planning and Consolidation Dimension's Member Table.
Prerequisites:
• The target cube contains the Account, Category and Time dimensions.• The target data is aggregated prior to the copy process.
If the source dimension member (the member record in the data file) already exists in the environment,the source dimension member overwrites the member that exists in the application set.
Note:ID is the only key that can be used to determine whether or not the member already exists.
If the source dimension member does not exist in the environment, the source dimension member isinserted into the environment as a new member.
The dimension members in the environment, but not in the source file, do not change.
Example:In this example, the dimension is Account and the first date column is ID.
2013-01-30296
Data Manager
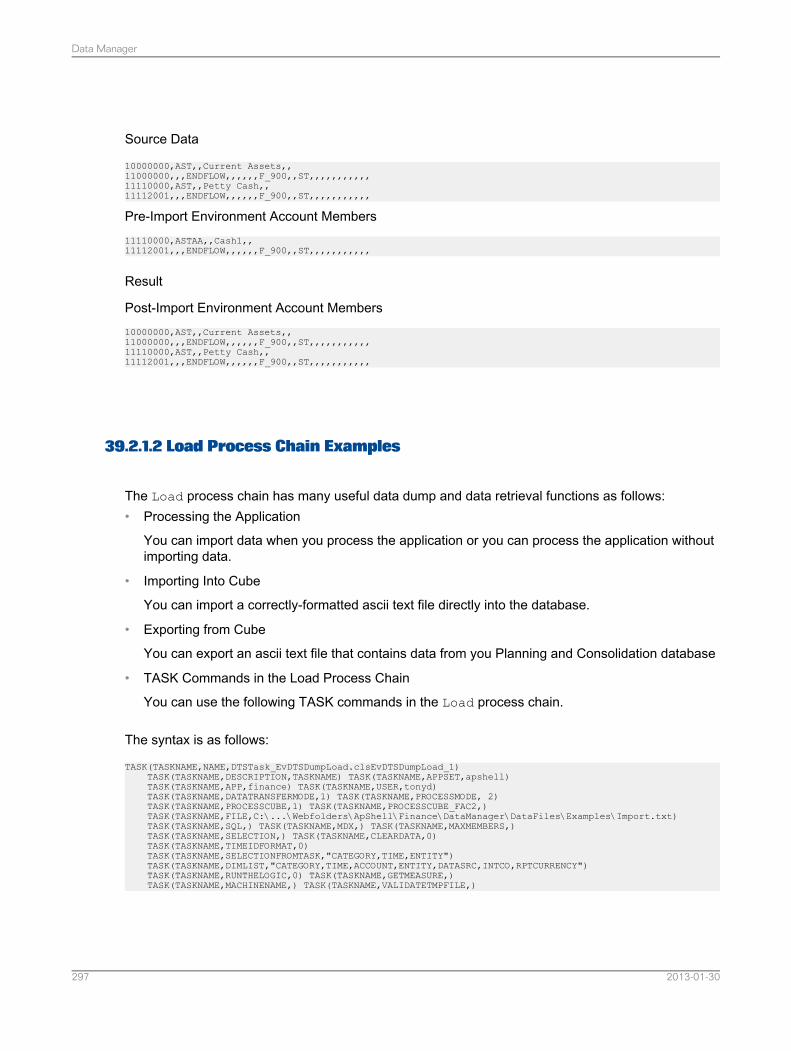
Source Data
10000000,AST,,Current Assets,,11000000,,,ENDFLOW,,,,,,F_900,,ST,,,,,,,,,,,11110000,AST,,Petty Cash,,11112001,,,ENDFLOW,,,,,,F_900,,ST,,,,,,,,,,,
Pre-Import Environment Account Members11110000,ASTAA,,Cash1,,11112001,,,ENDFLOW,,,,,,F_900,,ST,,,,,,,,,,,
Result
Post-Import Environment Account Members10000000,AST,,Current Assets,,11000000,,,ENDFLOW,,,,,,F_900,,ST,,,,,,,,,,,11110000,AST,,Petty Cash,,11112001,,,ENDFLOW,,,,,,F_900,,ST,,,,,,,,,,,
39.2.1.2 Load Process Chain Examples
The Load process chain has many useful data dump and data retrieval functions as follows:• Processing the Application
You can import data when you process the application or you can process the application withoutimporting data.
• Importing Into Cube
You can import a correctly-formatted ascii text file directly into the database.
• Exporting from Cube
You can export an ascii text file that contains data from you Planning and Consolidation database
• TASK Commands in the Load Process Chain
You can use the following TASK commands in the Load process chain.
The syntax is as follows:
TASK(TASKNAME,NAME,DTSTask_EvDTSDumpLoad.clsEvDTSDumpLoad_1)TASK(TASKNAME,DESCRIPTION,TASKNAME) TASK(TASKNAME,APPSET,apshell)TASK(TASKNAME,APP,finance) TASK(TASKNAME,USER,tonyd)TASK(TASKNAME,DATATRANSFERMODE,1) TASK(TASKNAME,PROCESSMODE, 2)TASK(TASKNAME,PROCESSCUBE,1) TASK(TASKNAME,PROCESSCUBE_FAC2,)TASK(TASKNAME,FILE,C:\...\Webfolders\ApShell\Finance\DataManager\DataFiles\Examples\Import.txt)TASK(TASKNAME,SQL,) TASK(TASKNAME,MDX,) TASK(TASKNAME,MAXMEMBERS,)TASK(TASKNAME,SELECTION,) TASK(TASKNAME,CLEARDATA,0)TASK(TASKNAME,TIMEIDFORMAT,0)TASK(TASKNAME,SELECTIONFROMTASK,"CATEGORY,TIME,ENTITY")TASK(TASKNAME,DIMLIST,"CATEGORY,TIME,ACCOUNT,ENTITY,DATASRC,INTCO,RPTCURRENCY")TASK(TASKNAME,RUNTHELOGIC,0) TASK(TASKNAME,GETMEASURE,)TASK(TASKNAME,MACHINENAME,) TASK(TASKNAME,VALIDATETMPFILE,)
2013-01-30297
Data Manager
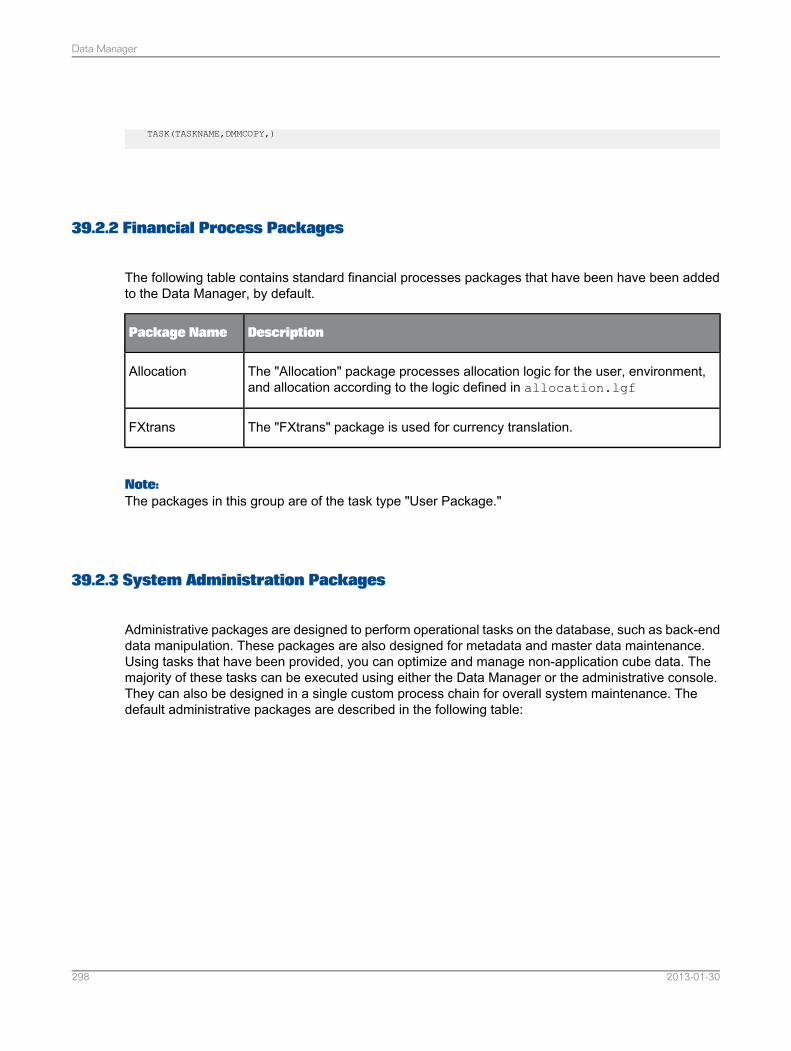
TASK(TASKNAME,DMMCOPY,)
39.2.2 Financial Process Packages
The following table contains standard financial processes packages that have been have been addedto the Data Manager, by default.
DescriptionPackage Name
The "Allocation" package processes allocation logic for the user, environment,and allocation according to the logic defined in allocation.lgf
Allocation
The "FXtrans" package is used for currency translation.FXtrans
Note:The packages in this group are of the task type "User Package."
39.2.3 System Administration Packages
Administrative packages are designed to perform operational tasks on the database, such as back-enddata manipulation. These packages are also designed for metadata and master data maintenance.Using tasks that have been provided, you can optimize and manage non-application cube data. Themajority of these tasks can be executed using either the Data Manager or the administrative console.They can also be designed in a single custom process chain for overall system maintenance. Thedefault administrative packages are described in the following table:
2013-01-30298
Data Manager
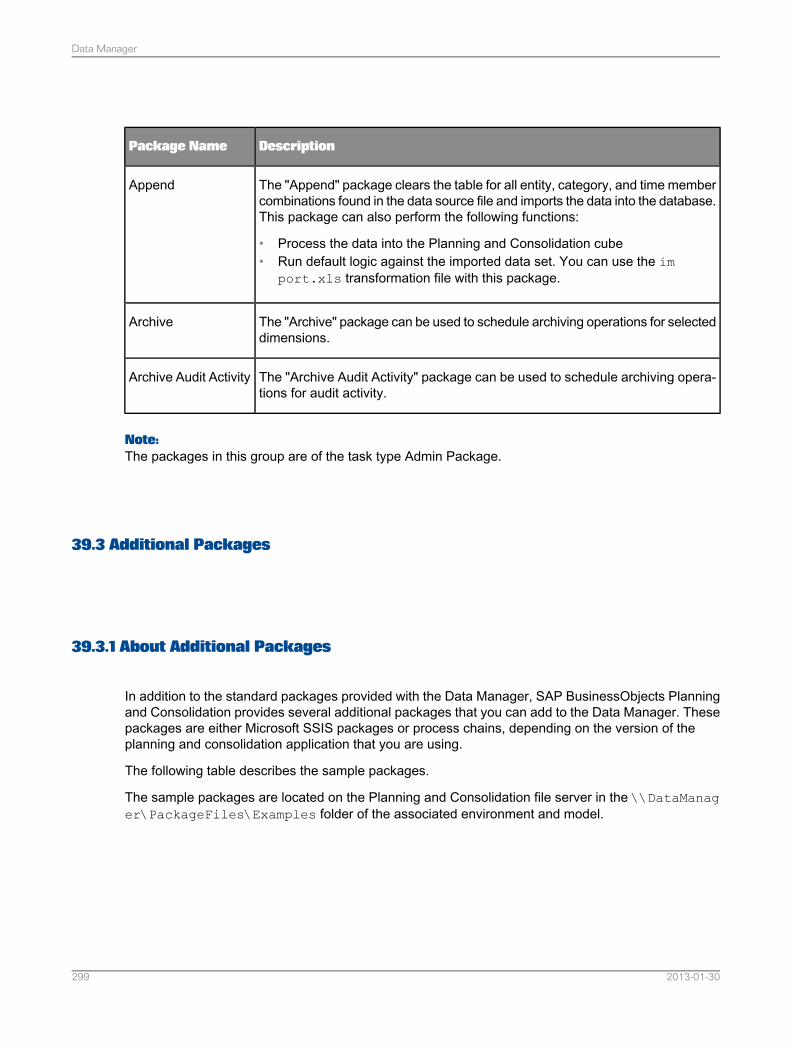
DescriptionPackage Name
The "Append" package clears the table for all entity, category, and time membercombinations found in the data source file and imports the data into the database.This package can also perform the following functions:
• Process the data into the Planning and Consolidation cube• Run default logic against the imported data set. You can use the im
port.xls transformation file with this package.
Append
The "Archive" package can be used to schedule archiving operations for selecteddimensions.
Archive
The "Archive Audit Activity" package can be used to schedule archiving opera-tions for audit activity.
Archive Audit Activity
Note:The packages in this group are of the task type Admin Package.
39.3 Additional Packages
39.3.1 About Additional Packages
In addition to the standard packages provided with the Data Manager, SAP BusinessObjects Planningand Consolidation provides several additional packages that you can add to the Data Manager. Thesepackages are either Microsoft SSIS packages or process chains, depending on the version of theplanning and consolidation application that you are using.
The following table describes the sample packages.
The sample packages are located on the Planning and Consolidation file server in the \\DataManager\PackageFiles\Examples folder of the associated environment and model.
2013-01-30299
Data Manager
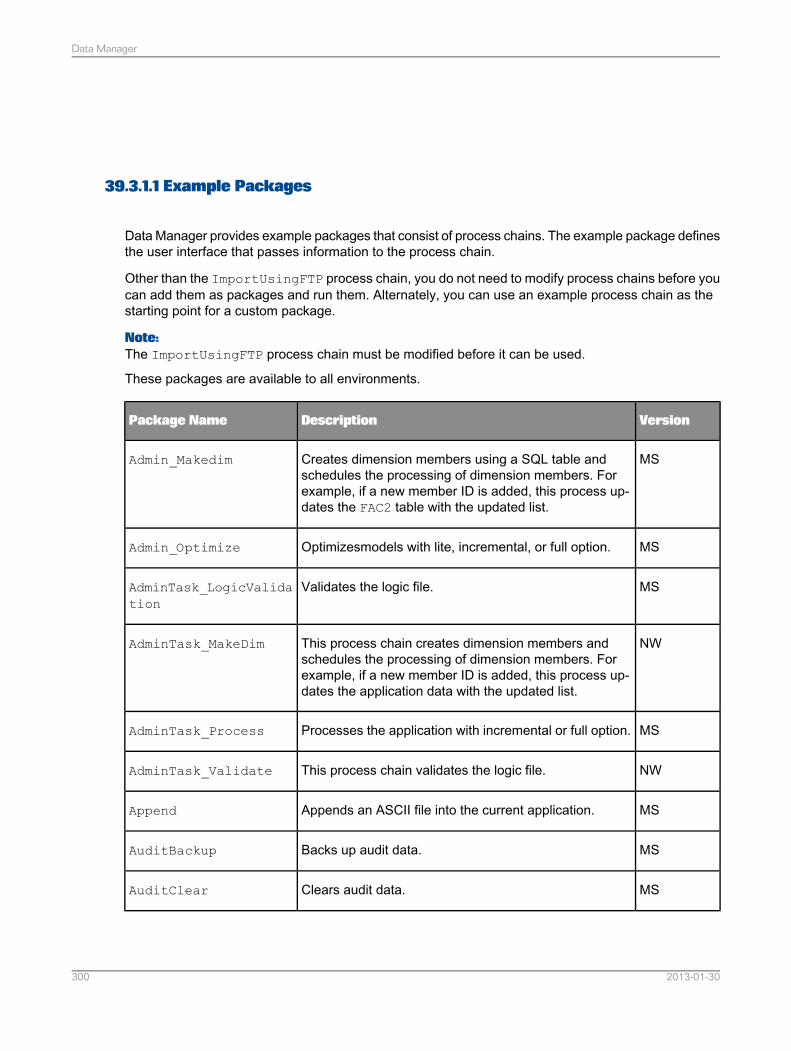
39.3.1.1 Example Packages
Data Manager provides example packages that consist of process chains. The example package definesthe user interface that passes information to the process chain.
Other than the ImportUsingFTP process chain, you do not need to modify process chains before youcan add them as packages and run them. Alternately, you can use an example process chain as thestarting point for a custom package.
Note:The ImportUsingFTP process chain must be modified before it can be used.
These packages are available to all environments.
VersionDescriptionPackage Name
MSCreates dimension members using a SQL table andschedules the processing of dimension members. Forexample, if a new member ID is added, this process up-dates the FAC2 table with the updated list.
Admin_Makedim
MSOptimizesmodels with lite, incremental, or full option.Admin_Optimize
MSValidates the logic file.AdminTask_LogicValidation
NWThis process chain creates dimension members andschedules the processing of dimension members. Forexample, if a new member ID is added, this process up-dates the application data with the updated list.
AdminTask_MakeDim
MSProcesses the application with incremental or full option.AdminTask_Process
NWThis process chain validates the logic file.AdminTask_Validate
MSAppends an ASCII file into the current application.Append
MSBacks up audit data.AuditBackup
MSClears audit data.AuditClear
2013-01-30300
Data Manager
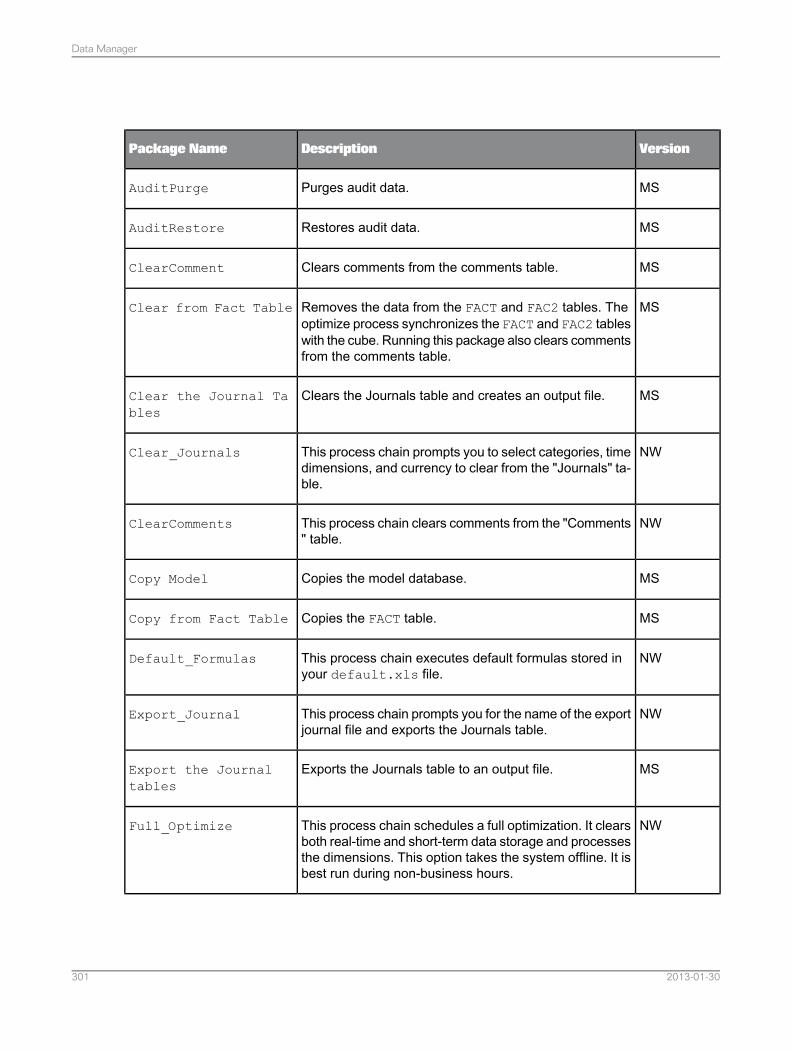
VersionDescriptionPackage Name
MSPurges audit data.AuditPurge
MSRestores audit data.AuditRestore
MSClears comments from the comments table.ClearComment
MSRemoves the data from the FACT and FAC2 tables. Theoptimize process synchronizes the FACT and FAC2 tableswith the cube. Running this package also clears commentsfrom the comments table.
Clear from Fact Table
MSClears the Journals table and creates an output file.Clear the Journal Tables
NWThis process chain prompts you to select categories, timedimensions, and currency to clear from the "Journals" ta-ble.
Clear_Journals
NWThis process chain clears comments from the "Comments" table.
ClearComments
MSCopies the model database.Copy Model
MSCopies the FACT table.Copy from Fact Table
NWThis process chain executes default formulas stored inyour default.xls file.
Default_Formulas
NWThis process chain prompts you for the name of the exportjournal file and exports the Journals table.
Export_Journal
MSExports the Journals table to an output file.Export the Journaltables
NWThis process chain schedules a full optimization. It clearsboth real-time and short-term data storage and processesthe dimensions. This option takes the system offline. It isbest run during non-business hours.
Full_Optimize
2013-01-30301
Data Manager
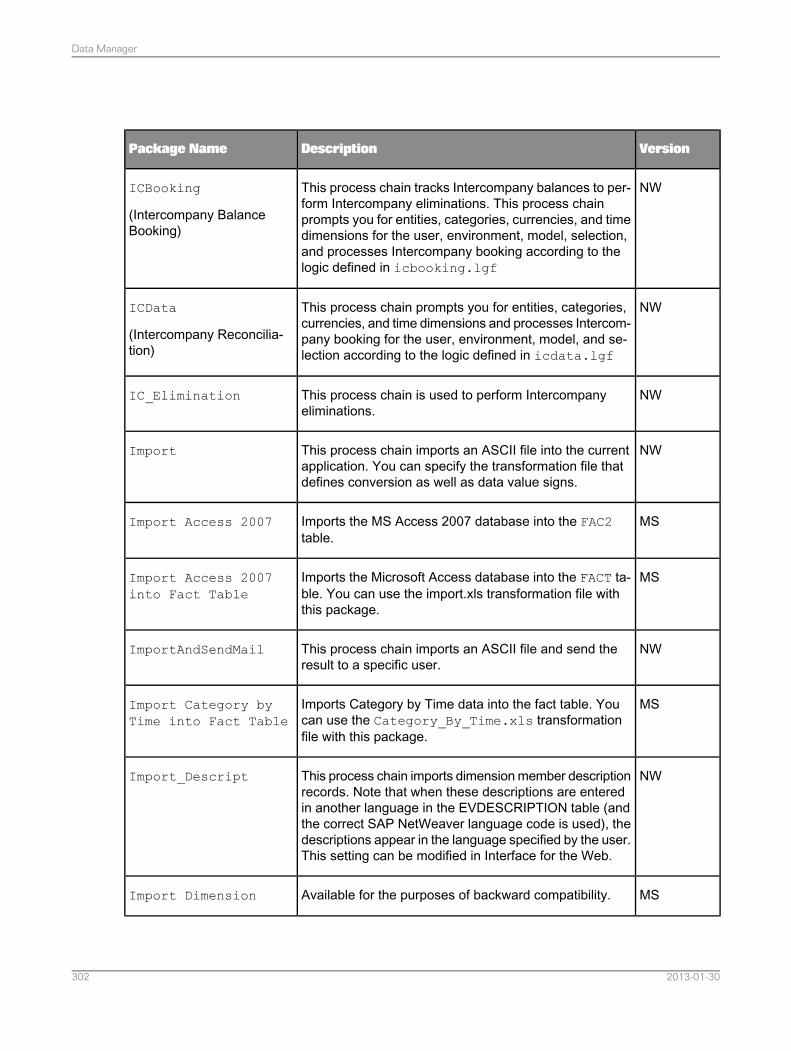
VersionDescriptionPackage Name
NWThis process chain tracks Intercompany balances to per-form Intercompany eliminations. This process chainprompts you for entities, categories, currencies, and timedimensions for the user, environment, model, selection,and processes Intercompany booking according to thelogic defined in icbooking.lgf
ICBooking
(Intercompany BalanceBooking)
NWThis process chain prompts you for entities, categories,currencies, and time dimensions and processes Intercom-pany booking for the user, environment, model, and se-lection according to the logic defined in icdata.lgf
ICData
(Intercompany Reconcilia-tion)
NWThis process chain is used to perform Intercompanyeliminations.
IC_Elimination
NWThis process chain imports an ASCII file into the currentapplication. You can specify the transformation file thatdefines conversion as well as data value signs.
Import
MSImports the MS Access 2007 database into the FAC2table.
Import Access 2007
MSImports the Microsoft Access database into the FACT ta-ble. You can use the import.xls transformation file withthis package.
Import Access 2007into Fact Table
NWThis process chain imports an ASCII file and send theresult to a specific user.
ImportAndSendMail
MSImports Category by Time data into the fact table. Youcan use the Category_By_Time.xls transformationfile with this package.
Import Category byTime into Fact Table
NWThis process chain imports dimension member descriptionrecords. Note that when these descriptions are enteredin another language in the EVDESCRIPTION table (andthe correct SAP NetWeaver language code is used), thedescriptions appear in the language specified by the user.This setting can be modified in Interface for the Web.
Import_Descript
MSAvailable for the purposes of backward compatibility.Import Dimension
2013-01-30302
Data Manager
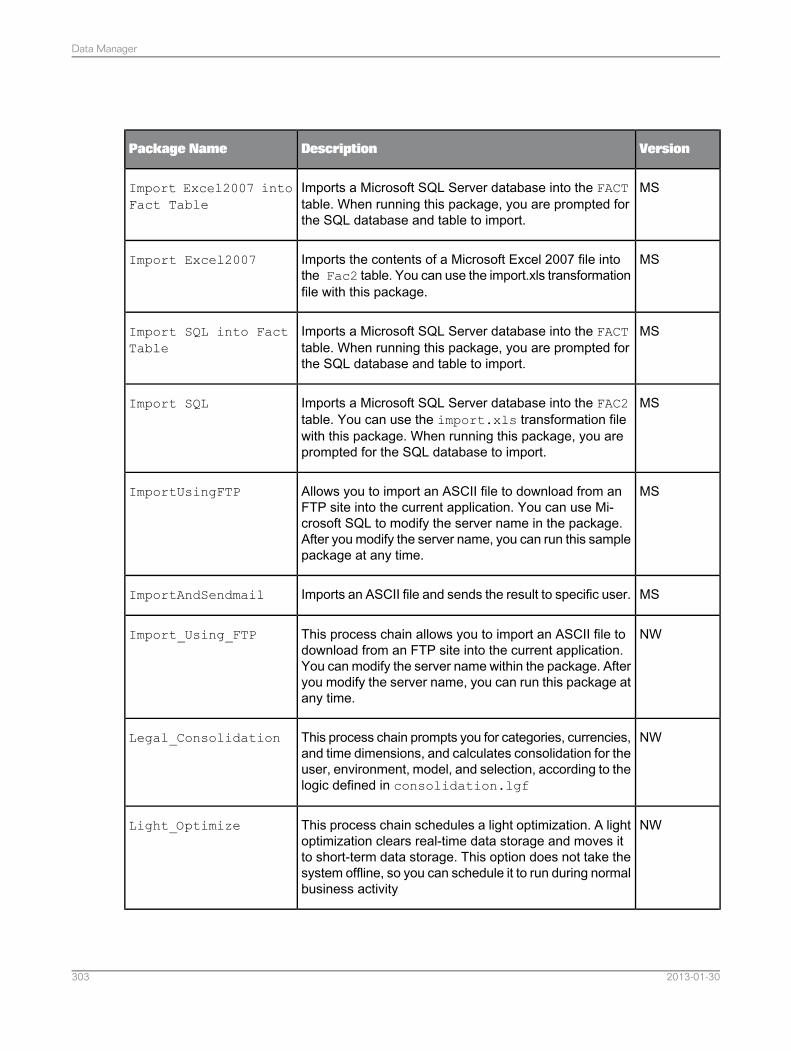
VersionDescriptionPackage Name
MSImports a Microsoft SQL Server database into the FACTtable. When running this package, you are prompted forthe SQL database and table to import.
Import Excel2007 intoFact Table
MSImports the contents of a Microsoft Excel 2007 file intothe Fac2 table. You can use the import.xls transformationfile with this package.
Import Excel2007
MSImports a Microsoft SQL Server database into the FACTtable. When running this package, you are prompted forthe SQL database and table to import.
Import SQL into FactTable
MSImports a Microsoft SQL Server database into the FAC2table. You can use the import.xls transformation filewith this package. When running this package, you areprompted for the SQL database to import.
Import SQL
MSAllows you to import an ASCII file to download from anFTP site into the current application. You can use Mi-crosoft SQL to modify the server name in the package.After you modify the server name, you can run this samplepackage at any time.
ImportUsingFTP
MSImports an ASCII file and sends the result to specific user.ImportAndSendmail
NWThis process chain allows you to import an ASCII file todownload from an FTP site into the current application.You can modify the server name within the package. Afteryou modify the server name, you can run this package atany time.
Import_Using_FTP
NWThis process chain prompts you for categories, currencies,and time dimensions, and calculates consolidation for theuser, environment, model, and selection, according to thelogic defined in consolidation.lgf
Legal_Consolidation
NWThis process chain schedules a light optimization. A lightoptimization clears real-time data storage and moves itto short-term data storage. This option does not take thesystem offline, so you can schedule it to run during normalbusiness activity
Light_Optimize
2013-01-30303
Data Manager
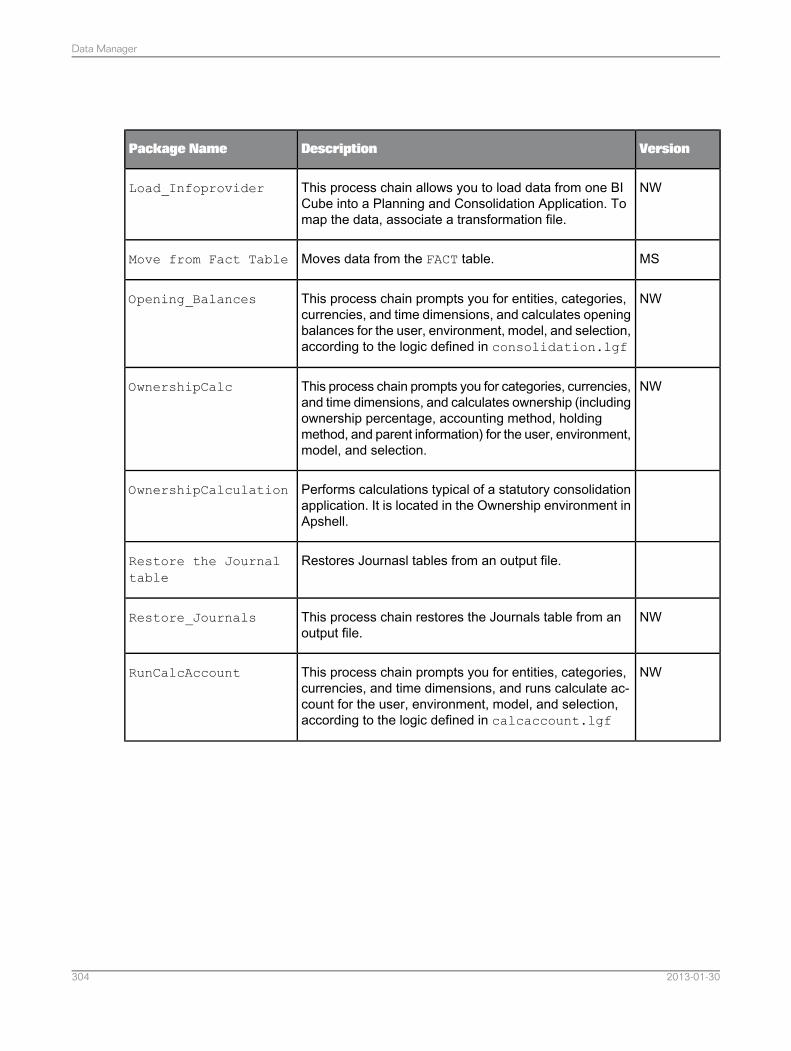
VersionDescriptionPackage Name
NWThis process chain allows you to load data from one BICube into a Planning and Consolidation Application. Tomap the data, associate a transformation file.
Load_Infoprovider
MSMoves data from the FACT table.Move from Fact Table
NWThis process chain prompts you for entities, categories,currencies, and time dimensions, and calculates openingbalances for the user, environment, model, and selection,according to the logic defined in consolidation.lgf
Opening_Balances
NWThis process chain prompts you for categories, currencies,and time dimensions, and calculates ownership (includingownership percentage, accounting method, holdingmethod, and parent information) for the user, environment,model, and selection.
OwnershipCalc
Performs calculations typical of a statutory consolidationapplication. It is located in the Ownership environment inApshell.
OwnershipCalculation
Restores Journasl tables from an output file.Restore the Journaltable
NWThis process chain restores the Journals table from anoutput file.
Restore_Journals
NWThis process chain prompts you for entities, categories,currencies, and time dimensions, and runs calculate ac-count for the user, environment, model, and selection,according to the logic defined in calcaccount.lgf
RunCalcAccount
2013-01-30304
Data Manager
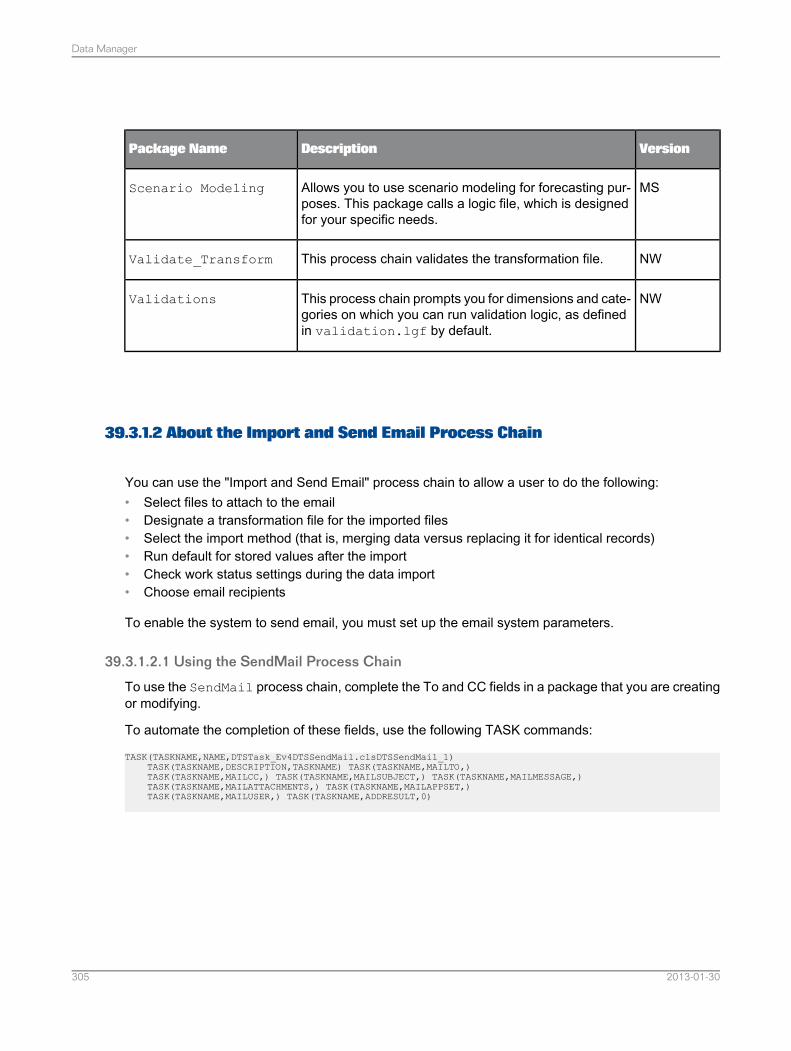
VersionDescriptionPackage Name
MSAllows you to use scenario modeling for forecasting pur-poses. This package calls a logic file, which is designedfor your specific needs.
Scenario Modeling
NWThis process chain validates the transformation file.Validate_Transform
NWThis process chain prompts you for dimensions and cate-gories on which you can run validation logic, as definedin validation.lgf by default.
Validations
39.3.1.2 About the Import and Send Email Process Chain
You can use the "Import and Send Email" process chain to allow a user to do the following:• Select files to attach to the email• Designate a transformation file for the imported files• Select the import method (that is, merging data versus replacing it for identical records)• Run default for stored values after the import• Check work status settings during the data import• Choose email recipients
To enable the system to send email, you must set up the email system parameters.
39.3.1.2.1 Using the SendMail Process Chain
To use the SendMail process chain, complete the To and CC fields in a package that you are creatingor modifying.
To automate the completion of these fields, use the following TASK commands:
TASK(TASKNAME,NAME,DTSTask_Ev4DTSSendMail.clsDTSSendMail_1)TASK(TASKNAME,DESCRIPTION,TASKNAME) TASK(TASKNAME,MAILTO,)TASK(TASKNAME,MAILCC,) TASK(TASKNAME,MAILSUBJECT,) TASK(TASKNAME,MAILMESSAGE,)TASK(TASKNAME,MAILATTACHMENTS,) TASK(TASKNAME,MAILAPPSET,)TASK(TASKNAME,MAILUSER,) TASK(TASKNAME,ADDRESULT,0)
2013-01-30305
Data Manager
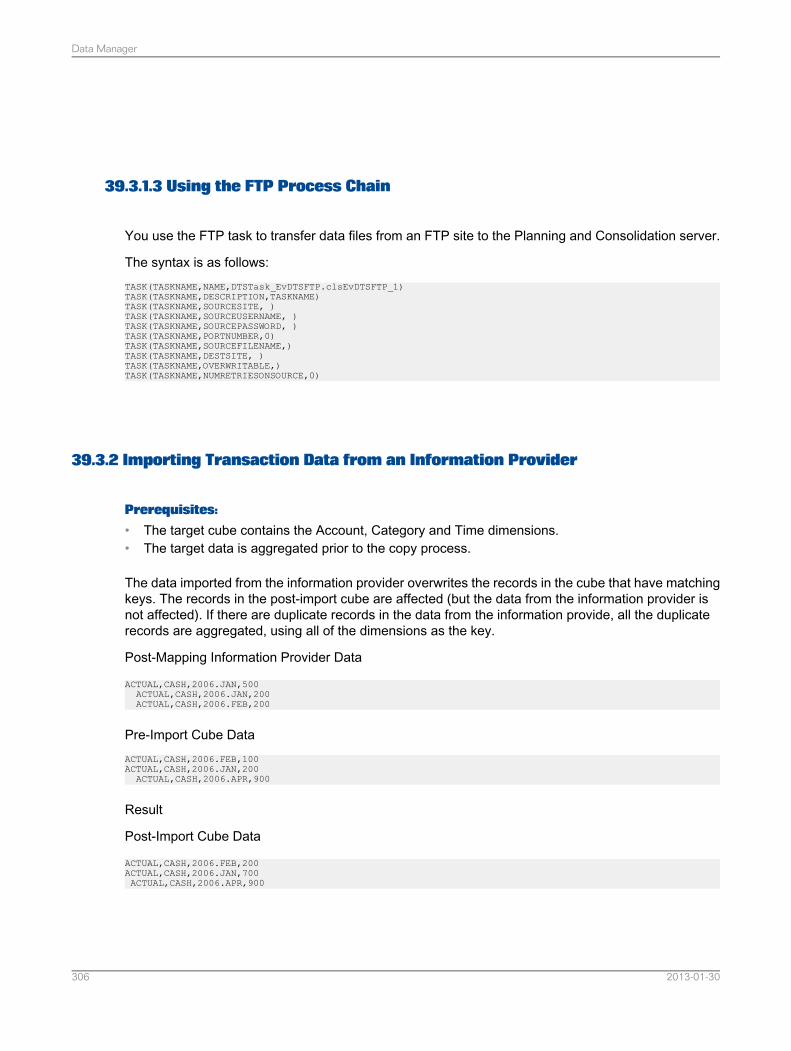
39.3.1.3 Using the FTP Process Chain
You use the FTP task to transfer data files from an FTP site to the Planning and Consolidation server.
The syntax is as follows:TASK(TASKNAME,NAME,DTSTask_EvDTSFTP.clsEvDTSFTP_1)TASK(TASKNAME,DESCRIPTION,TASKNAME)TASK(TASKNAME,SOURCESITE, )TASK(TASKNAME,SOURCEUSERNAME, )TASK(TASKNAME,SOURCEPASSWORD, )TASK(TASKNAME,PORTNUMBER,0)TASK(TASKNAME,SOURCEFILENAME,)TASK(TASKNAME,DESTSITE, )TASK(TASKNAME,OVERWRITABLE,)TASK(TASKNAME,NUMRETRIESONSOURCE,0)
39.3.2 Importing Transaction Data from an Information Provider
Prerequisites:
• The target cube contains the Account, Category and Time dimensions.• The target data is aggregated prior to the copy process.
The data imported from the information provider overwrites the records in the cube that have matchingkeys. The records in the post-import cube are affected (but the data from the information provider isnot affected). If there are duplicate records in the data from the information provide, all the duplicaterecords are aggregated, using all of the dimensions as the key.
Post-Mapping Information Provider Data
ACTUAL,CASH,2006.JAN,500ACTUAL,CASH,2006.JAN,200ACTUAL,CASH,2006.FEB,200
Pre-Import Cube DataACTUAL,CASH,2006.FEB,100ACTUAL,CASH,2006.JAN,200ACTUAL,CASH,2006.APR,900
Result
Post-Import Cube Data
ACTUAL,CASH,2006.FEB,200ACTUAL,CASH,2006.JAN,700ACTUAL,CASH,2006.APR,900
2013-01-30306
Data Manager
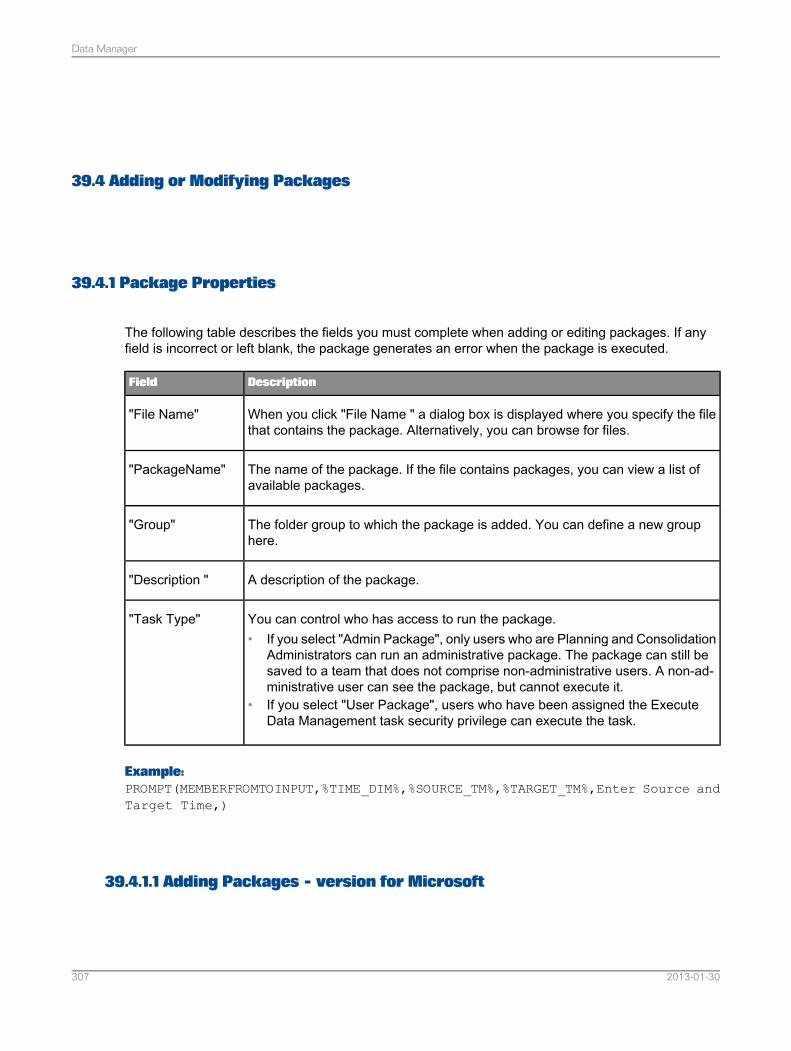
39.4 Adding or Modifying Packages
39.4.1 Package Properties
The following table describes the fields you must complete when adding or editing packages. If anyfield is incorrect or left blank, the package generates an error when the package is executed.
DescriptionField
When you click "File Name " a dialog box is displayed where you specify the filethat contains the package. Alternatively, you can browse for files.
"File Name"
The name of the package. If the file contains packages, you can view a list ofavailable packages.
"PackageName"
The folder group to which the package is added. You can define a new grouphere.
"Group"
A description of the package."Description "
You can control who has access to run the package.• If you select "Admin Package", only users who are Planning and Consolidation
Administrators can run an administrative package. The package can still besaved to a team that does not comprise non-administrative users. A non-ad-ministrative user can see the package, but cannot execute it.
• If you select "User Package", users who have been assigned the ExecuteData Management task security privilege can execute the task.
"Task Type"
Example:PROMPT(MEMBERFROMTOINPUT,%TIME_DIM%,%SOURCE_TM%,%TARGET_TM%,Enter Source andTarget Time,)
39.4.1.1 Adding Packages - version for Microsoft
2013-01-30307
Data Manager
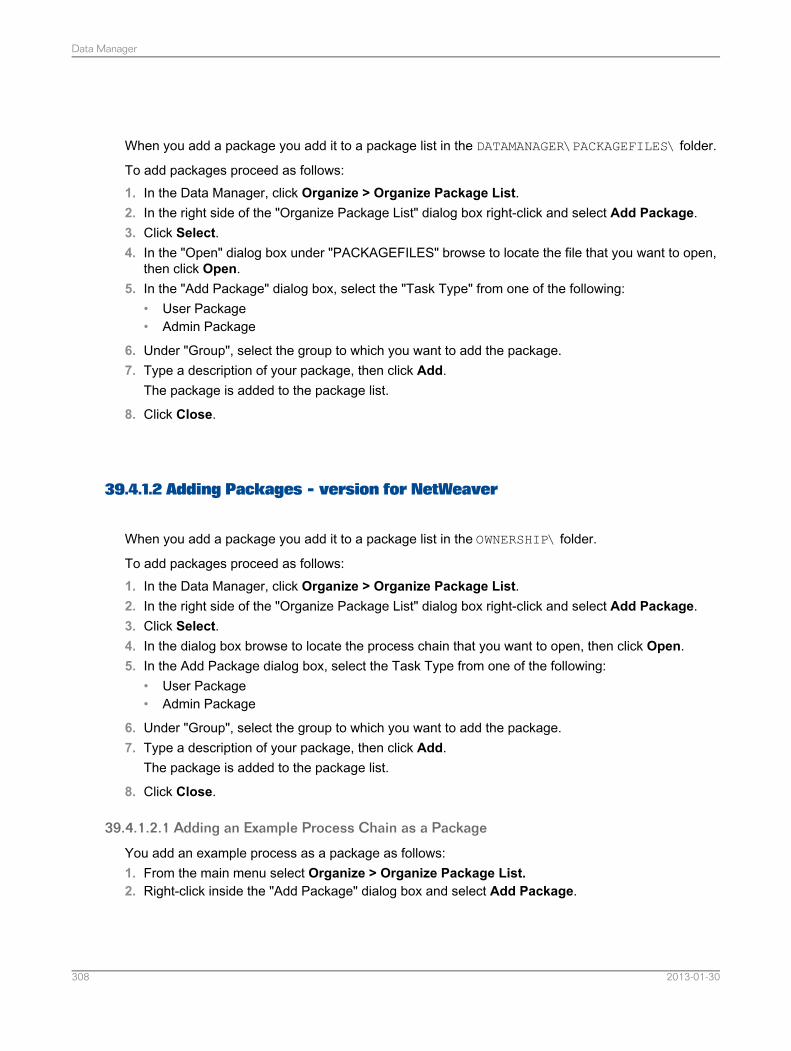
When you add a package you add it to a package list in the DATAMANAGER\PACKAGEFILES\ folder.
To add packages proceed as follows:1. In the Data Manager, click Organize > Organize Package List.2. In the right side of the "Organize Package List" dialog box right-click and select Add Package.3. Click Select.4. In the "Open" dialog box under "PACKAGEFILES" browse to locate the file that you want to open,
then click Open.5. In the "Add Package" dialog box, select the "Task Type" from one of the following:
• User Package• Admin Package
6. Under "Group", select the group to which you want to add the package.7. Type a description of your package, then click Add.
The package is added to the package list.
8. Click Close.
39.4.1.2 Adding Packages - version for NetWeaver
When you add a package you add it to a package list in the OWNERSHIP\ folder.
To add packages proceed as follows:1. In the Data Manager, click Organize > Organize Package List.2. In the right side of the "Organize Package List" dialog box right-click and select Add Package.3. Click Select.4. In the dialog box browse to locate the process chain that you want to open, then click Open.5. In the Add Package dialog box, select the Task Type from one of the following:
• User Package• Admin Package
6. Under "Group", select the group to which you want to add the package.7. Type a description of your package, then click Add.
The package is added to the package list.
8. Click Close.
39.4.1.2.1 Adding an Example Process Chain as a Package
You add an example process as a package as follows:1. From the main menu select Organize > Organize Package List.2. Right-click inside the "Add Package" dialog box and select Add Package.
2013-01-30308
Data Manager
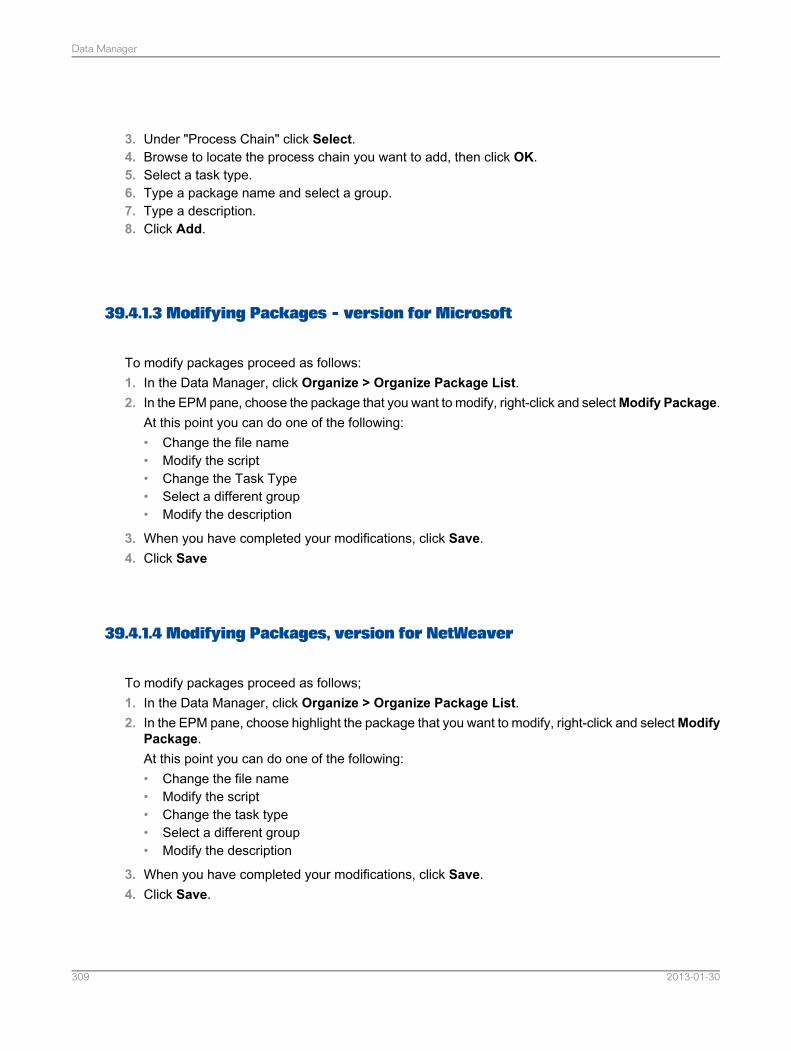
3. Under "Process Chain" click Select.4. Browse to locate the process chain you want to add, then click OK.5. Select a task type.6. Type a package name and select a group.7. Type a description.8. Click Add.
39.4.1.3 Modifying Packages - version for Microsoft
To modify packages proceed as follows:1. In the Data Manager, click Organize > Organize Package List.2. In the EPM pane, choose the package that you want to modify, right-click and selectModify Package.
At this point you can do one of the following:• Change the file name• Modify the script• Change the Task Type• Select a different group• Modify the description
3. When you have completed your modifications, click Save.4. Click Save
39.4.1.4 Modifying Packages, version for NetWeaver
To modify packages proceed as follows;1. In the Data Manager, click Organize > Organize Package List.2. In the EPM pane, choose highlight the package that you want to modify, right-click and selectModify
Package.At this point you can do one of the following:• Change the file name• Modify the script• Change the task type• Select a different group• Modify the description
3. When you have completed your modifications, click Save.4. Click Save.
2013-01-30309
Data Manager
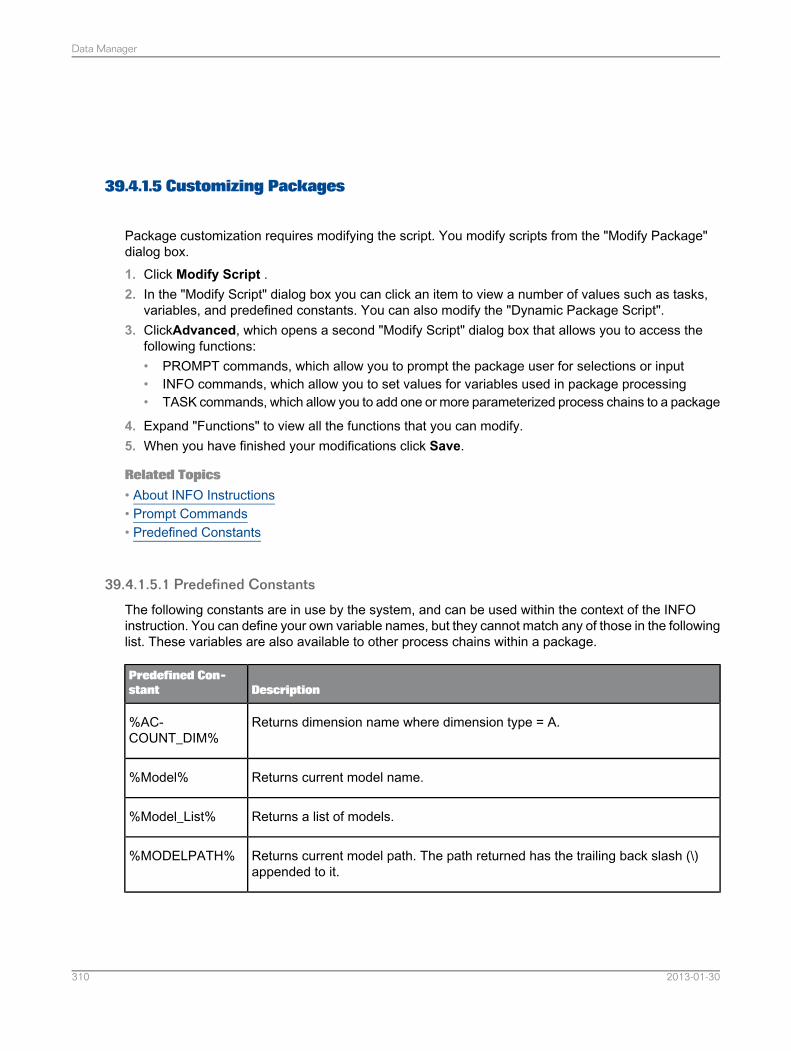
39.4.1.5 Customizing Packages
Package customization requires modifying the script. You modify scripts from the "Modify Package"dialog box.1. Click Modify Script .2. In the "Modify Script" dialog box you can click an item to view a number of values such as tasks,
variables, and predefined constants. You can also modify the "Dynamic Package Script".3. ClickAdvanced, which opens a second "Modify Script" dialog box that allows you to access the
following functions:• PROMPT commands, which allow you to prompt the package user for selections or input• INFO commands, which allow you to set values for variables used in package processing• TASK commands, which allow you to add one or more parameterized process chains to a package
4. Expand "Functions" to view all the functions that you can modify.5. When you have finished your modifications click Save.
Related Topics• About INFO Instructions• Prompt Commands• Predefined Constants
39.4.1.5.1 Predefined Constants
The following constants are in use by the system, and can be used within the context of the INFOinstruction. You can define your own variable names, but they cannot match any of those in the followinglist. These variables are also available to other process chains within a package.
DescriptionPredefined Con-stant
Returns dimension name where dimension type = A.%AC-COUNT_DIM%
Returns current model name.%Model%
Returns a list of models.%Model_List%
Returns current model path. The path returned has the trailing back slash (\)appended to it.
%MODELPATH%
2013-01-30310
Data Manager
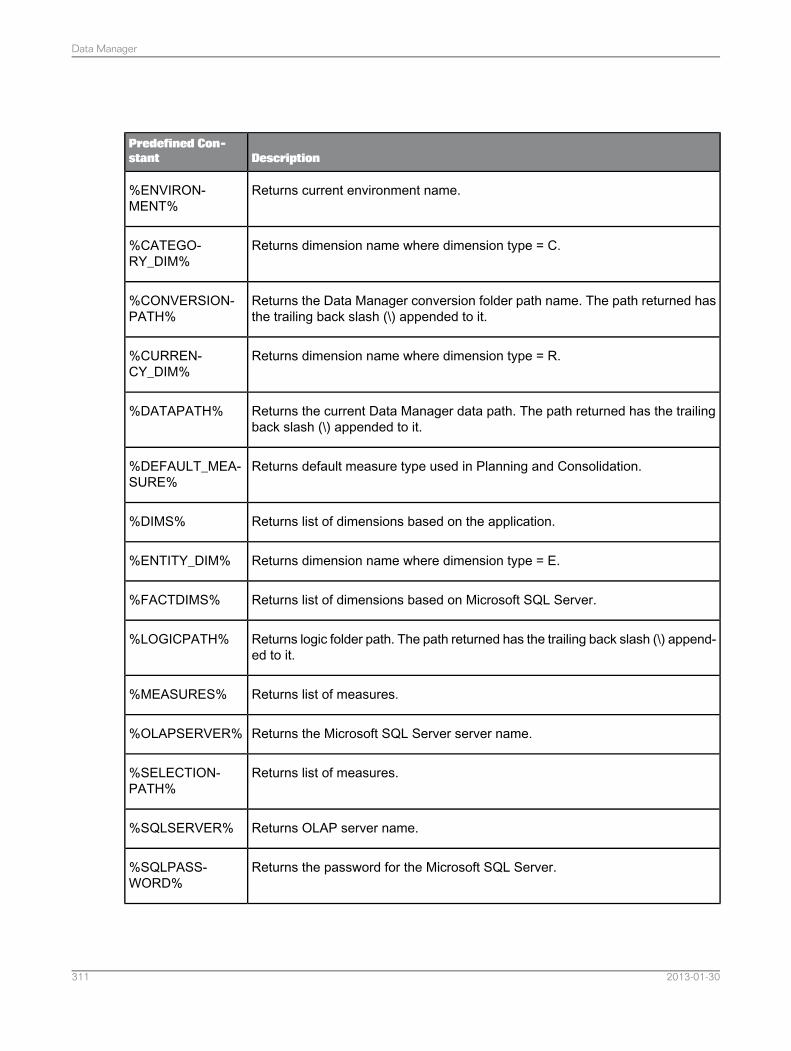
DescriptionPredefined Con-stant
Returns current environment name.%ENVIRON-MENT%
Returns dimension name where dimension type = C.%CATEGO-RY_DIM%
Returns the Data Manager conversion folder path name. The path returned hasthe trailing back slash (\) appended to it.
%CONVERSION-PATH%
Returns dimension name where dimension type = R.%CURREN-CY_DIM%
Returns the current Data Manager data path. The path returned has the trailingback slash (\) appended to it.
%DATAPATH%
Returns default measure type used in Planning and Consolidation.%DEFAULT_MEA-SURE%
Returns list of dimensions based on the application.%DIMS%
Returns dimension name where dimension type = E.%ENTITY_DIM%
Returns list of dimensions based on Microsoft SQL Server.%FACTDIMS%
Returns logic folder path. The path returned has the trailing back slash (\) append-ed to it.
%LOGICPATH%
Returns list of measures.%MEASURES%
Returns the Microsoft SQL Server server name.%OLAPSERVER%
Returns list of measures.%SELECTION-PATH%
Returns OLAP server name.%SQLSERVER%
Returns the password for the Microsoft SQL Server.%SQLPASS-WORD%
2013-01-30311
Data Manager
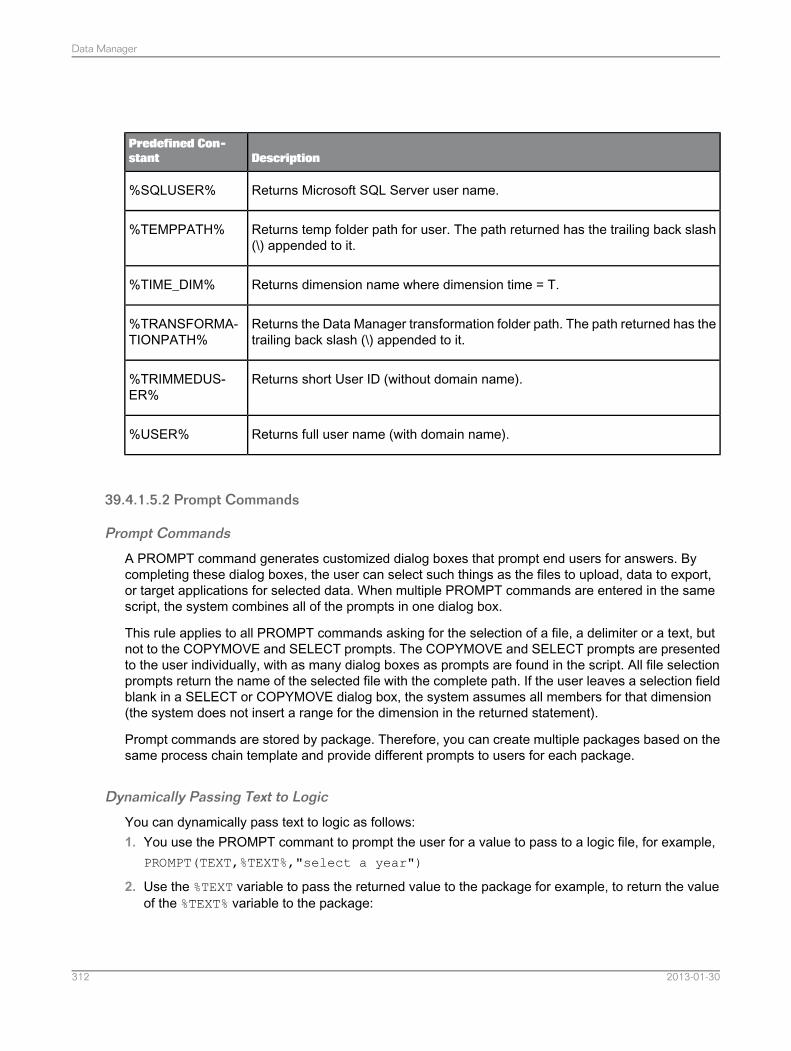
DescriptionPredefined Con-stant
Returns Microsoft SQL Server user name.%SQLUSER%
Returns temp folder path for user. The path returned has the trailing back slash(\) appended to it.
%TEMPPATH%
Returns dimension name where dimension time = T.%TIME_DIM%
Returns the Data Manager transformation folder path. The path returned has thetrailing back slash (\) appended to it.
%TRANSFORMA-TIONPATH%
Returns short User ID (without domain name).%TRIMMEDUS-ER%
Returns full user name (with domain name).%USER%
39.4.1.5.2 Prompt Commands
Prompt Commands
A PROMPT command generates customized dialog boxes that prompt end users for answers. Bycompleting these dialog boxes, the user can select such things as the files to upload, data to export,or target applications for selected data. When multiple PROMPT commands are entered in the samescript, the system combines all of the prompts in one dialog box.
This rule applies to all PROMPT commands asking for the selection of a file, a delimiter or a text, butnot to the COPYMOVE and SELECT prompts. The COPYMOVE and SELECT prompts are presentedto the user individually, with as many dialog boxes as prompts are found in the script. All file selectionprompts return the name of the selected file with the complete path. If the user leaves a selection fieldblank in a SELECT or COPYMOVE dialog box, the system assumes all members for that dimension(the system does not insert a range for the dimension in the returned statement).
Prompt commands are stored by package. Therefore, you can create multiple packages based on thesame process chain template and provide different prompts to users for each package.
Dynamically Passing Text to Logic
You can dynamically pass text to logic as follows:1. You use the PROMPT commant to prompt the user for a value to pass to a logic file, for example,
PROMPT(TEXT,%TEXT%,"select a year")
2. Use the %TEXT variable to pass the returned value to the package for example, to return the valueof the %TEXT% variable to the package:
2013-01-30312
Data Manager
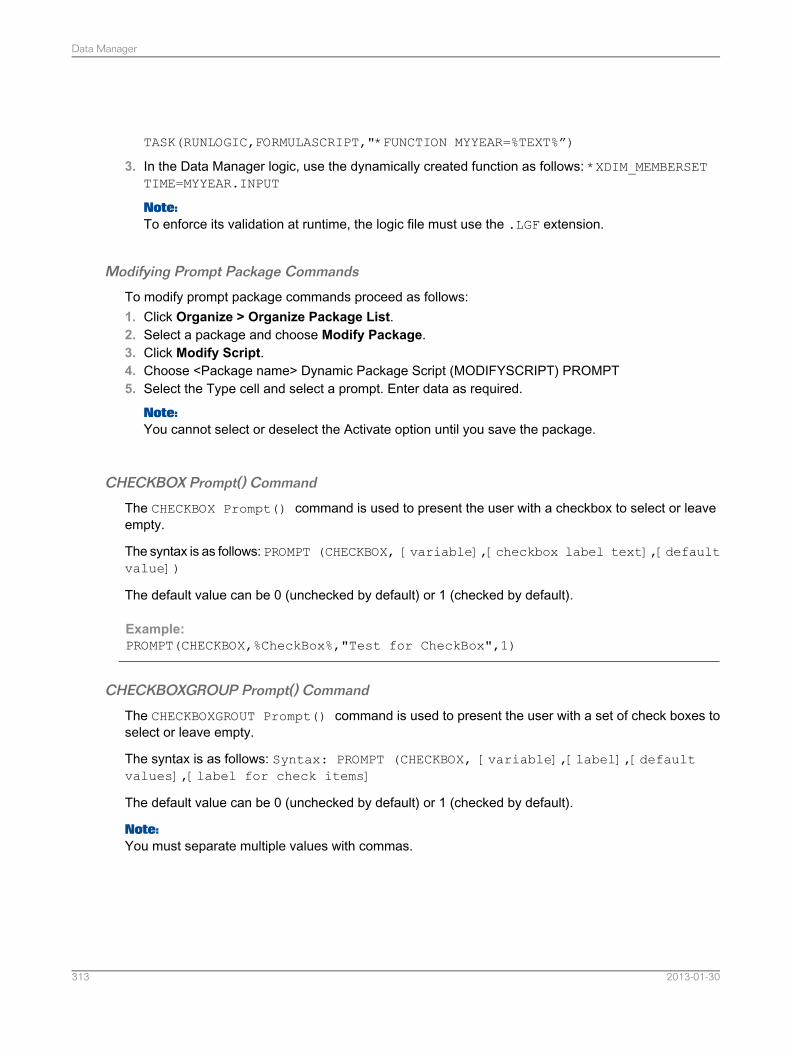
TASK(RUNLOGIC,FORMULASCRIPT,"*FUNCTION MYYEAR=%TEXT%”)
3. In the Data Manager logic, use the dynamically created function as follows: *XDIM_MEMBERSETTIME=MYYEAR.INPUT
Note:To enforce its validation at runtime, the logic file must use the .LGF extension.
Modifying Prompt Package Commands
To modify prompt package commands proceed as follows:1. Click Organize > Organize Package List.2. Select a package and choose Modify Package.3. Click Modify Script.4. Choose <Package name> Dynamic Package Script (MODIFYSCRIPT) PROMPT5. Select the Type cell and select a prompt. Enter data as required.
Note:You cannot select or deselect the Activate option until you save the package.
CHECKBOX Prompt() Command
The CHECKBOX Prompt() command is used to present the user with a checkbox to select or leaveempty.
The syntax is as follows: PROMPT (CHECKBOX, [variable],[checkbox label text],[defaultvalue])
The default value can be 0 (unchecked by default) or 1 (checked by default).
Example:PROMPT(CHECKBOX,%CheckBox%,"Test for CheckBox",1)
CHECKBOXGROUP Prompt() Command
The CHECKBOXGROUT Prompt() command is used to present the user with a set of check boxes toselect or leave empty.
The syntax is as follows: Syntax: PROMPT (CHECKBOX, [variable],[label],[defaultvalues],[label for check items]
The default value can be 0 (unchecked by default) or 1 (checked by default).
Note:You must separate multiple values with commas.
2013-01-30313
Data Manager
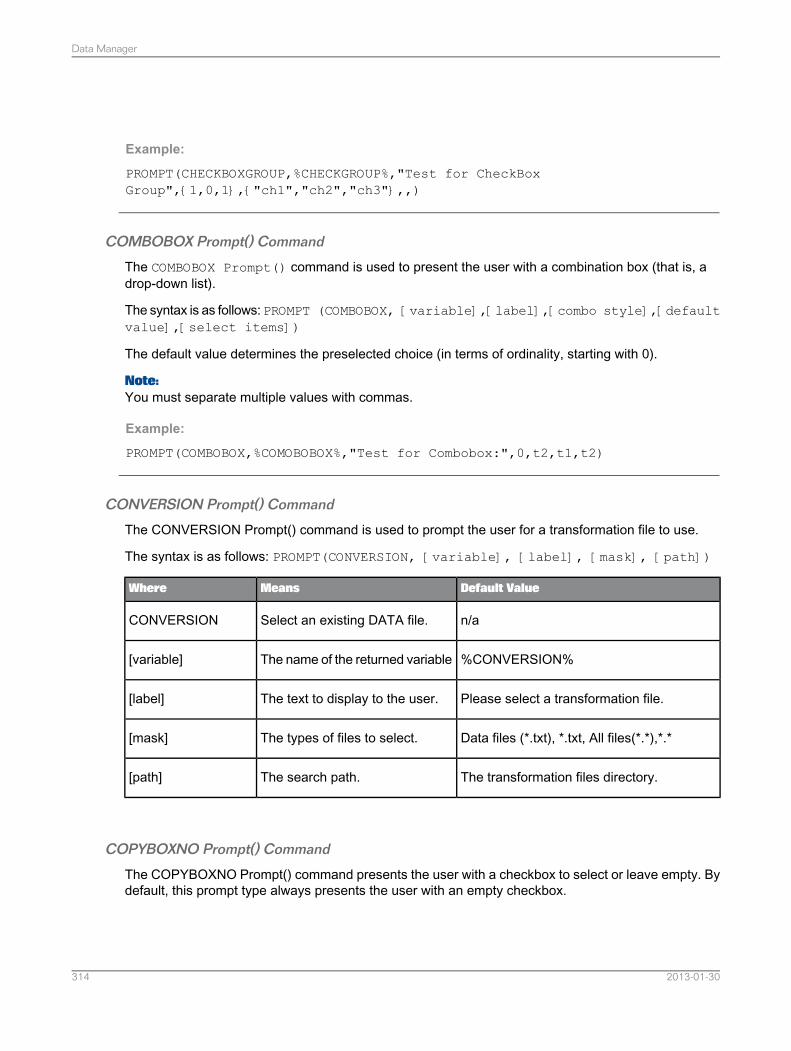
Example:
PROMPT(CHECKBOXGROUP,%CHECKGROUP%,"Test for CheckBoxGroup",{1,0,1},{"ch1","ch2","ch3"},,)
COMBOBOX Prompt() Command
The COMBOBOX Prompt() command is used to present the user with a combination box (that is, adrop-down list).
The syntax is as follows: PROMPT (COMBOBOX, [variable],[label],[combo style],[defaultvalue],[select items])
The default value determines the preselected choice (in terms of ordinality, starting with 0).
Note:You must separate multiple values with commas.
Example:
PROMPT(COMBOBOX,%COMOBOBOX%,"Test for Combobox:",0,t2,t1,t2)
CONVERSION Prompt() Command
The CONVERSION Prompt() command is used to prompt the user for a transformation file to use.
The syntax is as follows: PROMPT(CONVERSION, [variable], [label], [mask], [path])
Default ValueMeansWhere
n/aSelect an existing DATA file.CONVERSION
%CONVERSION%The name of the returned variable[variable]
Please select a transformation file.The text to display to the user.[label]
Data files (*.txt), *.txt, All files(*.*),*.*The types of files to select.[mask]
The transformation files directory.The search path.[path]
COPYBOXNO Prompt() Command
The COPYBOXNO Prompt() command presents the user with a checkbox to select or leave empty. Bydefault, this prompt type always presents the user with an empty checkbox.
2013-01-30314
Data Manager
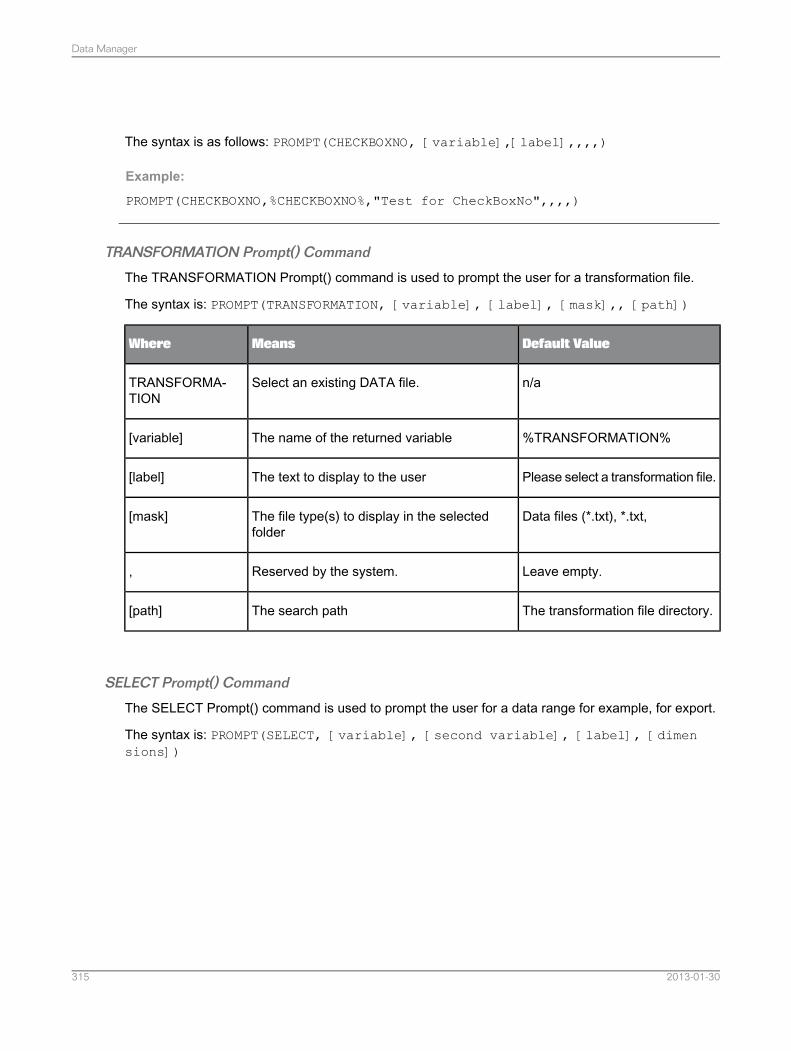
The syntax is as follows: PROMPT(CHECKBOXNO, [variable],[label],,,,)
Example:
PROMPT(CHECKBOXNO,%CHECKBOXNO%,"Test for CheckBoxNo",,,,)
TRANSFORMATION Prompt() Command
The TRANSFORMATION Prompt() command is used to prompt the user for a transformation file.
The syntax is: PROMPT(TRANSFORMATION, [variable], [label], [mask],, [path])
Default ValueMeansWhere
n/aSelect an existing DATA file.TRANSFORMA-TION
%TRANSFORMATION%The name of the returned variable[variable]
Please select a transformation file.The text to display to the user[label]
Data files (*.txt), *.txt,The file type(s) to display in the selectedfolder
[mask]
Leave empty.Reserved by the system.,
The transformation file directory.The search path[path]
SELECT Prompt() Command
The SELECT Prompt() command is used to prompt the user for a data range for example, for export.
The syntax is: PROMPT(SELECT, [variable], [second variable], [label], [dimensions])
2013-01-30315
Data Manager
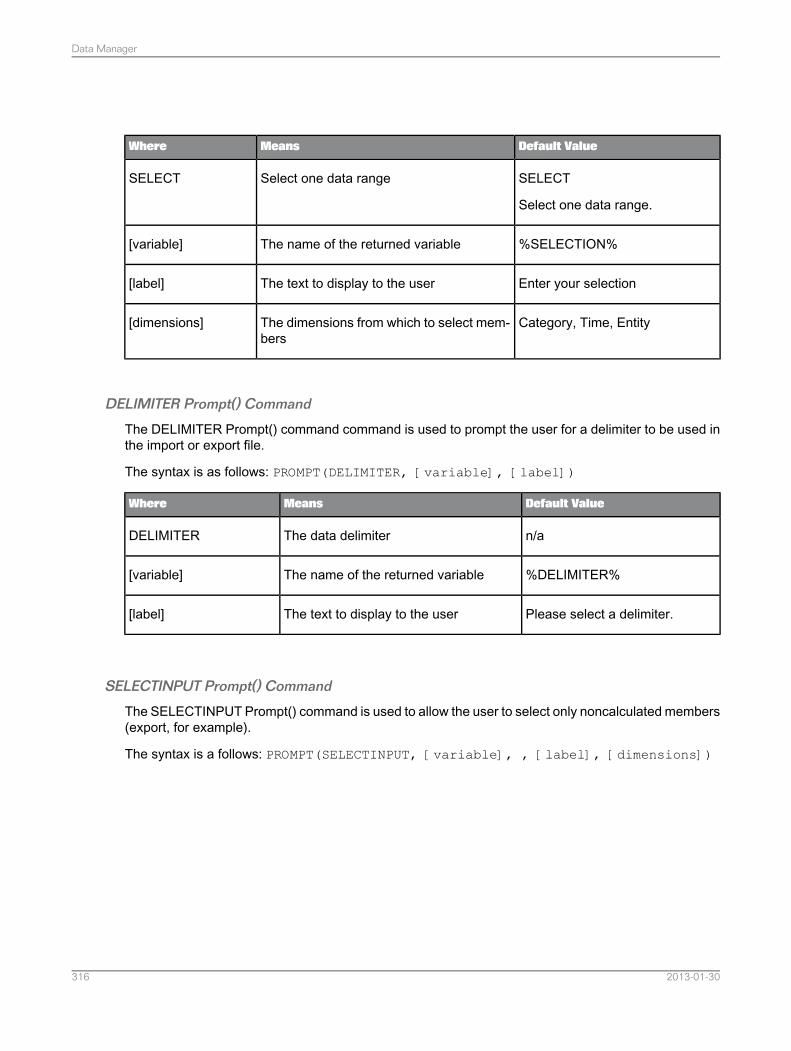
Default ValueMeansWhere
SELECT
Select one data range.
Select one data rangeSELECT
%SELECTION%The name of the returned variable[variable]
Enter your selectionThe text to display to the user[label]
Category, Time, EntityThe dimensions from which to select mem-bers
[dimensions]
DELIMITER Prompt() Command
The DELIMITER Prompt() command command is used to prompt the user for a delimiter to be used inthe import or export file.
The syntax is as follows: PROMPT(DELIMITER, [variable], [label])
Default ValueMeansWhere
n/aThe data delimiterDELIMITER
%DELIMITER%The name of the returned variable[variable]
Please select a delimiter.The text to display to the user[label]
SELECTINPUT Prompt() Command
The SELECTINPUT Prompt() command is used to allow the user to select only noncalculated members(export, for example).
The syntax is a follows: PROMPT(SELECTINPUT, [variable], , [label], [dimensions])
2013-01-30316
Data Manager
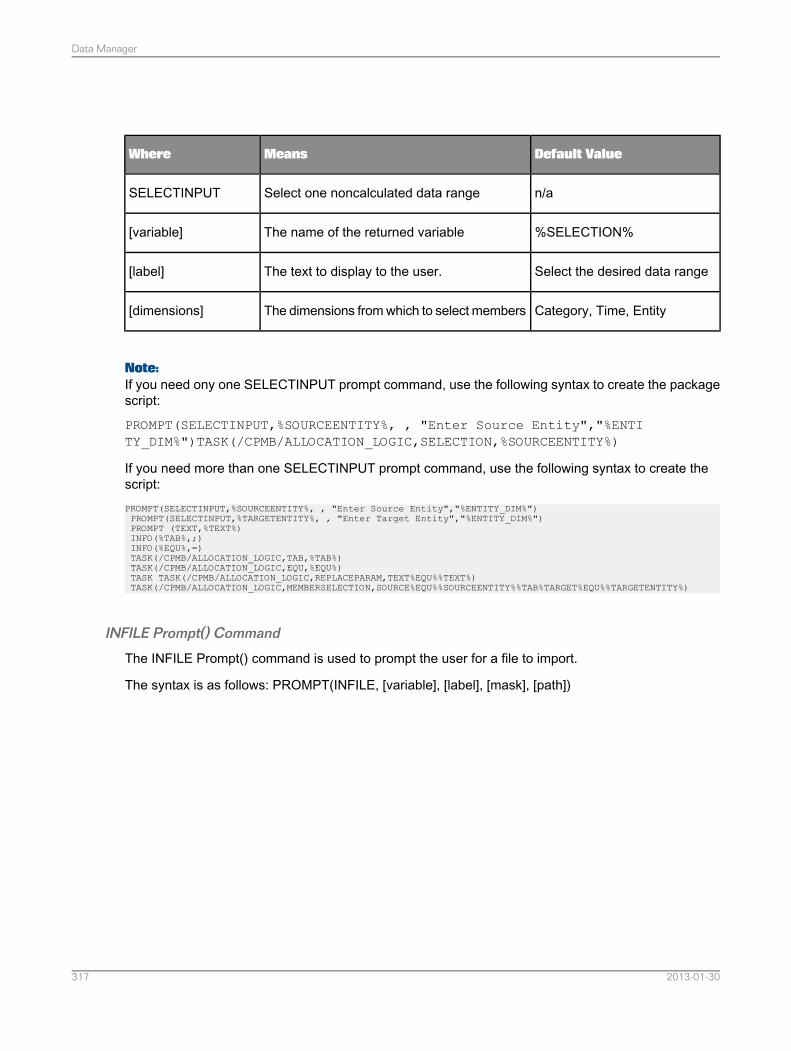
Default ValueMeansWhere
n/aSelect one noncalculated data rangeSELECTINPUT
%SELECTION%The name of the returned variable[variable]
Select the desired data rangeThe text to display to the user.[label]
Category, Time, EntityThe dimensions from which to select members[dimensions]
Note:If you need ony one SELECTINPUT prompt command, use the following syntax to create the packagescript:
PROMPT(SELECTINPUT,%SOURCEENTITY%, , "Enter Source Entity","%ENTITY_DIM%")TASK(/CPMB/ALLOCATION_LOGIC,SELECTION,%SOURCEENTITY%)
If you need more than one SELECTINPUT prompt command, use the following syntax to create thescript:PROMPT(SELECTINPUT,%SOURCEENTITY%, , "Enter Source Entity","%ENTITY_DIM%")PROMPT(SELECTINPUT,%TARGETENTITY%, , "Enter Target Entity","%ENTITY_DIM%")PROMPT (TEXT,%TEXT%)INFO(%TAB%,;)INFO(%EQU%,=)TASK(/CPMB/ALLOCATION_LOGIC,TAB,%TAB%)TASK(/CPMB/ALLOCATION_LOGIC,EQU,%EQU%)TASK TASK(/CPMB/ALLOCATION_LOGIC,REPLACEPARAM,TEXT%EQU%%TEXT%)TASK(/CPMB/ALLOCATION_LOGIC,MEMBERSELECTION,SOURCE%EQU%%SOURCEENTITY%%TAB%TARGET%EQU%%TARGETENTITY%)
INFILE Prompt() Command
The INFILE Prompt() command is used to prompt the user for a file to import.
The syntax is as follows: PROMPT(INFILE, [variable], [label], [mask], [path])
2013-01-30317
Data Manager
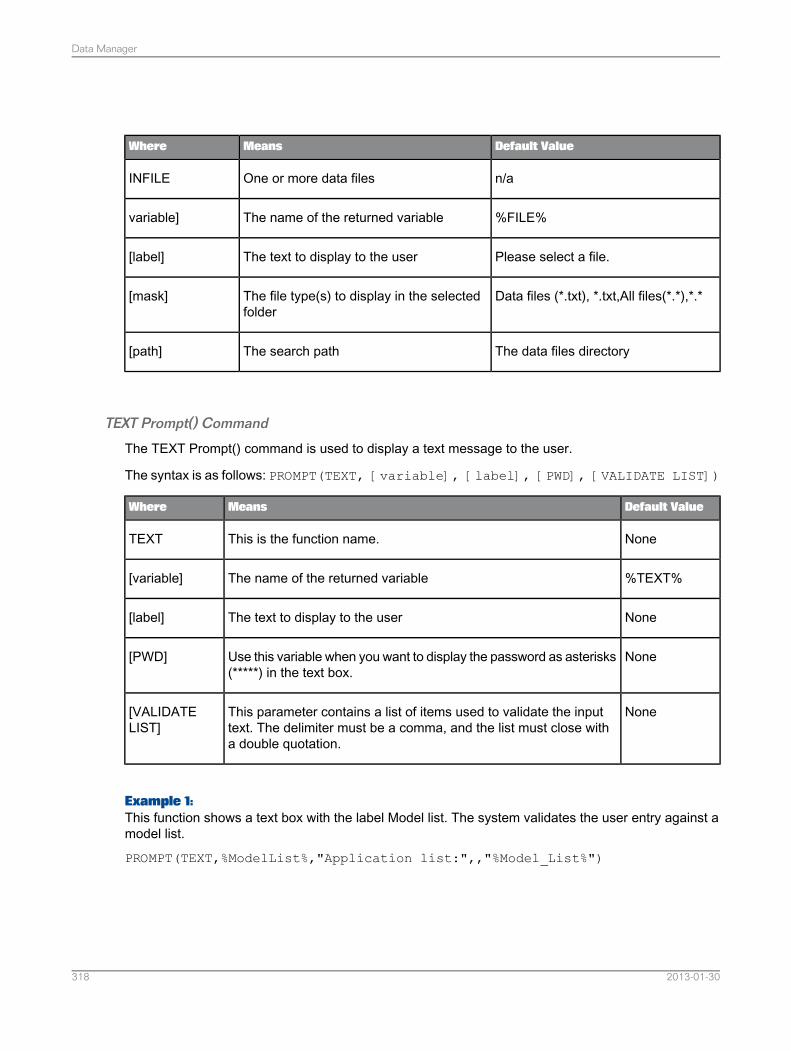
Default ValueMeansWhere
n/aOne or more data filesINFILE
%FILE%The name of the returned variablevariable]
Please select a file.The text to display to the user[label]
Data files (*.txt), *.txt,All files(*.*),*.*The file type(s) to display in the selectedfolder
[mask]
The data files directoryThe search path[path]
TEXT Prompt() Command
The TEXT Prompt() command is used to display a text message to the user.
The syntax is as follows: PROMPT(TEXT, [variable], [label], [PWD], [VALIDATE LIST])
Default ValueMeansWhere
NoneThis is the function name.TEXT
%TEXT%The name of the returned variable[variable]
NoneThe text to display to the user[label]
NoneUse this variable when you want to display the password as asterisks(*****) in the text box.
[PWD]
NoneThis parameter contains a list of items used to validate the inputtext. The delimiter must be a comma, and the list must close witha double quotation.
[VALIDATELIST]
Example 1:This function shows a text box with the label Model list. The system validates the user entry against amodel list.
PROMPT(TEXT,%ModelList%,"Application list:",,"%Model_List%")
2013-01-30318
Data Manager
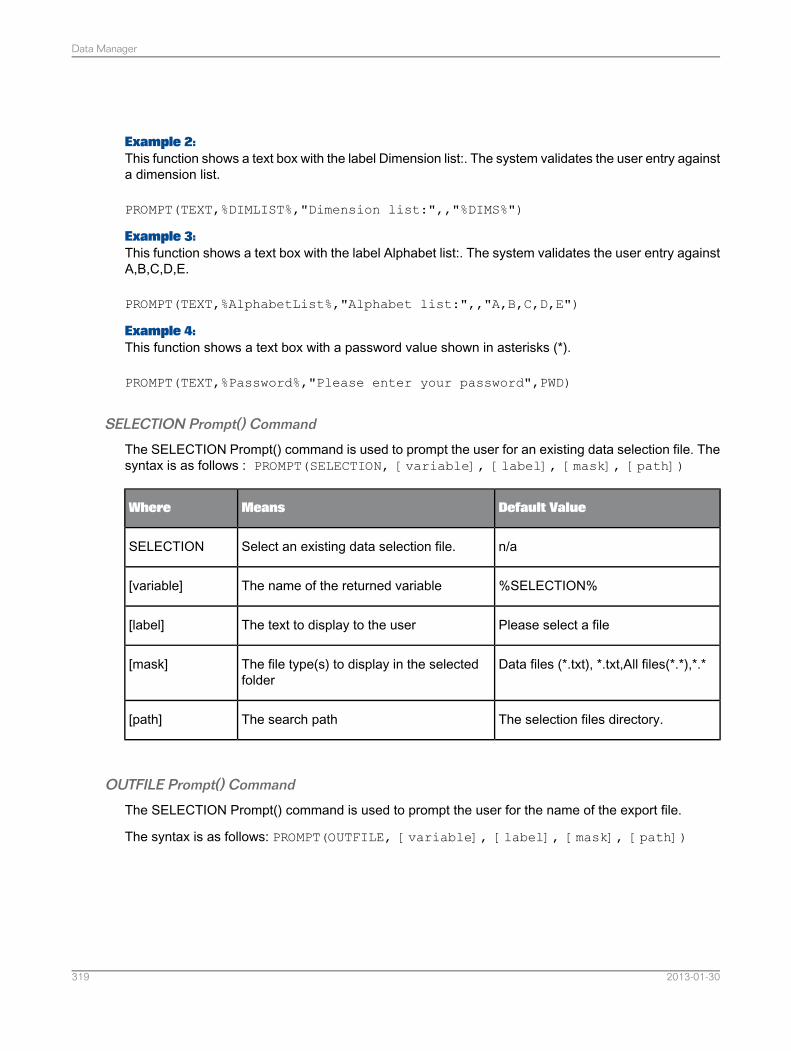
Example 2:This function shows a text box with the label Dimension list:. The system validates the user entry againsta dimension list.
PROMPT(TEXT,%DIMLIST%,"Dimension list:",,"%DIMS%")
Example 3:This function shows a text box with the label Alphabet list:. The system validates the user entry againstA,B,C,D,E.
PROMPT(TEXT,%AlphabetList%,"Alphabet list:",,"A,B,C,D,E")
Example 4:This function shows a text box with a password value shown in asterisks (*).
PROMPT(TEXT,%Password%,"Please enter your password",PWD)
SELECTION Prompt() Command
The SELECTION Prompt() command is used to prompt the user for an existing data selection file. Thesyntax is as follows : PROMPT(SELECTION, [variable], [label], [mask], [path])
Default ValueMeansWhere
n/aSelect an existing data selection file.SELECTION
%SELECTION%The name of the returned variable[variable]
Please select a fileThe text to display to the user[label]
Data files (*.txt), *.txt,All files(*.*),*.*The file type(s) to display in the selectedfolder
[mask]
The selection files directory.The search path[path]
OUTFILE Prompt() Command
The SELECTION Prompt() command is used to prompt the user for the name of the export file.
The syntax is as follows: PROMPT(OUTFILE, [variable], [label], [mask], [path])
2013-01-30319
Data Manager
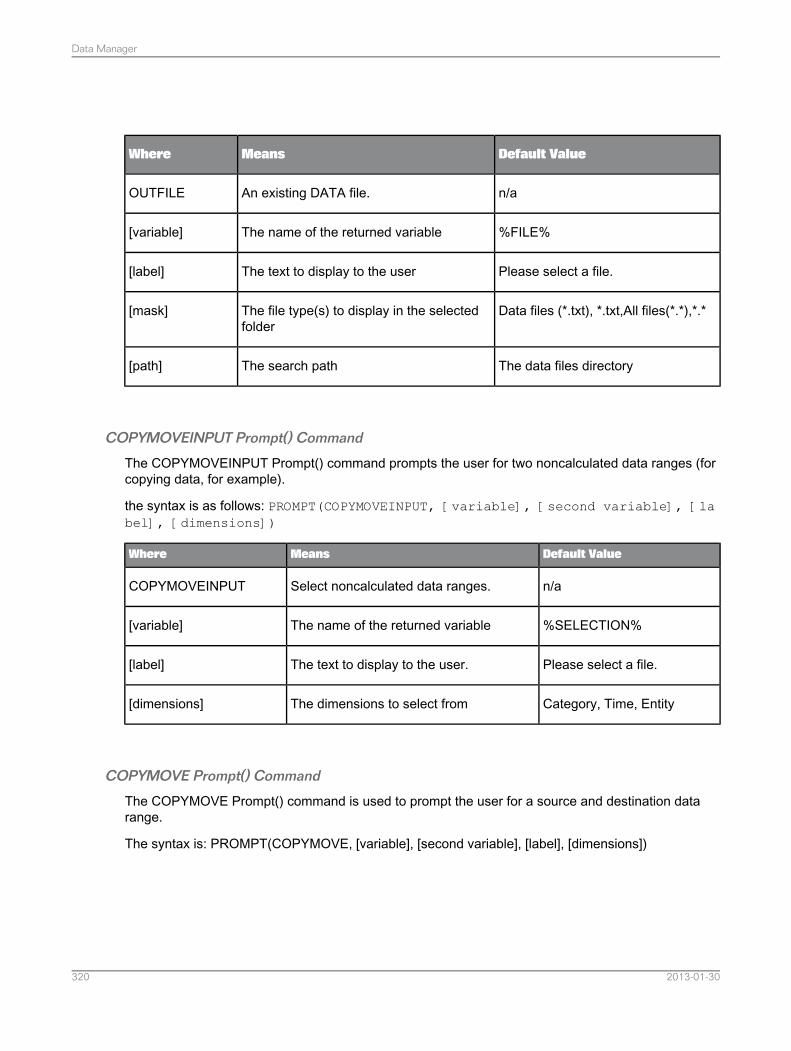
Default ValueMeansWhere
n/aAn existing DATA file.OUTFILE
%FILE%The name of the returned variable[variable]
Please select a file.The text to display to the user[label]
Data files (*.txt), *.txt,All files(*.*),*.*The file type(s) to display in the selectedfolder
[mask]
The data files directoryThe search path[path]
COPYMOVEINPUT Prompt() Command
The COPYMOVEINPUT Prompt() command prompts the user for two noncalculated data ranges (forcopying data, for example).
the syntax is as follows: PROMPT(COPYMOVEINPUT, [variable], [second variable], [label], [dimensions])
Default ValueMeansWhere
n/aSelect noncalculated data ranges.COPYMOVEINPUT
%SELECTION%The name of the returned variable[variable]
Please select a file.The text to display to the user.[label]
Category, Time, EntityThe dimensions to select from[dimensions]
COPYMOVE Prompt() Command
The COPYMOVE Prompt() command is used to prompt the user for a source and destination datarange.
The syntax is: PROMPT(COPYMOVE, [variable], [second variable], [label], [dimensions])
2013-01-30320
Data Manager
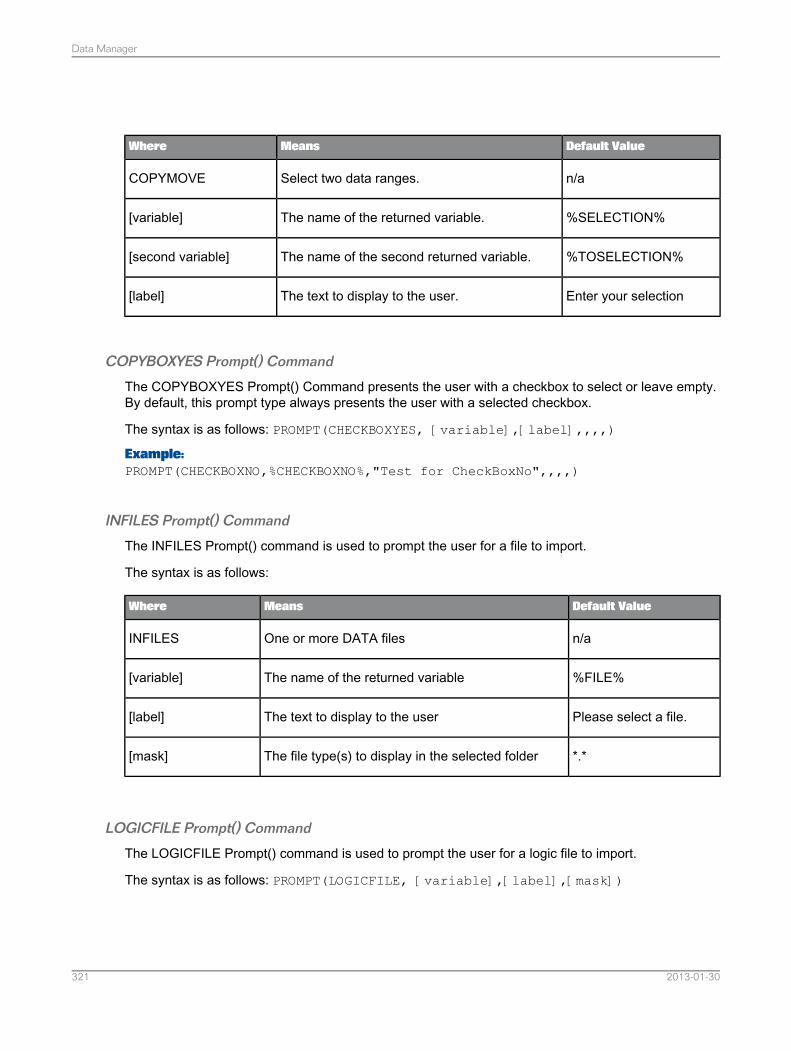
Default ValueMeansWhere
n/aSelect two data ranges.COPYMOVE
%SELECTION%The name of the returned variable.[variable]
%TOSELECTION%The name of the second returned variable.[second variable]
Enter your selectionThe text to display to the user.[label]
COPYBOXYES Prompt() Command
The COPYBOXYES Prompt() Command presents the user with a checkbox to select or leave empty.By default, this prompt type always presents the user with a selected checkbox.
The syntax is as follows: PROMPT(CHECKBOXYES, [variable],[label],,,,)
Example:PROMPT(CHECKBOXNO,%CHECKBOXNO%,"Test for CheckBoxNo",,,,)
INFILES Prompt() Command
The INFILES Prompt() command is used to prompt the user for a file to import.
The syntax is as follows:
Default ValueMeansWhere
n/aOne or more DATA filesINFILES
%FILE%The name of the returned variable[variable]
Please select a file.The text to display to the user[label]
*.*The file type(s) to display in the selected folder[mask]
LOGICFILE Prompt() Command
The LOGICFILE Prompt() command is used to prompt the user for a logic file to import.
The syntax is as follows: PROMPT(LOGICFILE, [variable],[label],[mask])
2013-01-30321
Data Manager
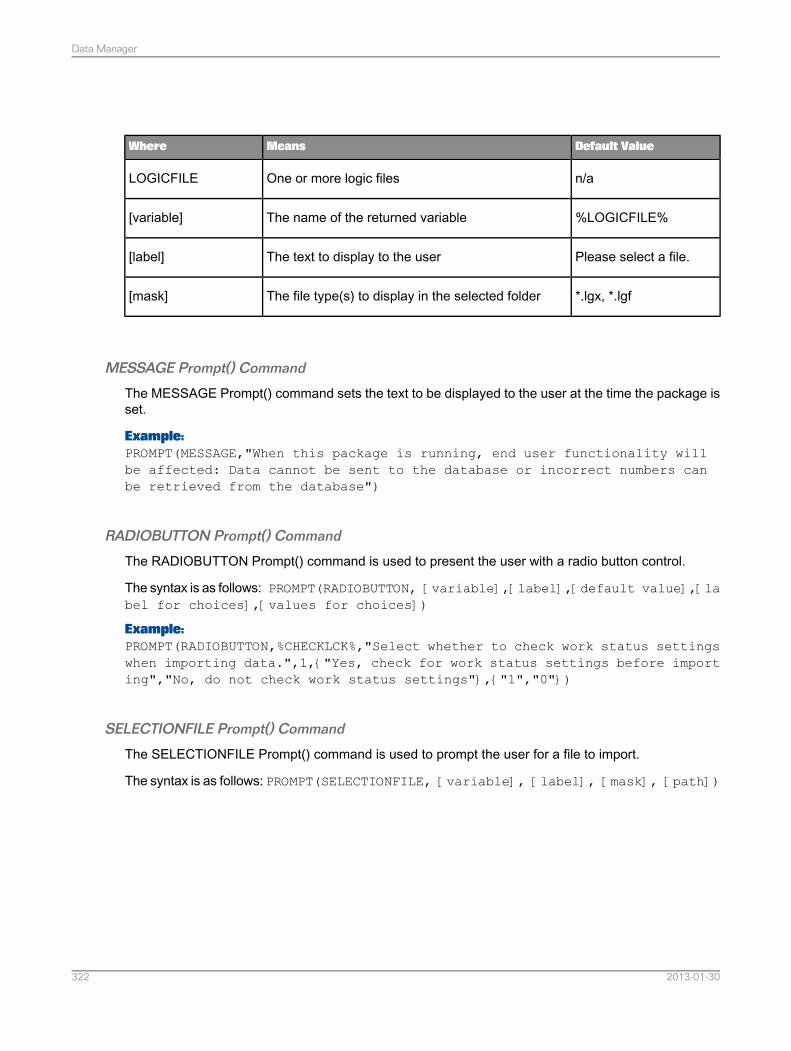
Default ValueMeansWhere
n/aOne or more logic filesLOGICFILE
%LOGICFILE%The name of the returned variable[variable]
Please select a file.The text to display to the user[label]
*.lgx, *.lgfThe file type(s) to display in the selected folder[mask]
MESSAGE Prompt() Command
The MESSAGE Prompt() command sets the text to be displayed to the user at the time the package isset.
Example:PROMPT(MESSAGE,"When this package is running, end user functionality willbe affected: Data cannot be sent to the database or incorrect numbers canbe retrieved from the database")
RADIOBUTTON Prompt() Command
The RADIOBUTTON Prompt() command is used to present the user with a radio button control.
The syntax is as follows: PROMPT(RADIOBUTTON, [variable],[label],[default value],[label for choices],[values for choices])
Example:PROMPT(RADIOBUTTON,%CHECKLCK%,"Select whether to check work status settingswhen importing data.",1,{"Yes, check for work status settings before importing","No, do not check work status settings"},{"1","0"})
SELECTIONFILE Prompt() Command
The SELECTIONFILE Prompt() command is used to prompt the user for a file to import.
The syntax is as follows: PROMPT(SELECTIONFILE, [variable], [label], [mask], [path])
2013-01-30322
Data Manager
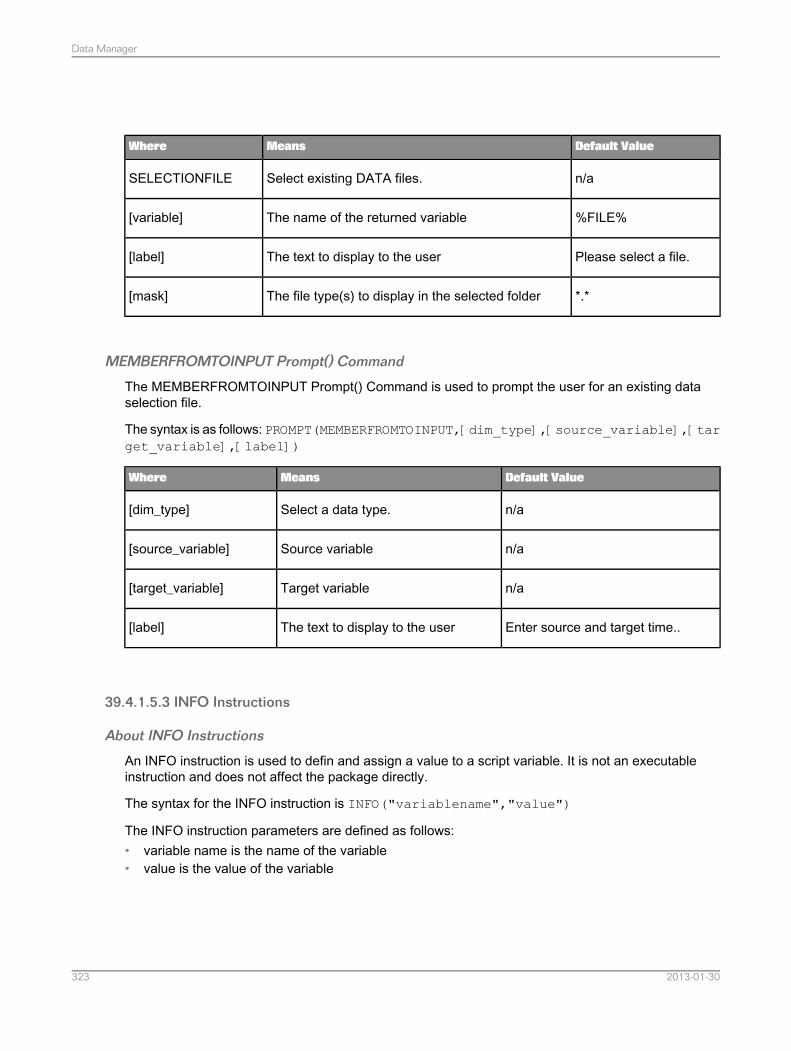
Default ValueMeansWhere
n/aSelect existing DATA files.SELECTIONFILE
%FILE%The name of the returned variable[variable]
Please select a file.The text to display to the user[label]
*.*The file type(s) to display in the selected folder[mask]
MEMBERFROMTOINPUT Prompt() Command
The MEMBERFROMTOINPUT Prompt() Command is used to prompt the user for an existing dataselection file.
The syntax is as follows: PROMPT(MEMBERFROMTOINPUT,[dim_type],[source_variable],[target_variable],[label])
Default ValueMeansWhere
n/aSelect a data type.[dim_type]
n/aSource variable[source_variable]
n/aTarget variable[target_variable]
Enter source and target time..The text to display to the user[label]
39.4.1.5.3 INFO Instructions
About INFO Instructions
An INFO instruction is used to defin and assign a value to a script variable. It is not an executableinstruction and does not affect the package directly.
The syntax for the INFO instruction is INFO("variablename","value")
The INFO instruction parameters are defined as follows:• variable name is the name of the variable• value is the value of the variable
2013-01-30323
Data Manager
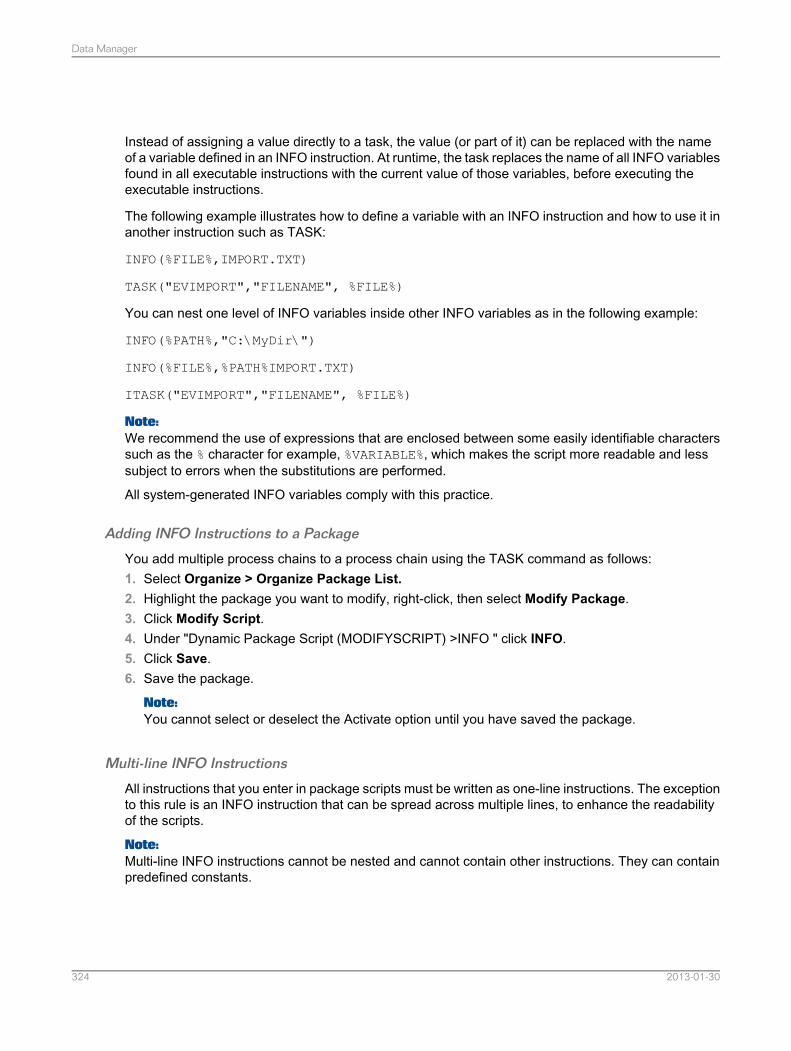
Instead of assigning a value directly to a task, the value (or part of it) can be replaced with the nameof a variable defined in an INFO instruction. At runtime, the task replaces the name of all INFO variablesfound in all executable instructions with the current value of those variables, before executing theexecutable instructions.
The following example illustrates how to define a variable with an INFO instruction and how to use it inanother instruction such as TASK:
INFO(%FILE%,IMPORT.TXT)
TASK("EVIMPORT","FILENAME", %FILE%)
You can nest one level of INFO variables inside other INFO variables as in the following example:
INFO(%PATH%,"C:\MyDir\")
INFO(%FILE%,%PATH%IMPORT.TXT)
ITASK("EVIMPORT","FILENAME", %FILE%)
Note:We recommend the use of expressions that are enclosed between some easily identifiable characterssuch as the % character for example, %VARIABLE%, which makes the script more readable and lesssubject to errors when the substitutions are performed.
All system-generated INFO variables comply with this practice.
Adding INFO Instructions to a Package
You add multiple process chains to a process chain using the TASK command as follows:1. Select Organize > Organize Package List.2. Highlight the package you want to modify, right-click, then select Modify Package.3. Click Modify Script.4. Under "Dynamic Package Script (MODIFYSCRIPT) >INFO " click INFO.5. Click Save.6. Save the package.
Note:You cannot select or deselect the Activate option until you have saved the package.
Multi-line INFO Instructions
All instructions that you enter in package scripts must be written as one-line instructions. The exceptionto this rule is an INFO instruction that can be spread across multiple lines, to enhance the readabilityof the scripts.
Note:Multi-line INFO instructions cannot be nested and cannot contain other instructions. They can containpredefined constants.
2013-01-30324
Data Manager
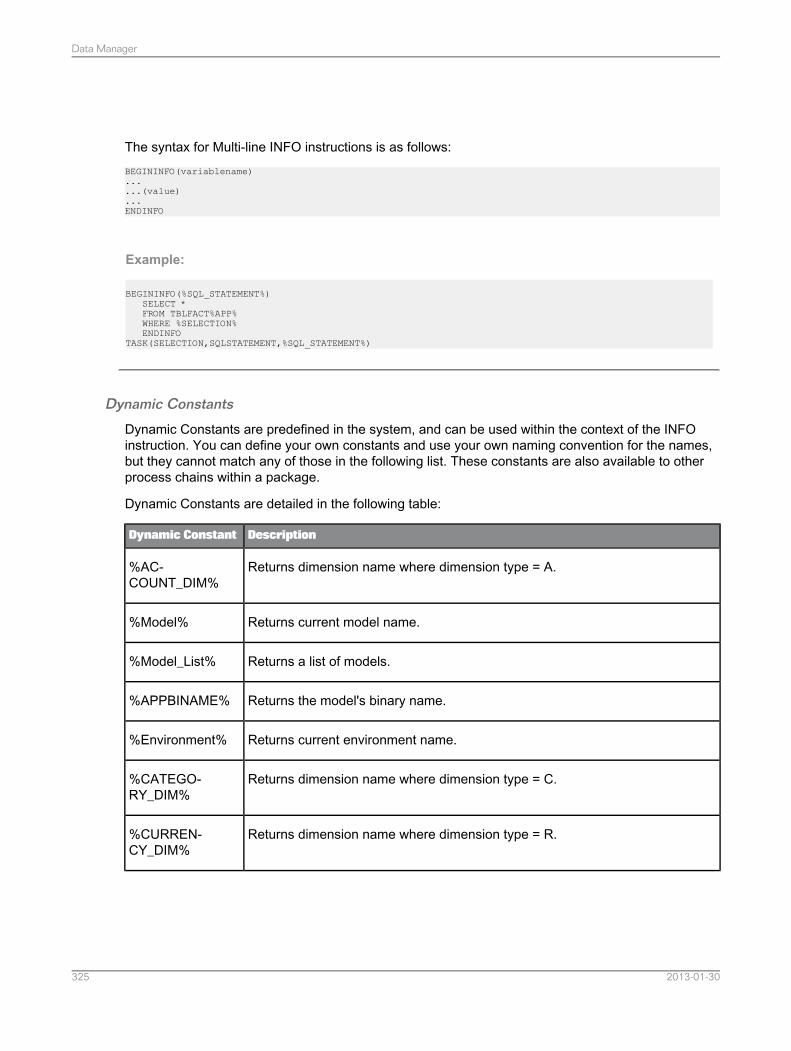
The syntax for Multi-line INFO instructions is as follows:BEGININFO(variablename)......(value)...ENDINFO
Example:
BEGININFO(%SQL_STATEMENT%)SELECT *FROM TBLFACT%APP%WHERE %SELECTION%ENDINFO
TASK(SELECTION,SQLSTATEMENT,%SQL_STATEMENT%)
Dynamic Constants
Dynamic Constants are predefined in the system, and can be used within the context of the INFOinstruction. You can define your own constants and use your own naming convention for the names,but they cannot match any of those in the following list. These constants are also available to otherprocess chains within a package.
Dynamic Constants are detailed in the following table:
DescriptionDynamic Constant
Returns dimension name where dimension type = A.%AC-COUNT_DIM%
Returns current model name.%Model%
Returns a list of models.%Model_List%
Returns the model's binary name.%APPBINAME%
Returns current environment name.%Environment%
Returns dimension name where dimension type = C.%CATEGO-RY_DIM%
Returns dimension name where dimension type = R.%CURREN-CY_DIM%
2013-01-30325
Data Manager
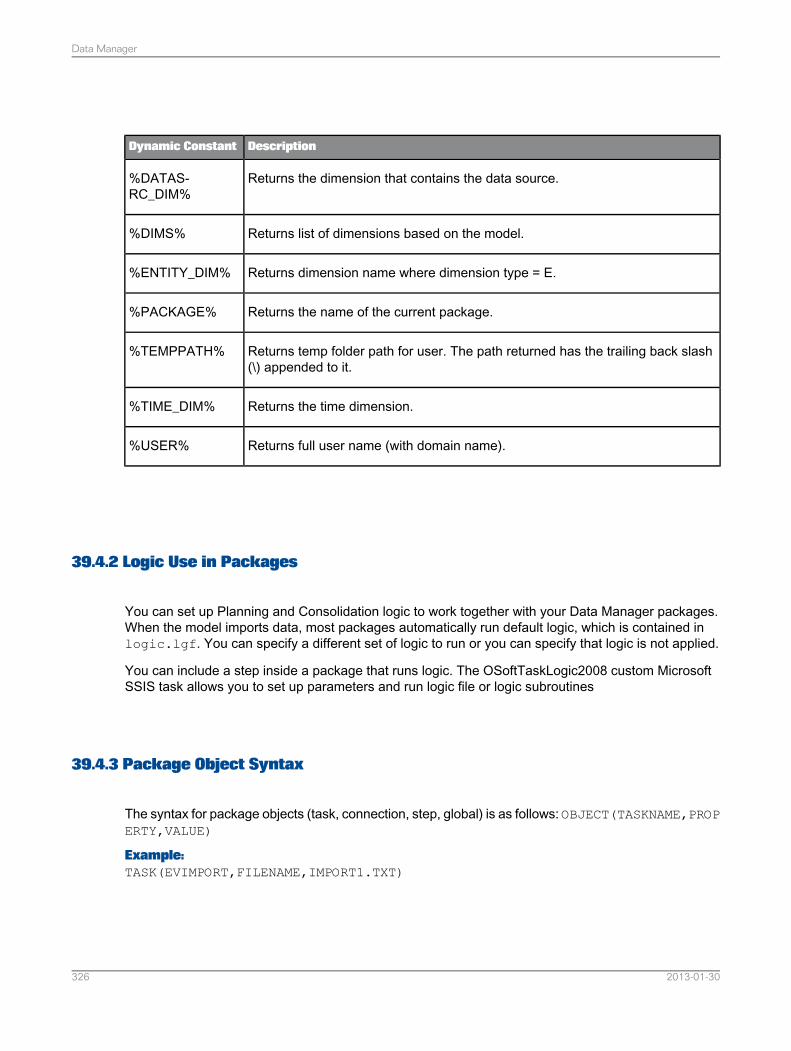
DescriptionDynamic Constant
Returns the dimension that contains the data source.%DATAS-RC_DIM%
Returns list of dimensions based on the model.%DIMS%
Returns dimension name where dimension type = E.%ENTITY_DIM%
Returns the name of the current package.%PACKAGE%
Returns temp folder path for user. The path returned has the trailing back slash(\) appended to it.
%TEMPPATH%
Returns the time dimension.%TIME_DIM%
Returns full user name (with domain name).%USER%
39.4.2 Logic Use in Packages
You can set up Planning and Consolidation logic to work together with your Data Manager packages.When the model imports data, most packages automatically run default logic, which is contained inlogic.lgf. You can specify a different set of logic to run or you can specify that logic is not applied.
You can include a step inside a package that runs logic. The OSoftTaskLogic2008 custom MicrosoftSSIS task allows you to set up parameters and run logic file or logic subroutines
39.4.3 Package Object Syntax
The syntax for package objects (task, connection, step, global) is as follows: OBJECT(TASKNAME,PROPERTY,VALUE)
Example:TASK(EVIMPORT,FILENAME,IMPORT1.TXT)
2013-01-30326
Data Manager
39.5 Data Manager Tasks
39.5.1 Data Manager Tasks
You can run a package in the Data Manager or set the schedule on which it runs. Access to packagesin the Data Manager is controlled by task security set by an administrator.
You can perform the following tasks with packages:• Run or schedule packages• Organize your favorite packages into a selected packages list• View package status• View schedule status
Note:Schedule status and package status are not identical. They can be defined as follows:• Package status displays the result of a package that has already executed.• Schedule status displays the schedule on which various packages are set up to run.
39.5.2 Removing a Package from the List
To remove a package from the list, proceed as follows:1. Click Organize > Organize Package List.2. Highlight the package you want to remove and right-click.3. Select Remove Package.4. Click Yes at the prompt.
39.5.3 Running Packages
To run a package proceed as follows:1. Click Run Package.2. In the "Run Package" dialog box select the package you want to run.
2013-01-30327
Data Manager
3. Click Run.Depending on the type of package you are running, the Data Manager displays prompt values.
4. Type or select the prompt values in the various dialog boxes.5. At one point you are prompted to select when you want to run the package. The choices are as
follows:• Run• Schedule• Run and Schedule
6. If you want to run the package immediately, select Run, then click Finish.
Note:When a package is run the data access rights of the user are applied.
Related Topics• Scheduling Packages
39.5.3.1 Scheduling Packages
You schedule packages to be run in the "Run Package" dialog box.1. Click Finish.2. Under General, enter a "Name" and a "Description".3. Under Schedule Properties select the frequency and time of day you want to run the schedule.
You can enter additional properties by clicking Advanced.4. When you have finished entering the scheduling information, select Enable Schedule, then click
Finish.
39.5.3.2 Running a Copy Package
A copy package copies data within an application. You are prompted for source and destination dataselections for all dimensions in the application.1. Click Run Package.2. In the Run Package dialog box, select the Copy package, then click Run.3. In the "Copy" screen select one of the following:
• Merge data values, if you want to copy all specified records, leaving all remaining records in thedestination intact (does not add to existing data)
• Replace & clear data values if you want to clear data in the destination area using the selecteddimension list, then copy the data from the source to the destination.
2013-01-30328
Data Manager
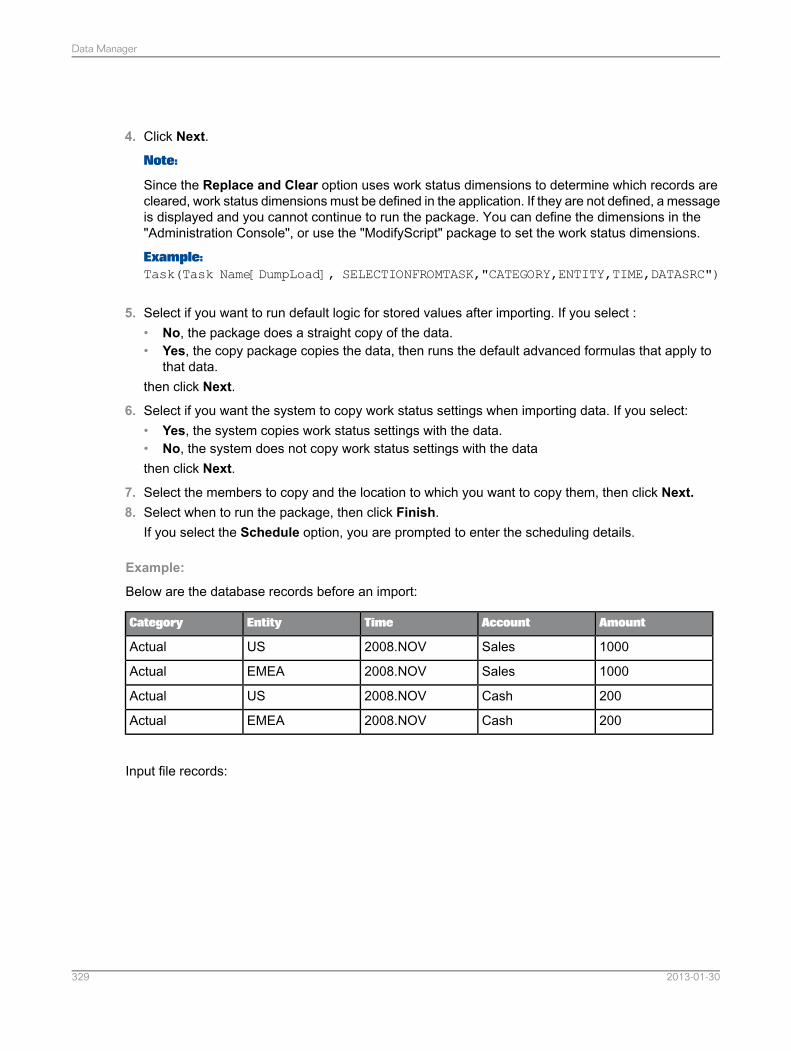
4. Click Next.
Note:
Since the Replace and Clear option uses work status dimensions to determine which records arecleared, work status dimensions must be defined in the application. If they are not defined, a messageis displayed and you cannot continue to run the package. You can define the dimensions in the"Administration Console", or use the "ModifyScript" package to set the work status dimensions.
Example:Task(Task Name[DumpLoad], SELECTIONFROMTASK,"CATEGORY,ENTITY,TIME,DATASRC")
5. Select if you want to run default logic for stored values after importing. If you select :• No, the package does a straight copy of the data.• Yes, the copy package copies the data, then runs the default advanced formulas that apply to
that data.then click Next.
6. Select if you want the system to copy work status settings when importing data. If you select:• Yes, the system copies work status settings with the data.• No, the system does not copy work status settings with the datathen click Next.
7. Select the members to copy and the location to which you want to copy them, then click Next.8. Select when to run the package, then click Finish.
If you select the Schedule option, you are prompted to enter the scheduling details.
Example:
Below are the database records before an import:
AmountAccountTimeEntityCategory
1000Sales2008.NOVUSActual
1000Sales2008.NOVEMEAActual
200Cash2008.NOVUSActual
200Cash2008.NOVEMEAActual
Input file records:
2013-01-30329
Data Manager
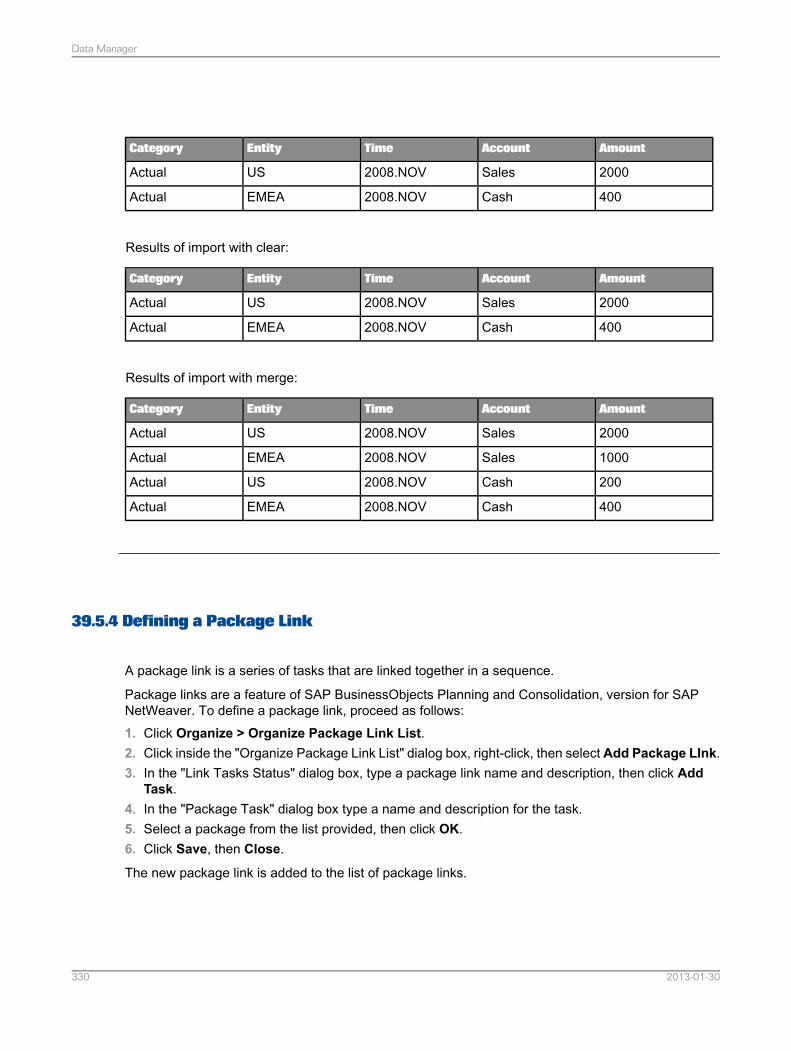
AmountAccountTimeEntityCategory
2000Sales2008.NOVUSActual
400Cash2008.NOVEMEAActual
Results of import with clear:
AmountAccountTimeEntityCategory
2000Sales2008.NOVUSActual
400Cash2008.NOVEMEAActual
Results of import with merge:
AmountAccountTimeEntityCategory
2000Sales2008.NOVUSActual
1000Sales2008.NOVEMEAActual
200Cash2008.NOVUSActual
400Cash2008.NOVEMEAActual
39.5.4 Defining a Package Link
A package link is a series of tasks that are linked together in a sequence.
Package links are a feature of SAP BusinessObjects Planning and Consolidation, version for SAPNetWeaver. To define a package link, proceed as follows:1. Click Organize > Organize Package Link List.2. Click inside the "Organize Package Link List" dialog box, right-click, then select Add Package LInk.3. In the "Link Tasks Status" dialog box, type a package link name and description, then click Add
Task.4. In the "Package Task" dialog box type a name and description for the task.5. Select a package from the list provided, then click OK.6. Click Save, then Close.
The new package link is added to the list of package links.
2013-01-30330
Data Manager
39.5.4.1 Running a Package Link
To run a package link proceed as follows:1. Click Run Package > Run Package Link.2. In the "Run Package Link" dialog box, select the package link that you want to run, then click Run.3. In the next set of screens you choose to:
• Run the package link• Set prompts to select the following:
• an infoprovider to load data• a transformation file• the data transfer mode• the methold for importing data• run default logic for stored values• check work status when importing data
4. Click Finish.A message advises you that the package link is running on the server.
39.5.5 Modifying the List of Selected Packages
You can organize the list of selected packages as follows:1. Select Organize > Organize Package List.2. In the "Organize Package List" dialog box under "Package Name", select a package and right-click.3. Select an option from the menu. You can do one of the following:
• Add Package• Modify Package• Remove Package• Copy Package• Remove Package
39.5.6 Viewing Package Status
2013-01-30331
Data Manager
You can view the status of packages that are currently running and packages that have been completedas follows:1. Select View Status >View Status
The Package Status dialog box displays a resume of the various packages.
2. If you want to view the detail logs corresponding to the package, select the package, then clickDetail.
39.5.7 Viewing Package Schedule Status
You can view the status of packages that have been scheduled.1. Click View Status > View Schedule Status.
The "Package Schedule Status" dialog box opens.
2. Select how you want to filter data, then click Refresh.
The dialog box displays the details of the schedule including a history of when the package ranagainst the schedule.
3. If you want to view the details of the schedule, double-click the schedule name, which opens the"Job Detail" dialog box.
At this point you can modify the scheduling parameters.
4. Click OK or Cancel.
39.5.8 Adding Multiple Process Chains to a Package
You can add multiple process chains to a process chain using the TASK command as follows:1. Click Organize > Organize Package List.2. Browse to locate the package to which you want to add a package chain.3. Select the package then right-click.4. Select "Modify Package".5. Click Modify Script.6. In the "Modify Script" dialog box, under "Dynamic Package Script (MODIFYSCRIPT)" click "TASK".7. Under "Activate" select the tasks you want to include in the process chain.8. Click Save.
You return to the "Modify Package" dialog box where you can modify the group, package name, ordescription.
9. Click Save.
2013-01-30332
Data Manager
39.5.9 Importing and Exporting Data Having Multiple Key Figures
You can import and export transactional data that consists of more than one key figure for the samesource into the same Planning and Consolidation application by using an additional keyword in themapping section of the transformation file. Proceed as follows:1. Select Transformation File > New Transformation File2. Map the multiple key figures to the single key figure using a keyword in the mapping section of the
transformation file.3. Save the transformation file.4. Run the package and choose the transformation file.
39.5.10 Retracting Master Data and Transaction Data
You can retract both master data and transaction data using the BADI process type called by a processchain.
Before running the BADI process type you must specify the filter in the data package script to indicateto the system which BADI implementation to call.
Note:For master data, the BADI is called only once since packaging is not supported, however, for transactiondata, the BADI is called for each package during the transaction data load.
The BADI implementation (syntax) is checked during validation. When validating a transformation filewith a start_routine or end_routine, the system validates the results of these routines while thevalidation runs all code, except the commit (write).
Note:For the retractor BADI, the system does not validate the syntax. You must validate the syntax of yourBADI implementation.
You define *start_routine and *end_routine in the transformation file.
Example:In the transformation file:
*Option*start_routine = <filtervalue_start>*end_routine = <filtervalue_end>
For each data package, before transformation, the system executes the BADI implementation for thestart routine by the filter value = filtervalue_start.
2013-01-30333
Data Manager
For master data and transaction data, the start_routine BADI is filled after the master data or transactiondata has been read and made available.
For each data package, after transformation, the system executes the BADI implementation forend_routine by the filter value = filtervalue_end.
When *start_routine is not empty, the value in <filtervalue_start> is used to find the BADIimplementation that is called before transformation. When *end_routine is not empty, the value in<filtervalue_end> is used to find the BADI implementation that is called after transformation.
For master data and transaction data, the end_routine BADI is called before the write (commit to NW).The value for <filtervalue_start> and <filtervalue_end> must be unique. When callingBADI, this value is used to find the correct BADI implementation. Although you can set the value for*start_routine and *end_routine to be the same, having different values may be more realistic.For masterdata, the BADI is based on the table level since master data extraction and retraction do notsupport packaging of data. For transaction data, the BADI is based on package level since packagingis supported.
39.5.11 About Delta Initialization
Delta initialization is a simple process to prime the source system to record changes after an initialextraction of data is made. A user who has sufficient rights can use the Organize Delta Initializationfeature in Data Manager, version for SAP NetWeaver.
You create delta initializations via the "Organize Delta Initialization" dialog box, which displays theexisting data initializations with the following information:• Name• Description• InfoProvider• Selection• Status of latest load• Time of latest load• User of lates load• Trigger full load at first run• Number of the load• Records of load• Creating time• Transformation file• Package group of latest load• Latest request
From the Organize Delta Initialization dialog box you can also perform the following:• View the detailed parameters of a selected delta initialization.• Modify a selected delta initialization.
2013-01-30334
Data Manager
• Remove the selected delta initialization.• Load the updated delta initialization from server.• Search in delta initializations.• Filter a delta initialization by Name, Description and InfoProvider in the current page.
Note:You can delete a delta initialization only if it has not been triggered. If a delta initialization has not beentriggered you can modify all parameters; if it has been triggered you can modify only the descriptionand field list.
39.5.11.1 Organizing Delta Initialization
You create a new delta initialization in the "Organiza Delta Initialization" dialog box, which you accessfrom the Organize menu.
Proceed as follows:1. In the "Organize Delta Initialization" dialog box click Organize > New.2. In the appropriate fields type a name and description for the delta initialization.3. Click the icon next to the "InfoProvider" box and, from the "InfoProvider Selection" window,select
the InfoProvider you want to use.4. Under the"Selection"tab do the following:
• Select the Dimension/File, Attribute, and Operator.• Type a low and high value where appropriate.
5. Under the "Dimension/Field List" tab select the dimensions,fields, and attributes from which youwant to load data. The "Dimension/Field" list corresponds to the columns of source data in theInfoProvider.
6. Click Save, then in the dialog box type or select the name of the file that you are saving to the server.7. Browse to locate the transformation file that you want to use.8. If this is the first time you are loading this InfoProvider, select Trigger a full load at the first run.
If you have already loaded this InfoProvider, do not select the trigger.9. Click OK.
A message box informs you that the InfoProvider has been created successfully and the name of thedelta initialization appears in the "Organize Delta Initialization" dialog box.
39.5.11.2 Modifying a Delta Initialization
If a delta initialization has not be triggered, you can modify all its parameters.
2013-01-30335
Data Manager
If a delta initialization has been triggered, you can modify the description and field list only. Otherparameters appear greyed-out.
39.5.11.3 Running the Delta Initialization
You run the delta initialization from the Run Package dialog box.1. Click Run Package > Run Package.2. Select the "Package Group" and "Package Name", then click Run.
A series of screens open in the "Run Package" dialog box in which you perform the following:• Select the delta initialization you want to run.• Select whether to run the default logic.• Select whether to check work status.• Select when to run the package.
3. Click Finish.A message informs you that the request to run the package on the server was successful and thatthe package is running.
4. Click OK.
You can view the status of the package as well as the detail of the logs.
39.6 Data Transformations and Conversions
39.6.1 About Data Transformations
Data transformations allow you to map external data to internal Planning and Consolidation datastructures.
The Data Manager performs data transformations and mapping using transformation and conversionfiles. To be successfully imported, the source data must be in the proper format. In this case, you candefine the correct dimension members in the conversion file. When the Data Manager import packageis run it reads the transformation file, which has a pointer to a conversion file, and correctly maps thedata.
Two interfaces for Microsoft Excel workbook files are required to perform data transformations. Thefiles are as follows:
2013-01-30336
Data Manager
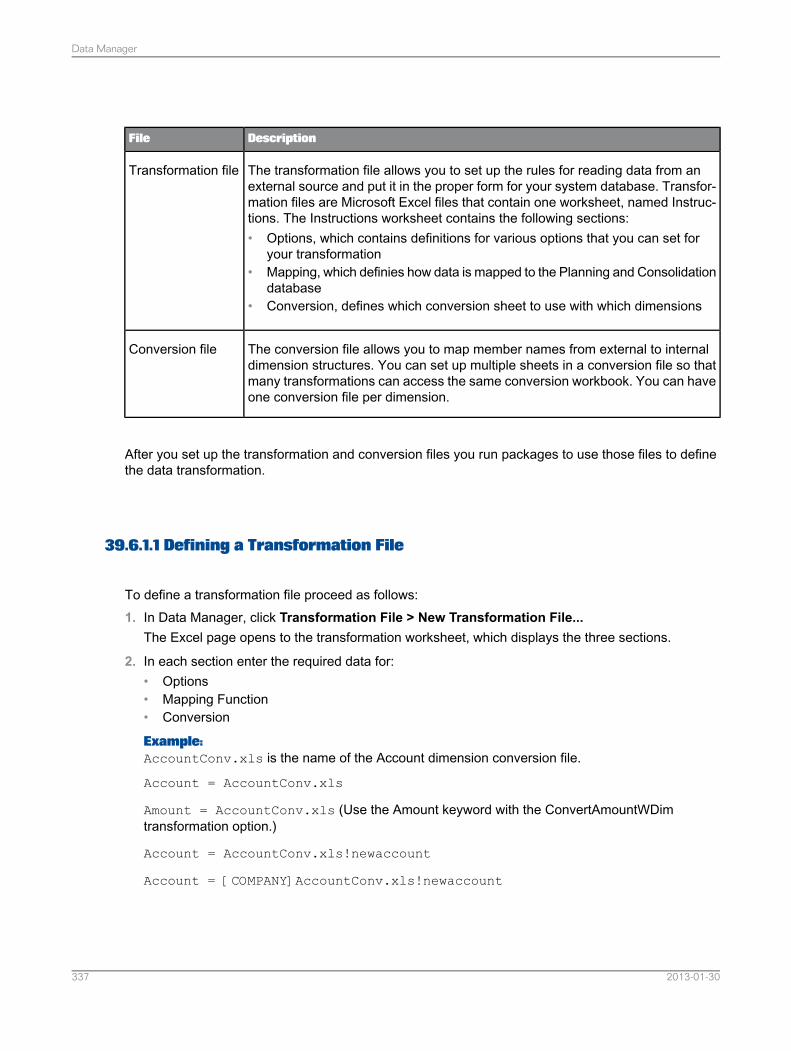
DescriptionFile
The transformation file allows you to set up the rules for reading data from anexternal source and put it in the proper form for your system database. Transfor-mation files are Microsoft Excel files that contain one worksheet, named Instruc-tions. The Instructions worksheet contains the following sections:• Options, which contains definitions for various options that you can set for
your transformation• Mapping, which definies how data is mapped to the Planning and Consolidation
database• Conversion, defines which conversion sheet to use with which dimensions
Transformation file
The conversion file allows you to map member names from external to internaldimension structures. You can set up multiple sheets in a conversion file so thatmany transformations can access the same conversion workbook. You can haveone conversion file per dimension.
Conversion file
After you set up the transformation and conversion files you run packages to use those files to definethe data transformation.
39.6.1.1 Defining a Transformation File
To define a transformation file proceed as follows:1. In Data Manager, click Transformation File > New Transformation File...
The Excel page opens to the transformation worksheet, which displays the three sections.
2. In each section enter the required data for:• Options• Mapping Function• Conversion
Example:AccountConv.xls is the name of the Account dimension conversion file.
Account = AccountConv.xls
Amount = AccountConv.xls (Use the Amount keyword with the ConvertAmountWDimtransformation option.)
Account = AccountConv.xls!newaccount
Account = [COMPANY]AccountConv.xls!newaccount
2013-01-30337
Data Manager

39.6.1.1.1 Transformation File: Options1. In, Data Manager click Transformation File > New Transformation File...
The Excel page opens to the transformation worksheet, which displays the three sections.
2. In the "Options" section, enter the required data. The following table contains a list of availableoptions and descriptions for each option. The following table contains a list of available options thatthe team lead or administrator can set for the transformation, and descriptions for each option:
2013-01-30338
Data Manager
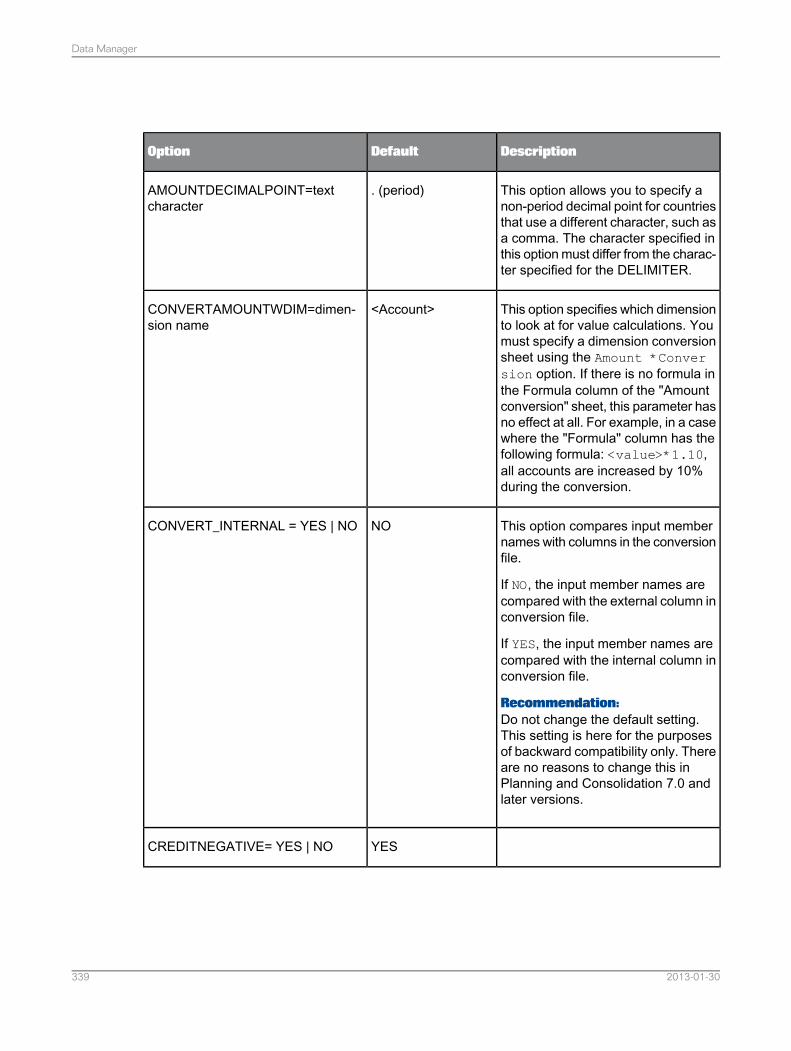
DescriptionDefaultOption
This option allows you to specify anon-period decimal point for countriesthat use a different character, such asa comma. The character specified inthis option must differ from the charac-ter specified for the DELIMITER.
. (period)AMOUNTDECIMALPOINT=textcharacter
This option specifies which dimensionto look at for value calculations. Youmust specify a dimension conversionsheet using the Amount *Conversion option. If there is no formula inthe Formula column of the "Amountconversion" sheet, this parameter hasno effect at all. For example, in a casewhere the "Formula" column has thefollowing formula: <value>*1.10,all accounts are increased by 10%during the conversion.
<Account>CONVERTAMOUNTWDIM=dimen-sion name
This option compares input membernames with columns in the conversionfile.
If NO, the input member names arecompared with the external column inconversion file.
If YES, the input member names arecompared with the internal column inconversion file.
Recommendation:Do not change the default setting.This setting is here for the purposesof backward compatibility only. Thereare no reasons to change this inPlanning and Consolidation 7.0 andlater versions.
NOCONVERT_INTERNAL = YES | NO
YESCREDITNEGATIVE= YES | NO
2013-01-30339
Data Manager
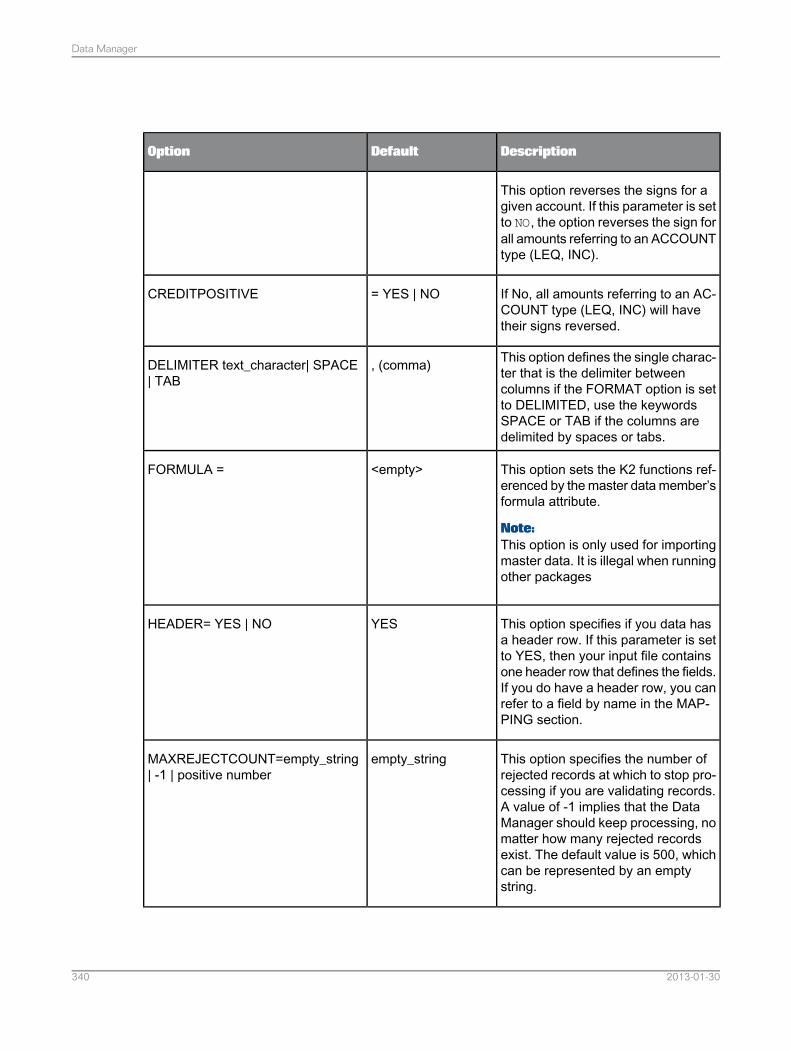
DescriptionDefaultOption
This option reverses the signs for agiven account. If this parameter is setto NO, the option reverses the sign forall amounts referring to an ACCOUNTtype (LEQ, INC).
If No, all amounts referring to an AC-COUNT type (LEQ, INC) will havetheir signs reversed.
= YES | NOCREDITPOSITIVE
This option defines the single charac-ter that is the delimiter betweencolumns if the FORMAT option is setto DELIMITED, use the keywordsSPACE or TAB if the columns aredelimited by spaces or tabs.
, (comma)DELIMITER text_character| SPACE| TAB
This option sets the K2 functions ref-erenced by the master data member’sformula attribute.
Note:This option is only used for importingmaster data. It is illegal when runningother packages
<empty>FORMULA =
This option specifies if you data hasa header row. If this parameter is setto YES, then your input file containsone header row that defines the fields.If you do have a header row, you canrefer to a field by name in the MAP-PING section.
YESHEADER= YES | NO
This option specifies the number ofrejected records at which to stop pro-cessing if you are validating records.A value of -1 implies that the DataManager should keep processing, nomatter how many rejected recordsexist. The default value is 500, whichcan be represented by an emptystring.
empty_stringMAXREJECTCOUNT=empty_string| -1 | positive number
2013-01-30340
Data Manager
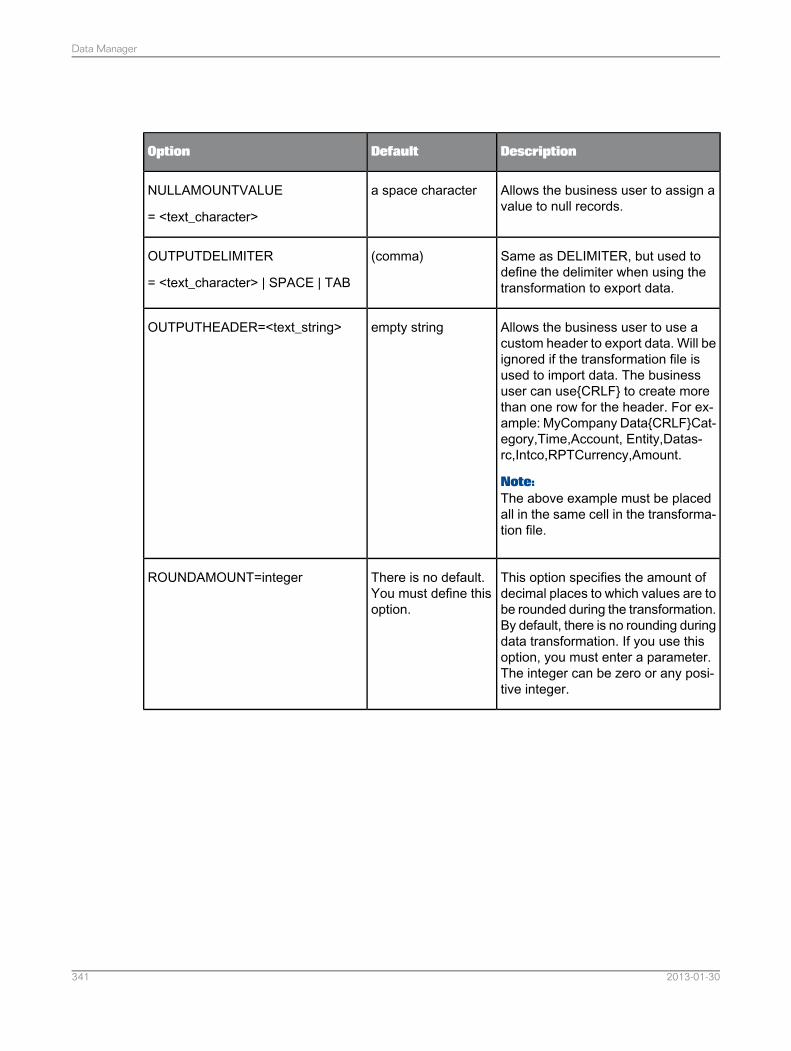
DescriptionDefaultOption
Allows the business user to assign avalue to null records.
a space characterNULLAMOUNTVALUE
= <text_character>
Same as DELIMITER, but used todefine the delimiter when using thetransformation to export data.
(comma)OUTPUTDELIMITER
= <text_character> | SPACE | TAB
Allows the business user to use acustom header to export data. Will beignored if the transformation file isused to import data. The businessuser can use{CRLF} to create morethan one row for the header. For ex-ample: MyCompany Data{CRLF}Cat-egory,Time,Account, Entity,Datas-rc,Intco,RPTCurrency,Amount.
Note:The above example must be placedall in the same cell in the transforma-tion file.
empty stringOUTPUTHEADER=<text_string>
This option specifies the amount ofdecimal places to which values are tobe rounded during the transformation.By default, there is no rounding duringdata transformation. If you use thisoption, you must enter a parameter.The integer can be zero or any posi-tive integer.
There is no default.You must define thisoption.
ROUNDAMOUNT=integer
2013-01-30341
Data Manager
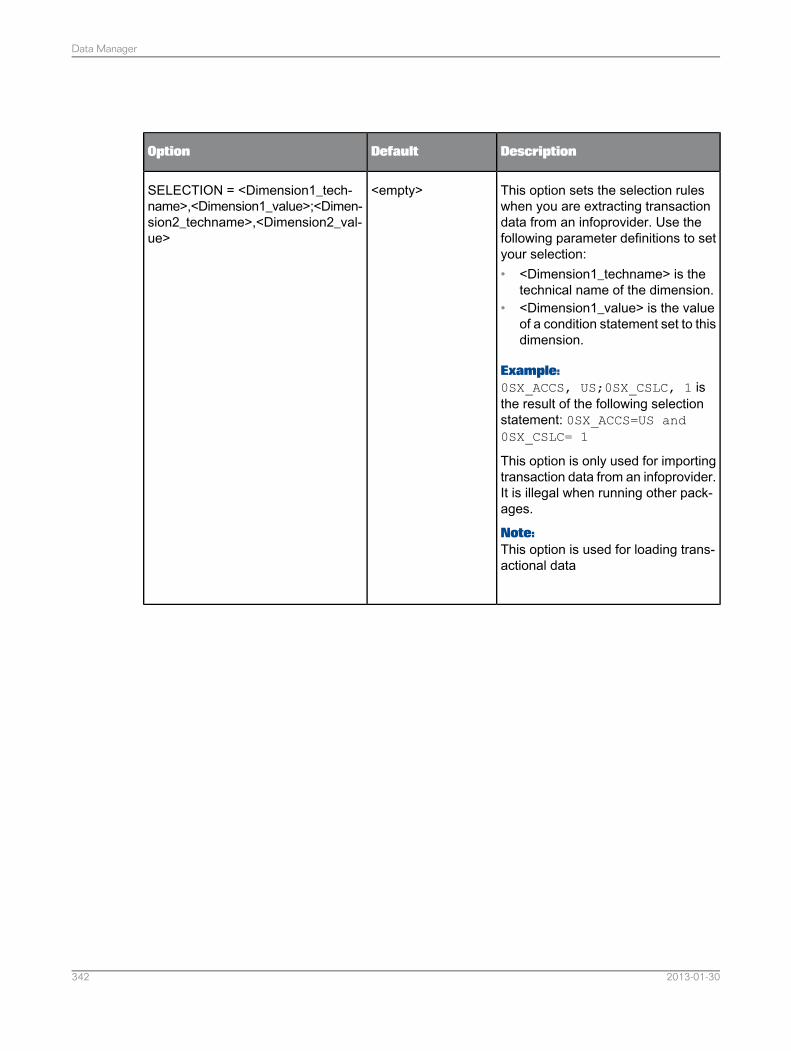
DescriptionDefaultOption
This option sets the selection ruleswhen you are extracting transactiondata from an infoprovider. Use thefollowing parameter definitions to setyour selection:• <Dimension1_techname> is the
technical name of the dimension.• <Dimension1_value> is the value
of a condition statement set to thisdimension.
Example:0SX_ACCS, US;0SX_CSLC, 1 isthe result of the following selectionstatement: 0SX_ACCS=US and0SX_CSLC= 1
This option is only used for importingtransaction data from an infoprovider.It is illegal when running other pack-ages.
Note:This option is used for loading trans-actional data
<empty>SELECTION = <Dimension1_tech-name>,<Dimension1_value>;<Dimen-sion2_techname>,<Dimension2_val-ue>
2013-01-30342
Data Manager
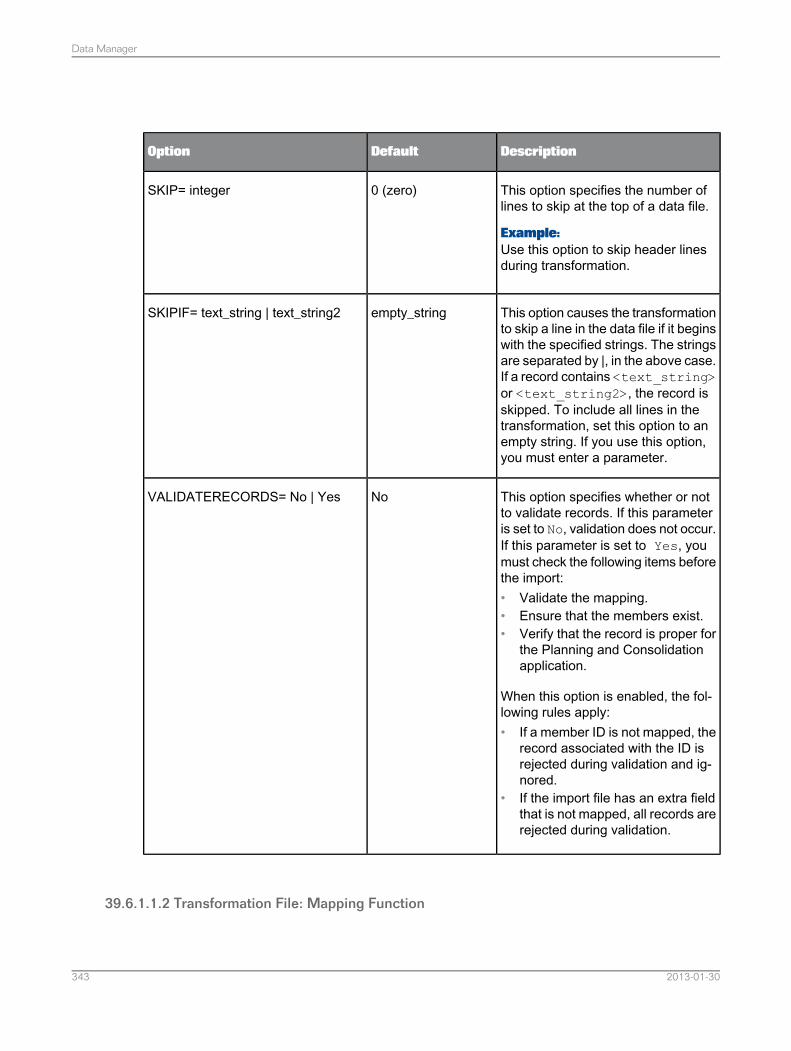
DescriptionDefaultOption
This option specifies the number oflines to skip at the top of a data file.
Example:Use this option to skip header linesduring transformation.
0 (zero)SKIP= integer
This option causes the transformationto skip a line in the data file if it beginswith the specified strings. The stringsare separated by |, in the above case.If a record contains <text_string>or <text_string2>, the record isskipped. To include all lines in thetransformation, set this option to anempty string. If you use this option,you must enter a parameter.
empty_stringSKIPIF= text_string | text_string2
This option specifies whether or notto validate records. If this parameteris set to No, validation does not occur.If this parameter is set to Yes, youmust check the following items beforethe import:• Validate the mapping.• Ensure that the members exist.• Verify that the record is proper for
the Planning and Consolidationapplication.
When this option is enabled, the fol-lowing rules apply:• If a member ID is not mapped, the
record associated with the ID isrejected during validation and ig-nored.
• If the import file has an extra fieldthat is not mapped, all records arerejected during validation.
NoVALIDATERECORDS= No | Yes
39.6.1.1.2 Transformation File: Mapping Function
2013-01-30343
Data Manager
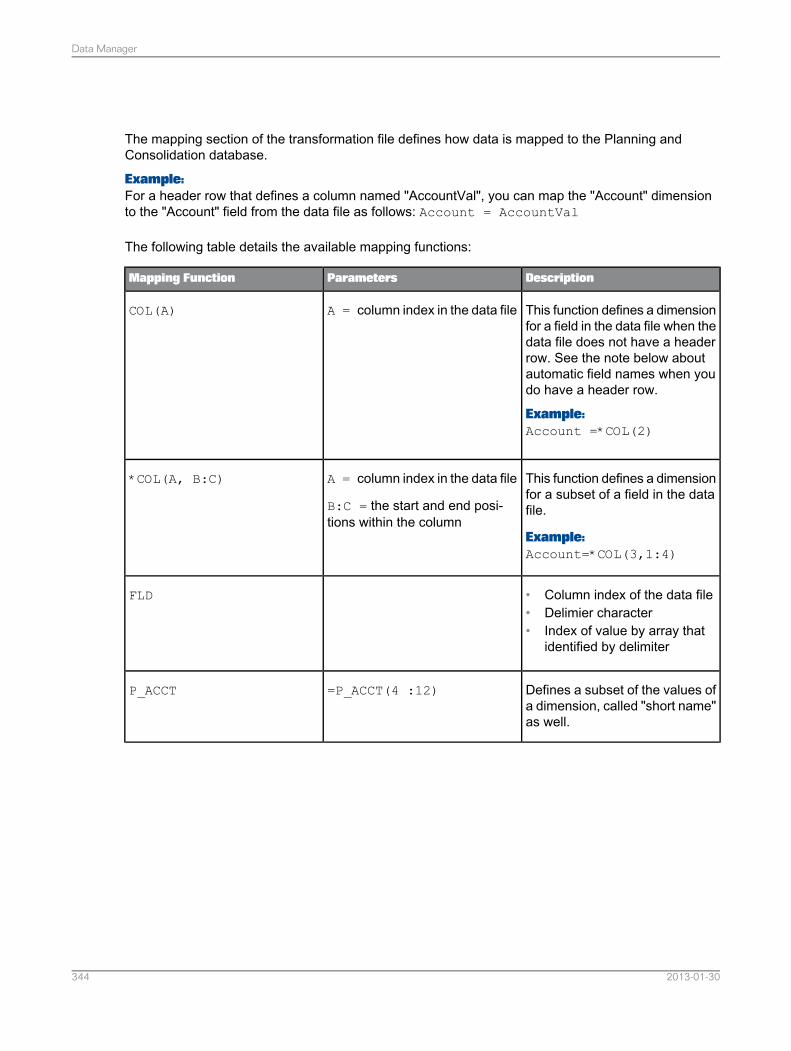
The mapping section of the transformation file defines how data is mapped to the Planning andConsolidation database.
Example:For a header row that defines a column named "AccountVal", you can map the "Account" dimensionto the "Account" field from the data file as follows: Account = AccountVal
The following table details the available mapping functions:
DescriptionParametersMapping Function
This function defines a dimensionfor a field in the data file when thedata file does not have a headerrow. See the note below aboutautomatic field names when youdo have a header row.
Example:Account =*COL(2)
A = column index in the data fileCOL(A)
This function defines a dimensionfor a subset of a field in the datafile.
Example:Account=*COL(3,1:4)
A = column index in the data file
B:C = the start and end posi-tions within the column
*COL(A, B:C)
• Column index of the data file• Delimier character• Index of value by array that
identified by delimiter
FLD
Defines a subset of the values ofa dimension, called "short name"as well.
=P_ACCT(4 :12)P_ACCT
2013-01-30344
Data Manager
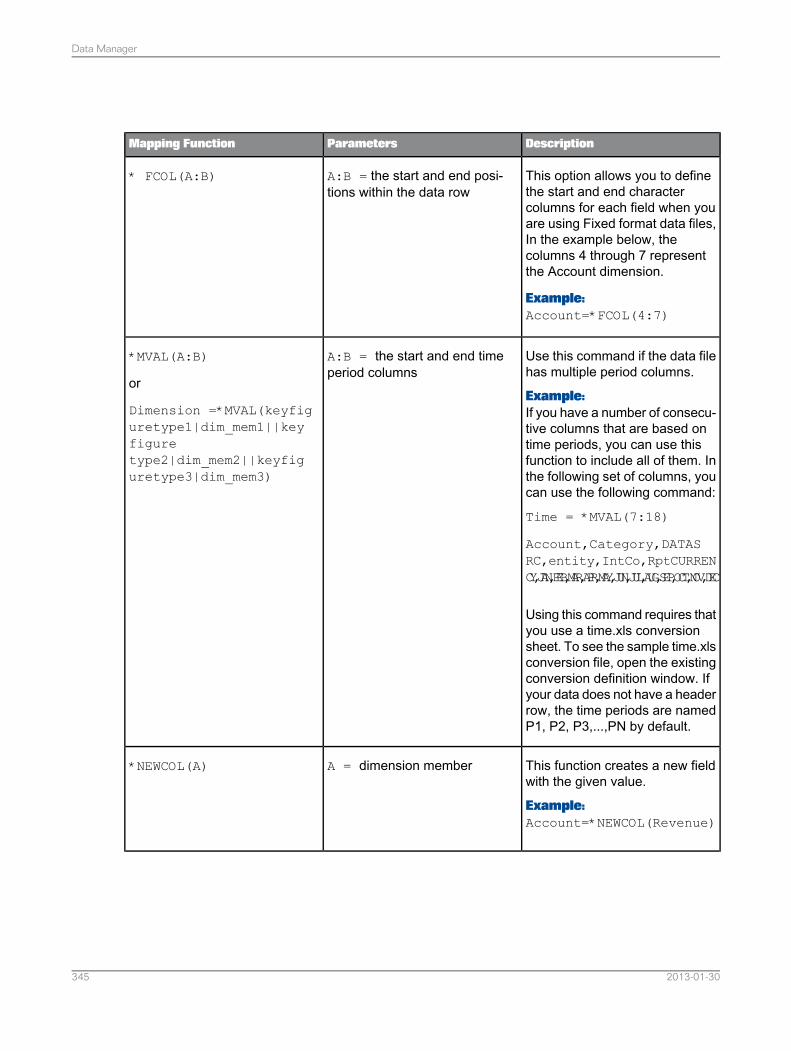
DescriptionParametersMapping Function
This option allows you to definethe start and end charactercolumns for each field when youare using Fixed format data files,In the example below, thecolumns 4 through 7 representthe Account dimension.
Example:Account=*FCOL(4:7)
A:B = the start and end posi-tions within the data row
* FCOL(A:B)
Use this command if the data filehas multiple period columns.
Example:If you have a number of consecu-tive columns that are based ontime periods, you can use thisfunction to include all of them. Inthe following set of columns, youcan use the following command:
Time = *MVAL(7:18)
Account,Category,DATASRC,entity,IntCo,RptCURRENCY,JAN,FEB,MAR,APR,MAY,JUN,JUL,AUG,SEP,OCT,NOV,DEC
Using this command requires thatyou use a time.xls conversionsheet. To see the sample time.xlsconversion file, open the existingconversion definition window. Ifyour data does not have a headerrow, the time periods are namedP1, P2, P3,...,PN by default.
A:B = the start and end timeperiod columns
*MVAL(A:B)
or
Dimension =*MVAL(keyfiguretype1|dim_mem1||keyfiguretype2|dim_mem2||keyfiguretype3|dim_mem3)
This function creates a new fieldwith the given value.
Example:Account=*NEWCOL(Revenue)
A = dimension member*NEWCOL(A)
2013-01-30345
Data Manager
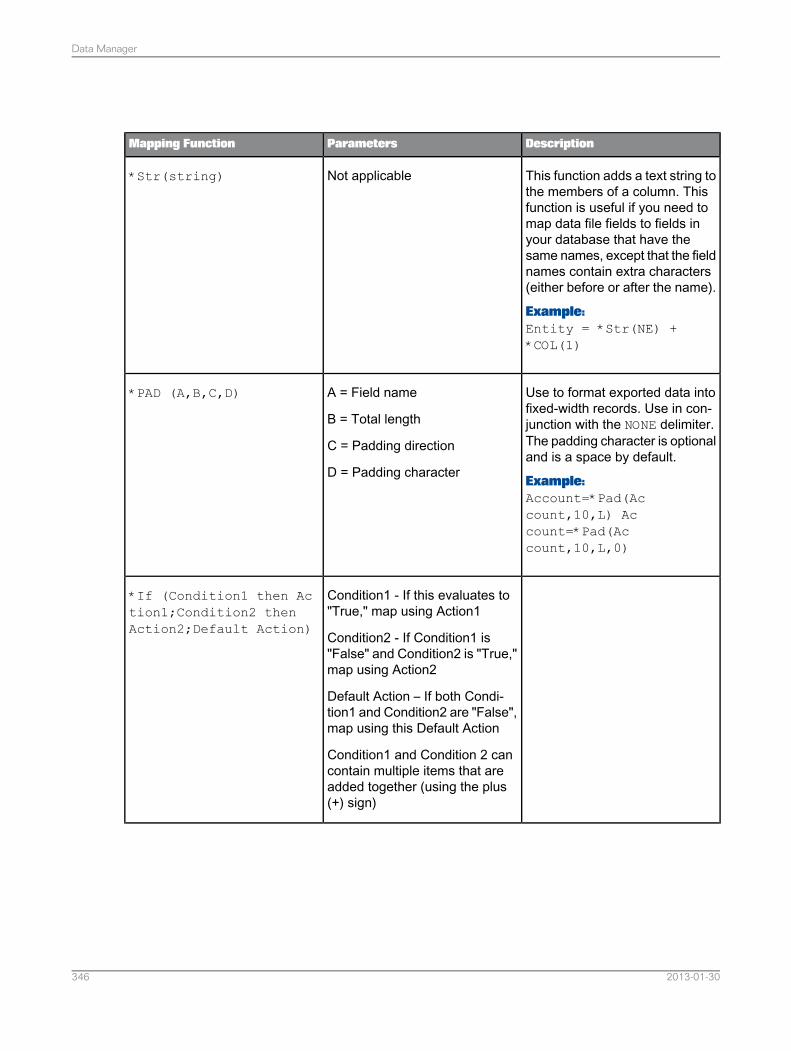
DescriptionParametersMapping Function
This function adds a text string tothe members of a column. Thisfunction is useful if you need tomap data file fields to fields inyour database that have thesame names, except that the fieldnames contain extra characters(either before or after the name).
Example:Entity = *Str(NE) +*COL(1)
Not applicable*Str(string)
Use to format exported data intofixed-width records. Use in con-junction with the NONE delimiter.The padding character is optionaland is a space by default.
Example:Account=*Pad(Account,10,L) Account=*Pad(Account,10,L,0)
A = Field name
B = Total length
C = Padding direction
D = Padding character
*PAD (A,B,C,D)
Condition1 - If this evaluates to"True," map using Action1
Condition2 - If Condition1 is"False" and Condition2 is "True,"map using Action2
Default Action – If both Condi-tion1 and Condition2 are "False",map using this Default Action
Condition1 and Condition 2 cancontain multiple items that areadded together (using the plus(+) sign)
*If (Condition1 then Action1;Condition2 thenAction2;Default Action)
2013-01-30346
Data Manager
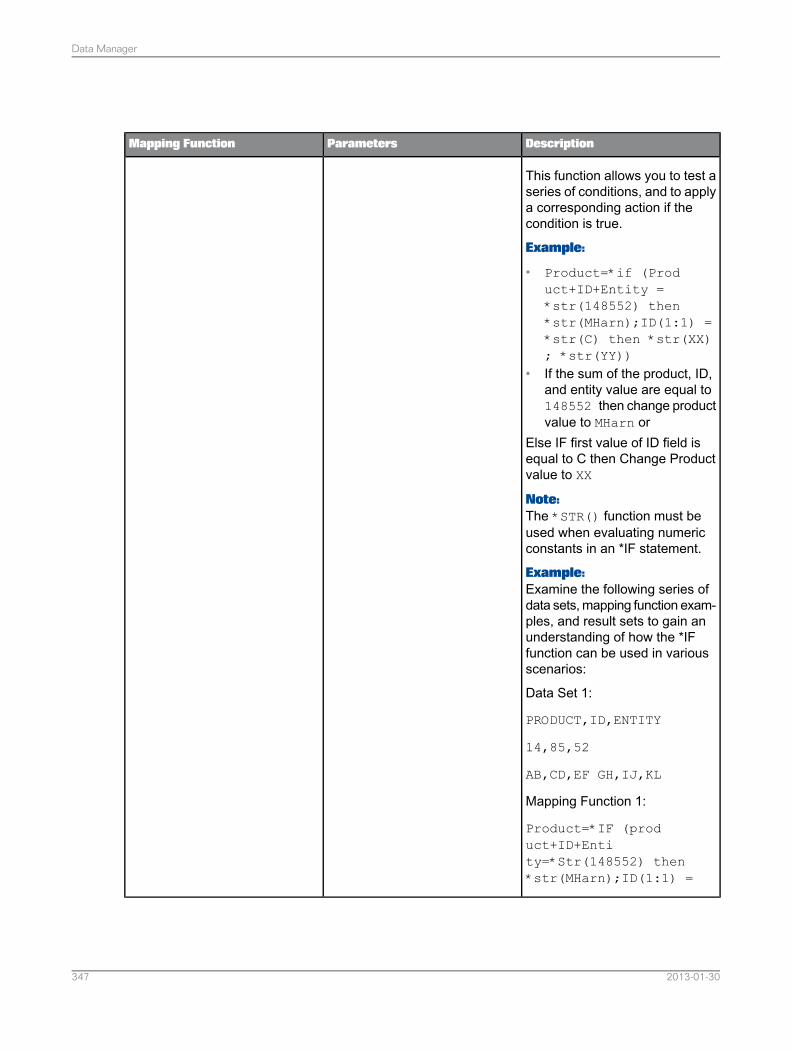
DescriptionParametersMapping Function
This function allows you to test aseries of conditions, and to applya corresponding action if thecondition is true.
Example:
• Product=*if (Product+ID+Entity =*str(148552) then*str(MHarn);ID(1:1) =*str(C) then *str(XX); *str(YY))
• If the sum of the product, ID,and entity value are equal to148552 then change productvalue to MHarn or
Else IF first value of ID field isequal to C then Change Productvalue to XX
Note:The *STR() function must beused when evaluating numericconstants in an *IF statement.
Example:Examine the following series ofdata sets, mapping function exam-ples, and result sets to gain anunderstanding of how the *IFfunction can be used in variousscenarios:
Data Set 1:
PRODUCT,ID,ENTITY
14,85,52
AB,CD,EF GH,IJ,KL
Mapping Function 1:
Product=*IF (product+ID+Entity=*Str(148552) then*str(MHarn);ID(1:1) =
2013-01-30347
Data Manager
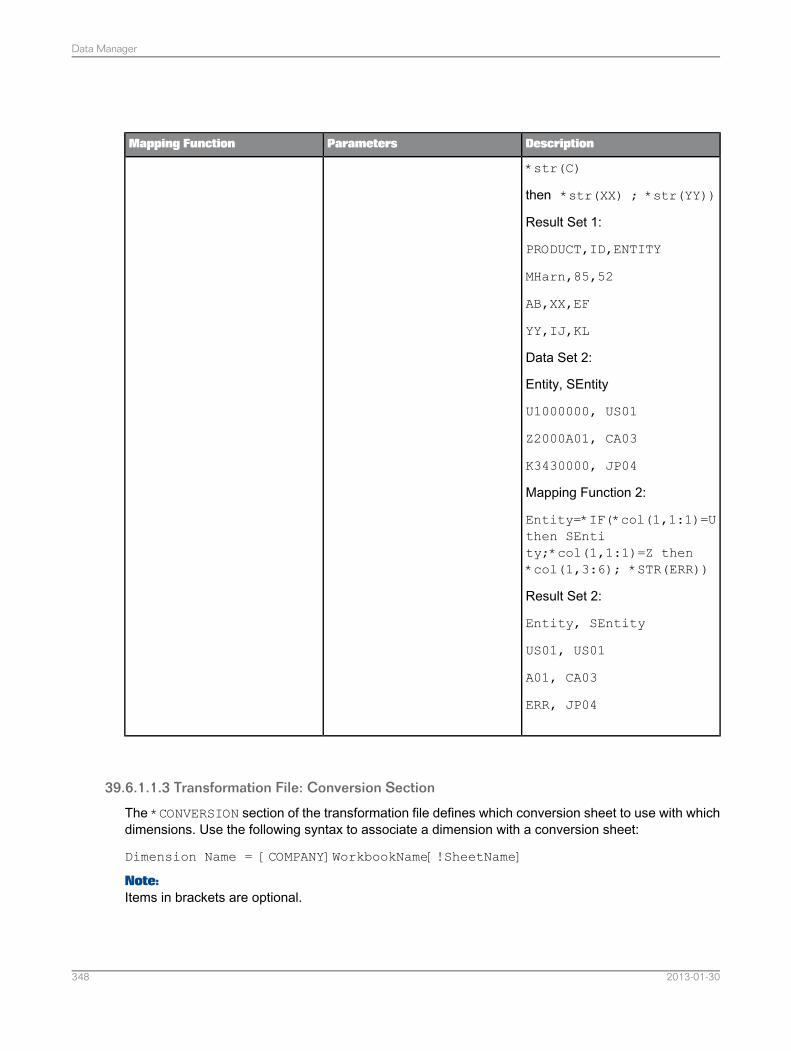
DescriptionParametersMapping Function
*str(C)
then *str(XX) ; *str(YY))
Result Set 1:
PRODUCT,ID,ENTITY
MHarn,85,52
AB,XX,EF
YY,IJ,KL
Data Set 2:
Entity, SEntity
U1000000, US01
Z2000A01, CA03
K3430000, JP04
Mapping Function 2:
Entity=*IF(*col(1,1:1)=Uthen SEntity;*col(1,1:1)=Z then*col(1,3:6); *STR(ERR))
Result Set 2:
Entity, SEntity
US01, US01
A01, CA03
ERR, JP04
39.6.1.1.3 Transformation File: Conversion Section
The *CONVERSION section of the transformation file defines which conversion sheet to use with whichdimensions. Use the following syntax to associate a dimension with a conversion sheet:
Dimension Name = [COMPANY]WorkbookName[!SheetName]
Note:Items in brackets are optional.
2013-01-30348
Data Manager
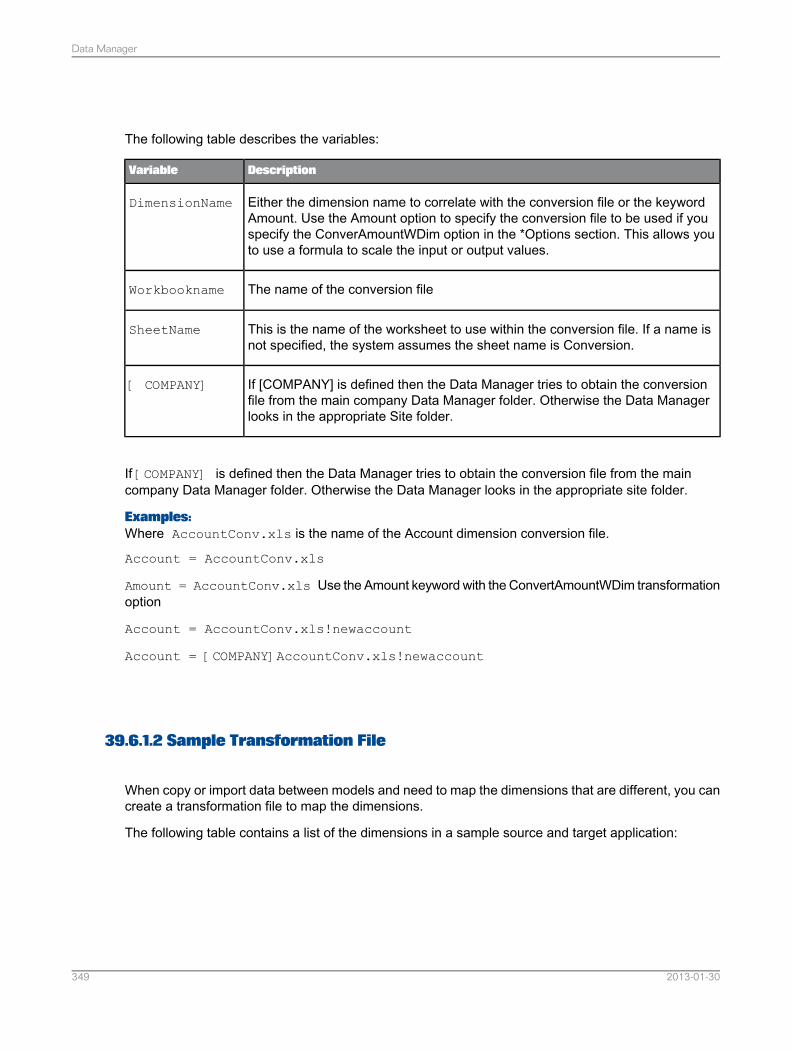
The following table describes the variables:
DescriptionVariable
Either the dimension name to correlate with the conversion file or the keywordAmount. Use the Amount option to specify the conversion file to be used if youspecify the ConverAmountWDim option in the *Options section. This allows youto use a formula to scale the input or output values.
DimensionName
The name of the conversion fileWorkbookname
This is the name of the worksheet to use within the conversion file. If a name isnot specified, the system assumes the sheet name is Conversion.
SheetName
If [COMPANY] is defined then the Data Manager tries to obtain the conversionfile from the main company Data Manager folder. Otherwise the Data Managerlooks in the appropriate Site folder.
[ COMPANY]
If [COMPANY] is defined then the Data Manager tries to obtain the conversion file from the maincompany Data Manager folder. Otherwise the Data Manager looks in the appropriate site folder.
Examples:Where AccountConv.xls is the name of the Account dimension conversion file.
Account = AccountConv.xls
Amount = AccountConv.xls Use the Amount keyword with the ConvertAmountWDim transformationoption
Account = AccountConv.xls!newaccount
Account = [COMPANY]AccountConv.xls!newaccount
39.6.1.2 Sample Transformation File
When copy or import data between models and need to map the dimensions that are different, you cancreate a transformation file to map the dimensions.
The following table contains a list of the dimensions in a sample source and target application:
2013-01-30349
Data Manager
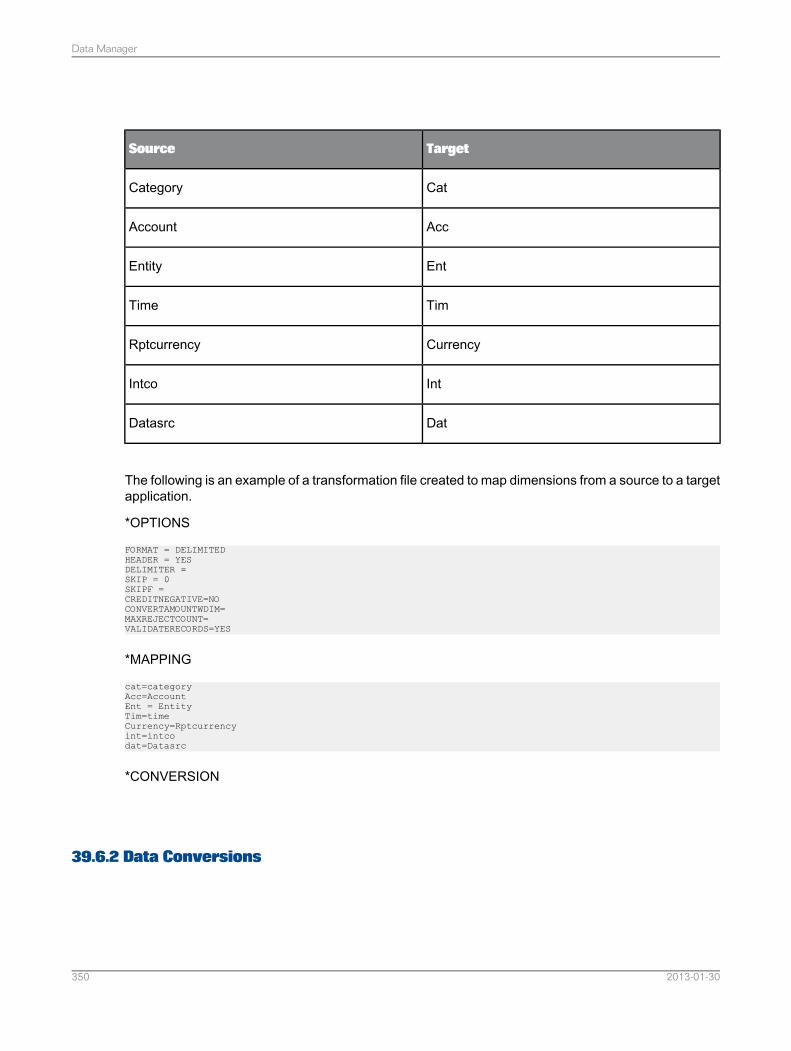
TargetSource
CatCategory
AccAccount
EntEntity
TimTime
CurrencyRptcurrency
IntIntco
DatDatasrc
The following is an example of a transformation file created to map dimensions from a source to a targetapplication.
*OPTIONS
FORMAT = DELIMITEDHEADER = YESDELIMITER =SKIP = 0SKIPF =CREDITNEGATIVE=NOCONVERTAMOUNTWDIM=MAXREJECTCOUNT=VALIDATERECORDS=YES
*MAPPING
cat=categoryAcc=AccountEnt = EntityTim=timeCurrency=Rptcurrencyint=intcodat=Datasrc
*CONVERSION
39.6.2 Data Conversions
2013-01-30350
Data Manager
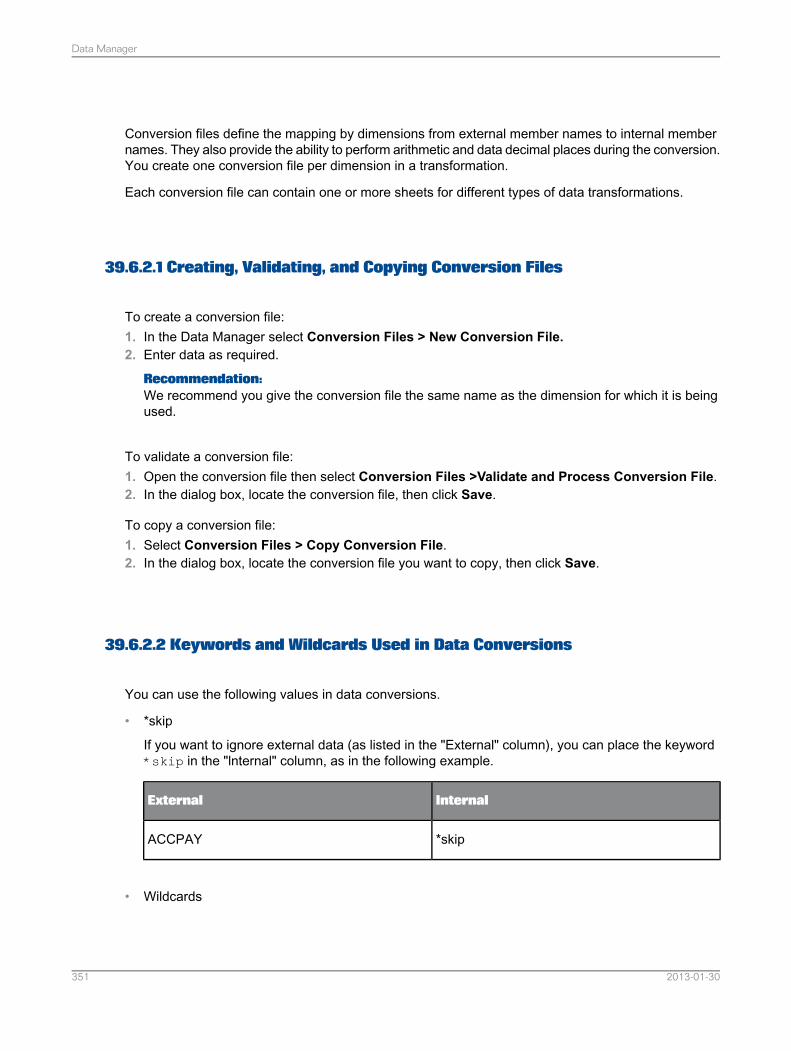
Conversion files define the mapping by dimensions from external member names to internal membernames. They also provide the ability to perform arithmetic and data decimal places during the conversion.You create one conversion file per dimension in a transformation.
Each conversion file can contain one or more sheets for different types of data transformations.
39.6.2.1 Creating, Validating, and Copying Conversion Files
To create a conversion file:1. In the Data Manager select Conversion Files > New Conversion File.2. Enter data as required.
Recommendation:We recommend you give the conversion file the same name as the dimension for which it is beingused.
To validate a conversion file:1. Open the conversion file then select Conversion Files >Validate and Process Conversion File.2. In the dialog box, locate the conversion file, then click Save.
To copy a conversion file:1. Select Conversion Files > Copy Conversion File.2. In the dialog box, locate the conversion file you want to copy, then click Save.
39.6.2.2 Keywords and Wildcards Used in Data Conversions
You can use the following values in data conversions.
• *skip
If you want to ignore external data (as listed in the "External" column), you can place the keyword*skip in the "lnternal" column, as in the following example.
InternalExternal
*skipACCPAY
• Wildcards
2013-01-30351
Data Manager
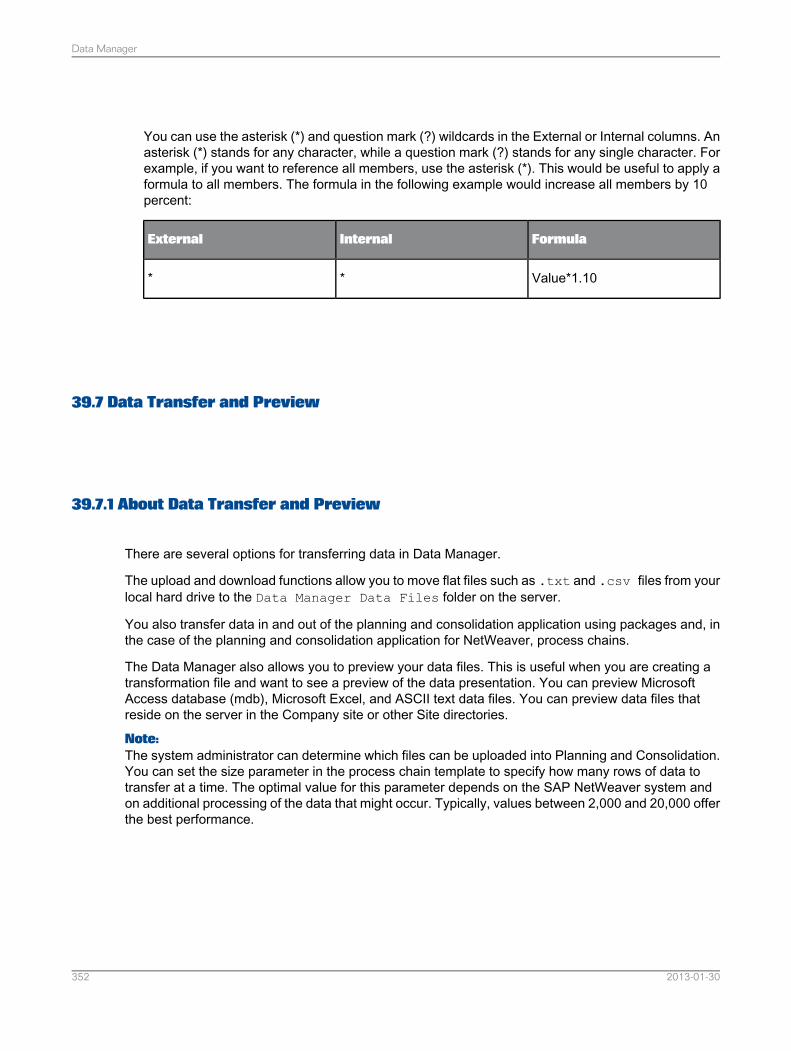
You can use the asterisk (*) and question mark (?) wildcards in the External or Internal columns. Anasterisk (*) stands for any character, while a question mark (?) stands for any single character. Forexample, if you want to reference all members, use the asterisk (*). This would be useful to apply aformula to all members. The formula in the following example would increase all members by 10percent:
FormulaInternalExternal
Value*1.10**
39.7 Data Transfer and Preview
39.7.1 About Data Transfer and Preview
There are several options for transferring data in Data Manager.
The upload and download functions allow you to move flat files such as .txt and .csv files from yourlocal hard drive to the Data Manager Data Files folder on the server.
You also transfer data in and out of the planning and consolidation application using packages and, inthe case of the planning and consolidation application for NetWeaver, process chains.
The Data Manager also allows you to preview your data files. This is useful when you are creating atransformation file and want to see a preview of the data presentation. You can preview MicrosoftAccess database (mdb), Microsoft Excel, and ASCII text data files. You can preview data files thatreside on the server in the Company site or other Site directories.
Note:The system administrator can determine which files can be uploaded into Planning and Consolidation.You can set the size parameter in the process chain template to specify how many rows of data totransfer at a time. The optimal value for this parameter depends on the SAP NetWeaver system andon additional processing of the data that might occur. Typically, values between 2,000 and 20,000 offerthe best performance.
2013-01-30352
Data Manager
39.7.1.1 Uploading or Downloading Data
To upload or download flat files to and from your local hard drive,1. Click one of the following:
• Upload Data• Download Data
2. Browse to locate the flat file you want to upload or download.3. Click one of the following:
• Upload• Download
39.7.1.2 Downloading a Text File from the Database
To download a text file from the database:1. In the Data Manager click Download Data.2. In the "Data Manager - Download" dialog box, browse to locate the text file that you want to download,
then click Download.3. In the next dialog box, select the destination for the file, then click Save.
39.7.1.3 Previewing Data
You can preview the first 200 lines of data. To preview data:1. In the Data Manager click Data Preview.2. Select the file that you want to preview then click Open.3. Depending on the type of file you opened, perform one of the following actions:
• For text files select a data type from the list:• Fixed width• Delimited
Note:If you select delimited files, you must also select a delimiter.
• For Microsoft Excel files, select from the Select a worksheet list.• For database files, select a table from the Select a table list.
2013-01-30353
Data Manager

4. Click Open.5. In the dialog box select a different file and click Open to preview another file. Choose Cancel when
you are done previewing your data.6. When you have finished previewing data, click Cancel.
2013-01-30354
Data Manager
APIs
You can perform some tasks (such as reporting and input tasks or user interface actions) by using theprovided APIs in Microsoft Visual Basic for Applications (VBA).
Note:These APIs are accessible via standard Microsoft Excel commands: in the Developer tab, select theVisual Basic button. Then, in the Microsoft Visual Basic window, select Tools > References. Selectthe FPMXLClient reference. Then, select View > Object Browser. In the dropdown list on the top,select FPMXLClient.
In the list of classes:• The IEPMAutomation class contains the macros that can be executed for the EPM add-in (but cannot
be used with the EPMExecuteAPI function).• The IEPMExecuteAPI class exposes all the macros that you can execute directly from a worksheet
cell, by using the EPMExecuteAPI function. For more information, see EPMExecuteAPI.
Note:
• You can customize your VBA code by associating events. See Custom VBA Functions (Events).• Any API that is not explained in this documentation is not supported.• In Microsoft Office Word and Powerpoint, the EPM add-in APIs are not supported.
40.1 Macros
40.1.1 Context
40.1.1.1 SetContextOptions
2013-01-30355
APIs

This API enables you to change the following context options: lock a dimension, hide a dimension inthe EPM Context bar.
2013-01-30356
APIs
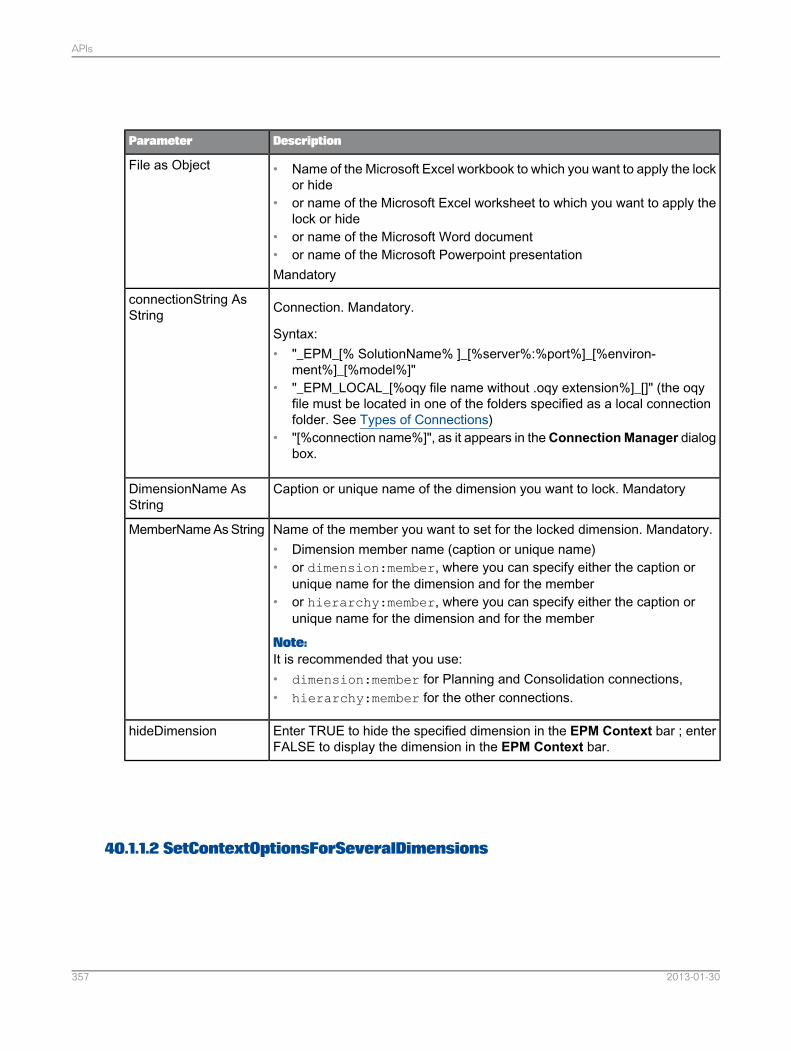
DescriptionParameter
• Name of the Microsoft Excel workbook to which you want to apply the lockor hide
• or name of the Microsoft Excel worksheet to which you want to apply thelock or hide
• or name of the Microsoft Word document• or name of the Microsoft Powerpoint presentationMandatory
File as Object
Connection. Mandatory.
Syntax:• "_EPM_[% SolutionName% ]_[%server%:%port%]_[%environ-
ment%]_[%model%]"• "_EPM_LOCAL_[%oqy file name without .oqy extension%]_[]" (the oqy
file must be located in one of the folders specified as a local connectionfolder. See Types of Connections)
• "[%connection name%]", as it appears in theConnectionManager dialogbox.
connectionString AsString
Caption or unique name of the dimension you want to lock. MandatoryDimensionName AsString
Name of the member you want to set for the locked dimension. Mandatory.• Dimension member name (caption or unique name)• or dimension:member, where you can specify either the caption or
unique name for the dimension and for the member• or hierarchy:member, where you can specify either the caption or
unique name for the dimension and for the member
Note:It is recommended that you use:• dimension:member for Planning and Consolidation connections,• hierarchy:member for the other connections.
MemberName As String
Enter TRUE to hide the specified dimension in the EPM Context bar ; enterFALSE to display the dimension in the EPM Context bar.
hideDimension
40.1.1.2 SetContextOptionsForSeveralDimensions
2013-01-30357
APIs
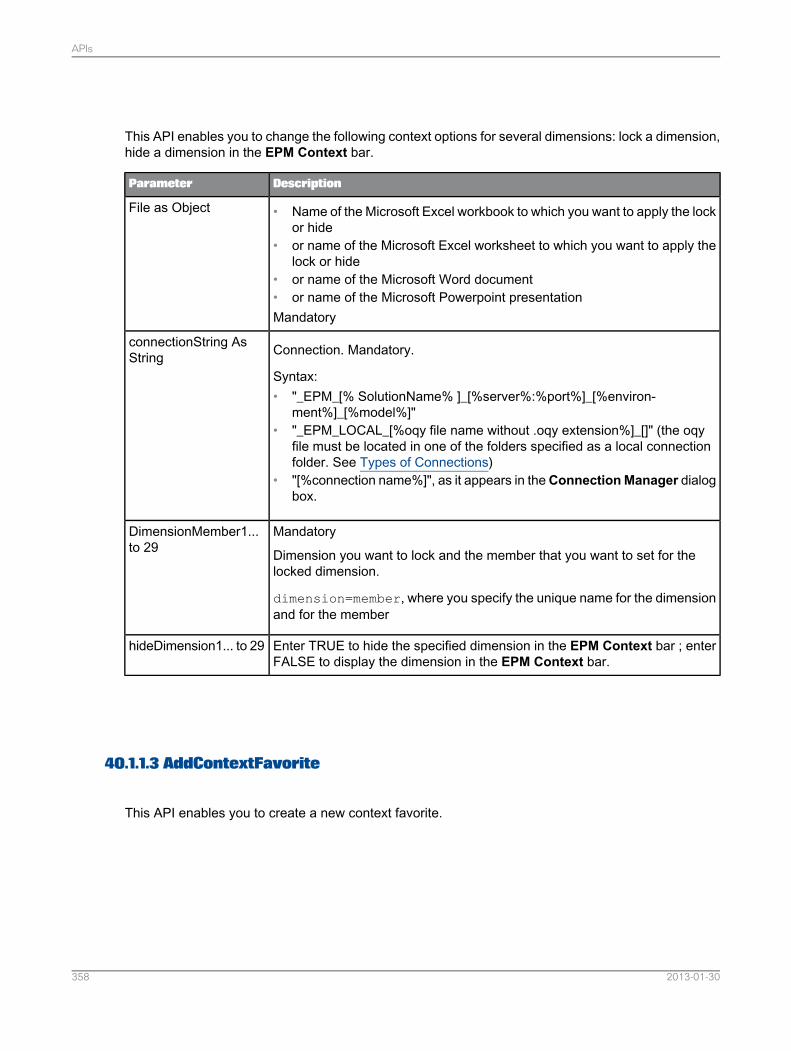
This API enables you to change the following context options for several dimensions: lock a dimension,hide a dimension in the EPM Context bar.
DescriptionParameter
• Name of the Microsoft Excel workbook to which you want to apply the lockor hide
• or name of the Microsoft Excel worksheet to which you want to apply thelock or hide
• or name of the Microsoft Word document• or name of the Microsoft Powerpoint presentationMandatory
File as Object
Connection. Mandatory.
Syntax:• "_EPM_[% SolutionName% ]_[%server%:%port%]_[%environ-
ment%]_[%model%]"• "_EPM_LOCAL_[%oqy file name without .oqy extension%]_[]" (the oqy
file must be located in one of the folders specified as a local connectionfolder. See Types of Connections)
• "[%connection name%]", as it appears in theConnectionManager dialogbox.
connectionString AsString
Mandatory
Dimension you want to lock and the member that you want to set for thelocked dimension.
dimension=member, where you specify the unique name for the dimensionand for the member
DimensionMember1...to 29
Enter TRUE to hide the specified dimension in the EPM Context bar ; enterFALSE to display the dimension in the EPM Context bar.
hideDimension1... to 29
40.1.1.3 AddContextFavorite
This API enables you to create a new context favorite.
2013-01-30358
APIs
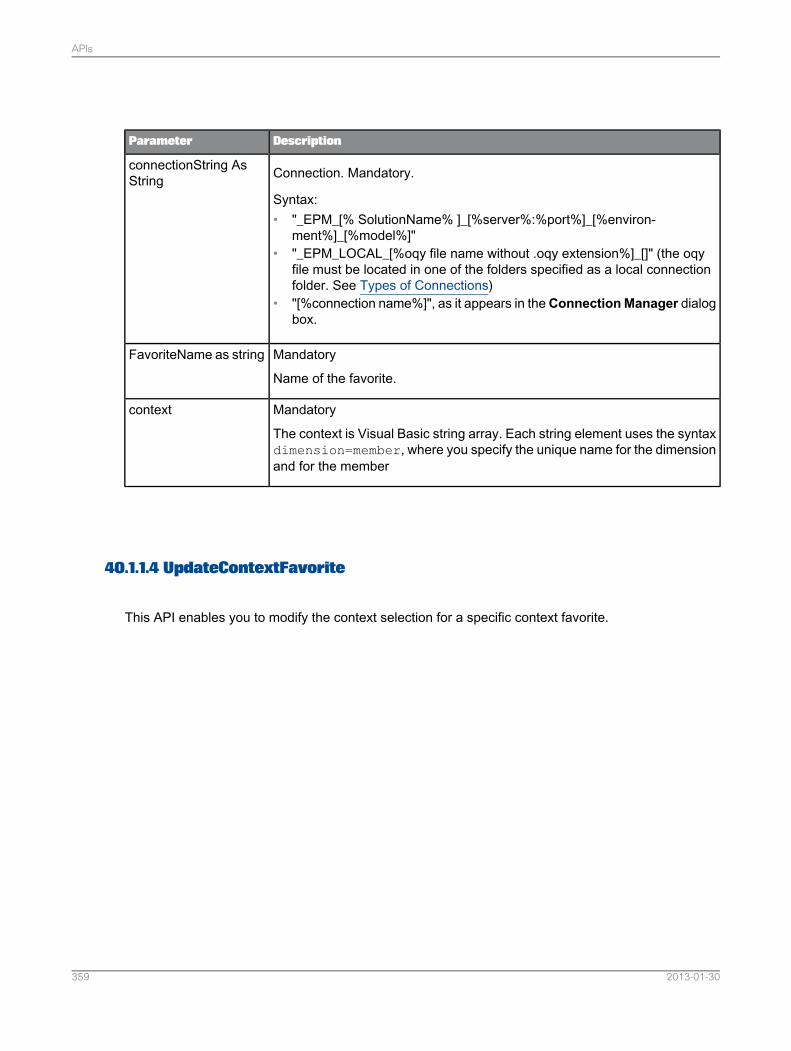
DescriptionParameter
Connection. Mandatory.
Syntax:• "_EPM_[% SolutionName% ]_[%server%:%port%]_[%environ-
ment%]_[%model%]"• "_EPM_LOCAL_[%oqy file name without .oqy extension%]_[]" (the oqy
file must be located in one of the folders specified as a local connectionfolder. See Types of Connections)
• "[%connection name%]", as it appears in theConnectionManager dialogbox.
connectionString AsString
Mandatory
Name of the favorite.
FavoriteName as string
Mandatory
The context is Visual Basic string array. Each string element uses the syntaxdimension=member, where you specify the unique name for the dimensionand for the member
context
40.1.1.4 UpdateContextFavorite
This API enables you to modify the context selection for a specific context favorite.
2013-01-30359
APIs
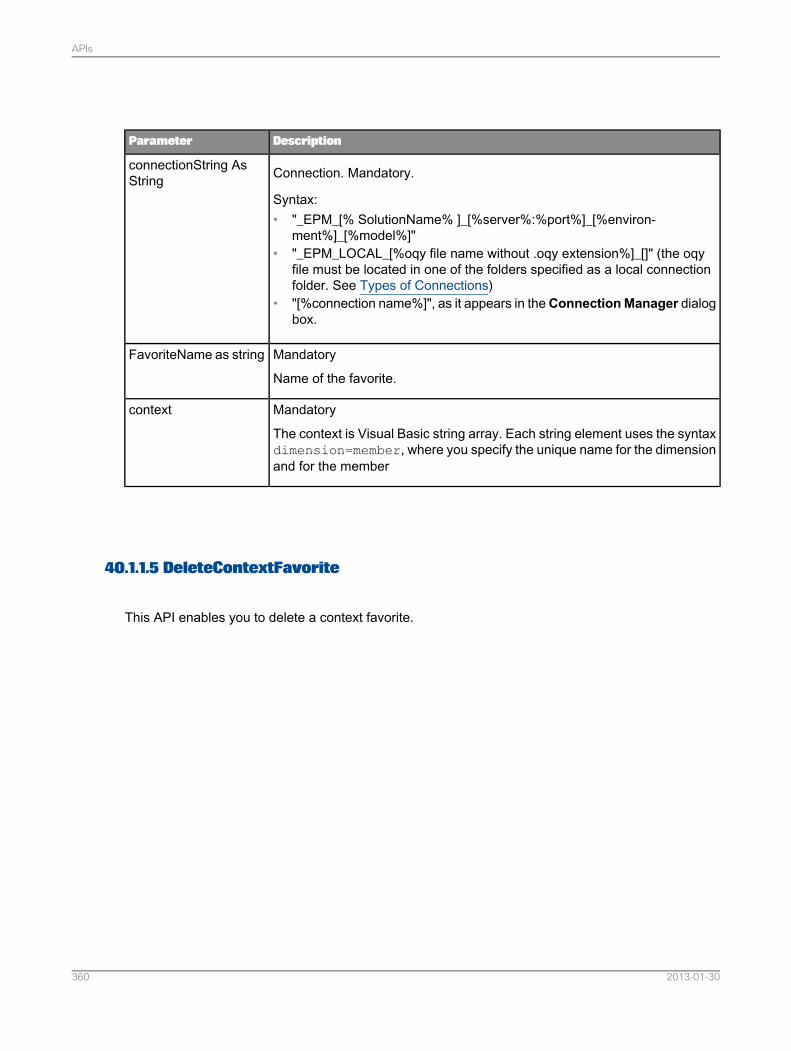
DescriptionParameter
Connection. Mandatory.
Syntax:• "_EPM_[% SolutionName% ]_[%server%:%port%]_[%environ-
ment%]_[%model%]"• "_EPM_LOCAL_[%oqy file name without .oqy extension%]_[]" (the oqy
file must be located in one of the folders specified as a local connectionfolder. See Types of Connections)
• "[%connection name%]", as it appears in theConnectionManager dialogbox.
connectionString AsString
Mandatory
Name of the favorite.
FavoriteName as string
Mandatory
The context is Visual Basic string array. Each string element uses the syntaxdimension=member, where you specify the unique name for the dimensionand for the member
context
40.1.1.5 DeleteContextFavorite
This API enables you to delete a context favorite.
2013-01-30360
APIs

DescriptionParameter
Connection. Mandatory.
Syntax:• "_EPM_[% SolutionName% ]_[%server%:%port%]_[%environ-
ment%]_[%model%]"• "_EPM_LOCAL_[%oqy file name without .oqy extension%]_[]" (the oqy
file must be located in one of the folders specified as a local connectionfolder. See Types of Connections)
• "[%connection name%]", as it appears in theConnectionManager dialogbox.
connectionString AsString
Mandatory
Name of the favorite.
FavoriteName as string
40.1.1.6 SelectContextFavorite
This API enables you to select a context favorite in the EPM Context bar.
2013-01-30361
APIs
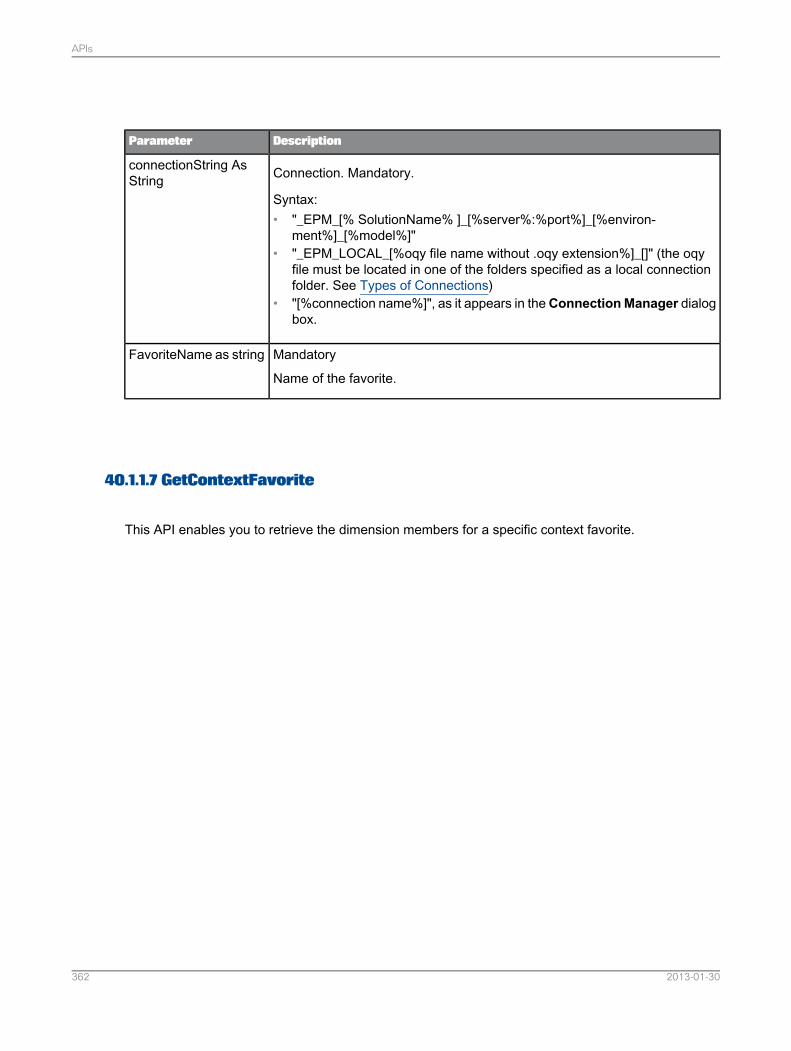
DescriptionParameter
Connection. Mandatory.
Syntax:• "_EPM_[% SolutionName% ]_[%server%:%port%]_[%environ-
ment%]_[%model%]"• "_EPM_LOCAL_[%oqy file name without .oqy extension%]_[]" (the oqy
file must be located in one of the folders specified as a local connectionfolder. See Types of Connections)
• "[%connection name%]", as it appears in theConnectionManager dialogbox.
connectionString AsString
Mandatory
Name of the favorite.
FavoriteName as string
40.1.1.7 GetContextFavorite
This API enables you to retrieve the dimension members for a specific context favorite.
2013-01-30362
APIs
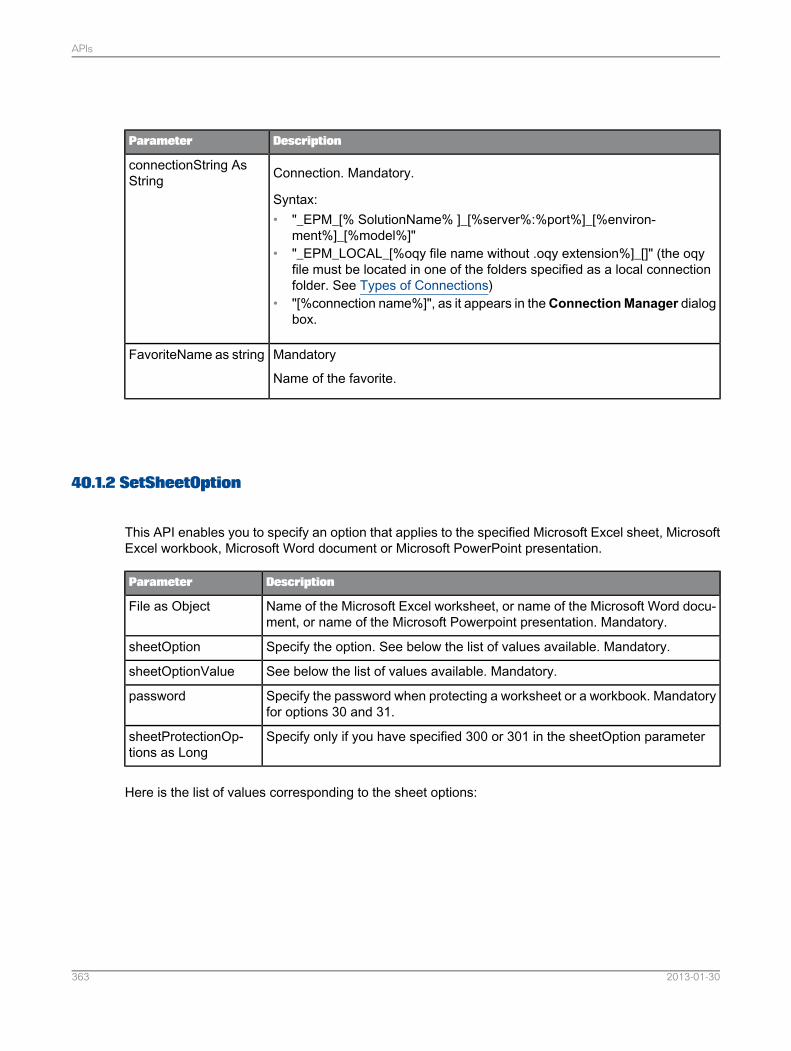
DescriptionParameter
Connection. Mandatory.
Syntax:• "_EPM_[% SolutionName% ]_[%server%:%port%]_[%environ-
ment%]_[%model%]"• "_EPM_LOCAL_[%oqy file name without .oqy extension%]_[]" (the oqy
file must be located in one of the folders specified as a local connectionfolder. See Types of Connections)
• "[%connection name%]", as it appears in theConnectionManager dialogbox.
connectionString AsString
Mandatory
Name of the favorite.
FavoriteName as string
40.1.2 SetSheetOption
This API enables you to specify an option that applies to the specified Microsoft Excel sheet, MicrosoftExcel workbook, Microsoft Word document or Microsoft PowerPoint presentation.
DescriptionParameter
Name of the Microsoft Excel worksheet, or name of the Microsoft Word docu-ment, or name of the Microsoft Powerpoint presentation. Mandatory.
File as Object
Specify the option. See below the list of values available. Mandatory.sheetOption
See below the list of values available. Mandatory.sheetOptionValue
Specify the password when protecting a worksheet or a workbook. Mandatoryfor options 30 and 31.
password
Specify only if you have specified 300 or 301 in the sheetOption parametersheetProtectionOp-tions as Long
Here is the list of values corresponding to the sheet options:
2013-01-30363
APIs
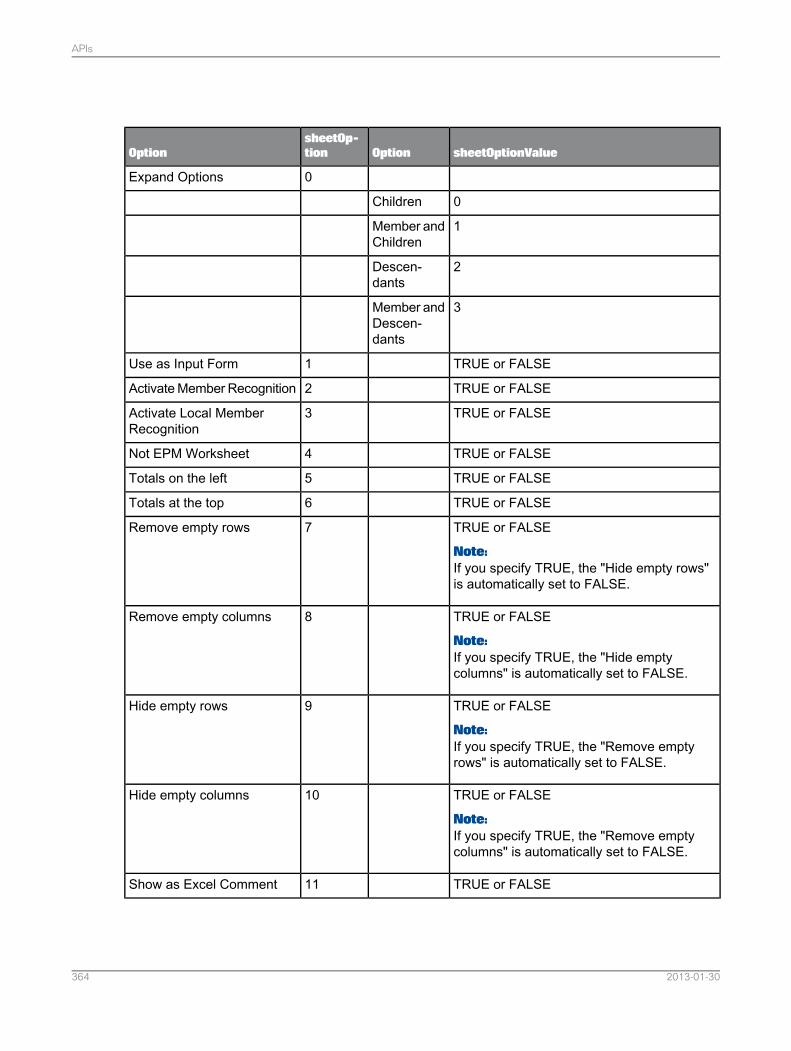
sheetOptionValueOptionsheetOp-tionOption
0Expand Options
0Children
1Member andChildren
2Descen-dants
3Member andDescen-dants
TRUE or FALSE1Use as Input Form
TRUE or FALSE2Activate Member Recognition
TRUE or FALSE3Activate Local MemberRecognition
TRUE or FALSE4Not EPM Worksheet
TRUE or FALSE5Totals on the left
TRUE or FALSE6Totals at the top
TRUE or FALSE
Note:If you specify TRUE, the "Hide empty rows"is automatically set to FALSE.
7Remove empty rows
TRUE or FALSE
Note:If you specify TRUE, the "Hide emptycolumns" is automatically set to FALSE.
8Remove empty columns
TRUE or FALSE
Note:If you specify TRUE, the "Remove emptyrows" is automatically set to FALSE.
9Hide empty rows
TRUE or FALSE
Note:If you specify TRUE, the "Remove emptycolumns" is automatically set to FALSE.
10Hide empty columns
TRUE or FALSE11Show as Excel Comment
2013-01-30364
APIs
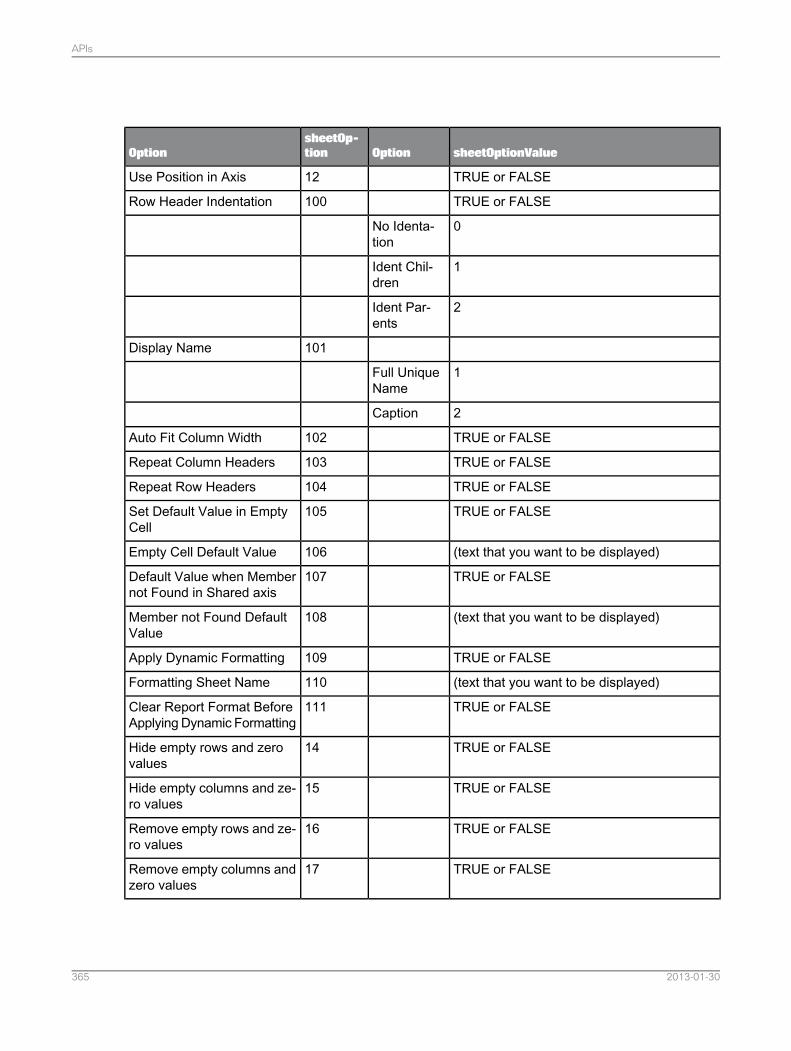
sheetOptionValueOptionsheetOp-tionOption
TRUE or FALSE12Use Position in Axis
TRUE or FALSE100Row Header Indentation
0No Identa-tion
1Ident Chil-dren
2Ident Par-ents
101Display Name
1Full UniqueName
2Caption
TRUE or FALSE102Auto Fit Column Width
TRUE or FALSE103Repeat Column Headers
TRUE or FALSE104Repeat Row Headers
TRUE or FALSE105Set Default Value in EmptyCell
(text that you want to be displayed)106Empty Cell Default Value
TRUE or FALSE107Default Value when Membernot Found in Shared axis
(text that you want to be displayed)108Member not Found DefaultValue
TRUE or FALSE109Apply Dynamic Formatting
(text that you want to be displayed)110Formatting Sheet Name
TRUE or FALSE111Clear Report Format BeforeApplying Dynamic Formatting
TRUE or FALSE14Hide empty rows and zerovalues
TRUE or FALSE15Hide empty columns and ze-ro values
TRUE or FALSE16Remove empty rows and ze-ro values
TRUE or FALSE17Remove empty columns andzero values
2013-01-30365
APIs
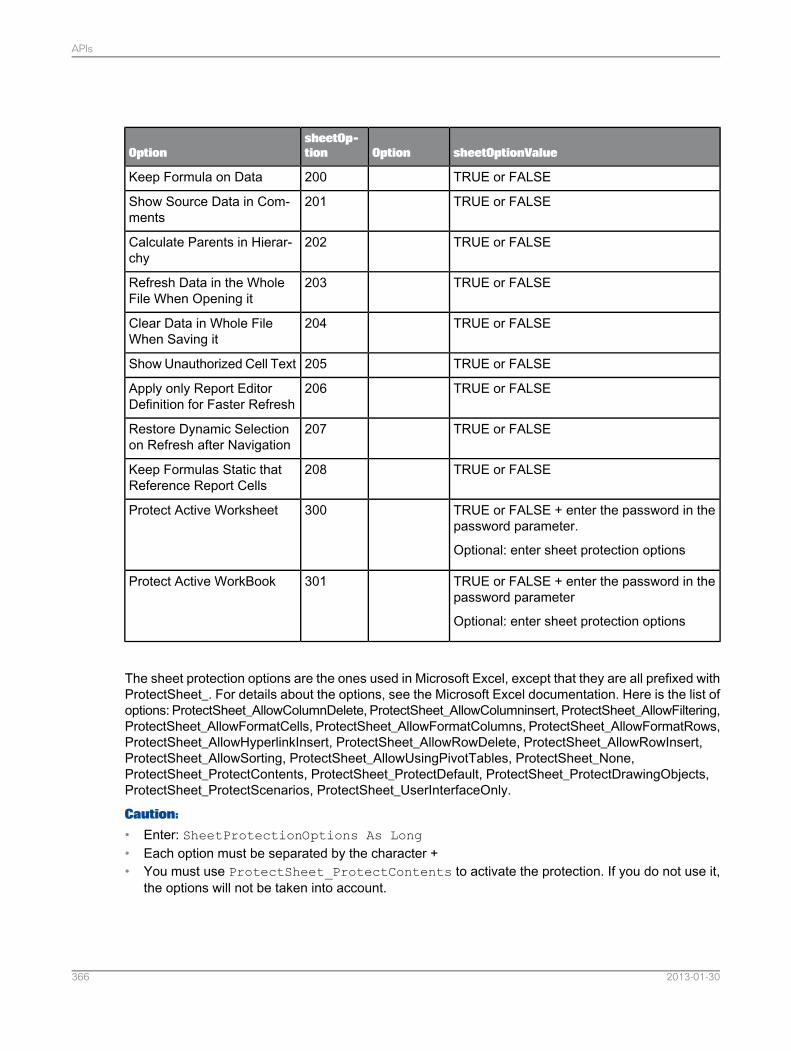
sheetOptionValueOptionsheetOp-tionOption
TRUE or FALSE200Keep Formula on Data
TRUE or FALSE201Show Source Data in Com-ments
TRUE or FALSE202Calculate Parents in Hierar-chy
TRUE or FALSE203Refresh Data in the WholeFile When Opening it
TRUE or FALSE204Clear Data in Whole FileWhen Saving it
TRUE or FALSE205Show Unauthorized Cell Text
TRUE or FALSE206Apply only Report EditorDefinition for Faster Refresh
TRUE or FALSE207Restore Dynamic Selectionon Refresh after Navigation
TRUE or FALSE208Keep Formulas Static thatReference Report Cells
TRUE or FALSE + enter the password in thepassword parameter.
Optional: enter sheet protection options
300Protect Active Worksheet
TRUE or FALSE + enter the password in thepassword parameter
Optional: enter sheet protection options
301Protect Active WorkBook
The sheet protection options are the ones used in Microsoft Excel, except that they are all prefixed withProtectSheet_. For details about the options, see the Microsoft Excel documentation. Here is the list ofoptions: ProtectSheet_AllowColumnDelete, ProtectSheet_AllowColumninsert, ProtectSheet_AllowFiltering,ProtectSheet_AllowFormatCells, ProtectSheet_AllowFormatColumns, ProtectSheet_AllowFormatRows,ProtectSheet_AllowHyperlinkInsert, ProtectSheet_AllowRowDelete, ProtectSheet_AllowRowInsert,ProtectSheet_AllowSorting, ProtectSheet_AllowUsingPivotTables, ProtectSheet_None,ProtectSheet_ProtectContents, ProtectSheet_ProtectDefault, ProtectSheet_ProtectDrawingObjects,ProtectSheet_ProtectScenarios, ProtectSheet_UserInterfaceOnly.
Caution:
• Enter: SheetProtectionOptions As Long• Each option must be separated by the character +• You must use ProtectSheet_ProtectContents to activate the protection. If you do not use it,
the options will not be taken into account.
2013-01-30366
APIs
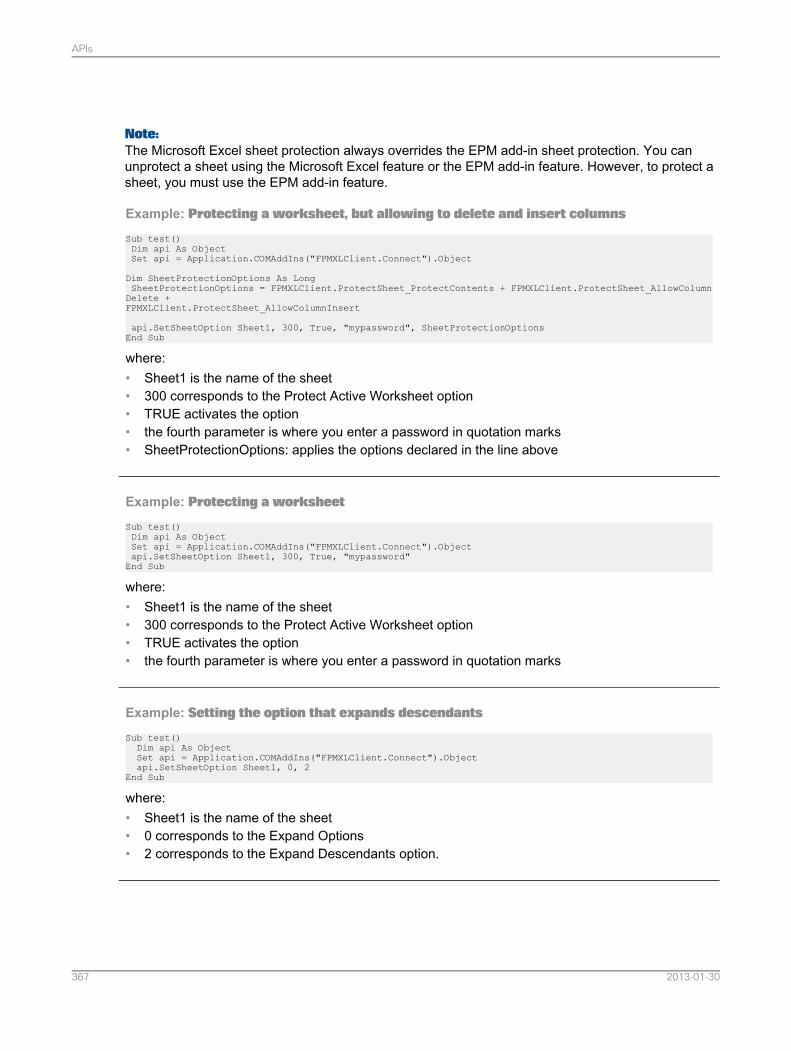
Note:The Microsoft Excel sheet protection always overrides the EPM add-in sheet protection. You canunprotect a sheet using the Microsoft Excel feature or the EPM add-in feature. However, to protect asheet, you must use the EPM add-in feature.
Example: Protecting a worksheet, but allowing to delete and insert columns
Sub test()Dim api As ObjectSet api = Application.COMAddIns("FPMXLClient.Connect").Object
Dim SheetProtectionOptions As LongSheetProtectionOptions = FPMXLClient.ProtectSheet_ProtectContents + FPMXLClient.ProtectSheet_AllowColumnDelete +FPMXLClient.ProtectSheet_AllowColumnInsert
api.SetSheetOption Sheet1, 300, True, "mypassword", SheetProtectionOptionsEnd Sub
where:• Sheet1 is the name of the sheet• 300 corresponds to the Protect Active Worksheet option• TRUE activates the option• the fourth parameter is where you enter a password in quotation marks• SheetProtectionOptions: applies the options declared in the line above
Example: Protecting a worksheet
Sub test()Dim api As ObjectSet api = Application.COMAddIns("FPMXLClient.Connect").Objectapi.SetSheetOption Sheet1, 300, True, "mypassword"End Sub
where:• Sheet1 is the name of the sheet• 300 corresponds to the Protect Active Worksheet option• TRUE activates the option• the fourth parameter is where you enter a password in quotation marks
Example: Setting the option that expands descendants
Sub test()Dim api As ObjectSet api = Application.COMAddIns("FPMXLClient.Connect").Objectapi.SetSheetOption Sheet1, 0, 2
End Sub
where:• Sheet1 is the name of the sheet• 0 corresponds to the Expand Options• 2 corresponds to the Expand Descendants option.
2013-01-30367
APIs
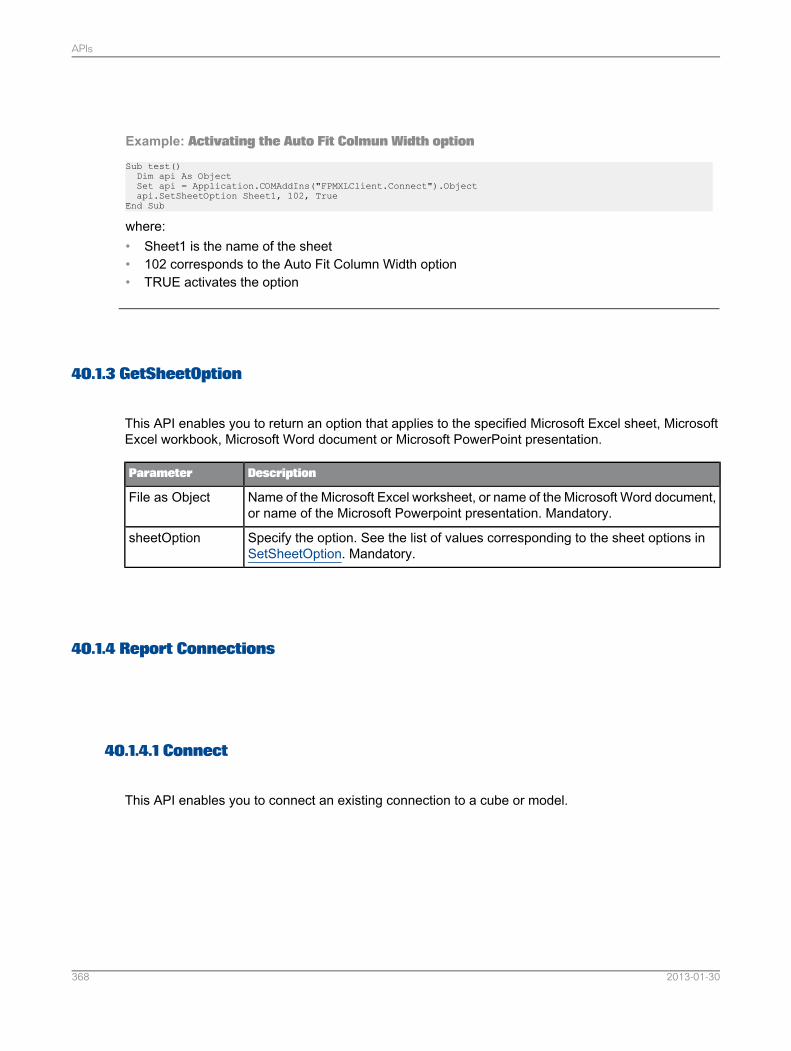
Example: Activating the Auto Fit Colmun Width option
Sub test()Dim api As ObjectSet api = Application.COMAddIns("FPMXLClient.Connect").Objectapi.SetSheetOption Sheet1, 102, True
End Sub
where:• Sheet1 is the name of the sheet• 102 corresponds to the Auto Fit Column Width option• TRUE activates the option
40.1.3 GetSheetOption
This API enables you to return an option that applies to the specified Microsoft Excel sheet, MicrosoftExcel workbook, Microsoft Word document or Microsoft PowerPoint presentation.
DescriptionParameter
Name of the Microsoft Excel worksheet, or name of the Microsoft Word document,or name of the Microsoft Powerpoint presentation. Mandatory.
File as Object
Specify the option. See the list of values corresponding to the sheet options inSetSheetOption. Mandatory.
sheetOption
40.1.4 Report Connections
40.1.4.1 Connect
This API enables you to connect an existing connection to a cube or model.
2013-01-30368
APIs
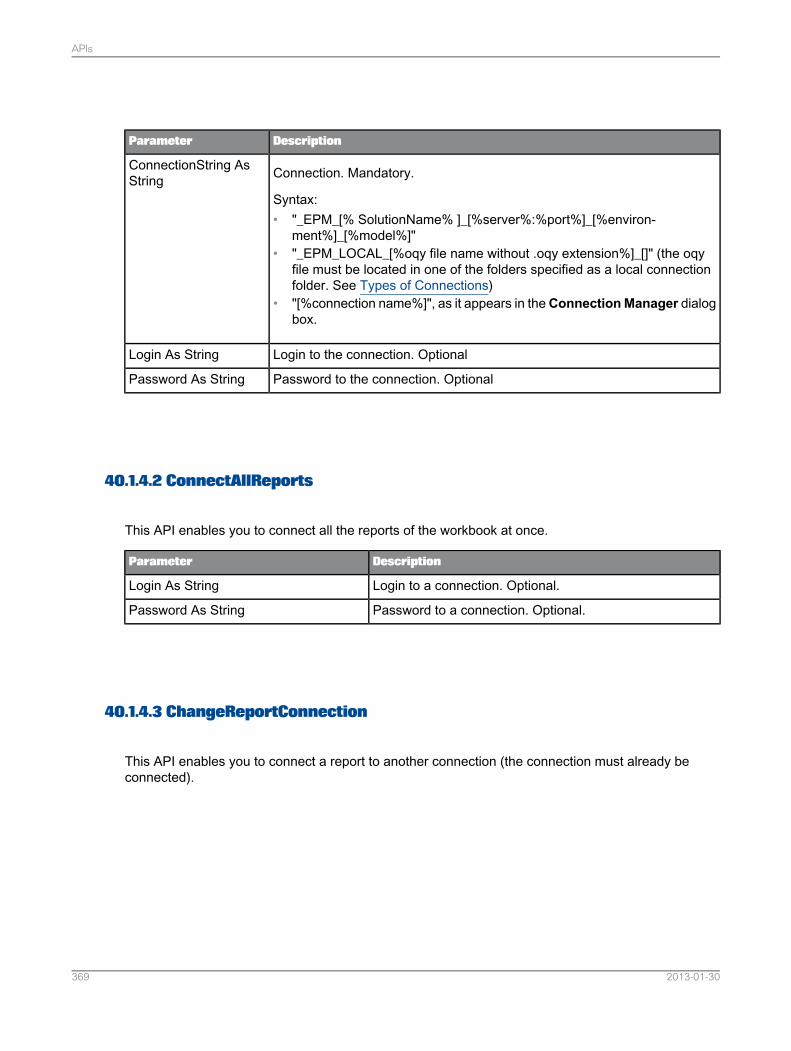
DescriptionParameter
Connection. Mandatory.
Syntax:• "_EPM_[% SolutionName% ]_[%server%:%port%]_[%environ-
ment%]_[%model%]"• "_EPM_LOCAL_[%oqy file name without .oqy extension%]_[]" (the oqy
file must be located in one of the folders specified as a local connectionfolder. See Types of Connections)
• "[%connection name%]", as it appears in theConnectionManager dialogbox.
ConnectionString AsString
Login to the connection. OptionalLogin As String
Password to the connection. OptionalPassword As String
40.1.4.2 ConnectAllReports
This API enables you to connect all the reports of the workbook at once.
DescriptionParameter
Login to a connection. Optional.Login As String
Password to a connection. Optional.Password As String
40.1.4.3 ChangeReportConnection
This API enables you to connect a report to another connection (the connection must already beconnected).
2013-01-30369
APIs
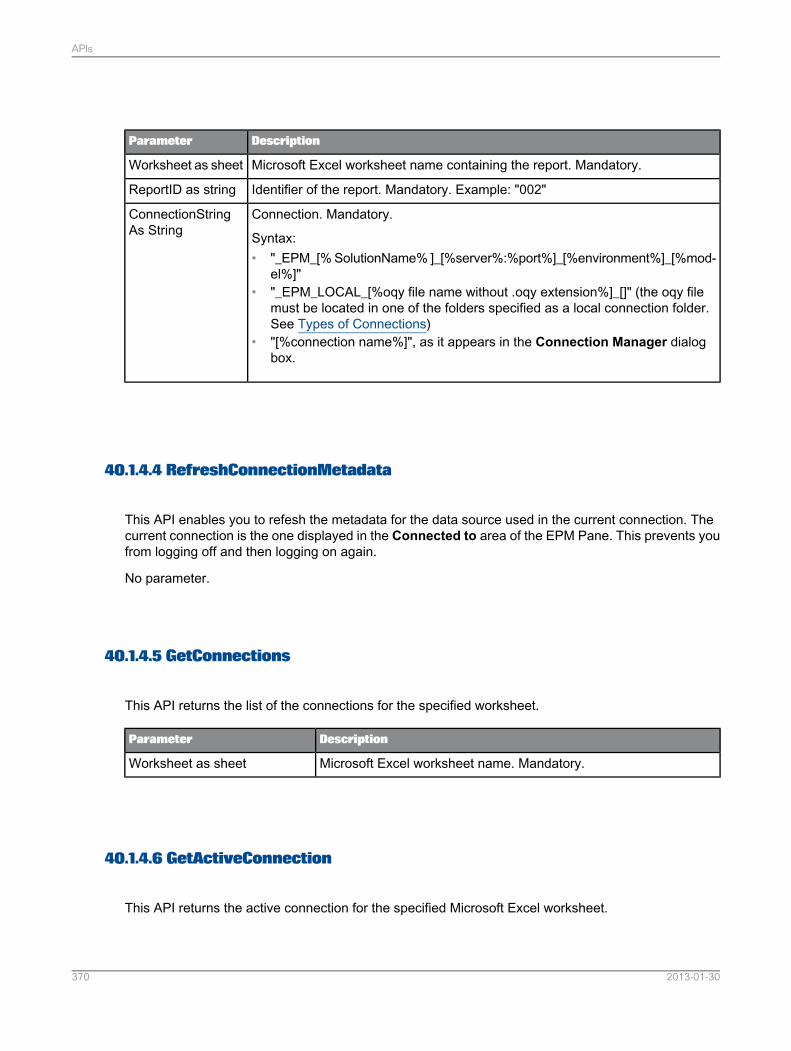
DescriptionParameter
Microsoft Excel worksheet name containing the report. Mandatory.Worksheet as sheet
Identifier of the report. Mandatory. Example: "002"ReportID as string
Connection. Mandatory.
Syntax:• "_EPM_[% SolutionName% ]_[%server%:%port%]_[%environment%]_[%mod-
el%]"• "_EPM_LOCAL_[%oqy file name without .oqy extension%]_[]" (the oqy file
must be located in one of the folders specified as a local connection folder.See Types of Connections)
• "[%connection name%]", as it appears in the Connection Manager dialogbox.
ConnectionStringAs String
40.1.4.4 RefreshConnectionMetadata
This API enables you to refesh the metadata for the data source used in the current connection. Thecurrent connection is the one displayed in the Connected to area of the EPM Pane. This prevents youfrom logging off and then logging on again.
No parameter.
40.1.4.5 GetConnections
This API returns the list of the connections for the specified worksheet.
DescriptionParameter
Microsoft Excel worksheet name. Mandatory.Worksheet as sheet
40.1.4.6 GetActiveConnection
This API returns the active connection for the specified Microsoft Excel worksheet.
2013-01-30370
APIs
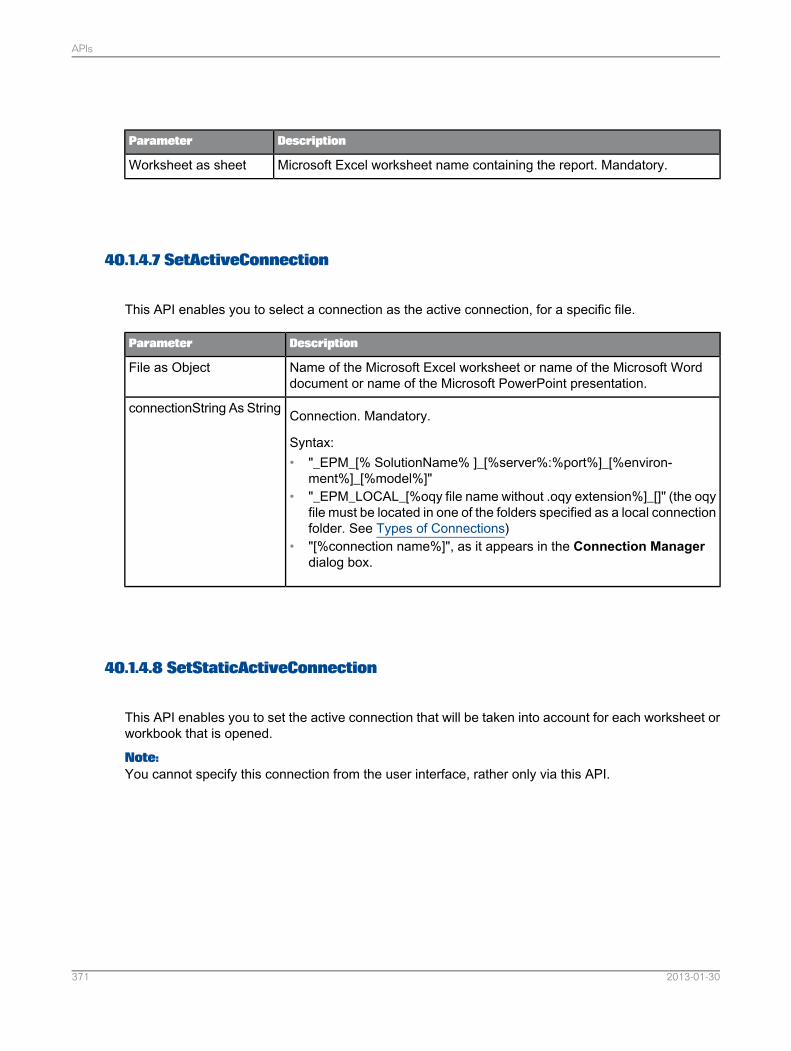
DescriptionParameter
Microsoft Excel worksheet name containing the report. Mandatory.Worksheet as sheet
40.1.4.7 SetActiveConnection
This API enables you to select a connection as the active connection, for a specific file.
DescriptionParameter
Name of the Microsoft Excel worksheet or name of the Microsoft Worddocument or name of the Microsoft PowerPoint presentation.
File as Object
Connection. Mandatory.
Syntax:• "_EPM_[% SolutionName% ]_[%server%:%port%]_[%environ-
ment%]_[%model%]"• "_EPM_LOCAL_[%oqy file name without .oqy extension%]_[]" (the oqy
file must be located in one of the folders specified as a local connectionfolder. See Types of Connections)
• "[%connection name%]", as it appears in the Connection Managerdialog box.
connectionString As String
40.1.4.8 SetStaticActiveConnection
This API enables you to set the active connection that will be taken into account for each worksheet orworkbook that is opened.
Note:You cannot specify this connection from the user interface, rather only via this API.
2013-01-30371
APIs
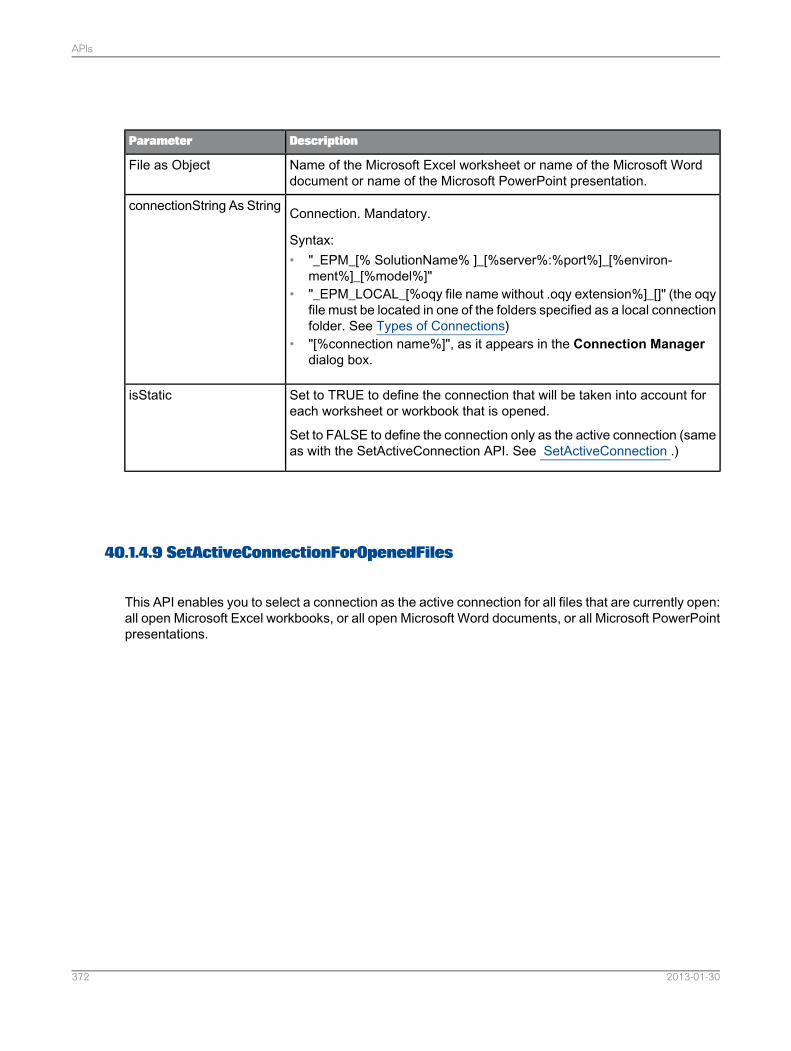
DescriptionParameter
Name of the Microsoft Excel worksheet or name of the Microsoft Worddocument or name of the Microsoft PowerPoint presentation.
File as Object
Connection. Mandatory.
Syntax:• "_EPM_[% SolutionName% ]_[%server%:%port%]_[%environ-
ment%]_[%model%]"• "_EPM_LOCAL_[%oqy file name without .oqy extension%]_[]" (the oqy
file must be located in one of the folders specified as a local connectionfolder. See Types of Connections)
• "[%connection name%]", as it appears in the Connection Managerdialog box.
connectionString As String
Set to TRUE to define the connection that will be taken into account foreach worksheet or workbook that is opened.
Set to FALSE to define the connection only as the active connection (sameas with the SetActiveConnection API. See SetActiveConnection .)
isStatic
40.1.4.9 SetActiveConnectionForOpenedFiles
This API enables you to select a connection as the active connection for all files that are currently open:all open Microsoft Excel workbooks, or all open Microsoft Word documents, or all Microsoft PowerPointpresentations.
2013-01-30372
APIs
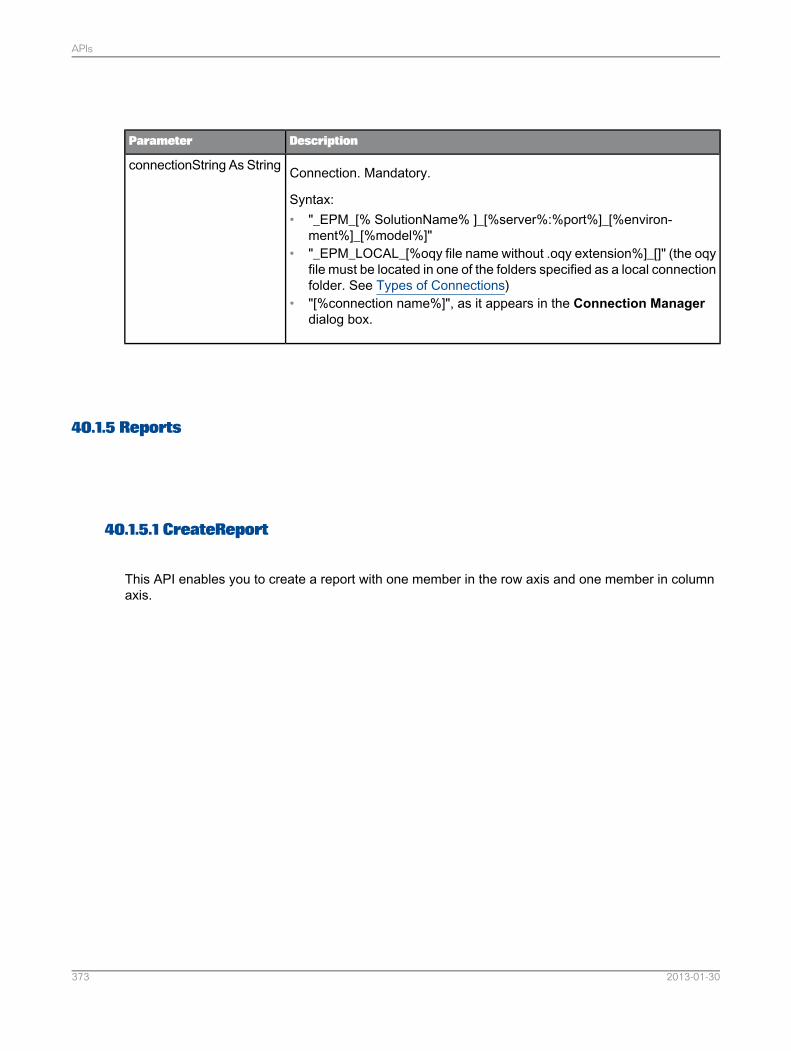
DescriptionParameter
Connection. Mandatory.
Syntax:• "_EPM_[% SolutionName% ]_[%server%:%port%]_[%environ-
ment%]_[%model%]"• "_EPM_LOCAL_[%oqy file name without .oqy extension%]_[]" (the oqy
file must be located in one of the folders specified as a local connectionfolder. See Types of Connections)
• "[%connection name%]", as it appears in the Connection Managerdialog box.
connectionString As String
40.1.5 Reports
40.1.5.1 CreateReport
This API enables you to create a report with one member in the row axis and one member in columnaxis.
2013-01-30373
APIs
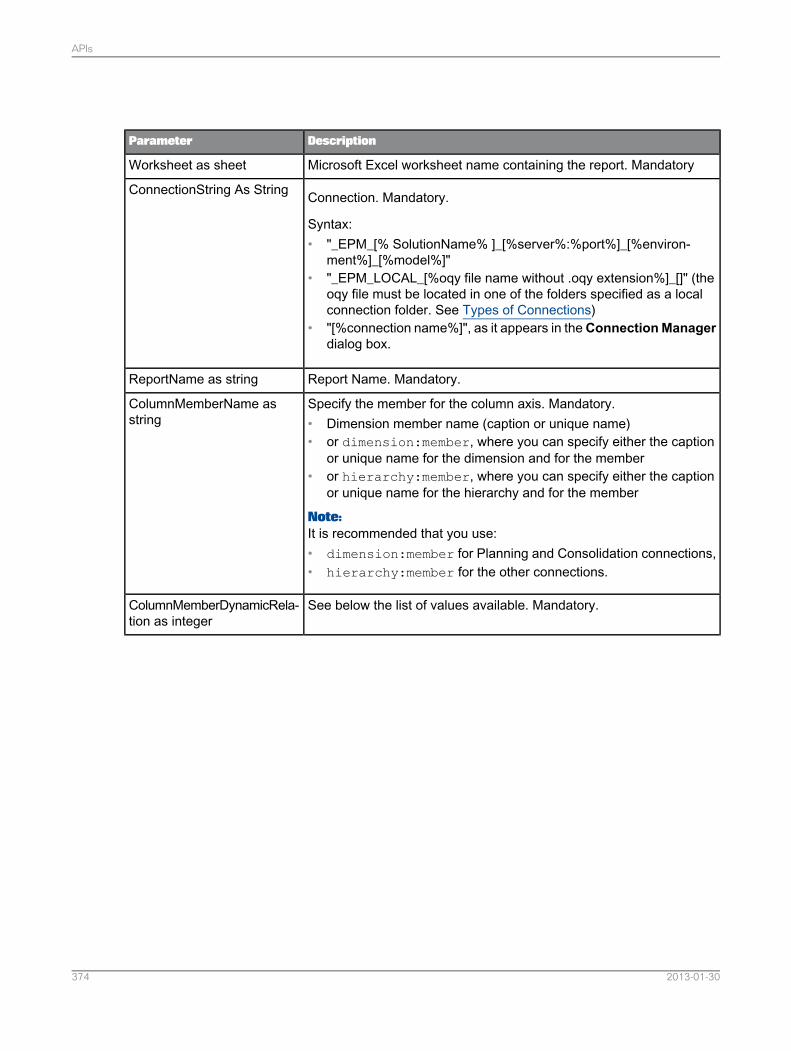
DescriptionParameter
Microsoft Excel worksheet name containing the report. MandatoryWorksheet as sheet
Connection. Mandatory.
Syntax:• "_EPM_[% SolutionName% ]_[%server%:%port%]_[%environ-
ment%]_[%model%]"• "_EPM_LOCAL_[%oqy file name without .oqy extension%]_[]" (the
oqy file must be located in one of the folders specified as a localconnection folder. See Types of Connections)
• "[%connection name%]", as it appears in theConnectionManagerdialog box.
ConnectionString As String
Report Name. Mandatory.ReportName as string
Specify the member for the column axis. Mandatory.• Dimension member name (caption or unique name)• or dimension:member, where you can specify either the caption
or unique name for the dimension and for the member• or hierarchy:member, where you can specify either the caption
or unique name for the hierarchy and for the member
Note:It is recommended that you use:• dimension:member for Planning and Consolidation connections,• hierarchy:member for the other connections.
ColumnMemberName asstring
See below the list of values available. Mandatory.ColumnMemberDynamicRela-tion as integer
2013-01-30374
APIs
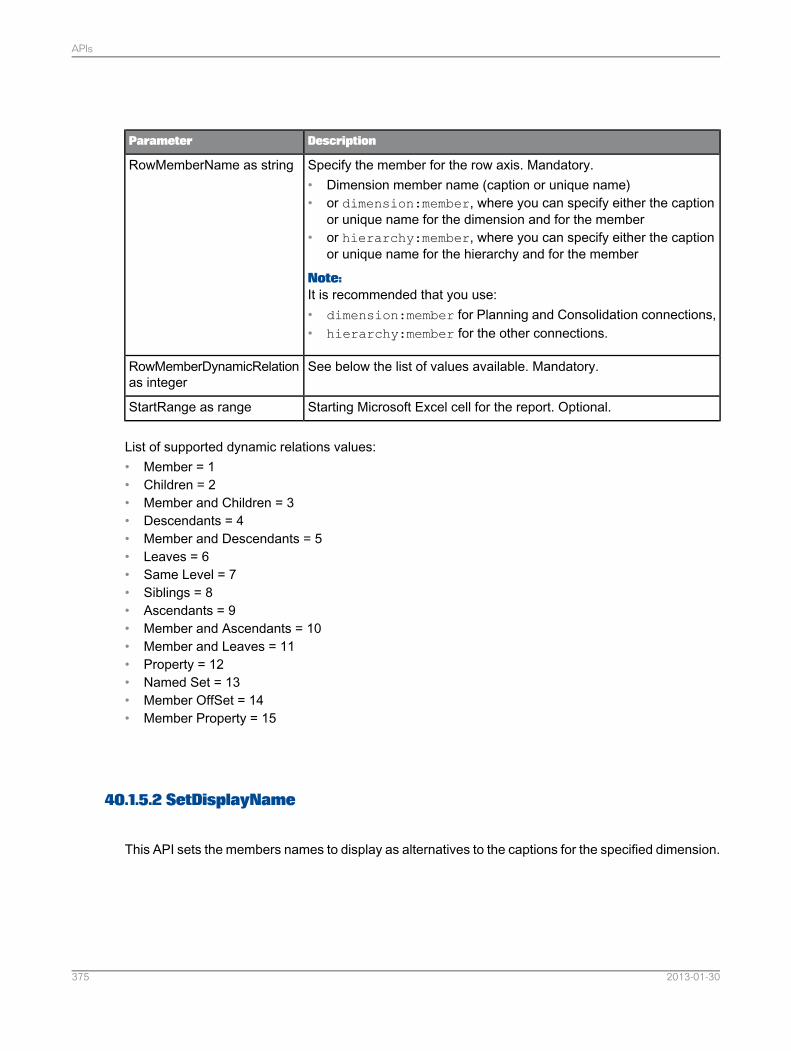
DescriptionParameter
Specify the member for the row axis. Mandatory.• Dimension member name (caption or unique name)• or dimension:member, where you can specify either the caption
or unique name for the dimension and for the member• or hierarchy:member, where you can specify either the caption
or unique name for the hierarchy and for the member
Note:It is recommended that you use:• dimension:member for Planning and Consolidation connections,• hierarchy:member for the other connections.
RowMemberName as string
See below the list of values available. Mandatory.RowMemberDynamicRelationas integer
Starting Microsoft Excel cell for the report. Optional.StartRange as range
List of supported dynamic relations values:• Member = 1• Children = 2• Member and Children = 3• Descendants = 4• Member and Descendants = 5• Leaves = 6• Same Level = 7• Siblings = 8• Ascendants = 9• Member and Ascendants = 10• Member and Leaves = 11• Property = 12• Named Set = 13• Member OffSet = 14• Member Property = 15
40.1.5.2 SetDisplayName
This API sets the members names to display as alternatives to the captions for the specified dimension.
2013-01-30375
APIs
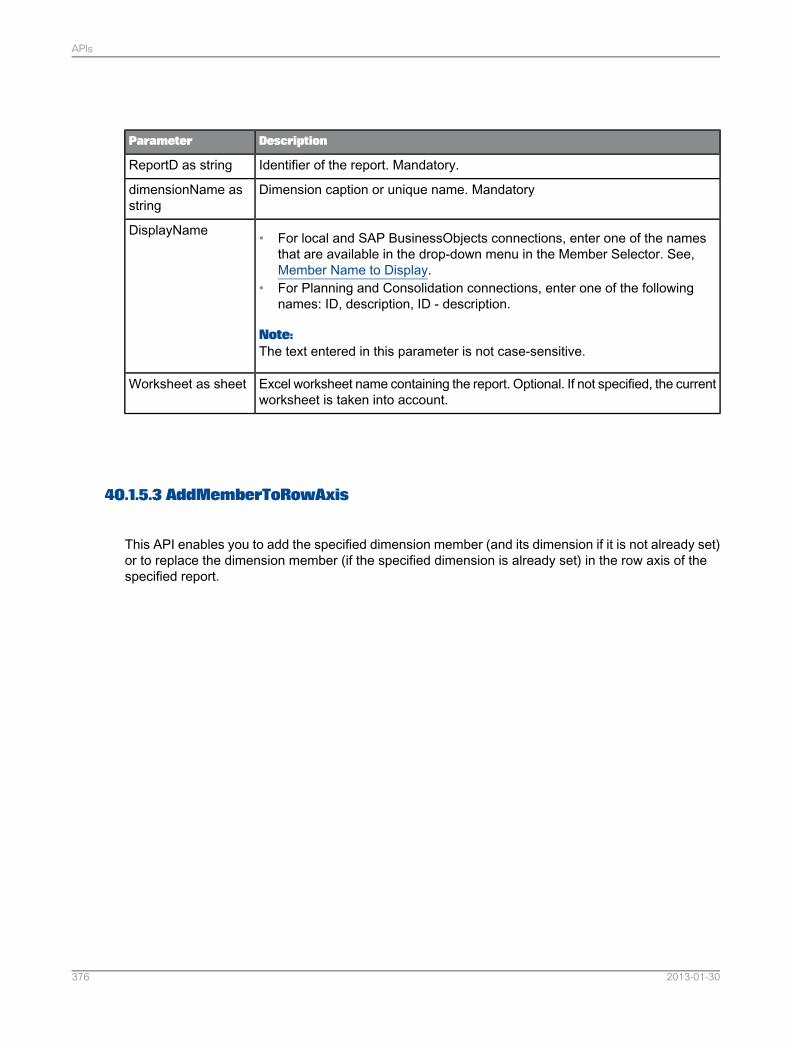
DescriptionParameter
Identifier of the report. Mandatory.ReportD as string
Dimension caption or unique name. MandatorydimensionName asstring
• For local and SAP BusinessObjects connections, enter one of the namesthat are available in the drop-down menu in the Member Selector. See,Member Name to Display.
• For Planning and Consolidation connections, enter one of the followingnames: ID, description, ID - description.
Note:The text entered in this parameter is not case-sensitive.
DisplayName
Excel worksheet name containing the report. Optional. If not specified, the currentworksheet is taken into account.
Worksheet as sheet
40.1.5.3 AddMemberToRowAxis
This API enables you to add the specified dimension member (and its dimension if it is not already set)or to replace the dimension member (if the specified dimension is already set) in the row axis of thespecified report.
2013-01-30376
APIs
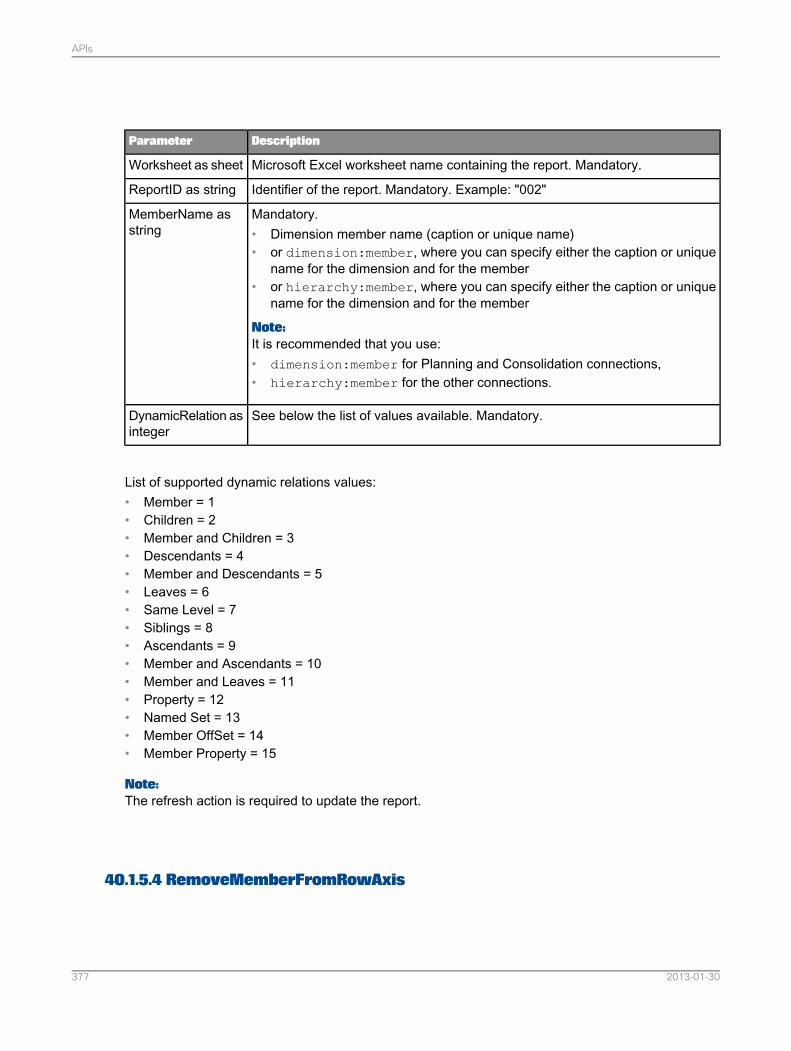
DescriptionParameter
Microsoft Excel worksheet name containing the report. Mandatory.Worksheet as sheet
Identifier of the report. Mandatory. Example: "002"ReportID as string
Mandatory.• Dimension member name (caption or unique name)• or dimension:member, where you can specify either the caption or unique
name for the dimension and for the member• or hierarchy:member, where you can specify either the caption or unique
name for the dimension and for the member
Note:It is recommended that you use:• dimension:member for Planning and Consolidation connections,• hierarchy:member for the other connections.
MemberName asstring
See below the list of values available. Mandatory.DynamicRelation asinteger
List of supported dynamic relations values:• Member = 1• Children = 2• Member and Children = 3• Descendants = 4• Member and Descendants = 5• Leaves = 6• Same Level = 7• Siblings = 8• Ascendants = 9• Member and Ascendants = 10• Member and Leaves = 11• Property = 12• Named Set = 13• Member OffSet = 14• Member Property = 15
Note:The refresh action is required to update the report.
40.1.5.4 RemoveMemberFromRowAxis
2013-01-30377
APIs
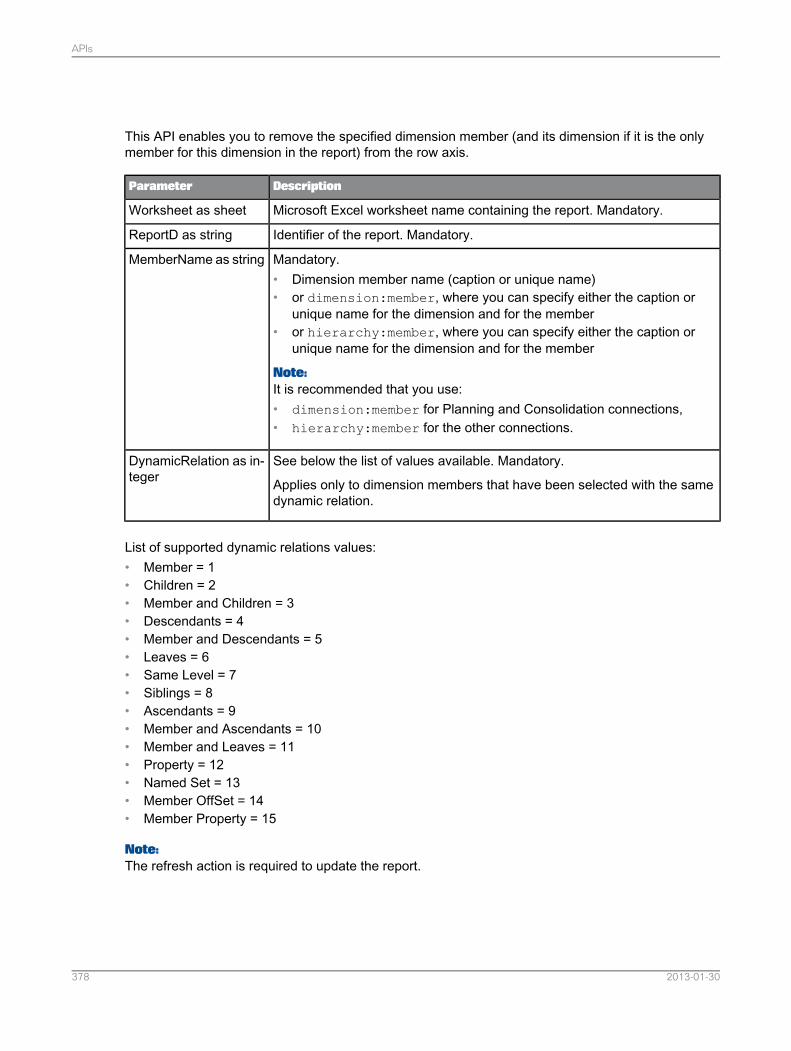
This API enables you to remove the specified dimension member (and its dimension if it is the onlymember for this dimension in the report) from the row axis.
DescriptionParameter
Microsoft Excel worksheet name containing the report. Mandatory.Worksheet as sheet
Identifier of the report. Mandatory.ReportD as string
Mandatory.• Dimension member name (caption or unique name)• or dimension:member, where you can specify either the caption or
unique name for the dimension and for the member• or hierarchy:member, where you can specify either the caption or
unique name for the dimension and for the member
Note:It is recommended that you use:• dimension:member for Planning and Consolidation connections,• hierarchy:member for the other connections.
MemberName as string
See below the list of values available. Mandatory.
Applies only to dimension members that have been selected with the samedynamic relation.
DynamicRelation as in-teger
List of supported dynamic relations values:• Member = 1• Children = 2• Member and Children = 3• Descendants = 4• Member and Descendants = 5• Leaves = 6• Same Level = 7• Siblings = 8• Ascendants = 9• Member and Ascendants = 10• Member and Leaves = 11• Property = 12• Named Set = 13• Member OffSet = 14• Member Property = 15
Note:The refresh action is required to update the report.
2013-01-30378
APIs
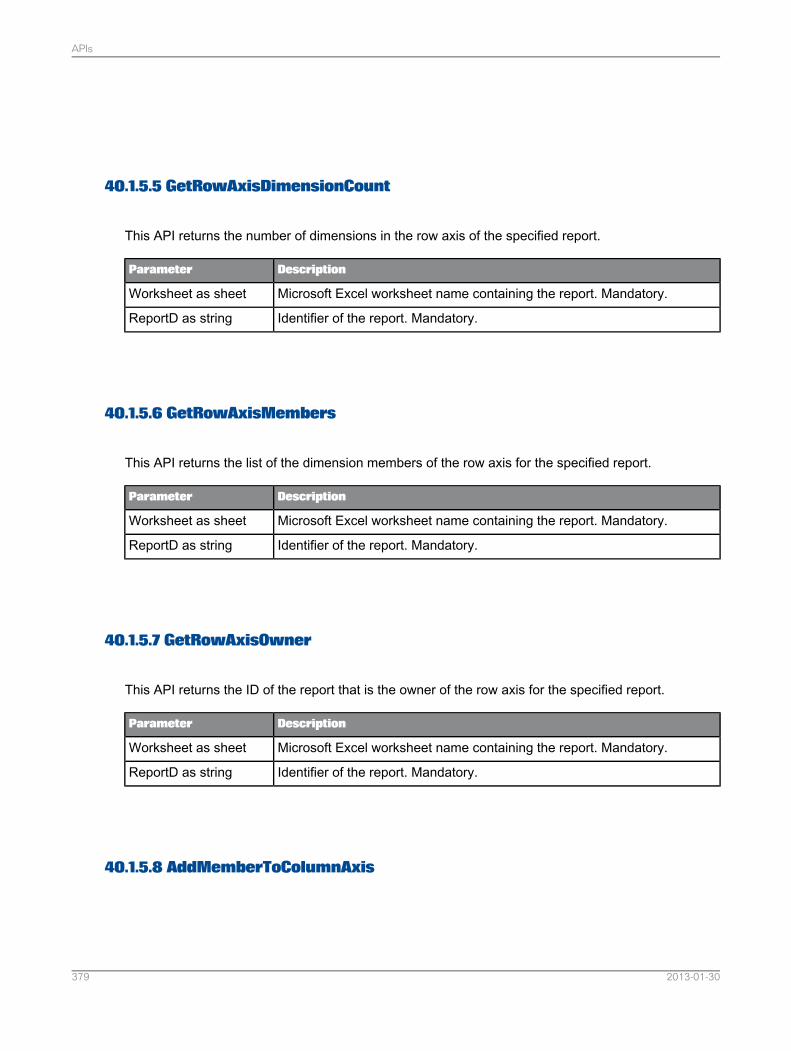
40.1.5.5 GetRowAxisDimensionCount
This API returns the number of dimensions in the row axis of the specified report.
DescriptionParameter
Microsoft Excel worksheet name containing the report. Mandatory.Worksheet as sheet
Identifier of the report. Mandatory.ReportD as string
40.1.5.6 GetRowAxisMembers
This API returns the list of the dimension members of the row axis for the specified report.
DescriptionParameter
Microsoft Excel worksheet name containing the report. Mandatory.Worksheet as sheet
Identifier of the report. Mandatory.ReportD as string
40.1.5.7 GetRowAxisOwner
This API returns the ID of the report that is the owner of the row axis for the specified report.
DescriptionParameter
Microsoft Excel worksheet name containing the report. Mandatory.Worksheet as sheet
Identifier of the report. Mandatory.ReportD as string
40.1.5.8 AddMemberToColumnAxis
2013-01-30379
APIs
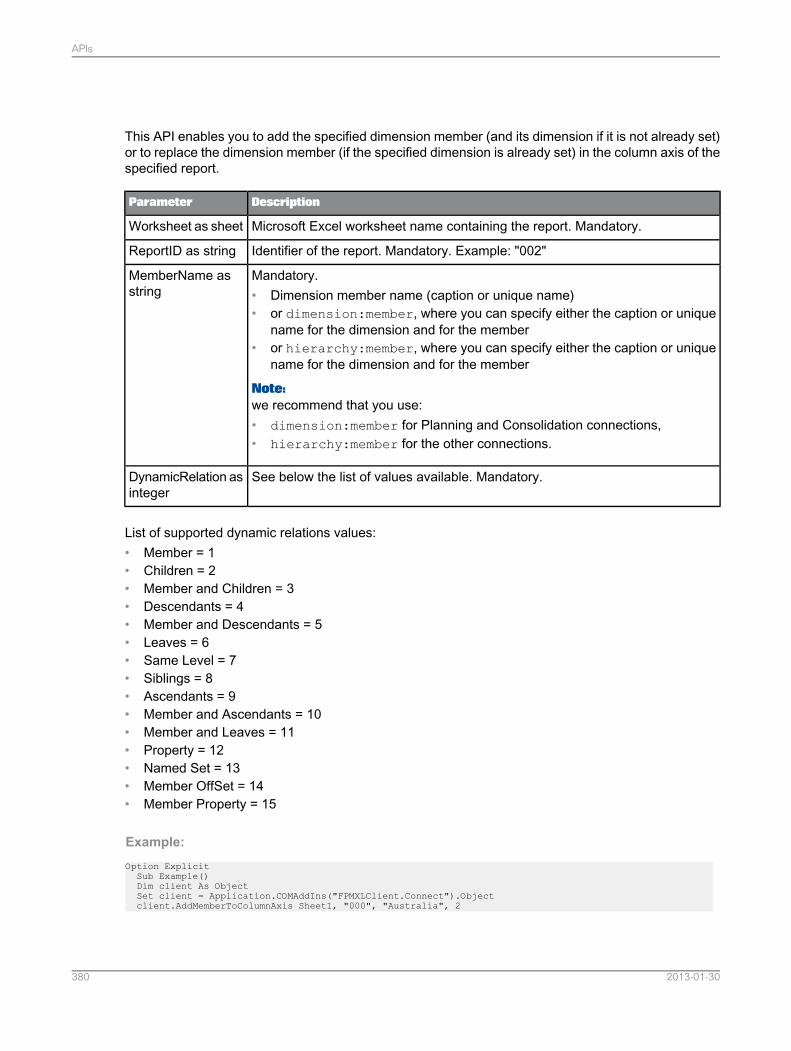
This API enables you to add the specified dimension member (and its dimension if it is not already set)or to replace the dimension member (if the specified dimension is already set) in the column axis of thespecified report.
DescriptionParameter
Microsoft Excel worksheet name containing the report. Mandatory.Worksheet as sheet
Identifier of the report. Mandatory. Example: "002"ReportID as string
Mandatory.• Dimension member name (caption or unique name)• or dimension:member, where you can specify either the caption or unique
name for the dimension and for the member• or hierarchy:member, where you can specify either the caption or unique
name for the dimension and for the member
Note:we recommend that you use:• dimension:member for Planning and Consolidation connections,• hierarchy:member for the other connections.
MemberName asstring
See below the list of values available. Mandatory.DynamicRelation asinteger
List of supported dynamic relations values:• Member = 1• Children = 2• Member and Children = 3• Descendants = 4• Member and Descendants = 5• Leaves = 6• Same Level = 7• Siblings = 8• Ascendants = 9• Member and Ascendants = 10• Member and Leaves = 11• Property = 12• Named Set = 13• Member OffSet = 14• Member Property = 15
Example:Option ExplicitSub Example()Dim client As ObjectSet client = Application.COMAddIns("FPMXLClient.Connect").Objectclient.AddMemberToColumnAxis Sheet1, "000", "Australia", 2
2013-01-30380
APIs
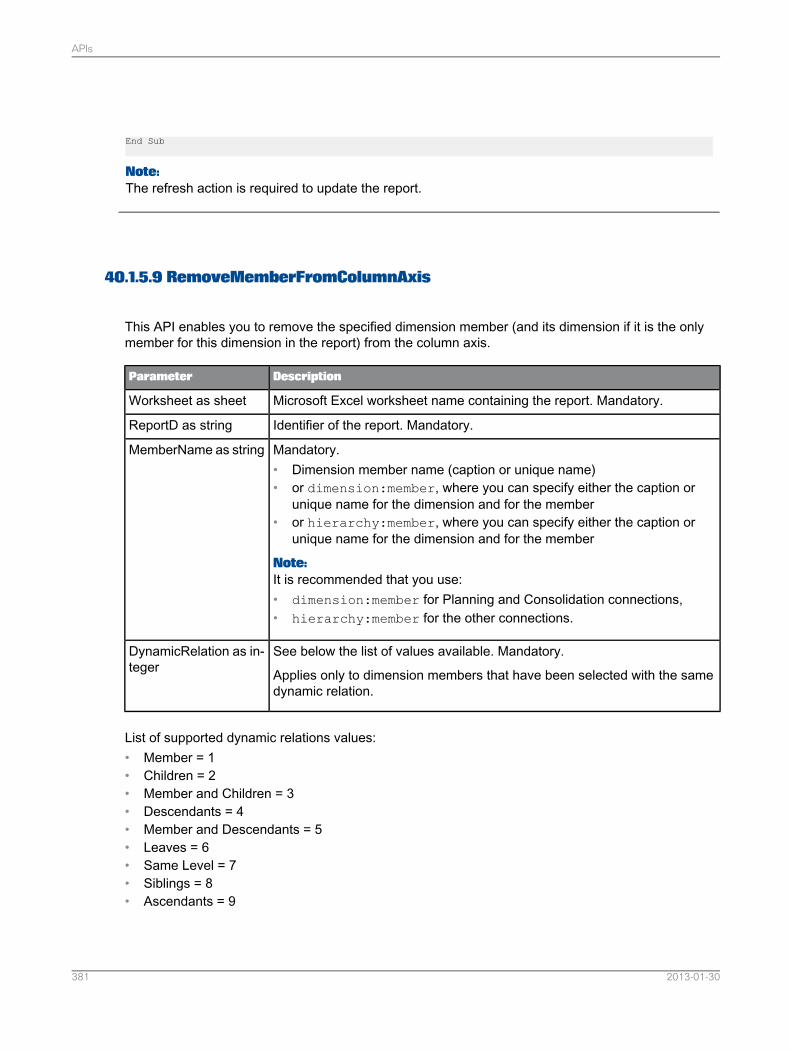
End Sub
Note:The refresh action is required to update the report.
40.1.5.9 RemoveMemberFromColumnAxis
This API enables you to remove the specified dimension member (and its dimension if it is the onlymember for this dimension in the report) from the column axis.
DescriptionParameter
Microsoft Excel worksheet name containing the report. Mandatory.Worksheet as sheet
Identifier of the report. Mandatory.ReportD as string
Mandatory.• Dimension member name (caption or unique name)• or dimension:member, where you can specify either the caption or
unique name for the dimension and for the member• or hierarchy:member, where you can specify either the caption or
unique name for the dimension and for the member
Note:It is recommended that you use:• dimension:member for Planning and Consolidation connections,• hierarchy:member for the other connections.
MemberName as string
See below the list of values available. Mandatory.
Applies only to dimension members that have been selected with the samedynamic relation.
DynamicRelation as in-teger
List of supported dynamic relations values:• Member = 1• Children = 2• Member and Children = 3• Descendants = 4• Member and Descendants = 5• Leaves = 6• Same Level = 7• Siblings = 8• Ascendants = 9
2013-01-30381
APIs
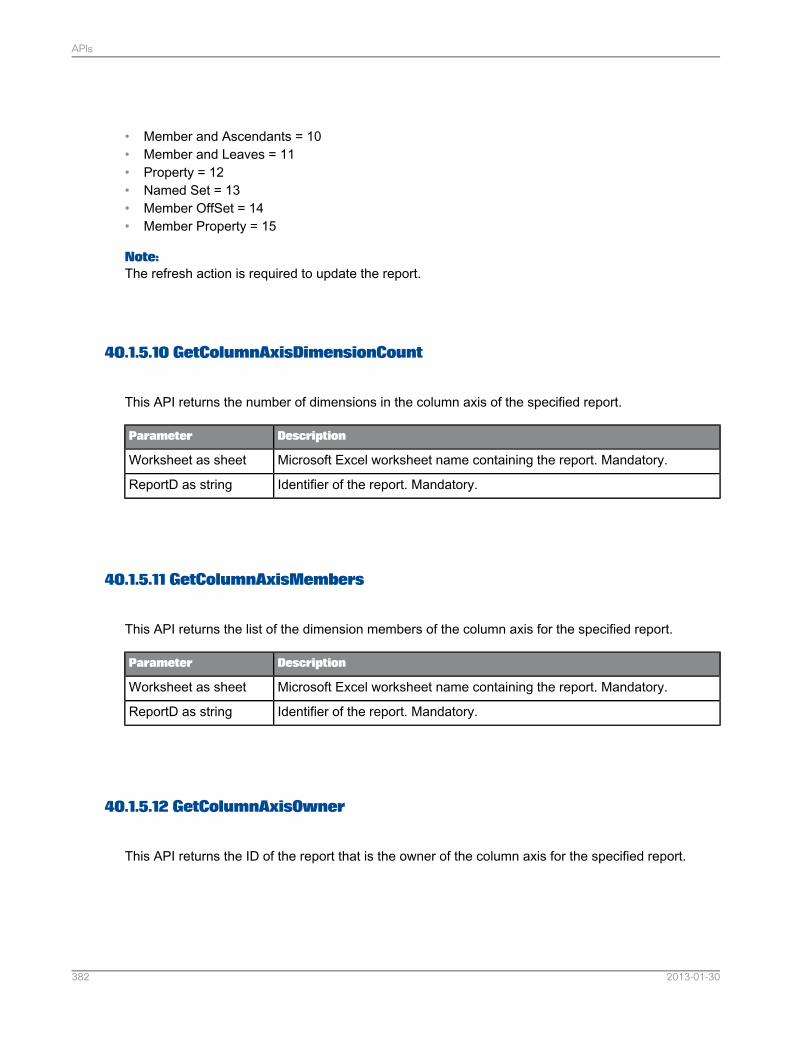
• Member and Ascendants = 10• Member and Leaves = 11• Property = 12• Named Set = 13• Member OffSet = 14• Member Property = 15
Note:The refresh action is required to update the report.
40.1.5.10 GetColumnAxisDimensionCount
This API returns the number of dimensions in the column axis of the specified report.
DescriptionParameter
Microsoft Excel worksheet name containing the report. Mandatory.Worksheet as sheet
Identifier of the report. Mandatory.ReportD as string
40.1.5.11 GetColumnAxisMembers
This API returns the list of the dimension members of the column axis for the specified report.
DescriptionParameter
Microsoft Excel worksheet name containing the report. Mandatory.Worksheet as sheet
Identifier of the report. Mandatory.ReportD as string
40.1.5.12 GetColumnAxisOwner
This API returns the ID of the report that is the owner of the column axis for the specified report.
2013-01-30382
APIs
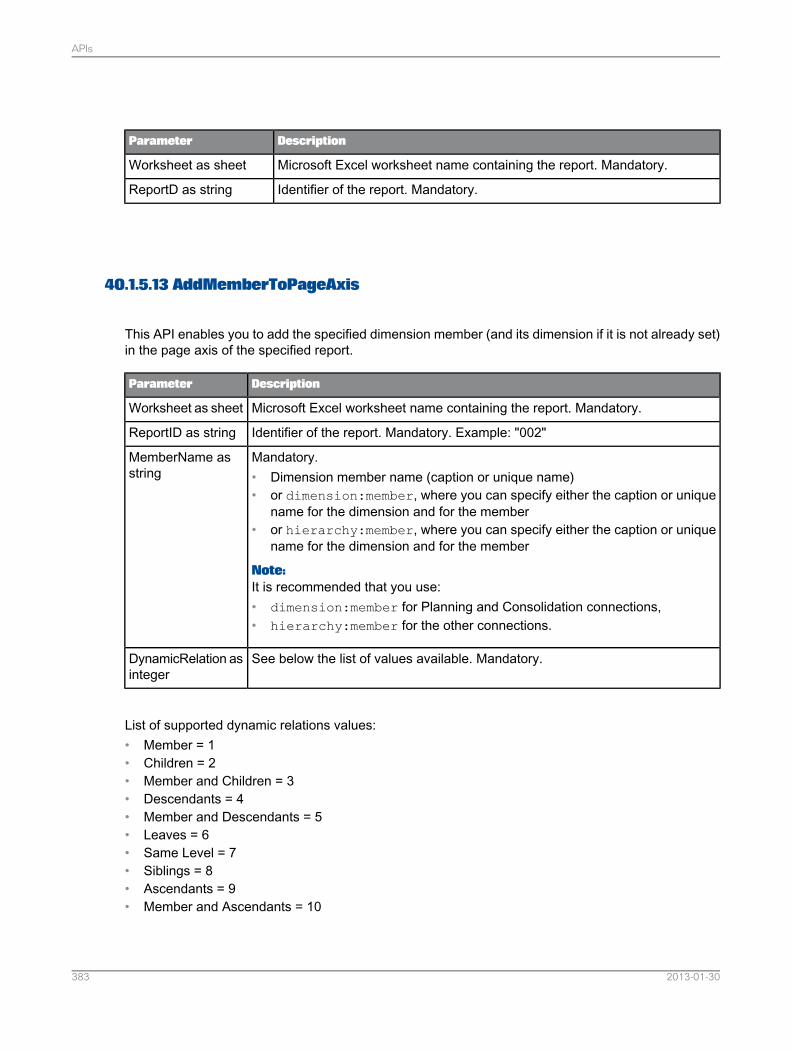
DescriptionParameter
Microsoft Excel worksheet name containing the report. Mandatory.Worksheet as sheet
Identifier of the report. Mandatory.ReportD as string
40.1.5.13 AddMemberToPageAxis
This API enables you to add the specified dimension member (and its dimension if it is not already set)in the page axis of the specified report.
DescriptionParameter
Microsoft Excel worksheet name containing the report. Mandatory.Worksheet as sheet
Identifier of the report. Mandatory. Example: "002"ReportID as string
Mandatory.• Dimension member name (caption or unique name)• or dimension:member, where you can specify either the caption or unique
name for the dimension and for the member• or hierarchy:member, where you can specify either the caption or unique
name for the dimension and for the member
Note:It is recommended that you use:• dimension:member for Planning and Consolidation connections,• hierarchy:member for the other connections.
MemberName asstring
See below the list of values available. Mandatory.DynamicRelation asinteger
List of supported dynamic relations values:• Member = 1• Children = 2• Member and Children = 3• Descendants = 4• Member and Descendants = 5• Leaves = 6• Same Level = 7• Siblings = 8• Ascendants = 9• Member and Ascendants = 10
2013-01-30383
APIs
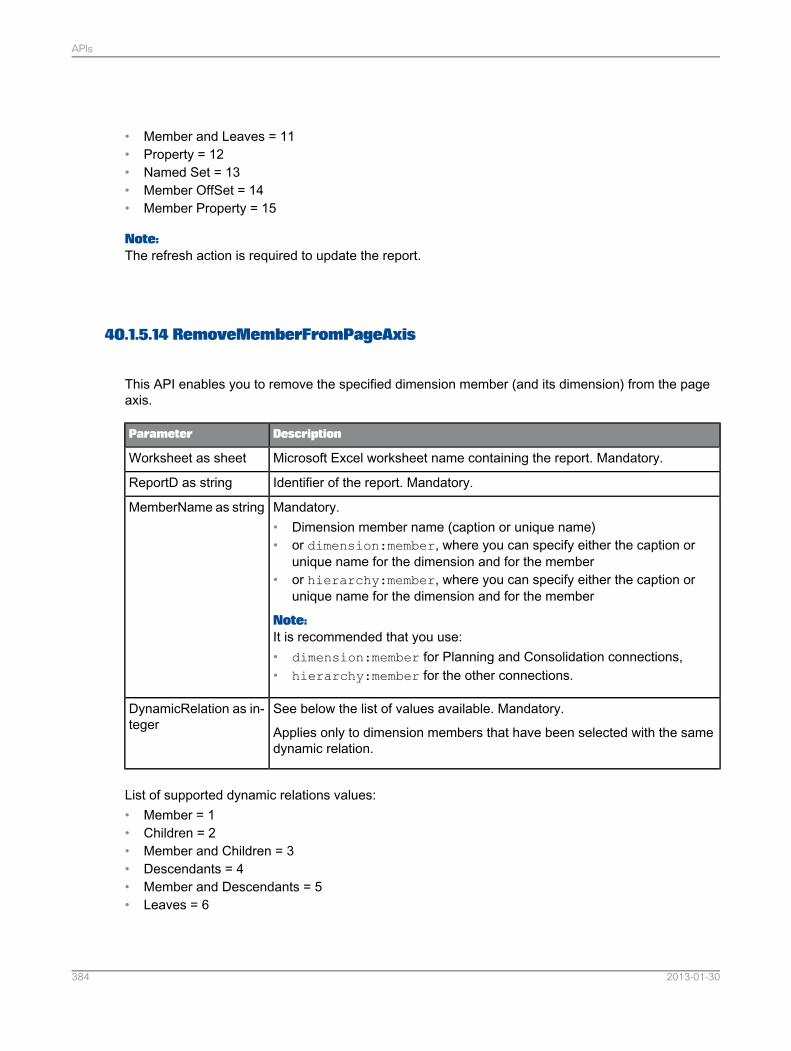
• Member and Leaves = 11• Property = 12• Named Set = 13• Member OffSet = 14• Member Property = 15
Note:The refresh action is required to update the report.
40.1.5.14 RemoveMemberFromPageAxis
This API enables you to remove the specified dimension member (and its dimension) from the pageaxis.
DescriptionParameter
Microsoft Excel worksheet name containing the report. Mandatory.Worksheet as sheet
Identifier of the report. Mandatory.ReportD as string
Mandatory.• Dimension member name (caption or unique name)• or dimension:member, where you can specify either the caption or
unique name for the dimension and for the member• or hierarchy:member, where you can specify either the caption or
unique name for the dimension and for the member
Note:It is recommended that you use:• dimension:member for Planning and Consolidation connections,• hierarchy:member for the other connections.
MemberName as string
See below the list of values available. Mandatory.
Applies only to dimension members that have been selected with the samedynamic relation.
DynamicRelation as in-teger
List of supported dynamic relations values:• Member = 1• Children = 2• Member and Children = 3• Descendants = 4• Member and Descendants = 5• Leaves = 6
2013-01-30384
APIs
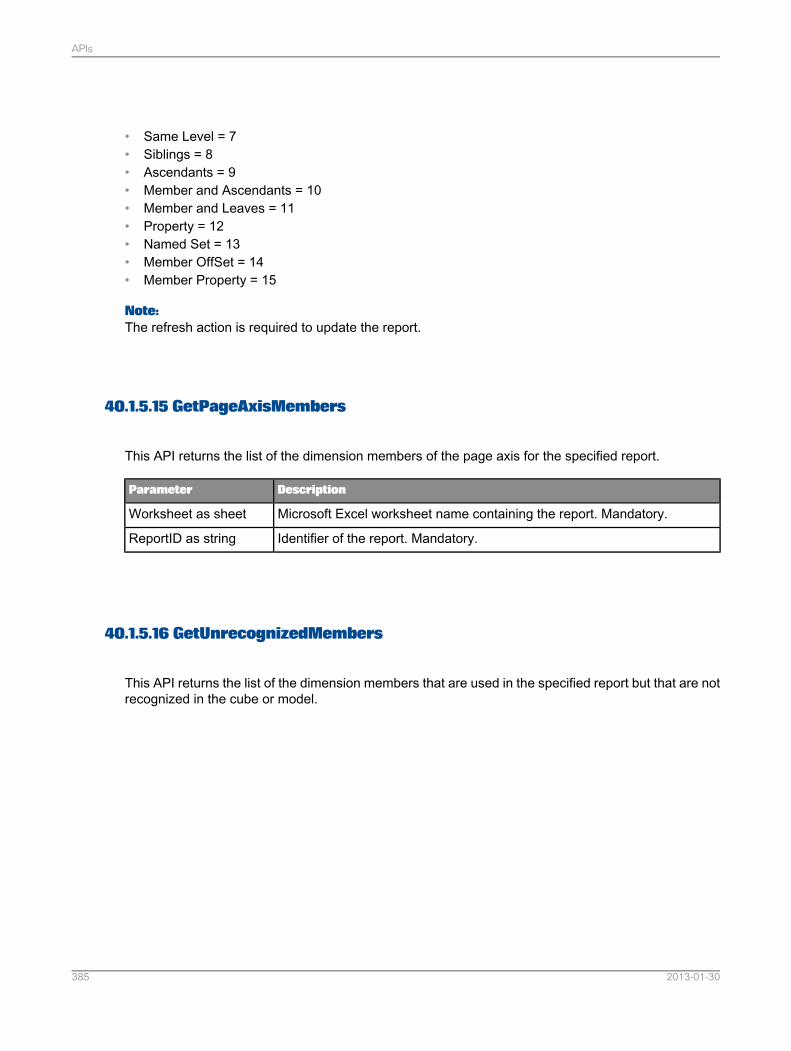
• Same Level = 7• Siblings = 8• Ascendants = 9• Member and Ascendants = 10• Member and Leaves = 11• Property = 12• Named Set = 13• Member OffSet = 14• Member Property = 15
Note:The refresh action is required to update the report.
40.1.5.15 GetPageAxisMembers
This API returns the list of the dimension members of the page axis for the specified report.
DescriptionParameter
Microsoft Excel worksheet name containing the report. Mandatory.Worksheet as sheet
Identifier of the report. Mandatory.ReportID as string
40.1.5.16 GetUnrecognizedMembers
This API returns the list of the dimension members that are used in the specified report but that are notrecognized in the cube or model.
2013-01-30385
APIs
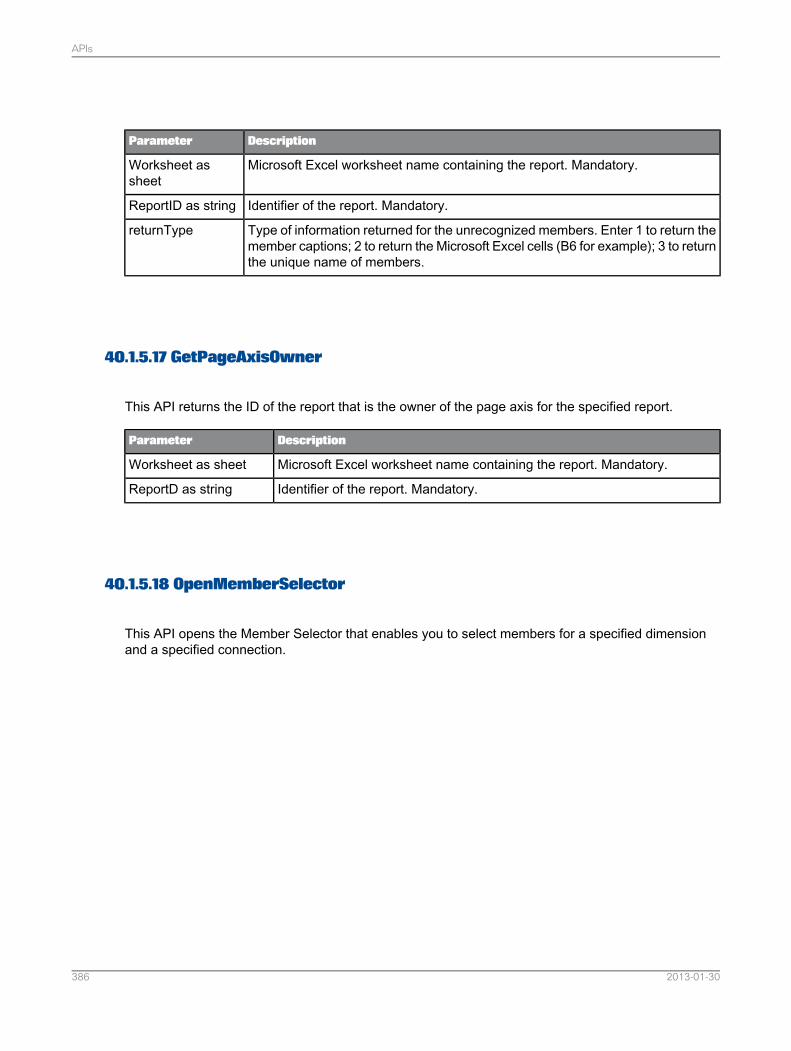
DescriptionParameter
Microsoft Excel worksheet name containing the report. Mandatory.Worksheet assheet
Identifier of the report. Mandatory.ReportID as string
Type of information returned for the unrecognized members. Enter 1 to return themember captions; 2 to return the Microsoft Excel cells (B6 for example); 3 to returnthe unique name of members.
returnType
40.1.5.17 GetPageAxisOwner
This API returns the ID of the report that is the owner of the page axis for the specified report.
DescriptionParameter
Microsoft Excel worksheet name containing the report. Mandatory.Worksheet as sheet
Identifier of the report. Mandatory.ReportD as string
40.1.5.18 OpenMemberSelector
This API opens the Member Selector that enables you to select members for a specified dimensionand a specified connection.
2013-01-30386
APIs
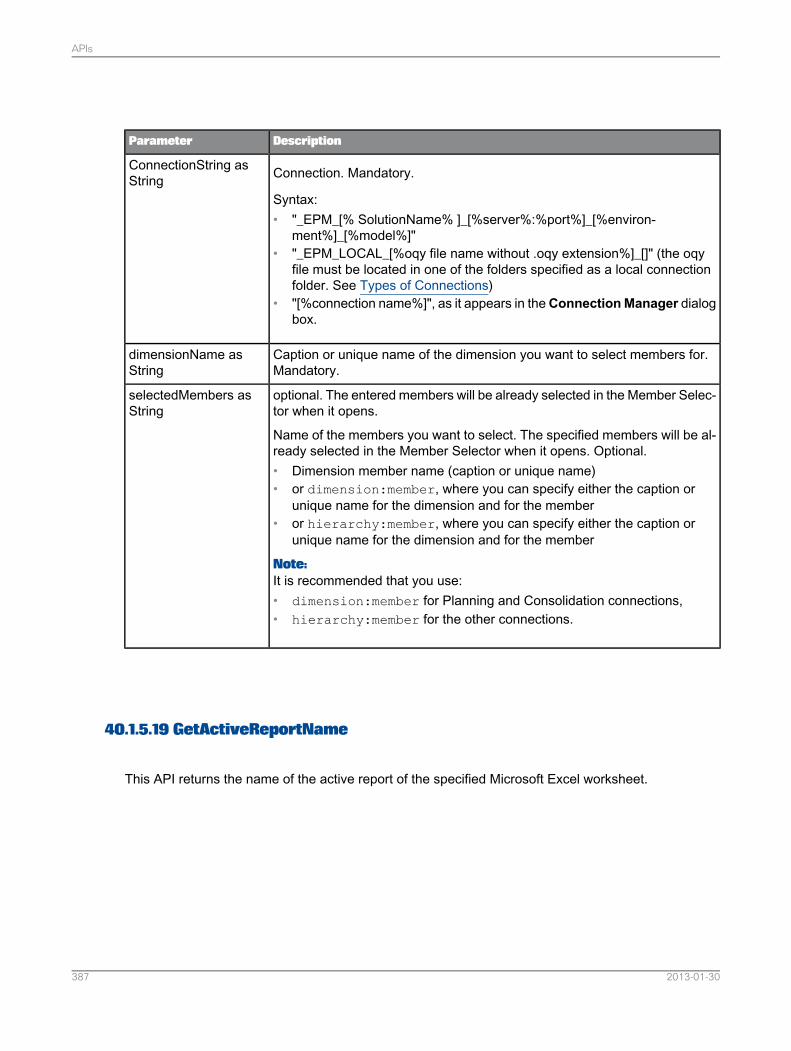
DescriptionParameter
Connection. Mandatory.
Syntax:• "_EPM_[% SolutionName% ]_[%server%:%port%]_[%environ-
ment%]_[%model%]"• "_EPM_LOCAL_[%oqy file name without .oqy extension%]_[]" (the oqy
file must be located in one of the folders specified as a local connectionfolder. See Types of Connections)
• "[%connection name%]", as it appears in theConnectionManager dialogbox.
ConnectionString asString
Caption or unique name of the dimension you want to select members for.Mandatory.
dimensionName asString
optional. The entered members will be already selected in the Member Selec-tor when it opens.
Name of the members you want to select. The specified members will be al-ready selected in the Member Selector when it opens. Optional.• Dimension member name (caption or unique name)• or dimension:member, where you can specify either the caption or
unique name for the dimension and for the member• or hierarchy:member, where you can specify either the caption or
unique name for the dimension and for the member
Note:It is recommended that you use:• dimension:member for Planning and Consolidation connections,• hierarchy:member for the other connections.
selectedMembers asString
40.1.5.19 GetActiveReportName
This API returns the name of the active report of the specified Microsoft Excel worksheet.
2013-01-30387
APIs
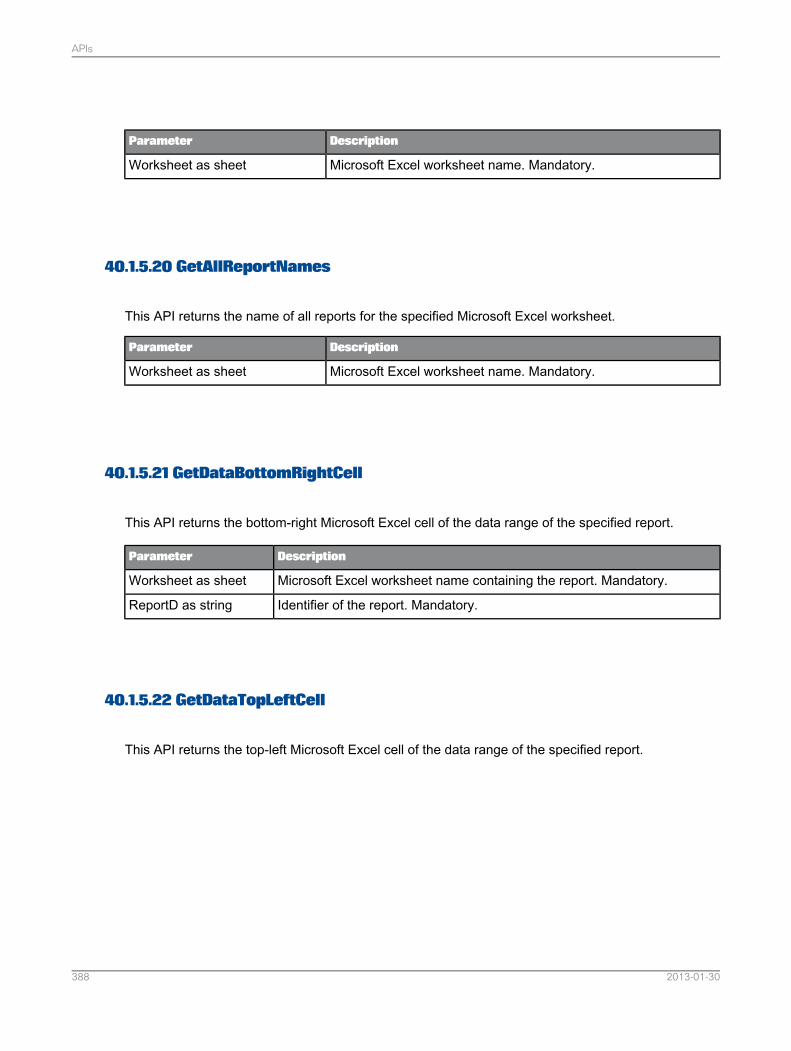
DescriptionParameter
Microsoft Excel worksheet name. Mandatory.Worksheet as sheet
40.1.5.20 GetAllReportNames
This API returns the name of all reports for the specified Microsoft Excel worksheet.
DescriptionParameter
Microsoft Excel worksheet name. Mandatory.Worksheet as sheet
40.1.5.21 GetDataBottomRightCell
This API returns the bottom-right Microsoft Excel cell of the data range of the specified report.
DescriptionParameter
Microsoft Excel worksheet name containing the report. Mandatory.Worksheet as sheet
Identifier of the report. Mandatory.ReportD as string
40.1.5.22 GetDataTopLeftCell
This API returns the top-left Microsoft Excel cell of the data range of the specified report.
2013-01-30388
APIs
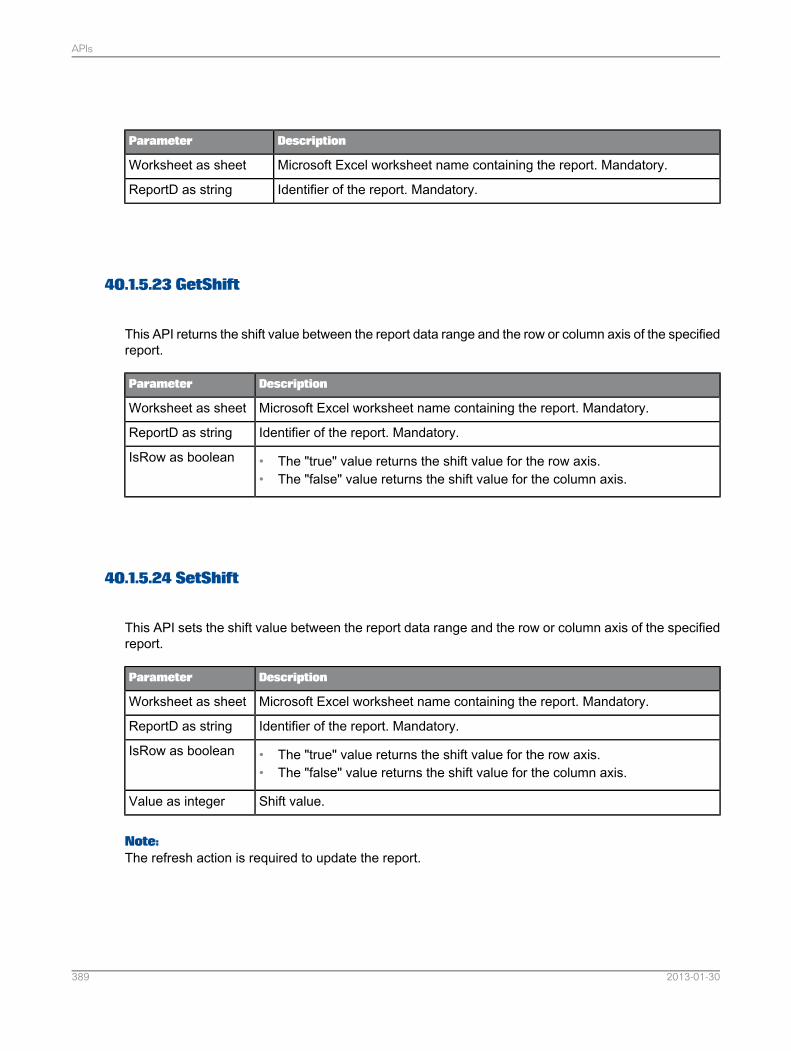
DescriptionParameter
Microsoft Excel worksheet name containing the report. Mandatory.Worksheet as sheet
Identifier of the report. Mandatory.ReportD as string
40.1.5.23 GetShift
This API returns the shift value between the report data range and the row or column axis of the specifiedreport.
DescriptionParameter
Microsoft Excel worksheet name containing the report. Mandatory.Worksheet as sheet
Identifier of the report. Mandatory.ReportD as string
• The "true" value returns the shift value for the row axis.• The "false" value returns the shift value for the column axis.
IsRow as boolean
40.1.5.24 SetShift
This API sets the shift value between the report data range and the row or column axis of the specifiedreport.
DescriptionParameter
Microsoft Excel worksheet name containing the report. Mandatory.Worksheet as sheet
Identifier of the report. Mandatory.ReportD as string
• The "true" value returns the shift value for the row axis.• The "false" value returns the shift value for the column axis.
IsRow as boolean
Shift value.Value as integer
Note:The refresh action is required to update the report.
2013-01-30389
APIs
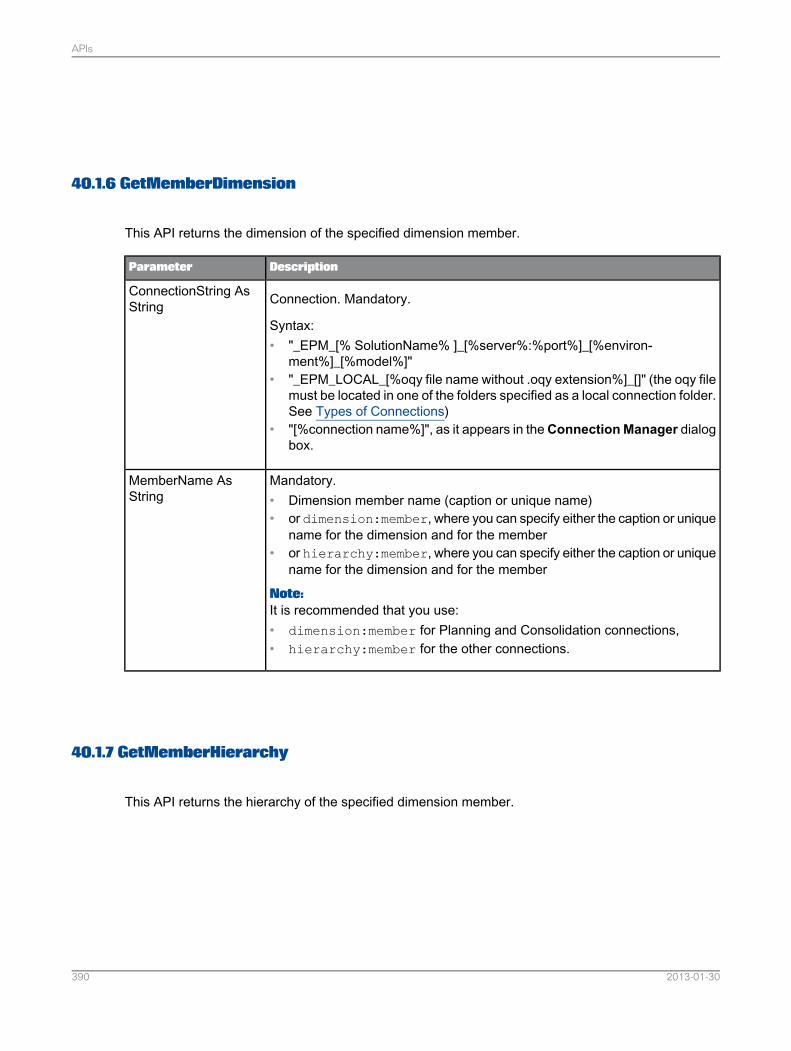
40.1.6 GetMemberDimension
This API returns the dimension of the specified dimension member.
DescriptionParameter
Connection. Mandatory.
Syntax:• "_EPM_[% SolutionName% ]_[%server%:%port%]_[%environ-
ment%]_[%model%]"• "_EPM_LOCAL_[%oqy file name without .oqy extension%]_[]" (the oqy file
must be located in one of the folders specified as a local connection folder.See Types of Connections)
• "[%connection name%]", as it appears in theConnectionManager dialogbox.
ConnectionString AsString
Mandatory.• Dimension member name (caption or unique name)• or dimension:member, where you can specify either the caption or unique
name for the dimension and for the member• or hierarchy:member, where you can specify either the caption or unique
name for the dimension and for the member
Note:It is recommended that you use:• dimension:member for Planning and Consolidation connections,• hierarchy:member for the other connections.
MemberName AsString
40.1.7 GetMemberHierarchy
This API returns the hierarchy of the specified dimension member.
2013-01-30390
APIs
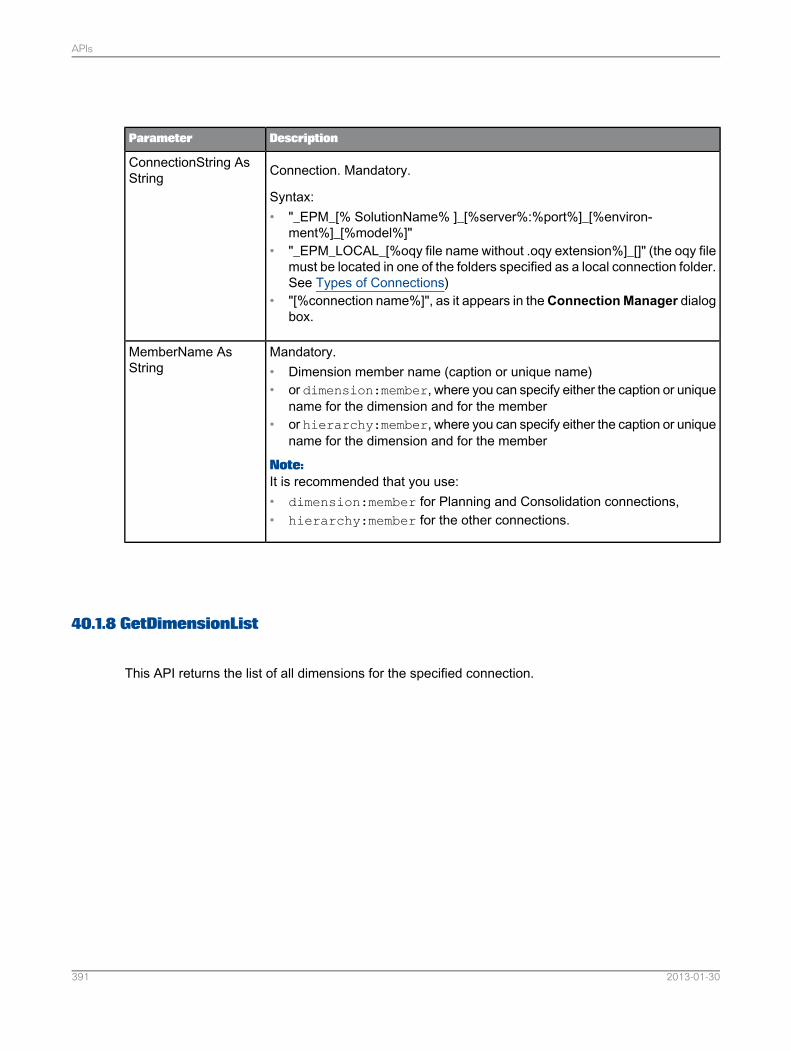
DescriptionParameter
Connection. Mandatory.
Syntax:• "_EPM_[% SolutionName% ]_[%server%:%port%]_[%environ-
ment%]_[%model%]"• "_EPM_LOCAL_[%oqy file name without .oqy extension%]_[]" (the oqy file
must be located in one of the folders specified as a local connection folder.See Types of Connections)
• "[%connection name%]", as it appears in theConnectionManager dialogbox.
ConnectionString AsString
Mandatory.• Dimension member name (caption or unique name)• or dimension:member, where you can specify either the caption or unique
name for the dimension and for the member• or hierarchy:member, where you can specify either the caption or unique
name for the dimension and for the member
Note:It is recommended that you use:• dimension:member for Planning and Consolidation connections,• hierarchy:member for the other connections.
MemberName AsString
40.1.8 GetDimensionList
This API returns the list of all dimensions for the specified connection.
2013-01-30391
APIs
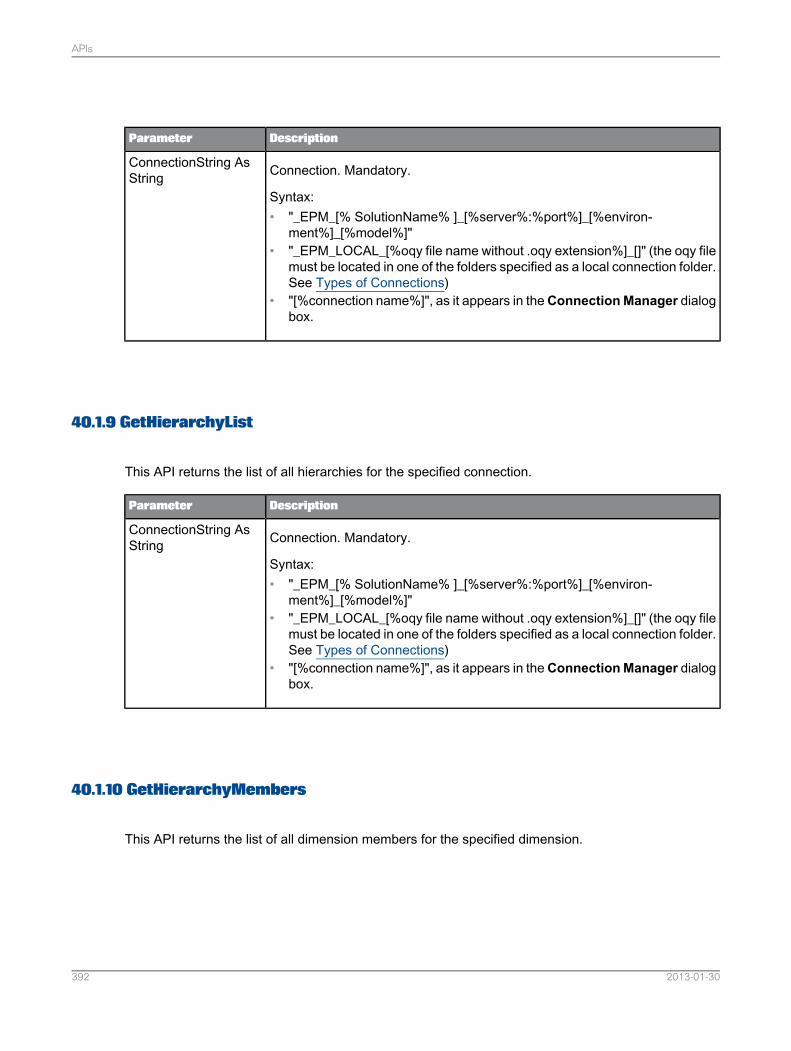
DescriptionParameter
Connection. Mandatory.
Syntax:• "_EPM_[% SolutionName% ]_[%server%:%port%]_[%environ-
ment%]_[%model%]"• "_EPM_LOCAL_[%oqy file name without .oqy extension%]_[]" (the oqy file
must be located in one of the folders specified as a local connection folder.See Types of Connections)
• "[%connection name%]", as it appears in theConnectionManager dialogbox.
ConnectionString AsString
40.1.9 GetHierarchyList
This API returns the list of all hierarchies for the specified connection.
DescriptionParameter
Connection. Mandatory.
Syntax:• "_EPM_[% SolutionName% ]_[%server%:%port%]_[%environ-
ment%]_[%model%]"• "_EPM_LOCAL_[%oqy file name without .oqy extension%]_[]" (the oqy file
must be located in one of the folders specified as a local connection folder.See Types of Connections)
• "[%connection name%]", as it appears in theConnectionManager dialogbox.
ConnectionString AsString
40.1.10 GetHierarchyMembers
This API returns the list of all dimension members for the specified dimension.
2013-01-30392
APIs
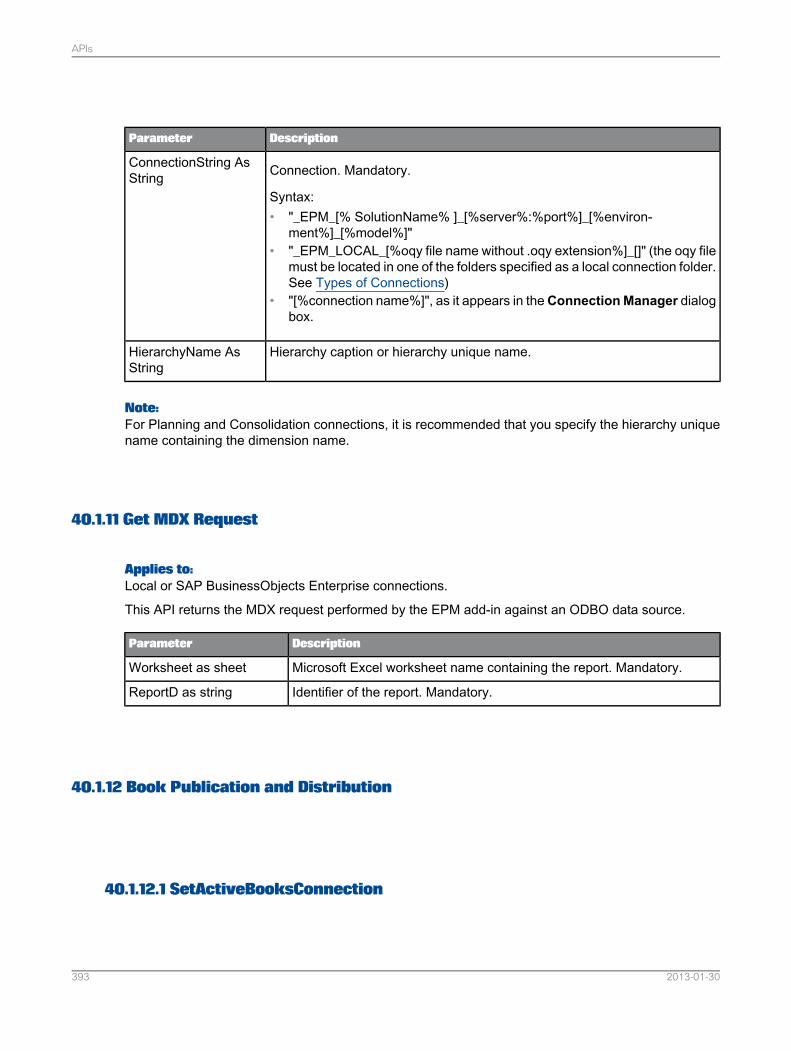
DescriptionParameter
Connection. Mandatory.
Syntax:• "_EPM_[% SolutionName% ]_[%server%:%port%]_[%environ-
ment%]_[%model%]"• "_EPM_LOCAL_[%oqy file name without .oqy extension%]_[]" (the oqy file
must be located in one of the folders specified as a local connection folder.See Types of Connections)
• "[%connection name%]", as it appears in theConnectionManager dialogbox.
ConnectionString AsString
Hierarchy caption or hierarchy unique name.HierarchyName AsString
Note:For Planning and Consolidation connections, it is recommended that you specify the hierarchy uniquename containing the dimension name.
40.1.11 Get MDX Request
Applies to:Local or SAP BusinessObjects Enterprise connections.
This API returns the MDX request performed by the EPM add-in against an ODBO data source.
DescriptionParameter
Microsoft Excel worksheet name containing the report. Mandatory.Worksheet as sheet
Identifier of the report. Mandatory.ReportD as string
40.1.12 Book Publication and Distribution
40.1.12.1 SetActiveBooksConnection
2013-01-30393
APIs
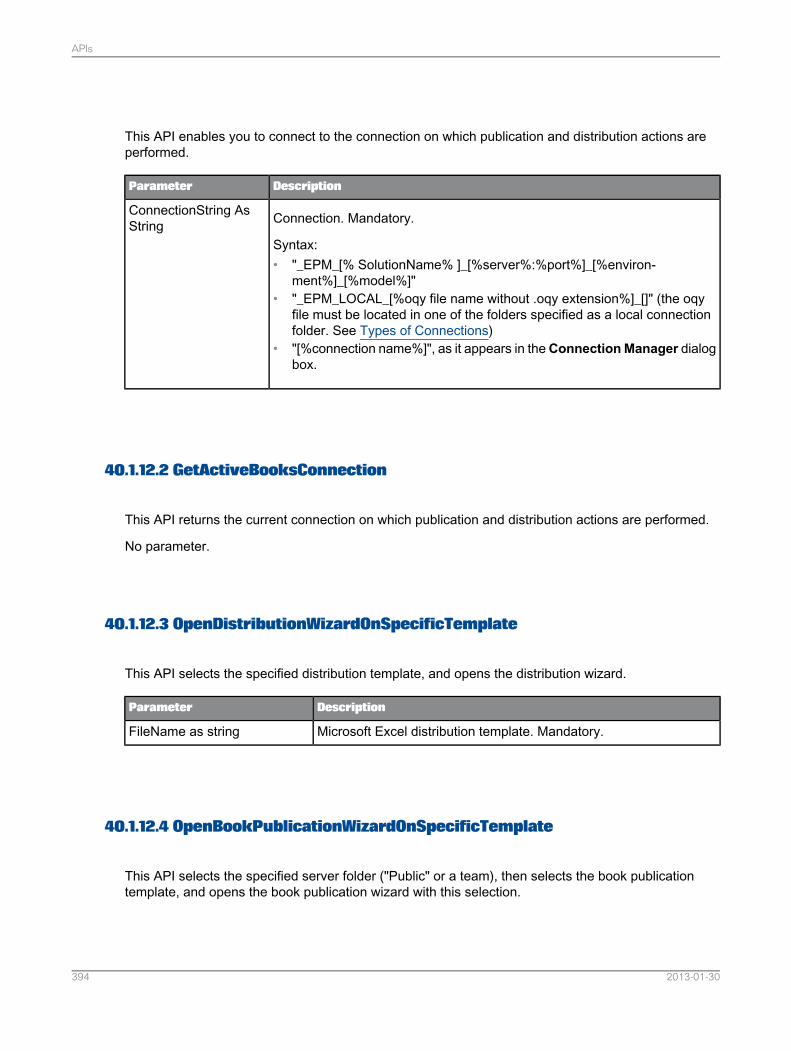
This API enables you to connect to the connection on which publication and distribution actions areperformed.
DescriptionParameter
Connection. Mandatory.
Syntax:• "_EPM_[% SolutionName% ]_[%server%:%port%]_[%environ-
ment%]_[%model%]"• "_EPM_LOCAL_[%oqy file name without .oqy extension%]_[]" (the oqy
file must be located in one of the folders specified as a local connectionfolder. See Types of Connections)
• "[%connection name%]", as it appears in theConnectionManager dialogbox.
ConnectionString AsString
40.1.12.2 GetActiveBooksConnection
This API returns the current connection on which publication and distribution actions are performed.
No parameter.
40.1.12.3 OpenDistributionWizardOnSpecificTemplate
This API selects the specified distribution template, and opens the distribution wizard.
DescriptionParameter
Microsoft Excel distribution template. Mandatory.FileName as string
40.1.12.4 OpenBookPublicationWizardOnSpecificTemplate
This API selects the specified server folder ("Public" or a team), then selects the book publicationtemplate, and opens the book publication wizard with this selection.
2013-01-30394
APIs
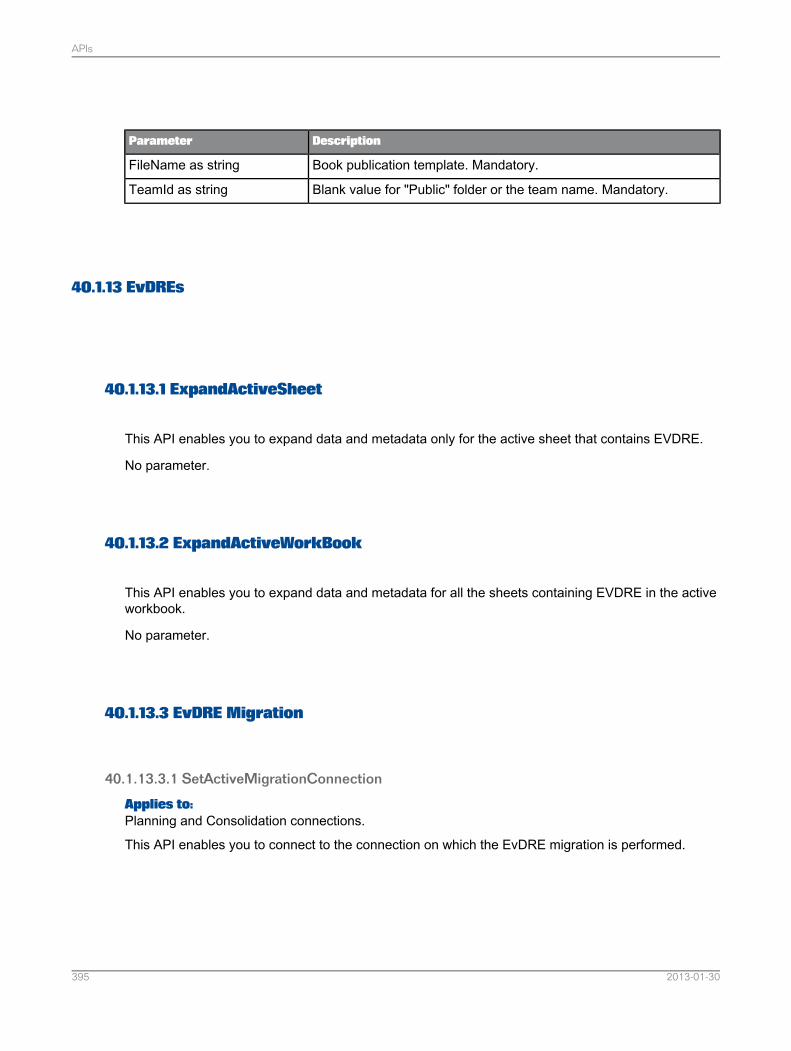
DescriptionParameter
Book publication template. Mandatory.FileName as string
Blank value for "Public" folder or the team name. Mandatory.TeamId as string
40.1.13 EvDREs
40.1.13.1 ExpandActiveSheet
This API enables you to expand data and metadata only for the active sheet that contains EVDRE.
No parameter.
40.1.13.2 ExpandActiveWorkBook
This API enables you to expand data and metadata for all the sheets containing EVDRE in the activeworkbook.
No parameter.
40.1.13.3 EvDRE Migration
40.1.13.3.1 SetActiveMigrationConnection
Applies to:Planning and Consolidation connections.
This API enables you to connect to the connection on which the EvDRE migration is performed.
2013-01-30395
APIs
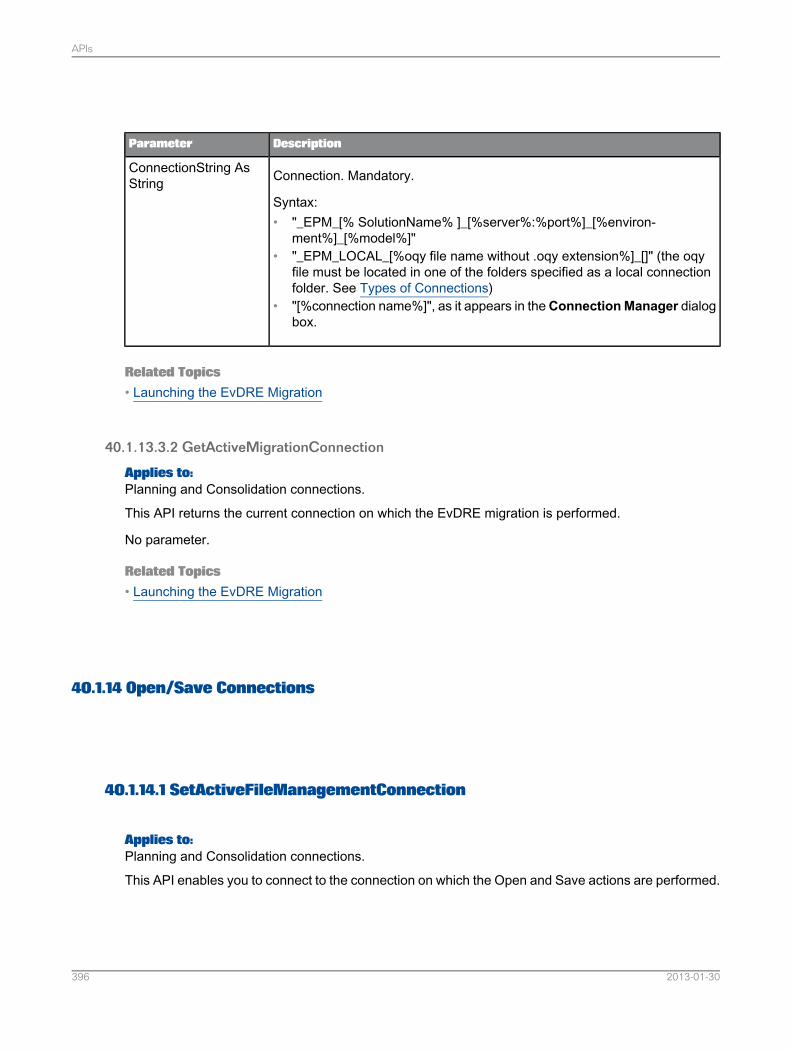
DescriptionParameter
Connection. Mandatory.
Syntax:• "_EPM_[% SolutionName% ]_[%server%:%port%]_[%environ-
ment%]_[%model%]"• "_EPM_LOCAL_[%oqy file name without .oqy extension%]_[]" (the oqy
file must be located in one of the folders specified as a local connectionfolder. See Types of Connections)
• "[%connection name%]", as it appears in theConnectionManager dialogbox.
ConnectionString AsString
Related Topics• Launching the EvDRE Migration
40.1.13.3.2 GetActiveMigrationConnection
Applies to:Planning and Consolidation connections.
This API returns the current connection on which the EvDRE migration is performed.
No parameter.
Related Topics• Launching the EvDRE Migration
40.1.14 Open/Save Connections
40.1.14.1 SetActiveFileManagementConnection
Applies to:Planning and Consolidation connections.
This API enables you to connect to the connection on which the Open and Save actions are performed.
2013-01-30396
APIs
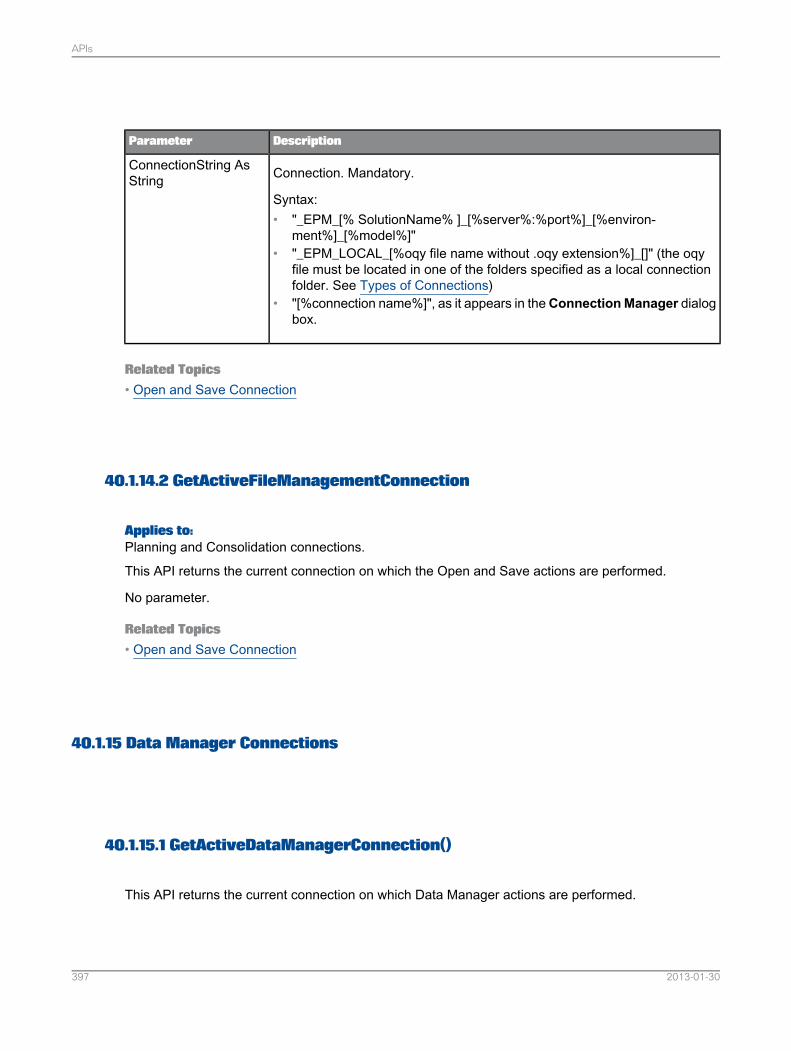
DescriptionParameter
Connection. Mandatory.
Syntax:• "_EPM_[% SolutionName% ]_[%server%:%port%]_[%environ-
ment%]_[%model%]"• "_EPM_LOCAL_[%oqy file name without .oqy extension%]_[]" (the oqy
file must be located in one of the folders specified as a local connectionfolder. See Types of Connections)
• "[%connection name%]", as it appears in theConnectionManager dialogbox.
ConnectionString AsString
Related Topics• Open and Save Connection
40.1.14.2 GetActiveFileManagementConnection
Applies to:Planning and Consolidation connections.
This API returns the current connection on which the Open and Save actions are performed.
No parameter.
Related Topics• Open and Save Connection
40.1.15 Data Manager Connections
40.1.15.1 GetActiveDataManagerConnection()
This API returns the current connection on which Data Manager actions are performed.
2013-01-30397
APIs
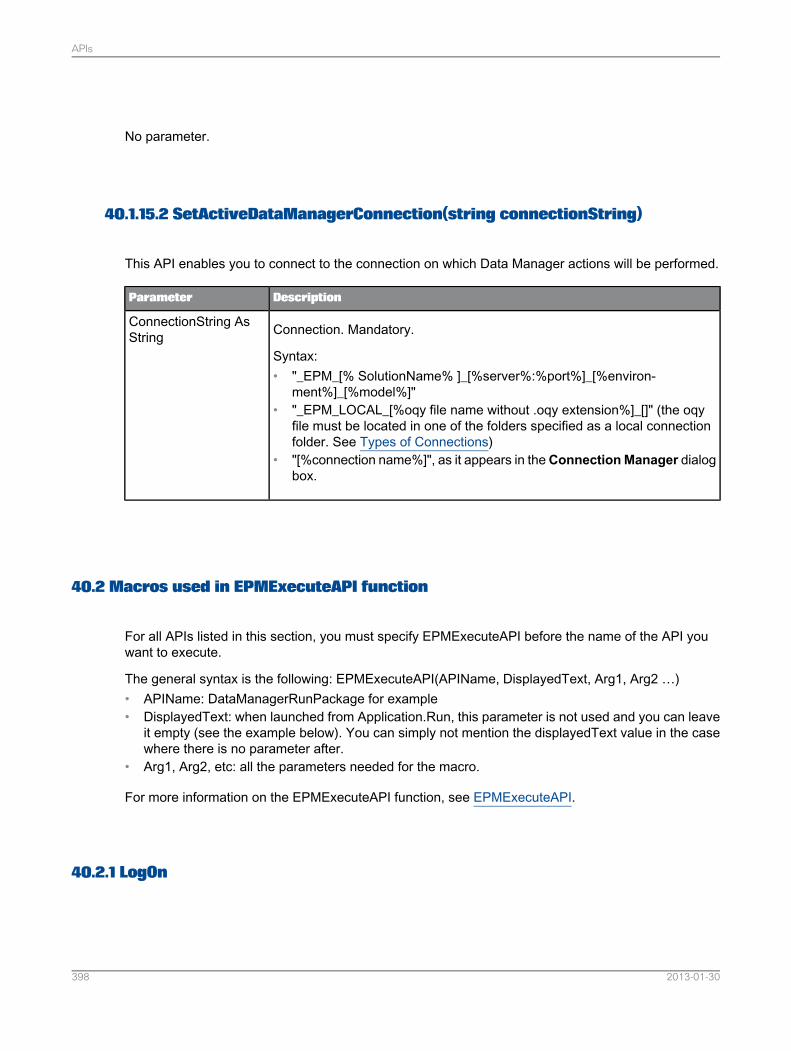
No parameter.
40.1.15.2 SetActiveDataManagerConnection(string connectionString)
This API enables you to connect to the connection on which Data Manager actions will be performed.
DescriptionParameter
Connection. Mandatory.
Syntax:• "_EPM_[% SolutionName% ]_[%server%:%port%]_[%environ-
ment%]_[%model%]"• "_EPM_LOCAL_[%oqy file name without .oqy extension%]_[]" (the oqy
file must be located in one of the folders specified as a local connectionfolder. See Types of Connections)
• "[%connection name%]", as it appears in theConnectionManager dialogbox.
ConnectionString AsString
40.2 Macros used in EPMExecuteAPI function
For all APIs listed in this section, you must specify EPMExecuteAPI before the name of the API youwant to execute.
The general syntax is the following: EPMExecuteAPI(APIName, DisplayedText, Arg1, Arg2 …)• APIName: DataManagerRunPackage for example• DisplayedText: when launched from Application.Run, this parameter is not used and you can leave
it empty (see the example below). You can simply not mention the displayedText value in the casewhere there is no parameter after.
• Arg1, Arg2, etc: all the parameters needed for the macro.
For more information on the EPMExecuteAPI function, see EPMExecuteAPI.
40.2.1 LogOn
2013-01-30398
APIs
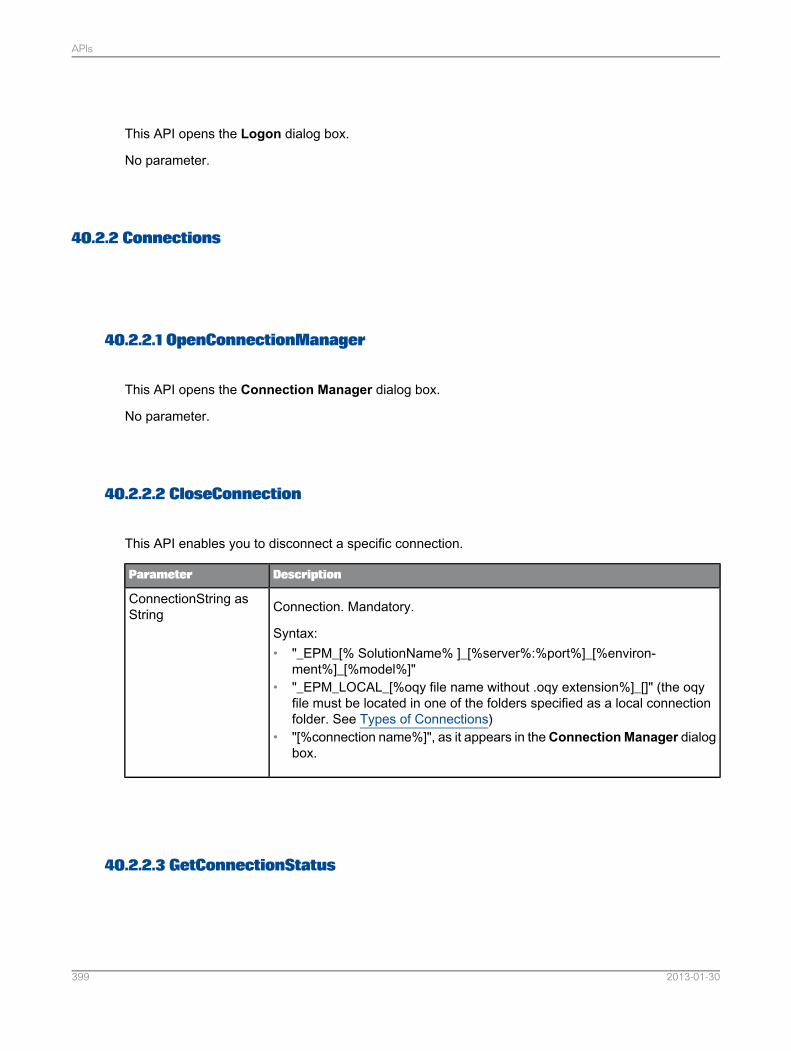
This API opens the Logon dialog box.
No parameter.
40.2.2 Connections
40.2.2.1 OpenConnectionManager
This API opens the Connection Manager dialog box.
No parameter.
40.2.2.2 CloseConnection
This API enables you to disconnect a specific connection.
DescriptionParameter
Connection. Mandatory.
Syntax:• "_EPM_[% SolutionName% ]_[%server%:%port%]_[%environ-
ment%]_[%model%]"• "_EPM_LOCAL_[%oqy file name without .oqy extension%]_[]" (the oqy
file must be located in one of the folders specified as a local connectionfolder. See Types of Connections)
• "[%connection name%]", as it appears in theConnectionManager dialogbox.
ConnectionString asString
40.2.2.3 GetConnectionStatus
2013-01-30399
APIs
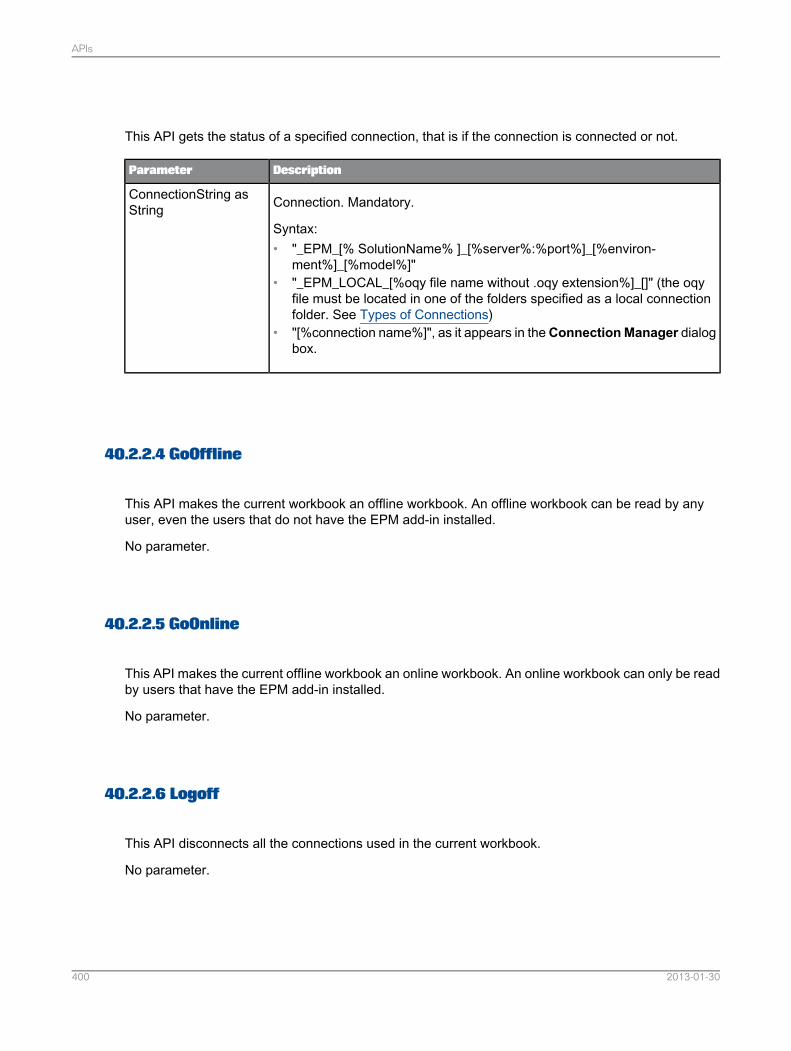
This API gets the status of a specified connection, that is if the connection is connected or not.
DescriptionParameter
Connection. Mandatory.
Syntax:• "_EPM_[% SolutionName% ]_[%server%:%port%]_[%environ-
ment%]_[%model%]"• "_EPM_LOCAL_[%oqy file name without .oqy extension%]_[]" (the oqy
file must be located in one of the folders specified as a local connectionfolder. See Types of Connections)
• "[%connection name%]", as it appears in theConnectionManager dialogbox.
ConnectionString asString
40.2.2.4 GoOffline
This API makes the current workbook an offline workbook. An offline workbook can be read by anyuser, even the users that do not have the EPM add-in installed.
No parameter.
40.2.2.5 GoOnline
This API makes the current offline workbook an online workbook. An online workbook can only be readby users that have the EPM add-in installed.
No parameter.
40.2.2.6 Logoff
This API disconnects all the connections used in the current workbook.
No parameter.
2013-01-30400
APIs
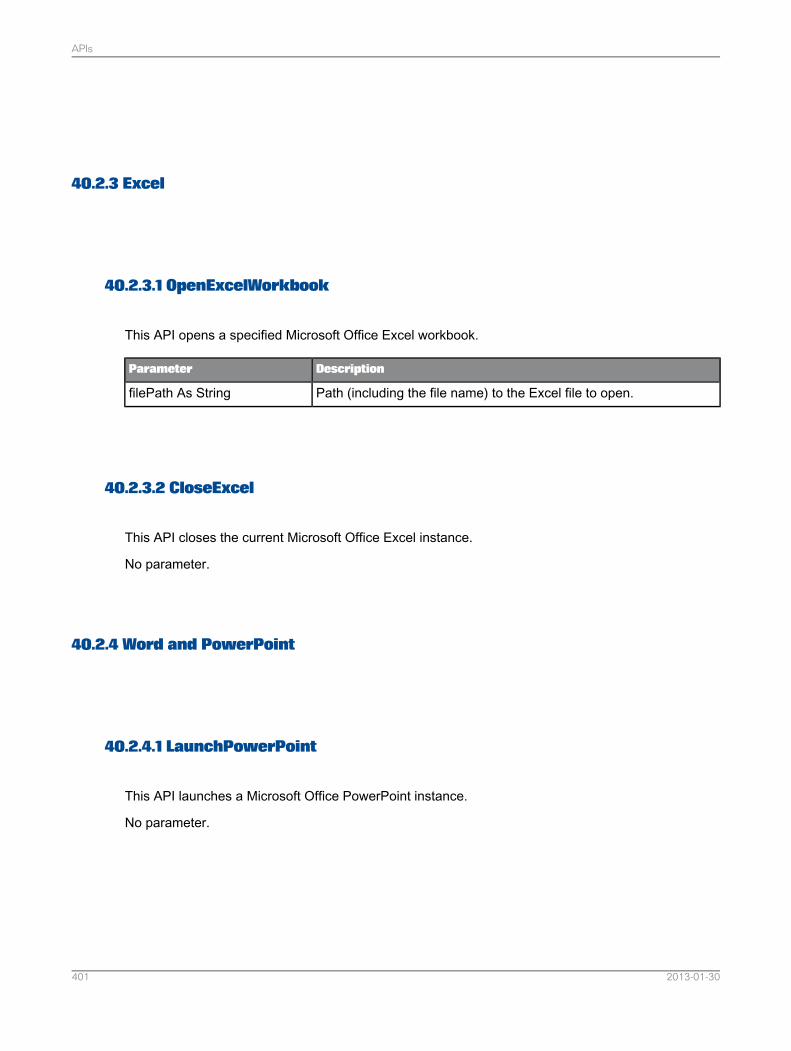
40.2.3 Excel
40.2.3.1 OpenExcelWorkbook
This API opens a specified Microsoft Office Excel workbook.
DescriptionParameter
Path (including the file name) to the Excel file to open.filePath As String
40.2.3.2 CloseExcel
This API closes the current Microsoft Office Excel instance.
No parameter.
40.2.4 Word and PowerPoint
40.2.4.1 LaunchPowerPoint
This API launches a Microsoft Office PowerPoint instance.
No parameter.
2013-01-30401
APIs
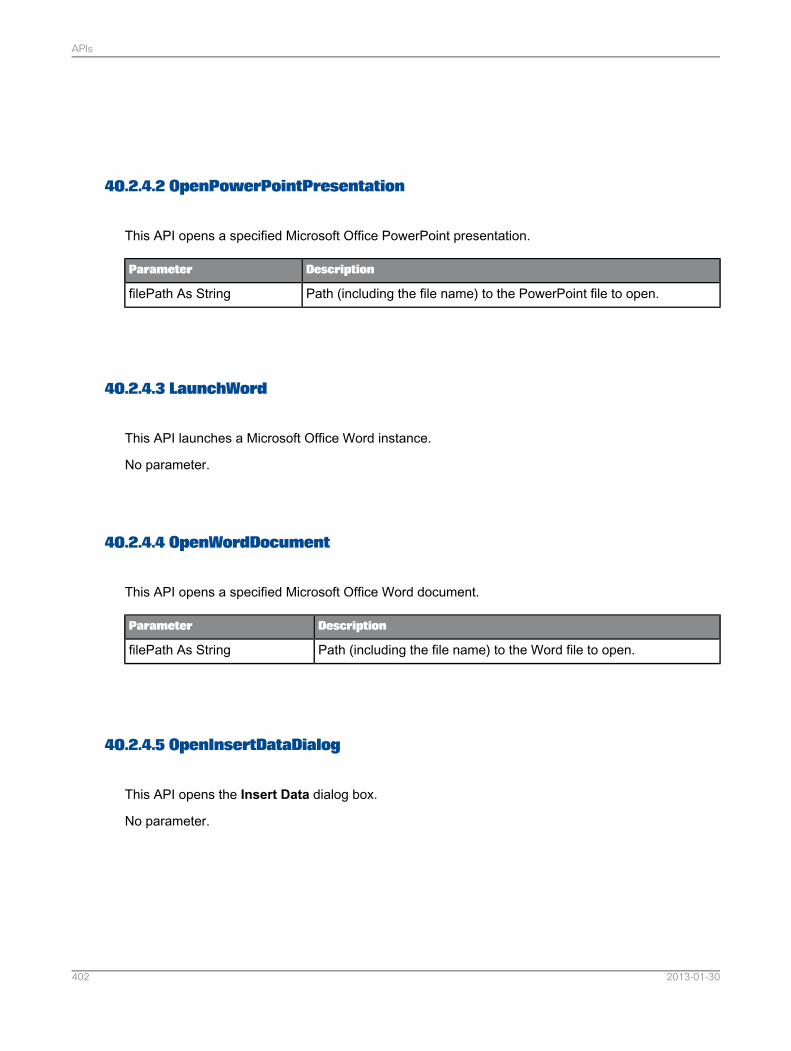
40.2.4.2 OpenPowerPointPresentation
This API opens a specified Microsoft Office PowerPoint presentation.
DescriptionParameter
Path (including the file name) to the PowerPoint file to open.filePath As String
40.2.4.3 LaunchWord
This API launches a Microsoft Office Word instance.
No parameter.
40.2.4.4 OpenWordDocument
This API opens a specified Microsoft Office Word document.
DescriptionParameter
Path (including the file name) to the Word file to open.filePath As String
40.2.4.5 OpenInsertDataDialog
This API opens the Insert Data dialog box.
No parameter.
2013-01-30402
APIs
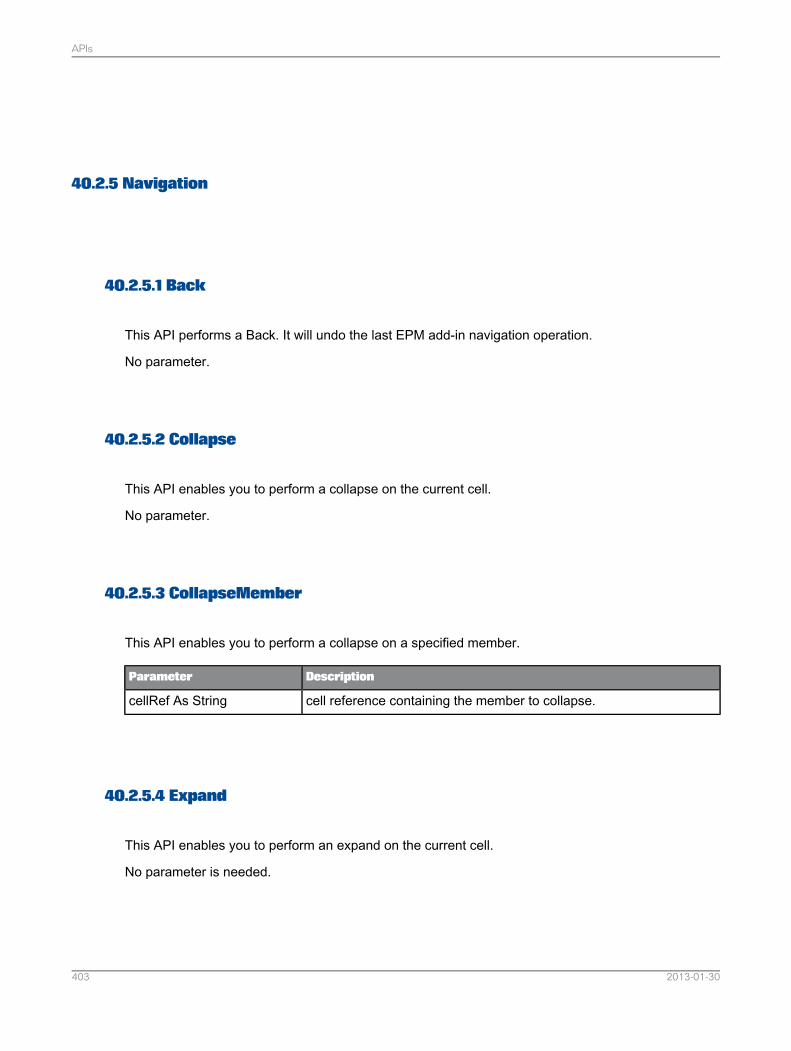
40.2.5 Navigation
40.2.5.1 Back
This API performs a Back. It will undo the last EPM add-in navigation operation.
No parameter.
40.2.5.2 Collapse
This API enables you to perform a collapse on the current cell.
No parameter.
40.2.5.3 CollapseMember
This API enables you to perform a collapse on a specified member.
DescriptionParameter
cell reference containing the member to collapse.cellRef As String
40.2.5.4 Expand
This API enables you to perform an expand on the current cell.
No parameter is needed.
2013-01-30403
APIs
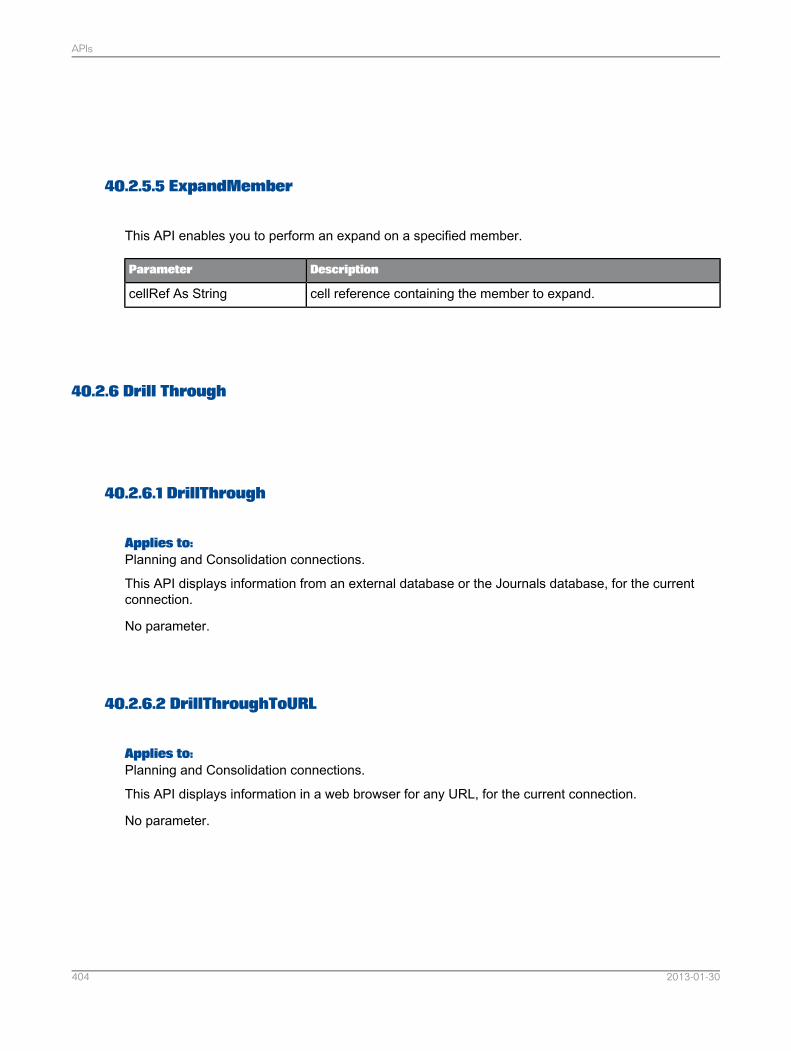
40.2.5.5 ExpandMember
This API enables you to perform an expand on a specified member.
DescriptionParameter
cell reference containing the member to expand.cellRef As String
40.2.6 Drill Through
40.2.6.1 DrillThrough
Applies to:Planning and Consolidation connections.
This API displays information from an external database or the Journals database, for the currentconnection.
No parameter.
40.2.6.2 DrillThroughToURL
Applies to:Planning and Consolidation connections.
This API displays information in a web browser for any URL, for the current connection.
No parameter.
2013-01-30404
APIs
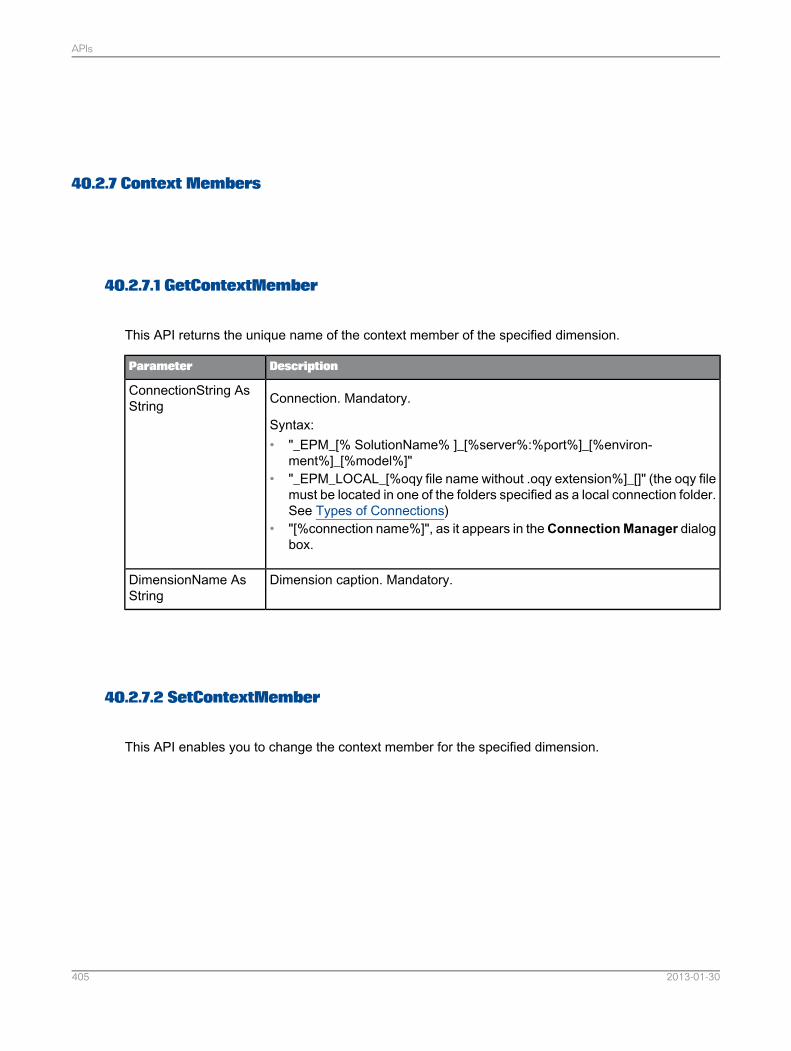
40.2.7 Context Members
40.2.7.1 GetContextMember
This API returns the unique name of the context member of the specified dimension.
DescriptionParameter
Connection. Mandatory.
Syntax:• "_EPM_[% SolutionName% ]_[%server%:%port%]_[%environ-
ment%]_[%model%]"• "_EPM_LOCAL_[%oqy file name without .oqy extension%]_[]" (the oqy file
must be located in one of the folders specified as a local connection folder.See Types of Connections)
• "[%connection name%]", as it appears in theConnectionManager dialogbox.
ConnectionString AsString
Dimension caption. Mandatory.DimensionName AsString
40.2.7.2 SetContextMember
This API enables you to change the context member for the specified dimension.
2013-01-30405
APIs
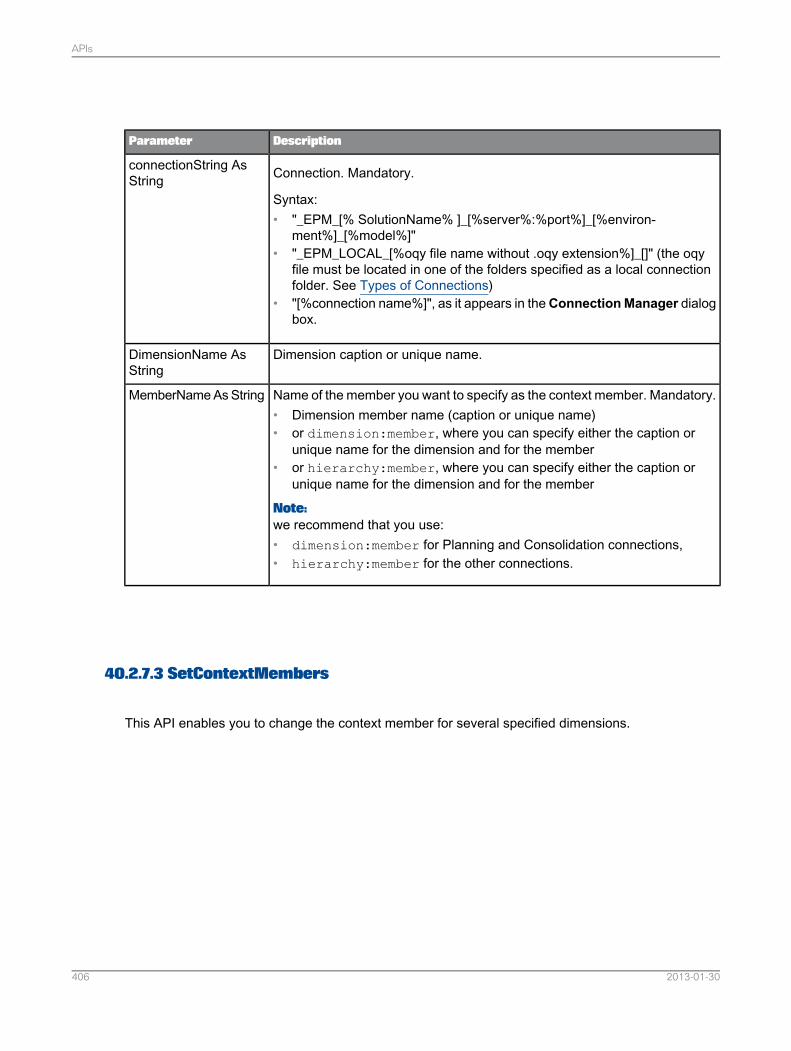
DescriptionParameter
Connection. Mandatory.
Syntax:• "_EPM_[% SolutionName% ]_[%server%:%port%]_[%environ-
ment%]_[%model%]"• "_EPM_LOCAL_[%oqy file name without .oqy extension%]_[]" (the oqy
file must be located in one of the folders specified as a local connectionfolder. See Types of Connections)
• "[%connection name%]", as it appears in theConnectionManager dialogbox.
connectionString AsString
Dimension caption or unique name.DimensionName AsString
Name of the member you want to specify as the context member. Mandatory.• Dimension member name (caption or unique name)• or dimension:member, where you can specify either the caption or
unique name for the dimension and for the member• or hierarchy:member, where you can specify either the caption or
unique name for the dimension and for the member
Note:we recommend that you use:• dimension:member for Planning and Consolidation connections,• hierarchy:member for the other connections.
MemberName As String
40.2.7.3 SetContextMembers
This API enables you to change the context member for several specified dimensions.
2013-01-30406
APIs
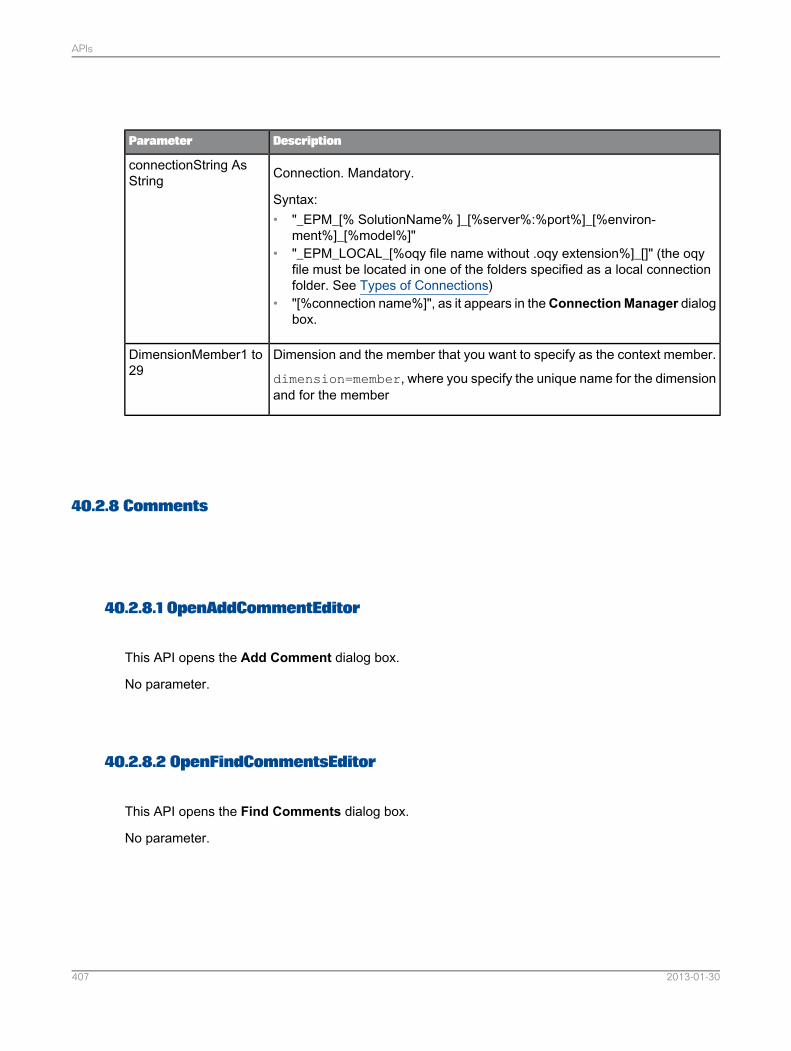
DescriptionParameter
Connection. Mandatory.
Syntax:• "_EPM_[% SolutionName% ]_[%server%:%port%]_[%environ-
ment%]_[%model%]"• "_EPM_LOCAL_[%oqy file name without .oqy extension%]_[]" (the oqy
file must be located in one of the folders specified as a local connectionfolder. See Types of Connections)
• "[%connection name%]", as it appears in theConnectionManager dialogbox.
connectionString AsString
Dimension and the member that you want to specify as the context member.
dimension=member, where you specify the unique name for the dimensionand for the member
DimensionMember1 to29
40.2.8 Comments
40.2.8.1 OpenAddCommentEditor
This API opens the Add Comment dialog box.
No parameter.
40.2.8.2 OpenFindCommentsEditor
This API opens the Find Comments dialog box.
No parameter.
2013-01-30407
APIs

40.2.9 Open/Save from Server
40.2.9.1 OpenServerInputFormFolder
Applies to:Planning and Consolidation connections.
This API opens the file selection dialog box on the server folder dedicated to input forms.
No parameter.
40.2.9.2 OpenServerReportFolder
Applies to:Planning and Consolidation connections.
This API opens the file selection dialog box on the server folder dedicated to reports.
No parameter.
40.2.9.3 OpenServerRootFolder
Applies to:Planning and Consolidation connections.
This API opens the file selection dialog box on the server root folder.
No parameter.
40.2.9.4 SaveToServerRootFolder
2013-01-30408
APIs
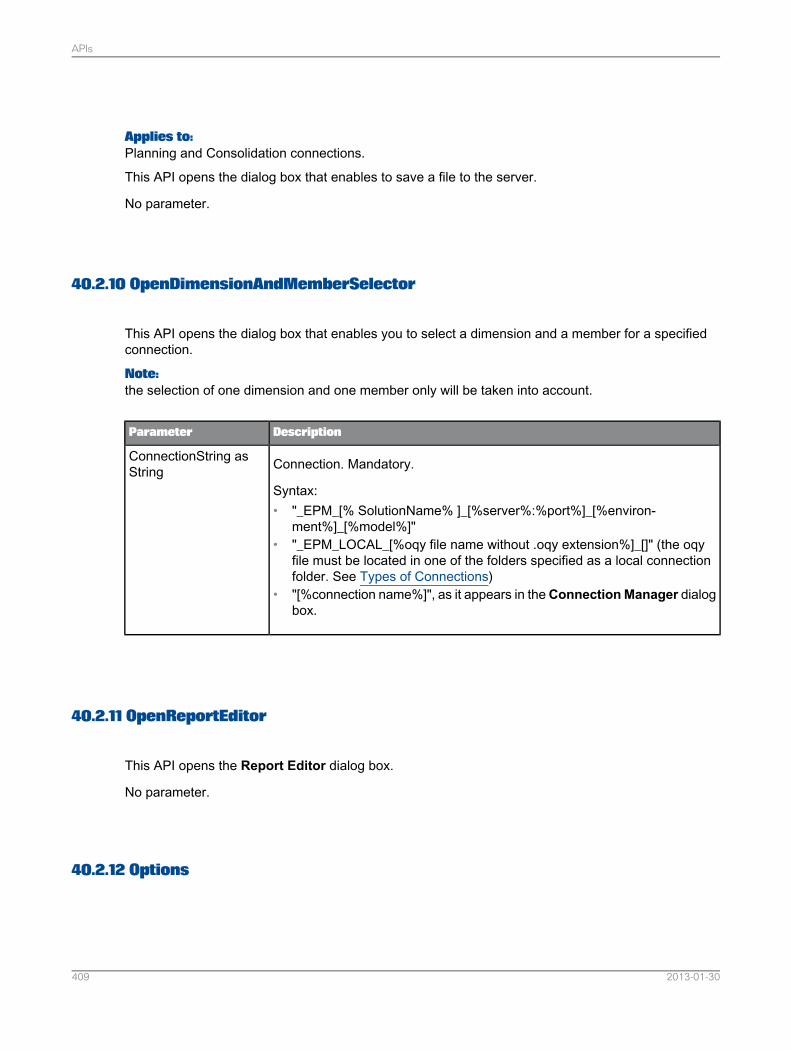
Applies to:Planning and Consolidation connections.
This API opens the dialog box that enables to save a file to the server.
No parameter.
40.2.10 OpenDimensionAndMemberSelector
This API opens the dialog box that enables you to select a dimension and a member for a specifiedconnection.
Note:the selection of one dimension and one member only will be taken into account.
DescriptionParameter
Connection. Mandatory.
Syntax:• "_EPM_[% SolutionName% ]_[%server%:%port%]_[%environ-
ment%]_[%model%]"• "_EPM_LOCAL_[%oqy file name without .oqy extension%]_[]" (the oqy
file must be located in one of the folders specified as a local connectionfolder. See Types of Connections)
• "[%connection name%]", as it appears in theConnectionManager dialogbox.
ConnectionString asString
40.2.11 OpenReportEditor
This API opens the Report Editor dialog box.
No parameter.
40.2.12 Options
2013-01-30409
APIs
40.2.12.1 OpenUserOptions
This API opens the User Options dialog box.
No parameter.
40.2.12.2 OpenSheetOptions
This API opens the Sheet Options dialog box.
No parameter.
40.2.12.3 OpenContextOptions
This API opens the Context Options dialog box.
No parameter.
40.2.13 Refresh
40.2.13.1 Refresh
This API performs a refresh on:• the active report, for Microsoft Office Excel,• the active document, for Microsoft Office Word,• the active presentation, for Microsoft Office PowerPoint.
No parameter.
2013-01-30410
APIs
40.2.13.2 RefreshReportDataOnly
This API performs a refresh only on the data for all the reports in the worksheet, except the data forlocal members.
No parameter.
40.2.13.3 RefreshActiveReport
This API performs a refresh on the active report.
No parameter.
40.2.13.4 RefreshActiveSheet
This API performs a refresh on:• the active worksheet, for Microsoft Office Excel,• the active document, for Microsoft Office Word,• the active presentation, for Microsoft Office PowerPoint.
No parameter.
40.2.13.5 RefreshActiveWorkBook
This API performs a refresh on the active workbook.
No parameter.
40.2.14 Save Data
2013-01-30411
APIs
40.2.14.1 SaveWorksheetData
Applies to:Planning and Consolidation connections.
This API performs a save on the worksheet data.
No parameter.
40.2.14.2 SaveWorkbookData
Applies to:Planning and Consolidation connections.
This API performs a save on the workbook data.
No parameter.
40.2.14.3 SaveAndRefreshWorksheetData
Applies to:Planning and Consolidation connections.
This API performs a save and a refresh on the worksheet data.
No parameter.
40.2.14.4 SaveAndRefreshWorkbookData
Applies to:Planning and Consolidation connections.
This API performs a save and a refresh on the workbook data.
No parameter.
2013-01-30412
APIs
40.2.15 OpenWorkStatusEditor
Applies to:Planning and Consolidation connections.
This API opens the Change Work Status dialog box.
No parameter.
40.2.16 Planning
40.2.16.1 Spread
Applies to:Planning and Consolidation connections.
This API opens the Spread dialog box.
No parameter.
40.2.16.2 Trend
Applies to:Planning and Consolidation connections.
This API opens the Trend dialog box.
No parameter.
40.2.16.3 Weight
2013-01-30413
APIs
Applies to:Planning and Consolidation connections.
This API opens the Weight dialog box.
No parameter.
40.2.17 Book Publication
40.2.17.1 CreateBookPublicationTemplate
This API opens the Book Publication Template dialog box.
No parameter.
40.2.17.2 OpenBookPublicationTemplate
This API opens the dialog box that enables to select an existing book publication template.
No parameter.
40.2.17.3 ValidateBookPublicationTemplate
Applies to:Planning and Consolidation connections.
This API validates the active book publication template.
No parameter.
40.2.17.4 SaveAsBookPublicationTemplate
2013-01-30414
APIs
Applies to:Planning and Consolidation connections.
This API opens the dialog box that enables to save a book publication template to the server.
No parameter.
40.2.17.5 SaveBookPublicationTemplate
This API performs a save of the current book publication template.
No parameter.
40.2.17.6 OpenBookPublicationWizard
This API opens the Book Publication wizard that enables you to launch a book publication.
No parameter.
40.2.18 Distribution and Collection
40.2.18.1 CreateDistributionTemplate
This API opens the Distribution Template dialog box.
No parameter.
40.2.18.2 OpenDistributionTemplate
This API opens the dialog box that enables to select an existing distribution template.
2013-01-30415
APIs
No parameter.
40.2.18.3 ValidateDistributionTemplate
Applies to:Planning and Consolidation connections.
This API validates the active distribution template.
No parameter.
40.2.18.4 SaveAsDistributionTemplate
Applies to:Planning and Consolidation connections.
This API opens the dialog box that enables to save a distribution template to the server.
No parameter.
40.2.18.5 SaveDistributionTemplate
This API performs a save of the current distribution template.
No parameter.
40.2.18.6 OpenDistributionWizard
This API opens the Distribution Wizard.
No parameter.
2013-01-30416
APIs
40.2.18.7 OpenCollectionWizard
This API opens the Collection wizard that enables you to launch a data collection.
No parameter.
40.2.19 OpenSpecificDocument
Applies to:Planning and Consolidation connections.
This API opens a specific document that is stored in the Documents view of Planning and Consolidation.
DescriptionParameter
Name of the file to open.documentName AsString
Team that has access to this document.teamId As String
Folder.subFolderRequested AsString
Folder.subModule As String
Connection. Optional.
Syntax:• "_EPM_[% SolutionName% ]_[%server%:%port%]_[%environ-
ment%]_[%model%]"• "_EPM_LOCAL_[%oqy file name without .oqy extension%]_[]" (the oqy
file must be located in one of the folders specified as a local connectionfolder. See Types of Connections)
• "[%connection name%]", as it appears in theConnectionManager dialogbox.
ConnectionString AsString
Note:The last three parameters define the path to the document.
2013-01-30417
APIs
40.2.20 Data Manager
40.2.20.1 DataManagerClearSavedPromptValues()
This API clears saved prompt values.
40.2.20.2 DataManagerCreateConversionFile()
This API creates a conversion file in the Data Manger.
40.2.20.3 DataManagerCreateConversionSheet()
This API creates a conversion sheet in the Data Manager.
40.2.20.4 DataManagerCreateNewTransformationSheet()
This API creates a new transformation sheet in the Data Manager.
40.2.20.5 DataManagerOpenConversionFileDialog()
This API opens the "Conversion File" dialog box.
2013-01-30418
APIs
40.2.20.6 DataManagerOpenDataPreviewDialog()
This API opens the "Data Preview" dialog box.
40.2.20.7 DataManagerOpenFileDownloadDialog()
This API opens the "File Download" dialog box.
40.2.20.8 DataManagerOpenFileUploadDialog()
This API opens the "File Upload" dialog box.
40.2.20.9 DataManagerOpenOrganizePackageDialog()
This API opens the "Organize Package" dialog box.
40.2.20.10 DataManagerOpenRunPackageDialog()
This API opens the "Run Package" dialog box.
40.2.20.11 Data ManagerOpenRunPackageLinkDialog()
This API opens the "Run Package Link" dialog box.
2013-01-30419
APIs
40.2.20.12 DataManagerOpenScheduleStatusDialog()
This API opens the "Schedule Status" dialog box.
40.2.20.13 DataManagerOpenTransformationFileDialog()
This API opens the "Transformation File" dialog box.
40.2.20.14 DataManagerOpenViewLinkStatusDialog()
This API opens the "View Link Status" dialog box.
40.2.20.15 DataManagerOpenViewStatusDialog()
This API opens the "View Status" dialog box.
40.2.20.16 DataManagerRunPackage(packageId As String, groupId As String,teamId As String, fileName As String)
This API allows you to run a package.
2013-01-30420
APIs
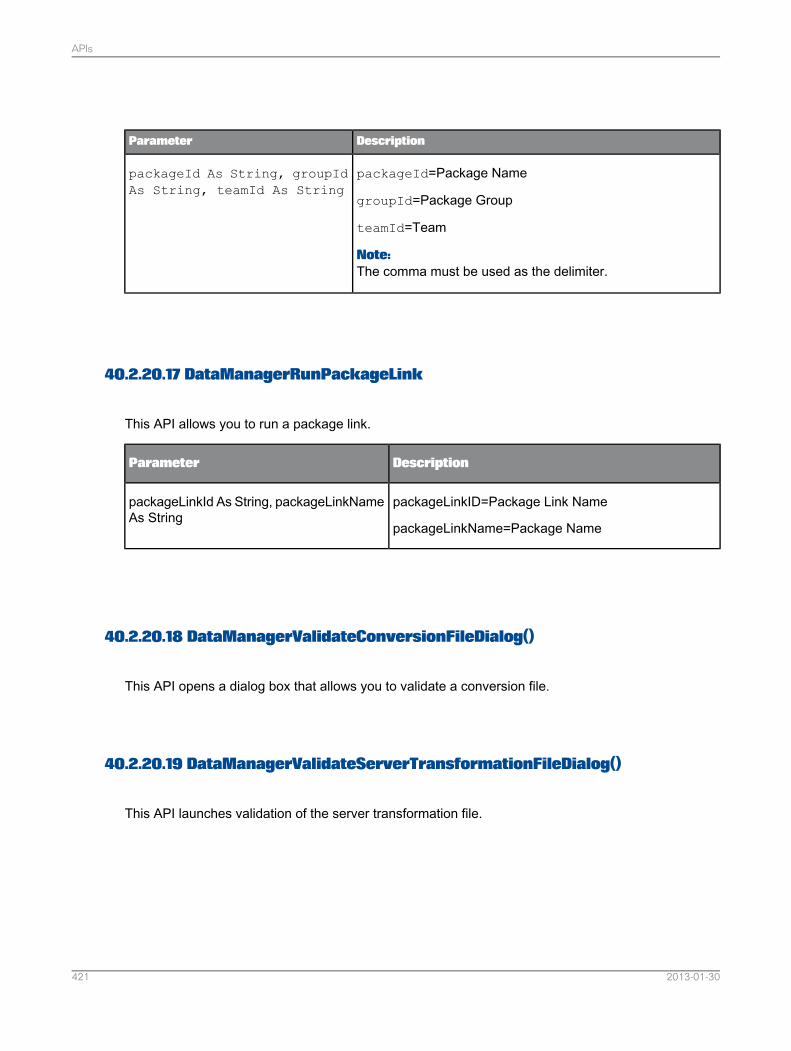
DescriptionParameter
packageId=Package Name
groupId=Package Group
teamId=Team
Note:The comma must be used as the delimiter.
packageId As String, groupIdAs String, teamId As String
40.2.20.17 DataManagerRunPackageLink
This API allows you to run a package link.
DescriptionParameter
packageLinkID=Package Link Name
packageLinkName=Package Name
packageLinkId As String, packageLinkNameAs String
40.2.20.18 DataManagerValidateConversionFileDialog()
This API opens a dialog box that allows you to validate a conversion file.
40.2.20.19 DataManagerValidateServerTransformationFileDialog()
This API launches validation of the server transformation file.
2013-01-30421
APIs
40.2.20.20 DataManagerValidateTransformationFileDialog()
This API opens the "Validate Transformation File" dialog box.
40.3 Assigning a Control Form to a Macro
You can assign a control form to a macro.
Example: Assigning a button to the Refresh macro
Option ExplicitSub Button5_Click()Dim api As ObjectSet api = Application.COMAddIns("FPMXLClient.Connect").Objectapi.Refresh
End Sub
40.4 Custom VBA Functions (Events)
You can customize your Visual Basic for Applications (VBA) code by associating the events listed below.
Enter your code in modules.• BEFORE_CONTEXTCHANGE
Use this function to execute a custom operation before changing the context.
• AFTER_CONTEXTCHANGE
Use this function to execute a custom operation after changing the context.
• BEFORE_REFRESH
Use this function to execute a custom operation before the system refreshes the data.
• AFTER_REFRESH
Use this function to execute a custom operation after the system refreshes the data.
Example:
After each refresh action, a dialog box will appear and display the text "Refresh successful".
2013-01-30422
APIs
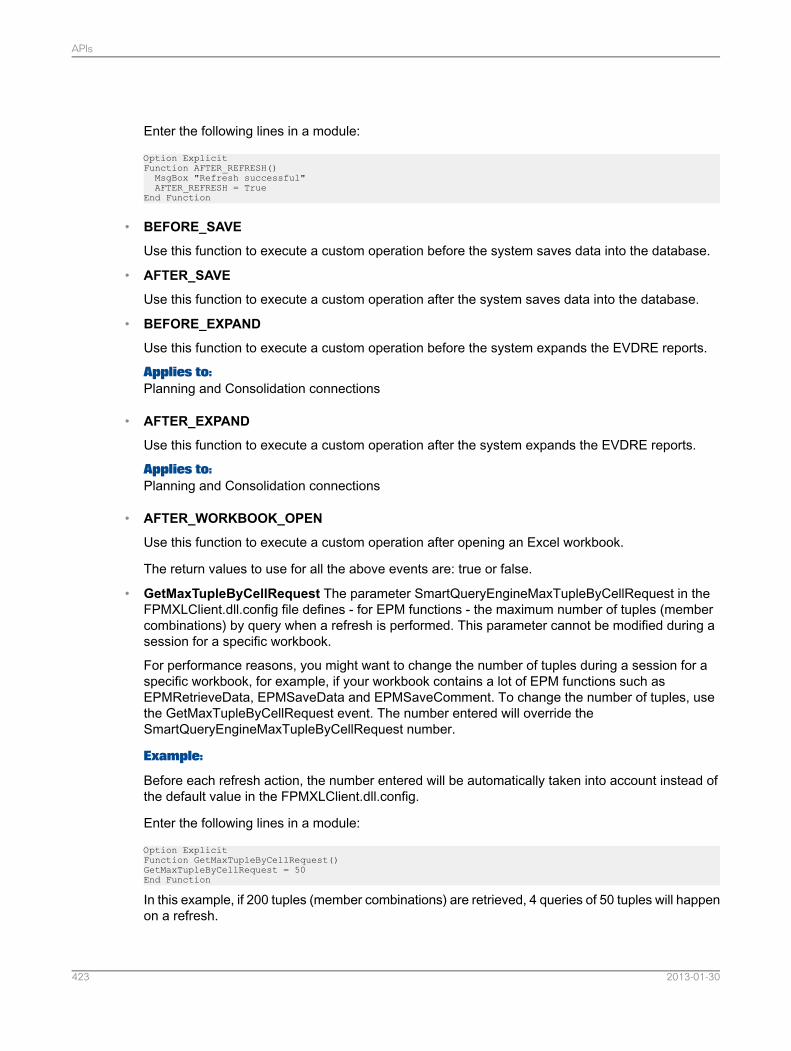
Enter the following lines in a module:
Option ExplicitFunction AFTER_REFRESH()MsgBox "Refresh successful"AFTER_REFRESH = True
End Function
• BEFORE_SAVE
Use this function to execute a custom operation before the system saves data into the database.
• AFTER_SAVE
Use this function to execute a custom operation after the system saves data into the database.
• BEFORE_EXPAND
Use this function to execute a custom operation before the system expands the EVDRE reports.
Applies to:Planning and Consolidation connections
• AFTER_EXPAND
Use this function to execute a custom operation after the system expands the EVDRE reports.
Applies to:Planning and Consolidation connections
• AFTER_WORKBOOK_OPEN
Use this function to execute a custom operation after opening an Excel workbook.
The return values to use for all the above events are: true or false.
• GetMaxTupleByCellRequest The parameter SmartQueryEngineMaxTupleByCellRequest in theFPMXLClient.dll.config file defines - for EPM functions - the maximum number of tuples (membercombinations) by query when a refresh is performed. This parameter cannot be modified during asession for a specific workbook.
For performance reasons, you might want to change the number of tuples during a session for aspecific workbook, for example, if your workbook contains a lot of EPM functions such asEPMRetrieveData, EPMSaveData and EPMSaveComment. To change the number of tuples, usethe GetMaxTupleByCellRequest event. The number entered will override theSmartQueryEngineMaxTupleByCellRequest number.
Example:
Before each refresh action, the number entered will be automatically taken into account instead ofthe default value in the FPMXLClient.dll.config.
Enter the following lines in a module:
Option ExplicitFunction GetMaxTupleByCellRequest()GetMaxTupleByCellRequest = 50End Function
In this example, if 200 tuples (member combinations) are retrieved, 4 queries of 50 tuples will happenon a refresh.
2013-01-30423
APIs

2013-01-30424
APIs
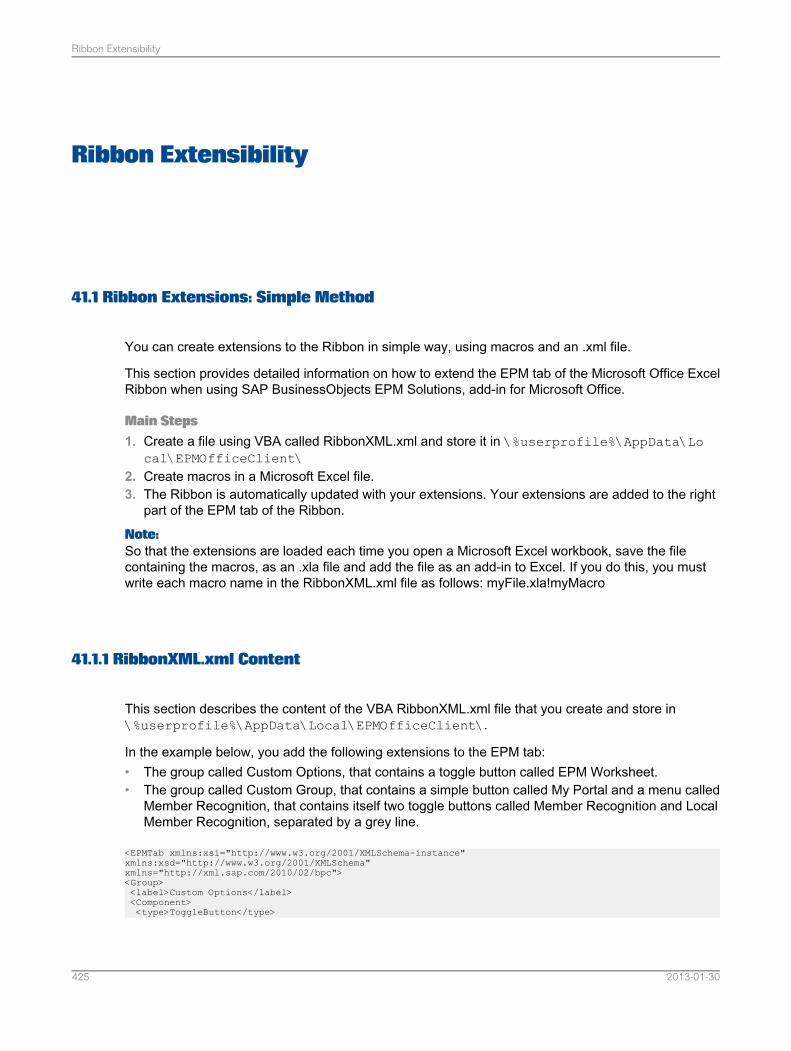
Ribbon Extensibility
41.1 Ribbon Extensions: Simple Method
You can create extensions to the Ribbon in simple way, using macros and an .xml file.
This section provides detailed information on how to extend the EPM tab of the Microsoft Office ExcelRibbon when using SAP BusinessObjects EPM Solutions, add-in for Microsoft Office.
Main Steps1. Create a file using VBA called RibbonXML.xml and store it in \%userprofile%\AppData\Lo
cal\EPMOfficeClient\2. Create macros in a Microsoft Excel file.3. The Ribbon is automatically updated with your extensions. Your extensions are added to the right
part of the EPM tab of the Ribbon.
Note:So that the extensions are loaded each time you open a Microsoft Excel workbook, save the filecontaining the macros, as an .xla file and add the file as an add-in to Excel. If you do this, you mustwrite each macro name in the RibbonXML.xml file as follows: myFile.xla!myMacro
41.1.1 RibbonXML.xml Content
This section describes the content of the VBA RibbonXML.xml file that you create and store in\%userprofile%\AppData\Local\EPMOfficeClient\.
In the example below, you add the following extensions to the EPM tab:• The group called Custom Options, that contains a toggle button called EPM Worksheet.• The group called Custom Group, that contains a simple button called My Portal and a menu called
Member Recognition, that contains itself two toggle buttons called Member Recognition and LocalMember Recognition, separated by a grey line.
<EPMTab xmlns:xsi="http://www.w3.org/2001/XMLSchema-instance"xmlns:xsd="http://www.w3.org/2001/XMLSchema"xmlns="http://xml.sap.com/2010/02/bpc"><Group><label>Custom Options</label><Component><type>ToggleButton</type>
2013-01-30425
Ribbon Extensibility
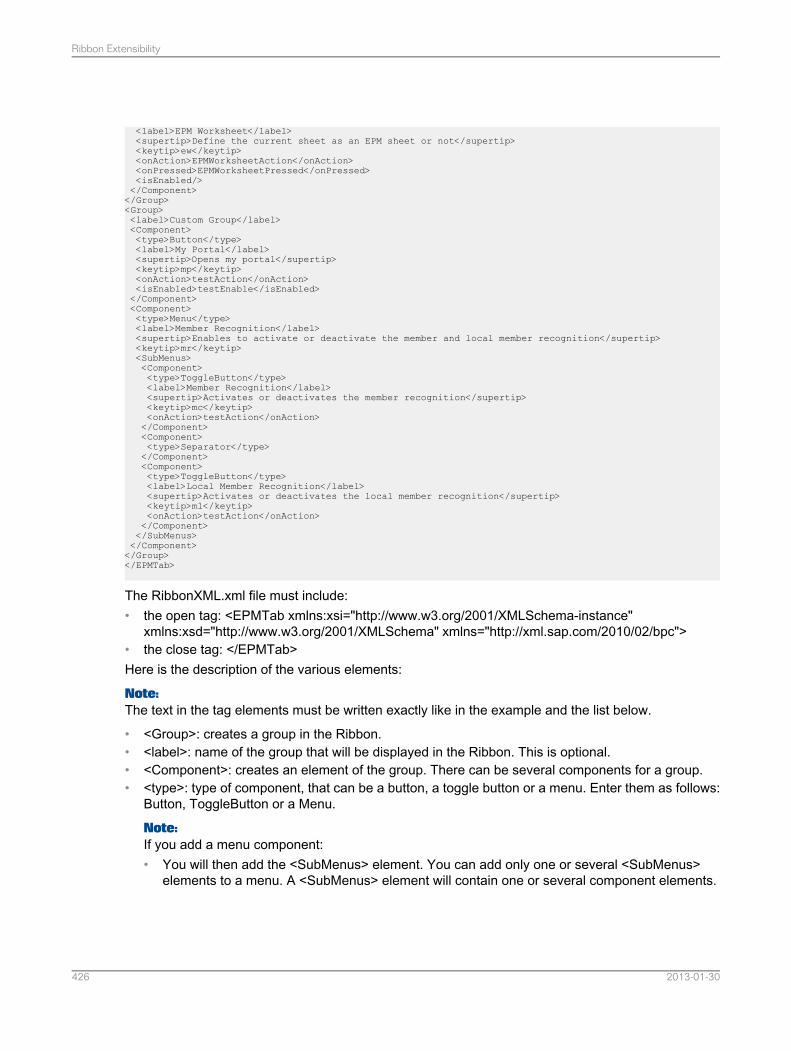
<label>EPM Worksheet</label><supertip>Define the current sheet as an EPM sheet or not</supertip><keytip>ew</keytip><onAction>EPMWorksheetAction</onAction><onPressed>EPMWorksheetPressed</onPressed><isEnabled/></Component></Group><Group><label>Custom Group</label><Component><type>Button</type><label>My Portal</label><supertip>Opens my portal</supertip><keytip>mp</keytip><onAction>testAction</onAction><isEnabled>testEnable</isEnabled></Component><Component><type>Menu</type><label>Member Recognition</label><supertip>Enables to activate or deactivate the member and local member recognition</supertip><keytip>mr</keytip><SubMenus><Component><type>ToggleButton</type><label>Member Recognition</label><supertip>Activates or deactivates the member recognition</supertip><keytip>mc</keytip><onAction>testAction</onAction></Component><Component><type>Separator</type></Component><Component><type>ToggleButton</type><label>Local Member Recognition</label><supertip>Activates or deactivates the local member recognition</supertip><keytip>ml</keytip><onAction>testAction</onAction></Component></SubMenus></Component></Group></EPMTab>
The RibbonXML.xml file must include:• the open tag: <EPMTab xmlns:xsi="http://www.w3.org/2001/XMLSchema-instance"
xmlns:xsd="http://www.w3.org/2001/XMLSchema" xmlns="http://xml.sap.com/2010/02/bpc">• the close tag: </EPMTab>Here is the description of the various elements:
Note:The text in the tag elements must be written exactly like in the example and the list below.
• <Group>: creates a group in the Ribbon.• <label>: name of the group that will be displayed in the Ribbon. This is optional.• <Component>: creates an element of the group. There can be several components for a group.• <type>: type of component, that can be a button, a toggle button or a menu. Enter them as follows:
Button, ToggleButton or a Menu.
Note:If you add a menu component:• You will then add the <SubMenus> element. You can add only one or several <SubMenus>
elements to a menu. A <SubMenus> element will contain one or several component elements.
2013-01-30426
Ribbon Extensibility
• You can add a grey separator line by adding the separator type of component:<Component><type>Separator</type></Component>
• <label>: label to be displayed for the component.• <supertip>: tooltip to be displayed when hovering on the component.
• <keytip>: keyboard shorcut for the component.
Note:You cannot define keyboard shortcuts for the components inside a menu.
• <onAction>: name of the macro to execute when clicking the component.
Note:If the macro is not saved in the current workbook (but in an .xla file that you have installed as anadd-in to Microsoft Excel), you must write each macro name as follows: [myFile.xla]![myMacro].
• <onPressed>: name of the macro to execute, which defines whether the toggle button is pressedor not. This parameter only applies to the toggle button type of component.
Note:If the macro is not saved in the current workbook (but in an .xla file that you have installed as anadd-in to Microsoft Excel), you must write each macro name as follows: [myFile.xla]![myMacro].
• <isEnabled>: name of the macro to execute, which defines whether the component is greyed outor not.
Note:If the macro is not saved in the current workbook (but in an .xla file that you have installed as anadd-in to Microsoft Excel), you must write each macro name as follows: [myFile.xla]![myMacro].
41.2 Ribbon Extensions: Advanced Method
Caution:As methods may change depending on the support package or the patch, you may have to adjust yourextensions, like any other custom development.
You can create extensions to the Ribbon using the . net framework.
This section provides detailed information on how to extend the Microsoft Office Excel, Word orPowerPoint Ribbon when using SAP BusinessObjects EPM Solutions, add-in for Microsoft Office.
You can extend the EPM tab of the Ribbon.
You can also add a new tab to the Ribbon.
.dllsYou can create as many .dll files as you want.
You can include one or more classes (=extensions) in one .dll file.
2013-01-30427
Ribbon Extensibility
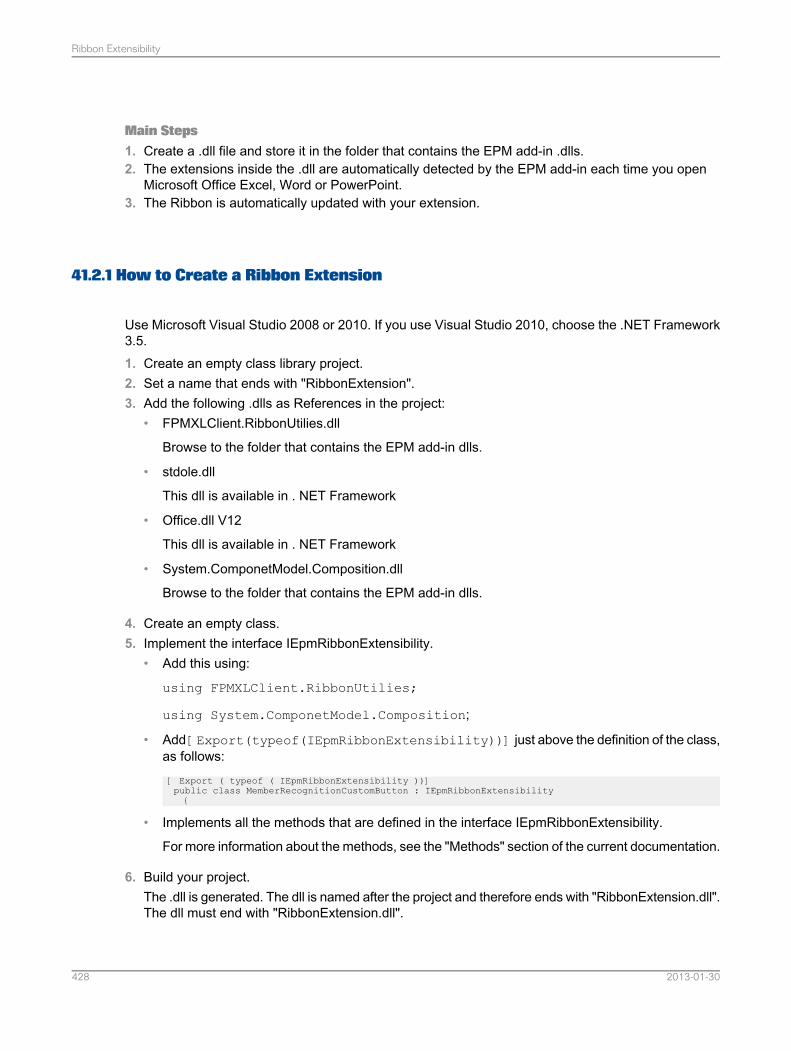
Main Steps1. Create a .dll file and store it in the folder that contains the EPM add-in .dlls.2. The extensions inside the .dll are automatically detected by the EPM add-in each time you open
Microsoft Office Excel, Word or PowerPoint.3. The Ribbon is automatically updated with your extension.
41.2.1 How to Create a Ribbon Extension
Use Microsoft Visual Studio 2008 or 2010. If you use Visual Studio 2010, choose the .NET Framework3.5.1. Create an empty class library project.2. Set a name that ends with "RibbonExtension".3. Add the following .dlls as References in the project:
• FPMXLClient.RibbonUtilies.dll
Browse to the folder that contains the EPM add-in dlls.
• stdole.dll
This dll is available in . NET Framework
• Office.dll V12
This dll is available in . NET Framework
• System.ComponetModel.Composition.dll
Browse to the folder that contains the EPM add-in dlls.
4. Create an empty class.5. Implement the interface IEpmRibbonExtensibility.
• Add this using:
using FPMXLClient.RibbonUtilies;
using System.ComponetModel.Composition;
• Add [Export(typeof(IEpmRibbonExtensibility))] just above the definition of the class,as follows:[ Export ( typeof ( IEpmRibbonExtensibility ))]public class MemberRecognitionCustomButton : IEpmRibbonExtensibility{
• Implements all the methods that are defined in the interface IEpmRibbonExtensibility.
For more information about the methods, see the "Methods" section of the current documentation.
6. Build your project.The .dll is generated. The dll is named after the project and therefore ends with "RibbonExtension.dll".The dll must end with "RibbonExtension.dll".
2013-01-30428
Ribbon Extensibility
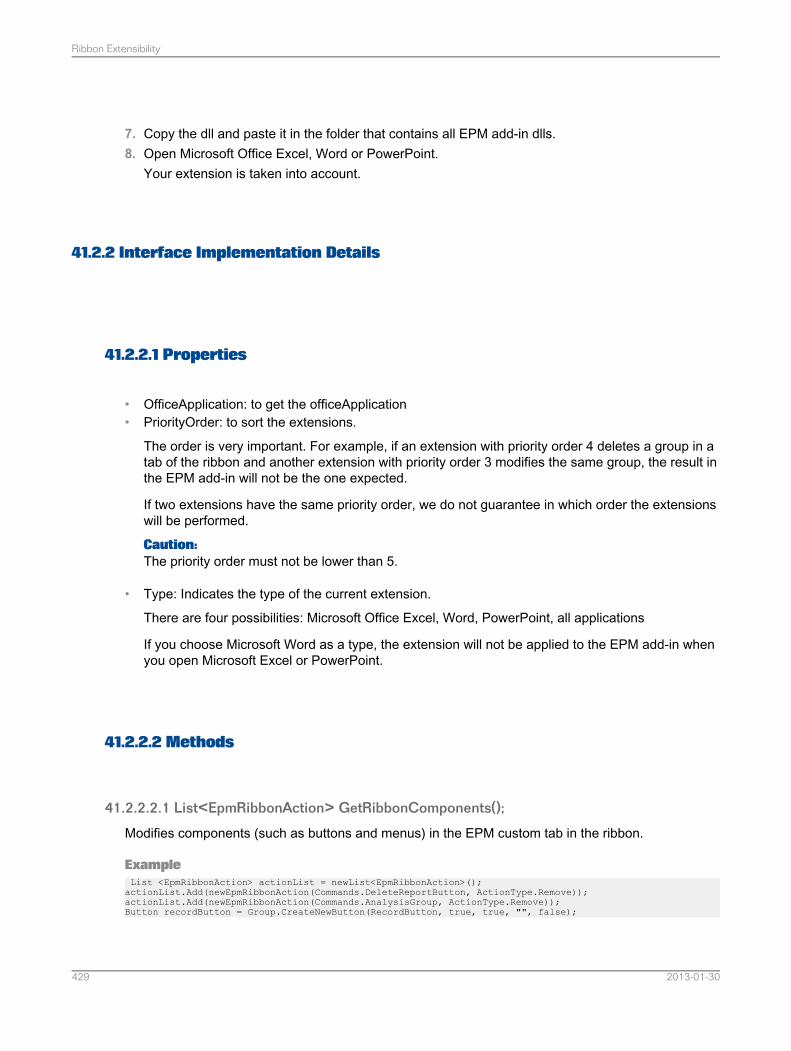
7. Copy the dll and paste it in the folder that contains all EPM add-in dlls.8. Open Microsoft Office Excel, Word or PowerPoint.
Your extension is taken into account.
41.2.2 Interface Implementation Details
41.2.2.1 Properties
• OfficeApplication: to get the officeApplication• PriorityOrder: to sort the extensions.
The order is very important. For example, if an extension with priority order 4 deletes a group in atab of the ribbon and another extension with priority order 3 modifies the same group, the result inthe EPM add-in will not be the one expected.
If two extensions have the same priority order, we do not guarantee in which order the extensionswill be performed.
Caution:The priority order must not be lower than 5.
• Type: Indicates the type of the current extension.
There are four possibilities: Microsoft Office Excel, Word, PowerPoint, all applications
If you choose Microsoft Word as a type, the extension will not be applied to the EPM add-in whenyou open Microsoft Excel or PowerPoint.
41.2.2.2 Methods
41.2.2.2.1 List<EpmRibbonAction> GetRibbonComponents();
Modifies components (such as buttons and menus) in the EPM custom tab in the ribbon.
ExampleList <EpmRibbonAction> actionList = newList<EpmRibbonAction>();actionList.Add(newEpmRibbonAction(Commands.DeleteReportButton, ActionType.Remove));actionList.Add(newEpmRibbonAction(Commands.AnalysisGroup, ActionType.Remove));Button recordButton = Group.CreateNewButton(RecordButton, true, true, "", false);
2013-01-30429
Ribbon Extensibility
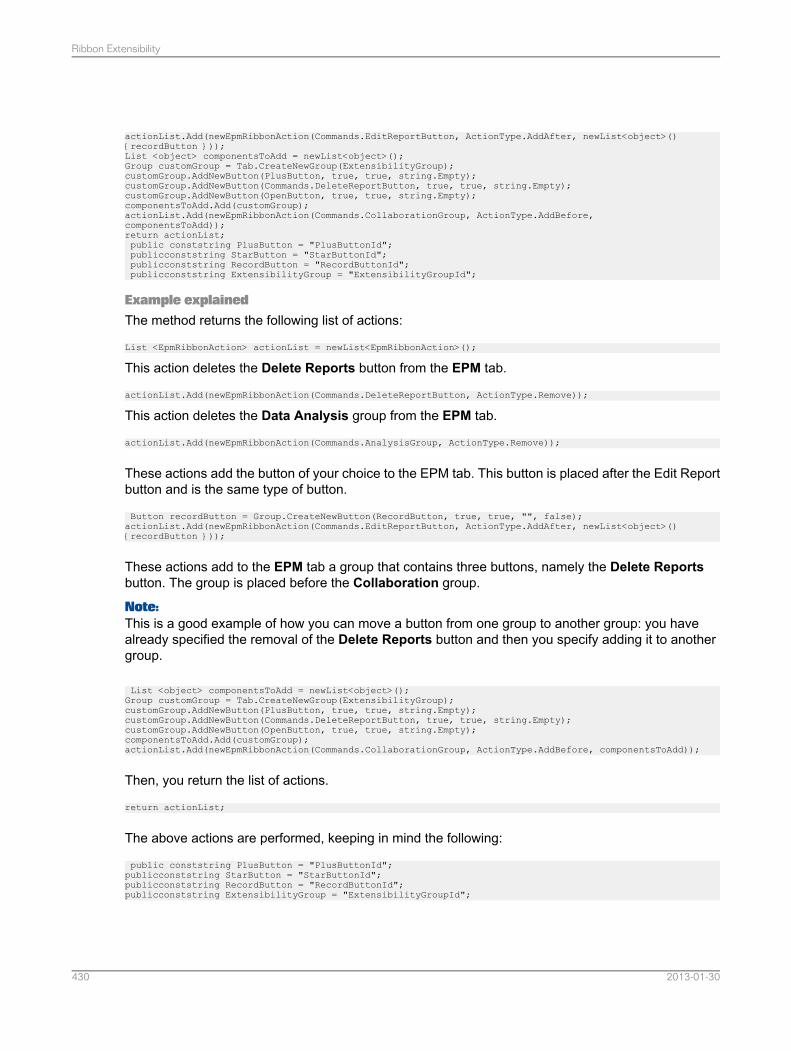
actionList.Add(newEpmRibbonAction(Commands.EditReportButton, ActionType.AddAfter, newList<object>(){recordButton }));List <object> componentsToAdd = newList<object>();Group customGroup = Tab.CreateNewGroup(ExtensibilityGroup);customGroup.AddNewButton(PlusButton, true, true, string.Empty);customGroup.AddNewButton(Commands.DeleteReportButton, true, true, string.Empty);customGroup.AddNewButton(OpenButton, true, true, string.Empty);componentsToAdd.Add(customGroup);actionList.Add(newEpmRibbonAction(Commands.CollaborationGroup, ActionType.AddBefore,componentsToAdd));return actionList;public conststring PlusButton = "PlusButtonId";publicconststring StarButton = "StarButtonId";publicconststring RecordButton = "RecordButtonId";publicconststring ExtensibilityGroup = "ExtensibilityGroupId";
Example explainedThe method returns the following list of actions:
List <EpmRibbonAction> actionList = newList<EpmRibbonAction>();
This action deletes the Delete Reports button from the EPM tab.
actionList.Add(newEpmRibbonAction(Commands.DeleteReportButton, ActionType.Remove));
This action deletes the Data Analysis group from the EPM tab.
actionList.Add(newEpmRibbonAction(Commands.AnalysisGroup, ActionType.Remove));
These actions add the button of your choice to the EPM tab. This button is placed after the Edit Reportbutton and is the same type of button.
Button recordButton = Group.CreateNewButton(RecordButton, true, true, "", false);actionList.Add(newEpmRibbonAction(Commands.EditReportButton, ActionType.AddAfter, newList<object>(){recordButton }));
These actions add to the EPM tab a group that contains three buttons, namely the Delete Reportsbutton. The group is placed before the Collaboration group.
Note:This is a good example of how you can move a button from one group to another group: you havealready specified the removal of the Delete Reports button and then you specify adding it to anothergroup.
List <object> componentsToAdd = newList<object>();Group customGroup = Tab.CreateNewGroup(ExtensibilityGroup);customGroup.AddNewButton(PlusButton, true, true, string.Empty);customGroup.AddNewButton(Commands.DeleteReportButton, true, true, string.Empty);customGroup.AddNewButton(OpenButton, true, true, string.Empty);componentsToAdd.Add(customGroup);actionList.Add(newEpmRibbonAction(Commands.CollaborationGroup, ActionType.AddBefore, componentsToAdd));
Then, you return the list of actions.
return actionList;
The above actions are performed, keeping in mind the following:
public conststring PlusButton = "PlusButtonId";publicconststring StarButton = "StarButtonId";publicconststring RecordButton = "RecordButtonId";publicconststring ExtensibilityGroup = "ExtensibilityGroupId";
2013-01-30430
Ribbon Extensibility
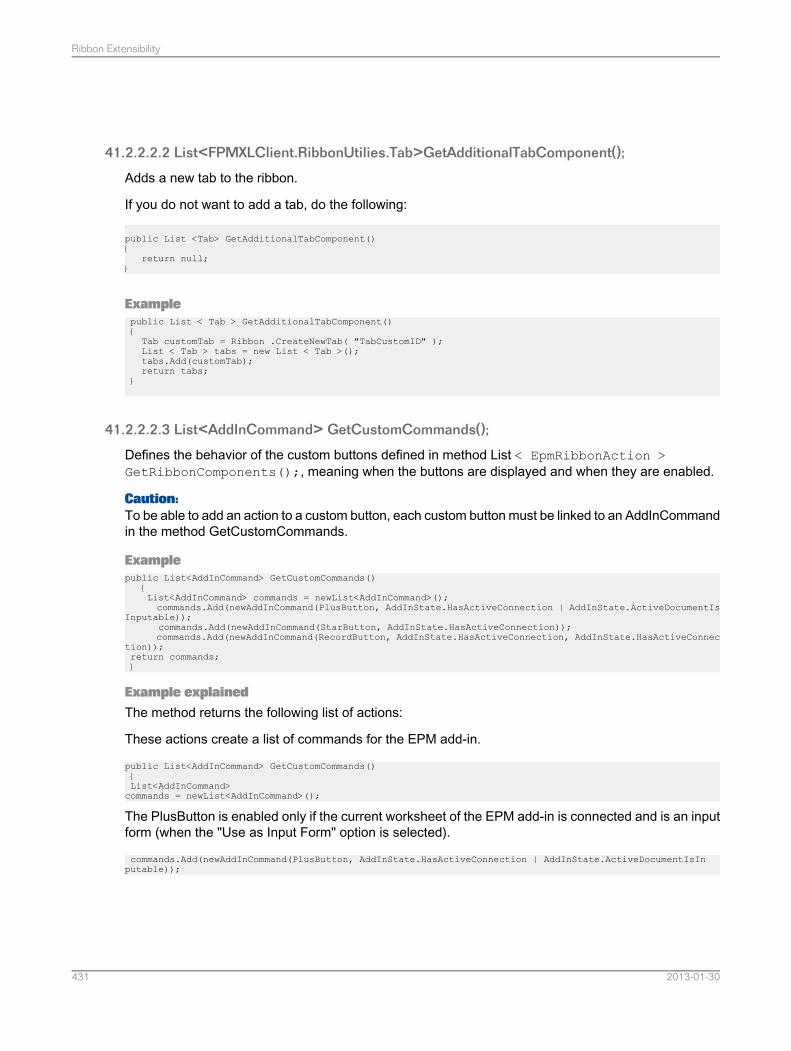
41.2.2.2.2 List<FPMXLClient.RibbonUtilies.Tab>GetAdditionalTabComponent();
Adds a new tab to the ribbon.
If you do not want to add a tab, do the following:
public List <Tab> GetAdditionalTabComponent(){
return null;}
Examplepublic List < Tab > GetAdditionalTabComponent(){Tab customTab = Ribbon .CreateNewTab( "TabCustomID" );List < Tab > tabs = new List < Tab >();tabs.Add(customTab);return tabs;
}
41.2.2.2.3 List<AddInCommand> GetCustomCommands();
Defines the behavior of the custom buttons defined in method List < EpmRibbonAction >GetRibbonComponents();, meaning when the buttons are displayed and when they are enabled.
Caution:To be able to add an action to a custom button, each custom button must be linked to an AddInCommandin the method GetCustomCommands.
Examplepublic List<AddInCommand> GetCustomCommands()
{List<AddInCommand> commands = newList<AddInCommand>();commands.Add(newAddInCommand(PlusButton, AddInState.HasActiveConnection | AddInState.ActiveDocumentIs
Inputable));commands.Add(newAddInCommand(StarButton, AddInState.HasActiveConnection));commands.Add(newAddInCommand(RecordButton, AddInState.HasActiveConnection, AddInState.HasActiveConnec
tion));return commands;}
Example explainedThe method returns the following list of actions:
These actions create a list of commands for the EPM add-in.
public List<AddInCommand> GetCustomCommands(){List<AddInCommand>commands = newList<AddInCommand>();
The PlusButton is enabled only if the current worksheet of the EPM add-in is connected and is an inputform (when the "Use as Input Form" option is selected).
commands.Add(newAddInCommand(PlusButton, AddInState.HasActiveConnection | AddInState.ActiveDocumentIsInputable));
2013-01-30431
Ribbon Extensibility
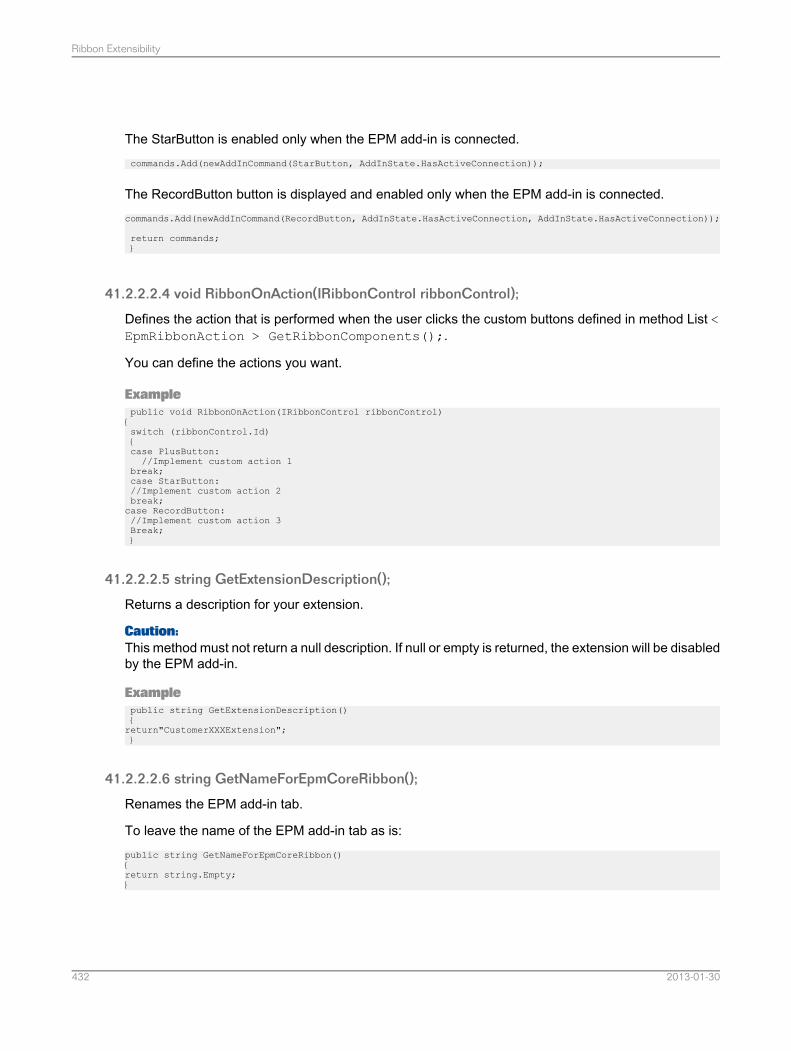
The StarButton is enabled only when the EPM add-in is connected.commands.Add(newAddInCommand(StarButton, AddInState.HasActiveConnection));
The RecordButton button is displayed and enabled only when the EPM add-in is connected.commands.Add(newAddInCommand(RecordButton, AddInState.HasActiveConnection, AddInState.HasActiveConnection));
return commands;}
41.2.2.2.4 void RibbonOnAction(IRibbonControl ribbonControl);
Defines the action that is performed when the user clicks the custom buttons defined in method List <EpmRibbonAction > GetRibbonComponents();.
You can define the actions you want.
Examplepublic void RibbonOnAction(IRibbonControl ribbonControl){switch (ribbonControl.Id){case PlusButton://Implement custom action 1
break;case StarButton://Implement custom action 2break;case RecordButton://Implement custom action 3Break;}
41.2.2.2.5 string GetExtensionDescription();
Returns a description for your extension.
Caution:This method must not return a null description. If null or empty is returned, the extension will be disabledby the EPM add-in.
Examplepublic string GetExtensionDescription(){return"CustomerXXXExtension";}
41.2.2.2.6 string GetNameForEpmCoreRibbon();
Renames the EPM add-in tab.
To leave the name of the EPM add-in tab as is:public string GetNameForEpmCoreRibbon(){return string.Empty;}
2013-01-30432
Ribbon Extensibility
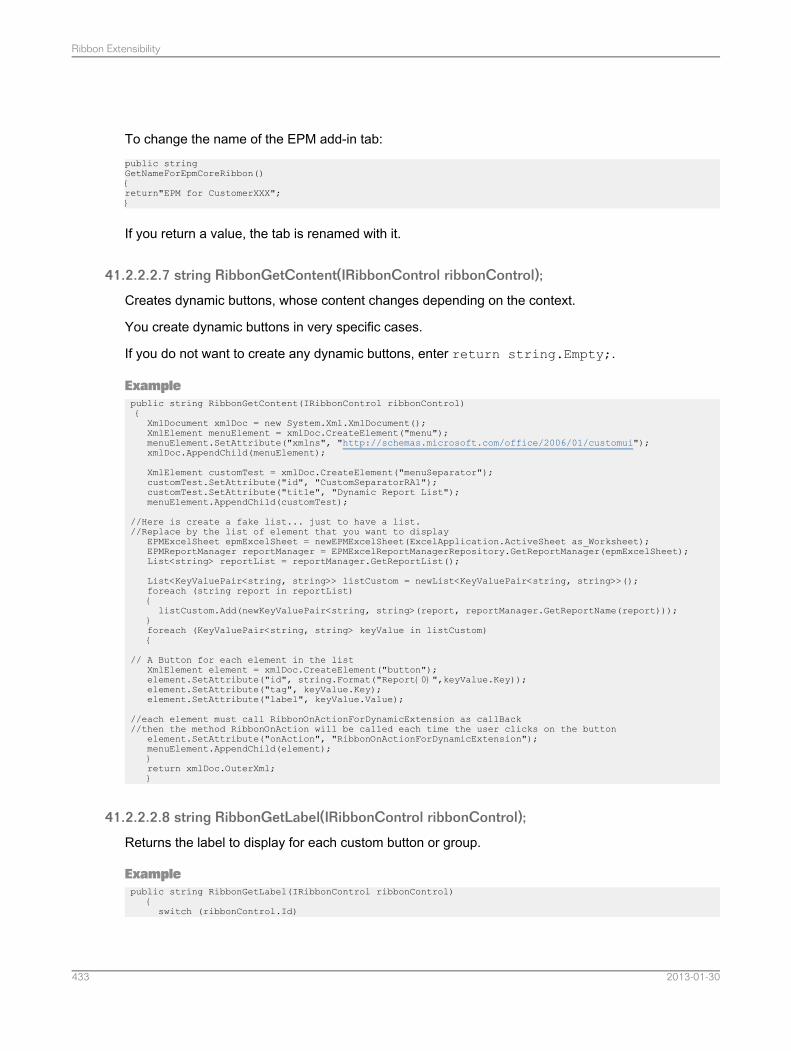
To change the name of the EPM add-in tab:public stringGetNameForEpmCoreRibbon(){return"EPM for CustomerXXX";}
If you return a value, the tab is renamed with it.
41.2.2.2.7 string RibbonGetContent(IRibbonControl ribbonControl);
Creates dynamic buttons, whose content changes depending on the context.
You create dynamic buttons in very specific cases.
If you do not want to create any dynamic buttons, enter return string.Empty;.
Examplepublic string RibbonGetContent(IRibbonControl ribbonControl){XmlDocument xmlDoc = new System.Xml.XmlDocument();XmlElement menuElement = xmlDoc.CreateElement("menu");menuElement.SetAttribute("xmlns", "http://schemas.microsoft.com/office/2006/01/customui");xmlDoc.AppendChild(menuElement);
XmlElement customTest = xmlDoc.CreateElement("menuSeparator");customTest.SetAttribute("id", "CustomSeparatorRA1");customTest.SetAttribute("title", "Dynamic Report List");menuElement.AppendChild(customTest);
//Here is create a fake list... just to have a list.//Replace by the list of element that you want to display
EPMExcelSheet epmExcelSheet = newEPMExcelSheet(ExcelApplication.ActiveSheet as_Worksheet);EPMReportManager reportManager = EPMExcelReportManagerRepository.GetReportManager(epmExcelSheet);List<string> reportList = reportManager.GetReportList();
List<KeyValuePair<string, string>> listCustom = newList<KeyValuePair<string, string>>();foreach (string report in reportList){listCustom.Add(newKeyValuePair<string, string>(report, reportManager.GetReportName(report)));
}foreach (KeyValuePair<string, string> keyValue in listCustom){
// A Button for each element in the listXmlElement element = xmlDoc.CreateElement("button");element.SetAttribute("id", string.Format("Report{0}",keyValue.Key));element.SetAttribute("tag", keyValue.Key);element.SetAttribute("label", keyValue.Value);
//each element must call RibbonOnActionForDynamicExtension as callBack//then the method RibbonOnAction will be called each time the user clicks on the button
element.SetAttribute("onAction", "RibbonOnActionForDynamicExtension");menuElement.AppendChild(element);}return xmlDoc.OuterXml;}
41.2.2.2.8 string RibbonGetLabel(IRibbonControl ribbonControl);
Returns the label to display for each custom button or group.
Examplepublic string RibbonGetLabel(IRibbonControl ribbonControl)
{switch (ribbonControl.Id)
2013-01-30433
Ribbon Extensibility
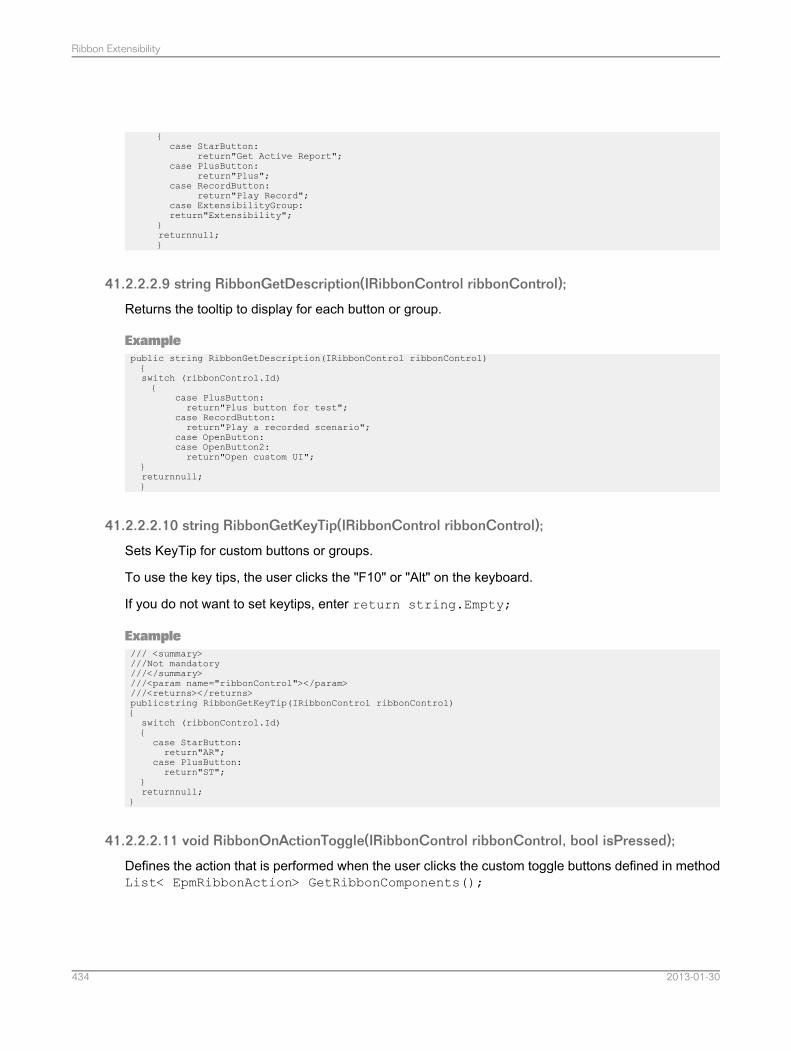
{case StarButton:
return"Get Active Report";case PlusButton:
return"Plus";case RecordButton:
return"Play Record";case ExtensibilityGroup:return"Extensibility";
}returnnull;}
41.2.2.2.9 string RibbonGetDescription(IRibbonControl ribbonControl);
Returns the tooltip to display for each button or group.
Examplepublic string RibbonGetDescription(IRibbonControl ribbonControl){switch (ribbonControl.Id){
case PlusButton:return"Plus button for test";
case RecordButton:return"Play a recorded scenario";
case OpenButton:case OpenButton2:return"Open custom UI";
}returnnull;}
41.2.2.2.10 string RibbonGetKeyTip(IRibbonControl ribbonControl);
Sets KeyTip for custom buttons or groups.
To use the key tips, the user clicks the "F10" or "Alt" on the keyboard.
If you do not want to set keytips, enter return string.Empty;
Example/// <summary>///Not mandatory///</summary>///<param name="ribbonControl"></param>///<returns></returns>publicstring RibbonGetKeyTip(IRibbonControl ribbonControl){switch (ribbonControl.Id){case StarButton:return"AR";
case PlusButton:return"ST";
}returnnull;
}
41.2.2.2.11 void RibbonOnActionToggle(IRibbonControl ribbonControl, bool isPressed);
Defines the action that is performed when the user clicks the custom toggle buttons defined in methodList< EpmRibbonAction> GetRibbonComponents();
2013-01-30434
Ribbon Extensibility
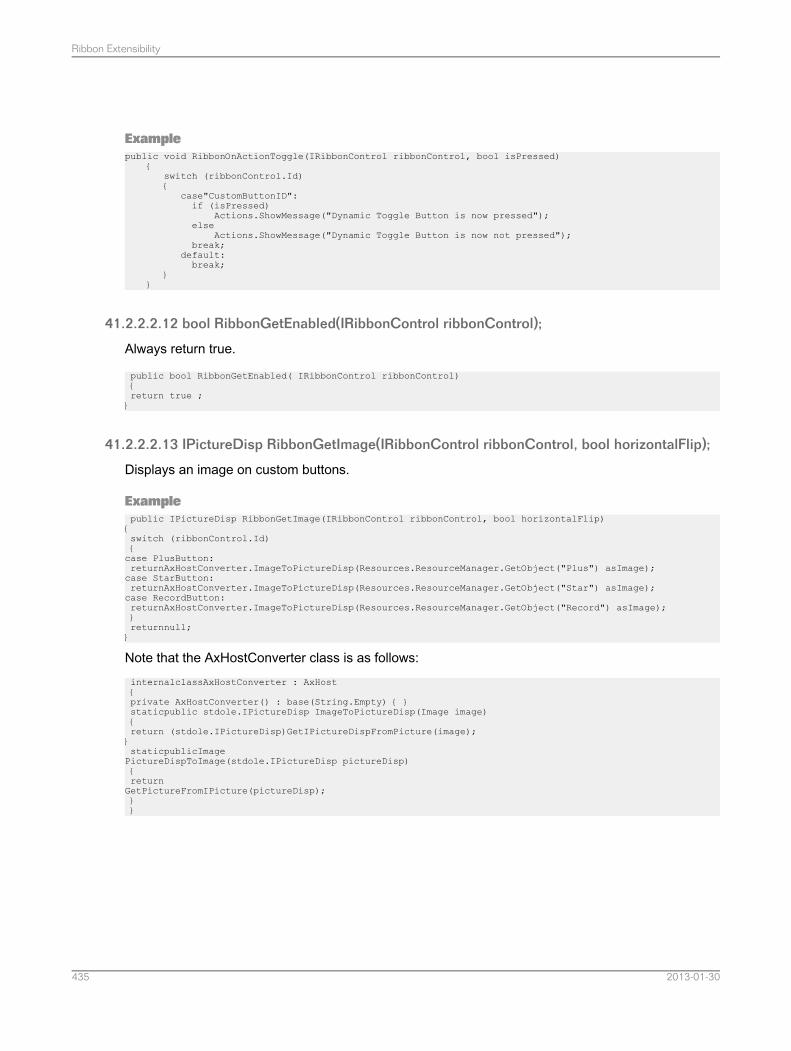
Examplepublic void RibbonOnActionToggle(IRibbonControl ribbonControl, bool isPressed)
{switch (ribbonControl.Id){
case"CustomButtonID":if (isPressed)
Actions.ShowMessage("Dynamic Toggle Button is now pressed");else
Actions.ShowMessage("Dynamic Toggle Button is now not pressed");break;
default:break;
}}
41.2.2.2.12 bool RibbonGetEnabled(IRibbonControl ribbonControl);
Always return true.
public bool RibbonGetEnabled( IRibbonControl ribbonControl){return true ;}
41.2.2.2.13 IPictureDisp RibbonGetImage(IRibbonControl ribbonControl, bool horizontalFlip);
Displays an image on custom buttons.
Examplepublic IPictureDisp RibbonGetImage(IRibbonControl ribbonControl, bool horizontalFlip){switch (ribbonControl.Id){case PlusButton:returnAxHostConverter.ImageToPictureDisp(Resources.ResourceManager.GetObject("Plus") asImage);case StarButton:returnAxHostConverter.ImageToPictureDisp(Resources.ResourceManager.GetObject("Star") asImage);case RecordButton:returnAxHostConverter.ImageToPictureDisp(Resources.ResourceManager.GetObject("Record") asImage);}returnnull;}
Note that the AxHostConverter class is as follows:internalclassAxHostConverter : AxHost{private AxHostConverter() : base(String.Empty) { }staticpublic stdole.IPictureDisp ImageToPictureDisp(Image image){return (stdole.IPictureDisp)GetIPictureDispFromPicture(image);}staticpublicImagePictureDispToImage(stdole.IPictureDisp pictureDisp){returnGetPictureFromIPicture(pictureDisp);}}
2013-01-30435
Ribbon Extensibility
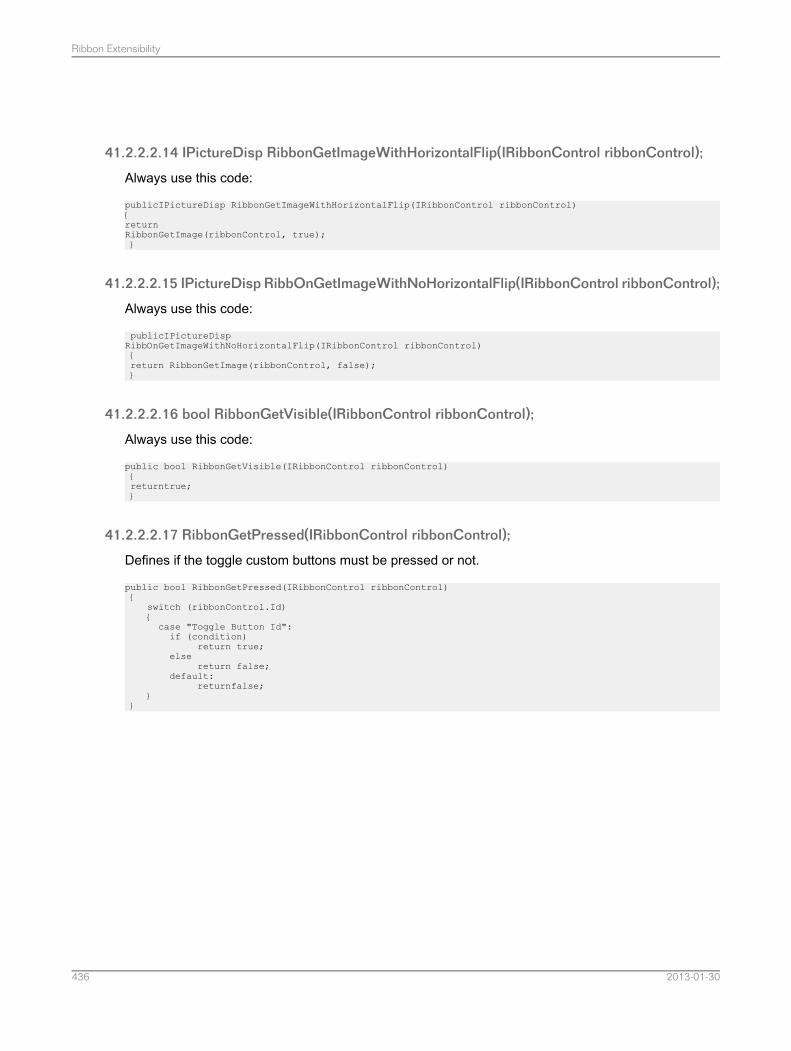
41.2.2.2.14 IPictureDisp RibbonGetImageWithHorizontalFlip(IRibbonControl ribbonControl);
Always use this code:
publicIPictureDisp RibbonGetImageWithHorizontalFlip(IRibbonControl ribbonControl){returnRibbonGetImage(ribbonControl, true);}
41.2.2.2.15 IPictureDisp RibbOnGetImageWithNoHorizontalFlip(IRibbonControl ribbonControl);
Always use this code:
publicIPictureDispRibbOnGetImageWithNoHorizontalFlip(IRibbonControl ribbonControl){return RibbonGetImage(ribbonControl, false);}
41.2.2.2.16 bool RibbonGetVisible(IRibbonControl ribbonControl);
Always use this code:
public bool RibbonGetVisible(IRibbonControl ribbonControl){returntrue;}
41.2.2.2.17 RibbonGetPressed(IRibbonControl ribbonControl);
Defines if the toggle custom buttons must be pressed or not.
public bool RibbonGetPressed(IRibbonControl ribbonControl){
switch (ribbonControl.Id){case "Toggle Button Id":if (condition)
return true;else
return false;default:
returnfalse;}
}
2013-01-30436
Ribbon Extensibility
Languages
• Application language. You can change the application language. The command names in the EPMtab are displayed in the language you have selected when you restart the application.
Note:If you have opened the EPM add-in from SAP BusinessObjects Enterprise BI launch pad, the add-ininherits the SAP BusinessObjects Enterprise BI launch pad application language defined for thecurrent user.
• Data language. You can change the data language. If the data language you select does not existin a cube or model, members are displayed in the cube/model default language. Because the EPMadd-in is integrated into Microsoft Office Excel, Word and PowerPoint, it inherits all the Windowsinternational settings for number and date defaults and formats.
When connecting to an SAP NetWeaver BW InfoCube, you choose the data language.
Note:If the language of the retrieval tool is not available in the SAP NetWeaver BW InfoCube, internalIDs will appear as names for the members.
To change the languages, use the Application Language and Data Language options in EPM >User Options.
2013-01-30437
Languages

2013-01-30438
Languages
About the EPM Add-In
You can consult the following information:• The current version of the EPM add-in, by selectingEPM >About >About EPMAdd-in. The screen
that opens states the EPM add-in version and copyright information.• The updates that are available, by selecting EPM > About > Check for Updates. For more
information about updates, see Update.
2013-01-30439
About the EPM Add-In

2013-01-30440
About the EPM Add-In
Migration
44.1 Extended Analytics Analyzer Report Migration
You can migrate reports created with SAP BusinessObjects Extended Analytics Analyzer 7.5.
To do so, open the workbook containing the reports. Then, follow one of these steps:• Perform a log on. All the reports are automatically connected if the connections are correctly defined.• Select Report Actions > Manage Connections > Report Connections and connect the reports
you want. If a cube has changed, you can change the connection for a reportThen, perform a refresh. All the members are identified as EPM members ("=EPMOlapMemberO" isdisplayed in the formula bar when you select a member in the report.)
The following items are not migrated: attribute filtering, Flash objects.
Note:The dynamic formatting sheet is migrated when you open the workbook. The structure levels are applied.
Caution:When you migrate the reports, Extended Analytics Analyzer should not be installed.
Related Topics• Logging On and Off• Connection Management
44.2 Planning and Consolidation EvDRE Migration
You can migrate EvDREs created with SAP BusinessObjects Planning and Consolidation 7.5.
This chapter aims to help you with the EvDRE migration by listing:• All the EvDRE items that are migrated.• The EvDRE items that are not migrated. Not all items are listed, as the possible cases are so
numerous. For certain items that are not migrated, the EPM add-in equivalent features that you willbe able to use in your reports after migration, are referred to in this chapter.
2013-01-30441
Migration
Note:As a general rule, when launching the migration, the items that cannot be migrated are listed in the logfile.
Caution:You cannot migrate a protected worksheet or workbook.
Note:
• When migrating sheets, the EV functions are kept and some of them continue to work with EPMadd-in. For more information on the EV functions that are not recognized by the EPM add-in, referto the SAP BusinessObjects EPM Solutions, add-in for Microsoft Office, What's New guide.
• What is called an "application" in version 7.5 of Planning and Consolidation is called "model" inversion 10. What is called "application set" in version 7.5 is called "environment" in version 10.
• An EvDRE can generate several reports.
44.2.1 EvDRE Formula
An EvDRE is migrated if:• Its formula does not contain another formula, therefore inserting additional parentheses.• Its formula contains only one or two separator characters, depending on the number of parameters,
two or three.So the EvDRE formula must be defined as follows to be migrated:• =EVDRE("ModelName",KeysRange). For example: =EVDRE("Planning",A14:B19)• Or =EVDRE("ModelName",KeysRange,ExpansionsRange). For example: =EVDRE("Plan
ning",A14:B19,A22:D28)
Note:
• The EvDRE formula, the KeysRange and the ExpansionsRange must be on the same sheet.Otherwise, the EvDRE is not migrated.
• It is not necessary to write the model name. You can alternatively reference a cell that containsthe model name. For example: =EVDRE(F2,A14:B19,A22:D28) where cell F2 contains themodel name. The model name can be in another worksheet. For example: =EVDRE(Sheet2!D8,A14:B19,A22:D28), where cell D8 of Sheet2 contains the model name.
44.2.2 KeysRange
The following ranges are migrated:• PageKeyRange. For more information, see KeysRange.• ColKeyRange. For more information, see RowKeyRange and ColKeyRange Members.• RowKeyRange. For more information, see RowKeyRange and ColKeyRange Members.
2013-01-30442
Migration
• FormatRange. For more information, see Format Migration.• OptionRange. For for more information, see OptionRange.
The following ranges are not migrated:• CellKeyRange. You can use the EPM add-in equivalent features, depending on what you want to
do: the Keep Formula on Data option, or local members. For more information, see Keep Formulaon Data and Show Source Data in Comments and Local Members.
• GetOnlyRange. You can use the EPM add-in equivalent feature: Read-only Data. For moreinformation, see Read-only Data.
• SortRange. You can use the EPM add-in equivalent feature: Data Sorting. For more information,see Data Sorting .
44.2.3 Report Members and Axes
The reports are migrated:• If there is no ExpansionsRange defined for the EvDRE, the reports are migrated based on the
definition of the EvDRE resulting reports in the sheet.
Note:In this case, the migrated reports will be static, they will not contain any dynamic member selection.
• If an ExpansionsRange is defined for the EvDRE, the reports are migrated based on theExpansionsRange content. For more information, see ExpansionsRange.
• The PageKeyRange members are migrated to what is called the "page axis" of a report in the EPMadd-in.
• The RowKeyRange members are migrated to what is called the "row axis" of a report in the EPMadd-in.
• The ColKeyRange members are migrated to what is called the "column axis" of a report in the EPMadd-in.
In an EPM add-in report (on a Planning and Consolidation connection), a dimension can be used onlyin one of the three axes (page, row or column). Therefore, if a dimension is used in the RowKeyRangeor the ColKeyRange, and also in the PageKeyRange, once migrated, the dimension remains in the rowor column axis, and the dimension is displayed in the page axis range just for your information, but itis not used and its member is not identified by a formula beginning with =EPMOlapMemberO(.
In some cases, members in the RowKeyRange or the ColKeyRange are not recognized as valid membersand are not migrated. For more information, see RowKeyRange and ColKeyRange Members.
The empty rows and columns contained in the EvDRE reports are migrated and remain in the migratedreports.
2013-01-30443
Migration
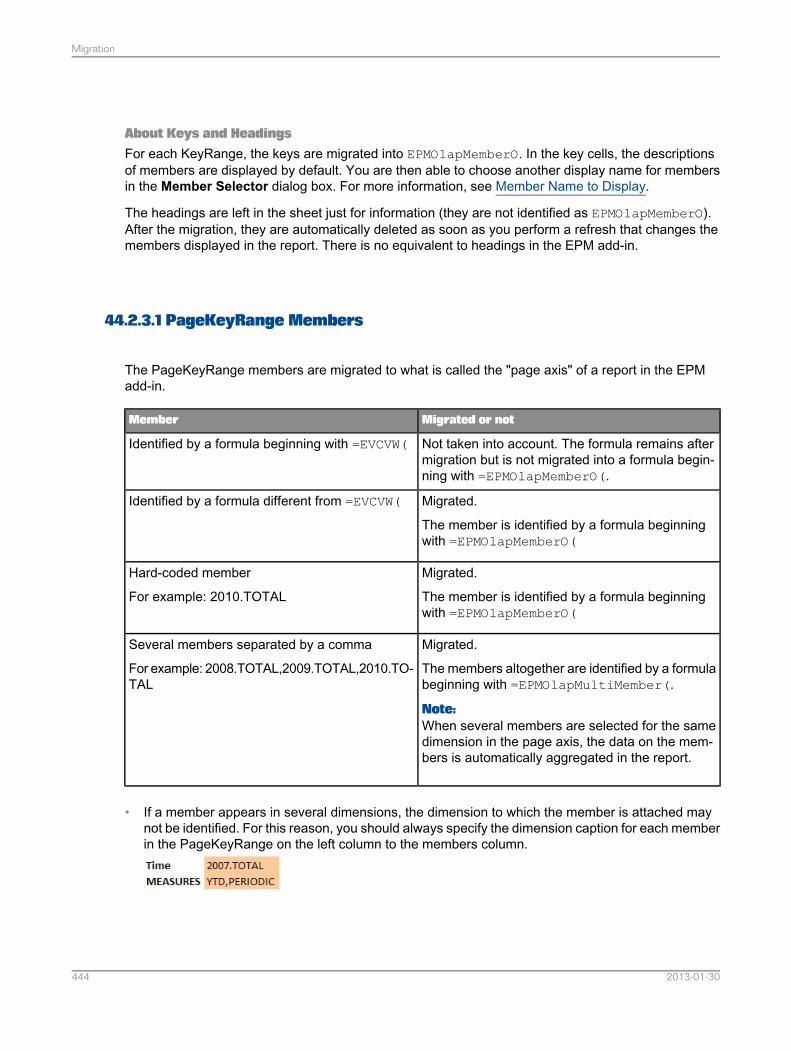
About Keys and HeadingsFor each KeyRange, the keys are migrated into EPMOlapMemberO. In the key cells, the descriptionsof members are displayed by default. You are then able to choose another display name for membersin the Member Selector dialog box. For more information, see Member Name to Display.
The headings are left in the sheet just for information (they are not identified as EPMOlapMemberO).After the migration, they are automatically deleted as soon as you perform a refresh that changes themembers displayed in the report. There is no equivalent to headings in the EPM add-in.
44.2.3.1 PageKeyRange Members
The PageKeyRange members are migrated to what is called the "page axis" of a report in the EPMadd-in.
Migrated or notMember
Not taken into account. The formula remains aftermigration but is not migrated into a formula begin-ning with =EPMOlapMemberO(.
Identified by a formula beginning with =EVCVW(
Migrated.
The member is identified by a formula beginningwith =EPMOlapMemberO(
Identified by a formula different from =EVCVW(
Migrated.
The member is identified by a formula beginningwith =EPMOlapMemberO(
Hard-coded member
For example: 2010.TOTAL
Migrated.
The members altogether are identified by a formulabeginning with =EPMOlapMultiMember(.
Note:When several members are selected for the samedimension in the page axis, the data on the mem-bers is automatically aggregated in the report.
Several members separated by a comma
For example: 2008.TOTAL,2009.TOTAL,2010.TO-TAL
• If a member appears in several dimensions, the dimension to which the member is attached maynot be identified. For this reason, you should always specify the dimension caption for each memberin the PageKeyRange on the left column to the members column.
2013-01-30444
Migration
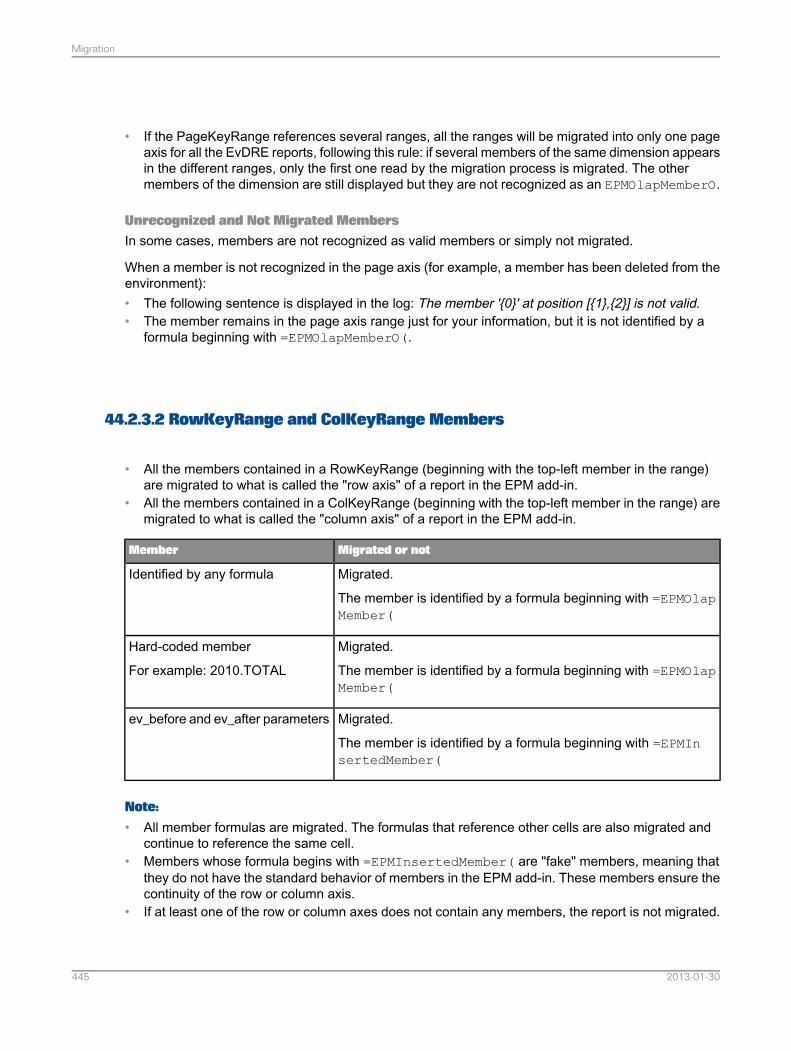
• If the PageKeyRange references several ranges, all the ranges will be migrated into only one pageaxis for all the EvDRE reports, following this rule: if several members of the same dimension appearsin the different ranges, only the first one read by the migration process is migrated. The othermembers of the dimension are still displayed but they are not recognized as an EPMOlapMemberO.
Unrecognized and Not Migrated MembersIn some cases, members are not recognized as valid members or simply not migrated.
When a member is not recognized in the page axis (for example, a member has been deleted from theenvironment):• The following sentence is displayed in the log: The member '{0}' at position [{1},{2}] is not valid.• The member remains in the page axis range just for your information, but it is not identified by a
formula beginning with =EPMOlapMemberO(.
44.2.3.2 RowKeyRange and ColKeyRange Members
• All the members contained in a RowKeyRange (beginning with the top-left member in the range)are migrated to what is called the "row axis" of a report in the EPM add-in.
• All the members contained in a ColKeyRange (beginning with the top-left member in the range) aremigrated to what is called the "column axis" of a report in the EPM add-in.
Migrated or notMember
Migrated.
The member is identified by a formula beginning with =EPMOlapMember(
Identified by any formula
Migrated.
The member is identified by a formula beginning with =EPMOlapMember(
Hard-coded member
For example: 2010.TOTAL
Migrated.
The member is identified by a formula beginning with =EPMInsertedMember(
ev_before and ev_after parameters
Note:
• All member formulas are migrated. The formulas that reference other cells are also migrated andcontinue to reference the same cell.
• Members whose formula begins with =EPMInsertedMember( are "fake" members, meaning thatthey do not have the standard behavior of members in the EPM add-in. These members ensure thecontinuity of the row or column axis.
• If at least one of the row or column axes does not contain any members, the report is not migrated.
2013-01-30445
Migration
• When there is more than one dimension in a row or in a column axis and if one member is notrecognized, the entire row or column is not valid. See below.
• When migrated, the Microsoft Office Excel "General" number format is automatically applied to allthe cells of the row and column axes.
• All the merged cells in the row and column axes are automatically unmerged during the migrationprocess.
Unrecognized and Not Migrated MembersIn some cases, members are not recognized as valid members or simply not migrated.
When a member is not recognized in a row or page axis (for example, a member has been deletedfrom the database):• The following sentence is displayed in the log: The member '{0}' at position [{1},{2}] is not valid for
the dimension '{3}'• The member cell is colored in magenta on a row or column created temporarily. You can easily spot
the members that you will not find in your report.
As soon as you perform a refresh on the report, the temporary rows and columns for the unrecognizedmembers are deleted. For more information, see After Migration.
44.2.3.3 About Axes
About Axes• The EPM add-in does not support reports when the page axis is not above both row and column
axes. Therefore, if a PageKeyRange is not above the RowKeyRange and ColKeyRange, the reportis not migrated. To ensure that you can migrate the report, move the PageKeyRange above theRowKeyRange and ColKeyRange.
• The EPM add-in does not support reports when the column axis is under the row axis. Therefore,if a ColKeyRange is under the RowKeyRange, the report is not migrated.
• When the RowKeyRange is on the right side of the ColKeyRange, the report is migrated.• If two EvDREs reference a part of the same report range (meaning at least one cell in common and
not the full range),whether it is the PageKeyRange, the RowKeyRange or ColKeyRange: only thereport that is overriden by the other report is migrated.
• If a report is located between the data range and the RowKeyRange or the data range andColKeyRange of another report, only one report is migrated (the first one that is read during themigration process). To migrate both reports, move the inside report outside of the other report.
• If an EvDRE contains several report ranges, the number of reports is determined as follows: theRowKeyRange contains more than one range and the ColKeyRange also; the lowest number ofranges determines the number of reports to be migrated.
For example, if the RowKeyRange contains two ranges and the ColKeyRange contains three ranges,two reports are created.• The first report will use the first range of the RowKeyRange and the first range of the ColKeyRange.• The second report will use the second range of the RowKeyRange and:
2013-01-30446
Migration
• the second and third ranges of the ColKeyRange, if the ranges are on the same row.• the second range of the ColKeyRange (and the third range is not migrated), if the ranges are
not on the same row.
Shared KeyRangesAs a general rule, the EPM add-in supports the share of an entire axis (meaning the exact same rangeof cells), not just a part of it.
Caution:Also, an axis can be shared only if the reports that share the axis are on the same model. If two reportson a different model share a KeyRange, the migration process unshares the KeyRange and the followingmessage is displayed in the log file: Range row [ ] - column [ ], row [ ] - column [ ] is used by 2 differentEVDRE reports, but on different models ([model name] <-> [model name] ): axis sharing is not bepossible. Only one report is migrated (the first one that is read during the migration process).
• "Butterfly" reports are migrated.• If two reports share the same ColKeyRange, and the RowKeyRange of report 2 is not aligned on
the RowKeyRange of report 1, after migration, the two row axes will be automatically aligned. Samecase if you have two ColKeyRange that are not aligned.
• If two reports share an axis: if report 000 is valid and 001 is not valid and therefore not migrated,report 000 is migrated and does not share an axis with report 001.
• If two EvDREs in the same sheet reference the exact same ColKeyRange and RowKeyRange, thesecond EvDRE is not migrated.
• If two EvDREs in the same sheet reference a range that is part of another EvDRE ColKeyRange orRowKeyRange, the second EvDRE is not migrated.
• If one EvDRE contains two reports that share the same PageKeyRange, for example:• Report 2 contains the Time dimension in the ColKeyRange or RowKeyRange and in the
PageKeyRange. After migration, Time will not be included in the page axis.• Since both reports share the PageKeyRange, after migration, the Time dimension will not be part
of report 1.
44.2.4 ExpansionsRange
Here is the list of ExpansionsRange parameters that are migrated and the ones that are not migrated.
The parameters below are migrated:• ExpandIn. COL and ROW are migrated. SHEET is not migrated.
Note:About SHEET:• If reports have already been generated based on the SHEET parameter, the reports can be
migrated.• The EPM add-in equivalent feature is: Workbook Sheet Automatic Generation.
2013-01-30447
Migration
• Dimension.• MemberSet. See MemberSet.• BeforeRange. See BeforeRange and AfterRange.• AfterRange. See BeforeRange and AfterRange.
The values below are not migrated:• Suppress. You can use the EPM add-in equivalent feature: the Remove Empty options for rows or
columns. See No Data and Zero Values.• Insert. You can use the EPM add-in equivalent feature: entering members directly in a sheet or using
the Member Selector dialog box. See Member Entry Directly in a Sheet and Member Entry Usingthe Member Selector.
Note:During the migration process, the ExpansionsRange is read from left to right. When there are severaldimensions in an axis, the inner and outer dimensions are therefore kept in the original order.
44.2.4.1 MemberSet
Following is the list of MemberSet values that are migrated and the ones that are not migrated:
Note:To ensure that members are recognized as members, enter member names in ' ' (single quotes) or " "(quotation marks) when member names contain spaces or special characters.
Hard-codedHard-coded values are migrated, whether they are static (for example: 2007.TOTAL) or dynamic (forexample: LDEP(2,2008.TOTAL,Y)).
Note:When several members are specified, the members are migrated only if the delimiter character is acomma.
FormulaAny formula is migrated, based on the EPM function called "EPMDimensionOverride".
In the EPMDimensionOverride function, the ReportID parameter will specify one or more reports, theDimension parameter will specify the dimension and the Members parameter will specify the migratedformula.
For more information, see EPMDimensionOverride.
After migration, in the MemberSet row, the cell that contains the EPMDimensionOverride functionappears in yellow.
2013-01-30448
Migration
Caution:To ensure that the migrated report continues to function, do not delete the cell in yellow. You can moveit to another cell in the sheet. For more information, see After Migration.
RangeThe following two ways of entering a range are supported: =EVRNG( and A5:D8
• When a range is defined for a row axis:• The members in the first column are migrated.
• If the members are not only in the first column but in other columns, the members are ignoredand therefore not migrated.
• If a cell in the first column does not contain any members, the cell is still migrated into whatis called a "local member" in the EPM add-in. This local member is attached to the memberin the above cell.
• If a member is not recognized as a valid member, it is however migrated into an empty localmember.
Note:For more information on local members, see Local Members.
• If none of the members in the first column of the range are recognized as valid members, thefollowing text is displayed in the log: The expansion range [Q4:Q6] should contain at leastone recognized member.
• The other columns of the range are migrated, based on the EPM function EPMCopyRange.
In the EPMCopyRange function, the ReportID parameter will specify the report, the Rowsparameter will specify TRUE and the SourceRange parameter will specify all the columns of therange except for the first column.
For more information, see EPMCopyRange.
After migration, in the MemberSet row, the cell that contains the EPMCopyRange function appearsin yellow.
Caution:To ensure that the migrated report continues to function, do not delete the cell in yellow. You canmove it to another cell in the sheet. For more information, see After Migration.
Example:In this EvDRE:• The second row references a range (N12:Q14).• In the first column of the range, there are the members ACTUAL and FORECAST, and the third
cell does not contain any member.• The range contains three other columns.
2013-01-30449
Migration
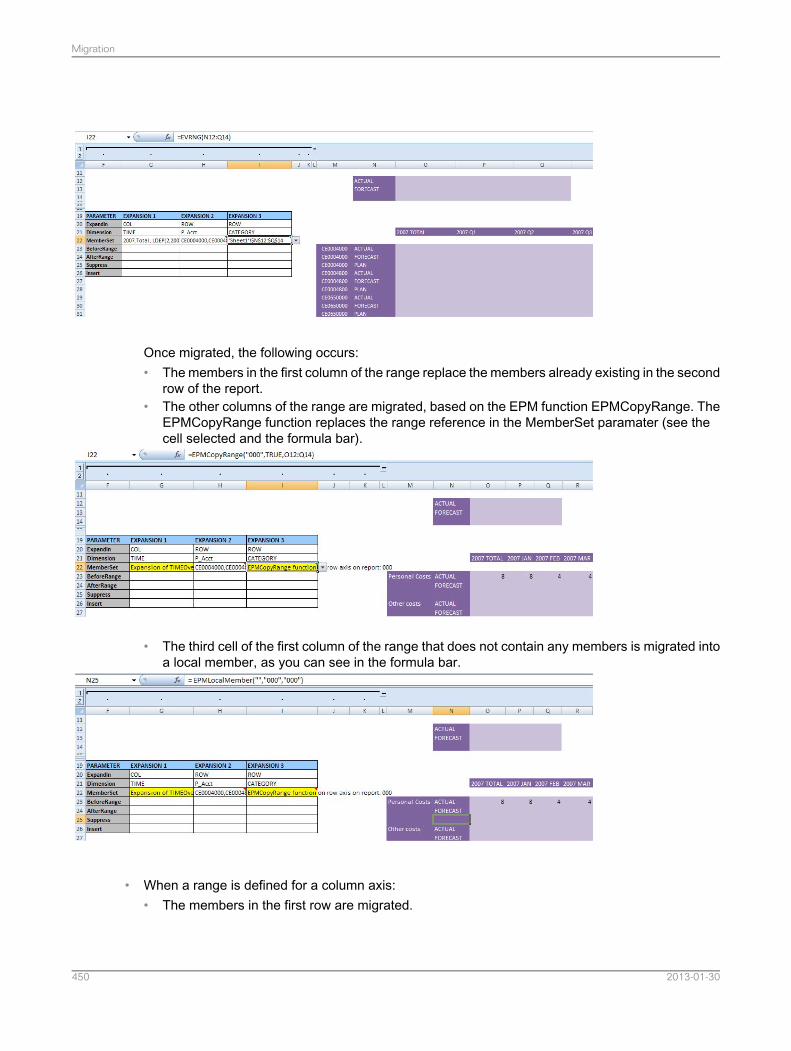
Once migrated, the following occurs:• The members in the first column of the range replace the members already existing in the second
row of the report.• The other columns of the range are migrated, based on the EPM function EPMCopyRange. The
EPMCopyRange function replaces the range reference in the MemberSet paramater (see thecell selected and the formula bar).
• The third cell of the first column of the range that does not contain any members is migrated intoa local member, as you can see in the formula bar.
• When a range is defined for a column axis:• The members in the first row are migrated.
2013-01-30450
Migration
• If the members are not only in the first row but in other rows, the members are ignored andtherefore not migrated.
• If a cell in the first row does not contain a member, the cell is still migrated into what is calleda "local member" in the EPM add-in. This local member is attached to the member in the leftcell.
• If a member is not recognized as a valid member, it is however migrated into an empty localmember.
• If none of the members in the first row of the range are recognized as valid members, thefollowing text is displayed in the log: The expansion range [Q4:Q6] should contain at leastone recognized member.
• The other rows of the range are migrated, based on the EPM function called "EPMCopyRange".
In the EPMCopyRange function, the ReportID parameter will specify one or more reports, theRows parameter will specify FALSE and the SourceRange parameter will specify all the rows ofthe range except for the first row.
For more information, see EPMCopyRange.
After migration, in the MemberSet row, the cell that contains the EPMCopyRange function appearsin yellow.
Caution:To ensure that the migrated report continues to function, do not delete the cell in yellow. You canmove it to another cell in the sheet. For more information, see After Migration.
Note:If no member is recognized in the axis of a report, but the MemberSet members are valid, the membersfrom the context are applied in the axis after the migration. Once you refresh the sheet, the membersspecified in the MemberSet replace the members in the report axis.
44.2.4.2 BeforeRange and AfterRange
The following two ways of entering a range are supported: =EVRNG( and A5:D8
The ranges for BeforeRange and AfterRange are migrated, based on the EPM function called"EPMInsertCellsBeforeAfterBlock".
In the EPMInsertCellsBeforeAfterBlock function: the ReportID parameter will specify the report; theDimension parameter will specify the dimension; the Before parameter will specify TRUE to insert thecells before the dimension members, FALSE to insert the cells after the dimension members; the Rangeparameter will specify the entire migrated range.
For more information, see EPMInsertCellsBeforeAfterBlock.
After migration, in the BeforeRange or AfterRange row, the cell that contains theEPMInsertCellsBeforeAfterBlock function appears in yellow.
2013-01-30451
Migration
Caution:To ensure that the migrated report continues to function, do not delete the cell in yellow. You can moveit to another cell in the sheet. For more information, see After Migration.
44.2.5 SortRange
The SortRange is not migrated. You can use the EPM add-in equivalent feature: Data Sorting. For moreinformation, see Data Sorting . Also, for more information about the EPM add-in equivalent feature forthe InsertAfter and InsertBefore parameters, see Member Sorting and Grouping by Properties.
44.2.6 OptionRange
Note:
• For each option, the values supported and therefore migrated are: Y, Yes, N, No. The other valuesare not migrated.
• When several options are specified, the options are migrated only if the delimiter character is acomma. For example: AutoFitCol=Y,NoRefresh=N
The following options are migrated:• AutoFitCol. Equivalent feature in the EPM add-in: Auto Fit Column Width.• NoRefresh. Equivalent feature in the EPM add-in: Freeze Data Refresh.• NoSend. Equivalent feature in the EPM add-in: Use as Input Form.• ShowComments. Equivalent feature in the EPM add-in: Keep Formula on Data and Show Source
Data in Comments .• SQLOnly. Equivalent feature in the EPM add-in: Display only Base Level Data.• ShowNullAsZero. Equivalent feature in the EPM add-in: Empty Cell Default Value .• SumParent. Equivalent feature in the EPM add-in: Calculate Parents in Hierarchies.• SuppressNodata.
• When the value is N or No, after migration, the Remove Empty options for rows and columnsare selected in the EPM add-in. You can view these options in the Sheet options and theOptionstab of the Report Editor. See No Data and Zero Values.
• When the value is Y or Yes, after migration, in the EPM add-in, the Remove options for emptyrows and columns are selected and a filter on rows that contain 0 is created so that rows withzero are not displayed in the report. You can view these options in the Sheet options and theOptions tab of the Report Editor. You can view filter on 0 data in the Data Filtering tab of theReport Editor. See No Data and Zero Values.
2013-01-30452
Migration
Note:In the EPM add-in, some options that apply to a specific report cannot inherit the sheet options. In thiscase, the inheritance option is automatically deselected and the following text is displayed in the log:Deactivate Sheet Options Inheritance. For more information on the report options inheritance, seeReport Options.
The following options are not migrated:• Bottom. Equivalent feature in the EPM add-in: Data Ranking.• DumpDataCache. Equivalent feature in the EPM add-in: Metadata Cache.• ExpandOnly.
Caution:If the ExpandOnly option is set to Y or YES, the entire EvDRE is not migrated and the following textis displayed in the log: Warn: The EVDRE function in cell [cell reference] will not be migrated becausethe option expandOnly is true.
• GroupExpansion. Equivalent feature in the EPM add-in: Ownership-based Hierarchies.• HideColKeys. In the EPM add-in, you can choose the name you want to display for members.
Member Name to Display• HideRowKeys. In the EPM add-in: you can choose the name you want to display for members.
Member Name to Display• PctInput.• QueryEngine.• QueryType.• QueryViewName.• SortCol. Equivalent feature in the EPM add-in: Member Sorting and Grouping feature in the
Member Selector. See Member Sorting and Grouping by Properties.• SuppressDataCol. Equivalent feature in the EPM add-in: Excluding Members.• SuppressDataRow. Equivalent feature in the EPM add-in: Excluding Members.• Top. Equivalent feature in the EPM add-in: Data Ranking.
44.2.7 Format Migration
When migrating an EvDRE, the format settings are also migrated and stored in what is called a dynamicformatting sheet in the EPM add-in. For each EvDRE migrated, one dynamic formatting sheet is createdand is applied to all the EvDRE reports.
Note:
• However, if several EvDRE reference the exact same FormatRange, only one dynamic formattingsheet will be created in the EPM add-in.
• All the format settings that are not specified in an EvDRE are left blank in the EPM dynamic formattingsheet (in the Use column cells), meaning that no format is applied.
2013-01-30453
Migration
• If several formatting sheets are generated during the migration process, they are named as followsand do not exceed 31 characters: [full or partial name of the sheet containing the EvDRE]_000. Thefollowing sheets are incremented: 001, 002, and so on.
Related Topics• Dynamic Formatting Template Definition
44.2.7.1 Format Range
FormatRange is migrated into a dynamic formatting sheet in the EPM add-in.• When the FormatRange is left blank, a formatting sheet is created based on the following:
• The format of the top-left cell of the RowKeyRange is applied in the formatting sheet as the rowdefault format for headers.
• The format of the top-left cell of the ColKeyRange is applied in the formatting sheet as the columndefault format for headers.
• The format of the top-left cell of the data range is applied in the formatting sheet as the row andcolumn default format for data.
• The format of the top-left cell of the PageKeyRange is applied in the formatting sheet as the pageaxis default format for headers.
• When the FormatRange value is one cell, a formatting sheet is created based on the following:• The format of the top-left cell of the RowKeyRange is applied in the formatting sheet as the row
default format for headers.• The format of the top-left cell of the ColKeyRange is applied in the formatting sheet as the column
default format for headers.• The format of referenced cell is applied in the formatting sheet as the row and column default
format for data.• The format of the top-left cell of the PageKeyRange is applied in the formatting sheet as the page
axis default format for headers.• When the FormatRange value is greater than one cell and references a full set of formatting features
(within six columns), a formatting sheet is created based on these features. For more information,see Columns of the Formatting Range.
44.2.7.2 Columns of the Formatting Range
When the FormatRange value is greater than one cell and references a full set of formatting features(within six columns), a dynamic formatting sheet is created based on these features, in the EPM add-in.
2013-01-30454
Migration
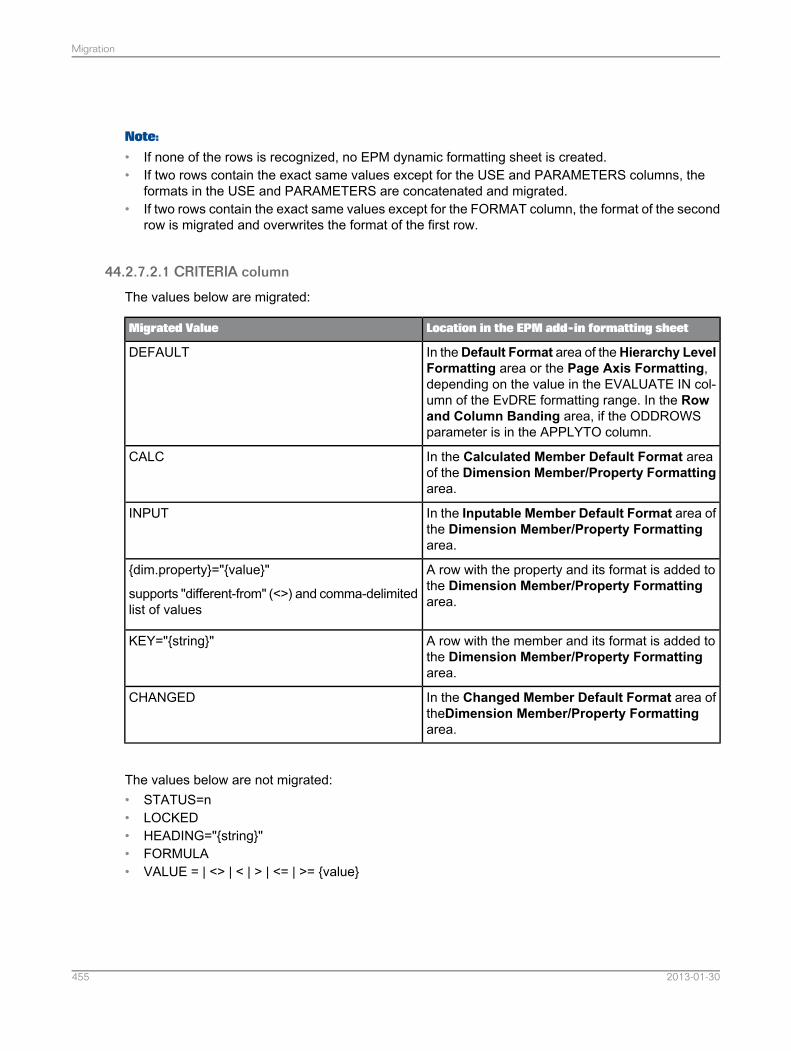
Note:
• If none of the rows is recognized, no EPM dynamic formatting sheet is created.• If two rows contain the exact same values except for the USE and PARAMETERS columns, the
formats in the USE and PARAMETERS are concatenated and migrated.• If two rows contain the exact same values except for the FORMAT column, the format of the second
row is migrated and overwrites the format of the first row.
44.2.7.2.1 CRITERIA column
The values below are migrated:
Location in the EPM add-in formatting sheetMigrated Value
In theDefault Format area of theHierarchy LevelFormatting area or the Page Axis Formatting,depending on the value in the EVALUATE IN col-umn of the EvDRE formatting range. In the Rowand Column Banding area, if the ODDROWSparameter is in the APPLYTO column.
DEFAULT
In the Calculated Member Default Format areaof the Dimension Member/Property Formattingarea.
CALC
In the Inputable Member Default Format area ofthe Dimension Member/Property Formattingarea.
INPUT
A row with the property and its format is added tothe Dimension Member/Property Formattingarea.
{dim.property}="{value}"
supports "different-from" (<>) and comma-delimitedlist of values
A row with the member and its format is added tothe Dimension Member/Property Formattingarea.
KEY="{string}"
In the Changed Member Default Format area oftheDimension Member/Property Formattingarea.
CHANGED
The values below are not migrated:• STATUS=n• LOCKED• HEADING="{string}"• FORMULA• VALUE = | <> | < | > | <= | >= {value}
2013-01-30455
Migration
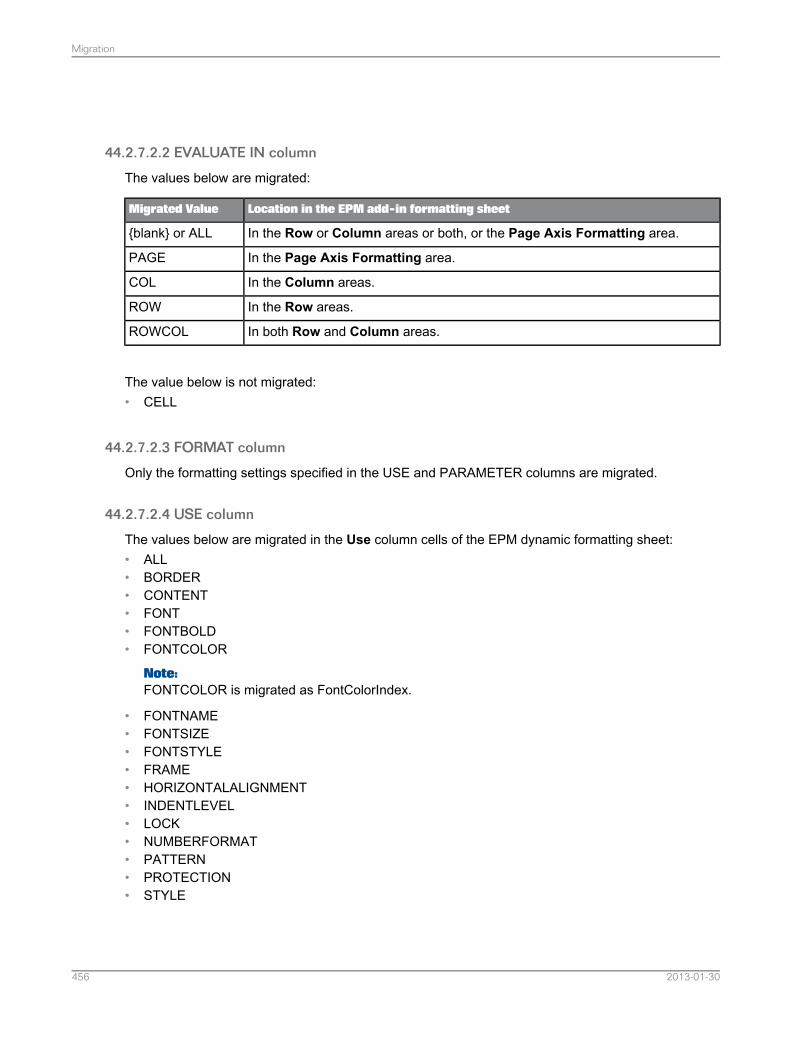
44.2.7.2.2 EVALUATE IN column
The values below are migrated:
Location in the EPM add-in formatting sheetMigrated Value
In the Row or Column areas or both, or the Page Axis Formatting area.{blank} or ALL
In the Page Axis Formatting area.PAGE
In the Column areas.COL
In the Row areas.ROW
In both Row and Column areas.ROWCOL
The value below is not migrated:• CELL
44.2.7.2.3 FORMAT column
Only the formatting settings specified in the USE and PARAMETER columns are migrated.
44.2.7.2.4 USE column
The values below are migrated in the Use column cells of the EPM dynamic formatting sheet:• ALL• BORDER• CONTENT• FONT• FONTBOLD• FONTCOLOR
Note:FONTCOLOR is migrated as FontColorIndex.
• FONTNAME• FONTSIZE• FONTSTYLE• FRAME• HORIZONTALALIGNMENT• INDENTLEVEL• LOCK• NUMBERFORMAT• PATTERN• PROTECTION• STYLE
2013-01-30456
Migration
• VERTICALALIGNMENT
Note:When a list of values is specified:• The values are migrated only if the delimiter character is a comma.• The comma is migrated as a vertical bar (pipe) character.
The value below is not migrated:• {VBA property}
44.2.7.2.5 PARAMETERS column
The values below are migrated, also in the Use column cells of the EPM dynamic formatting sheet:• CONTENT• FONTBOLD• FONTCOLOR
Note:FONTCOLOR is migrated as FontColorIndex.
• FONTNAME• FONTSIZE• FONTSTYLE• HORIZONTALALIGNMENT• INDENTLEVEL• LOCK• NUMBERFORMAT• STYLE• VERTICALALIGNMENT
The value below is not migrated:• {VBA property}
Regarding the syntax:• This syntax is migrated: {Format property} = "value"• This syntax is not migrated: {Format property} = {dimension}.{property}
44.2.7.2.6 APPLY TO column
The values and the parameter below are migrated:
2013-01-30457
Migration
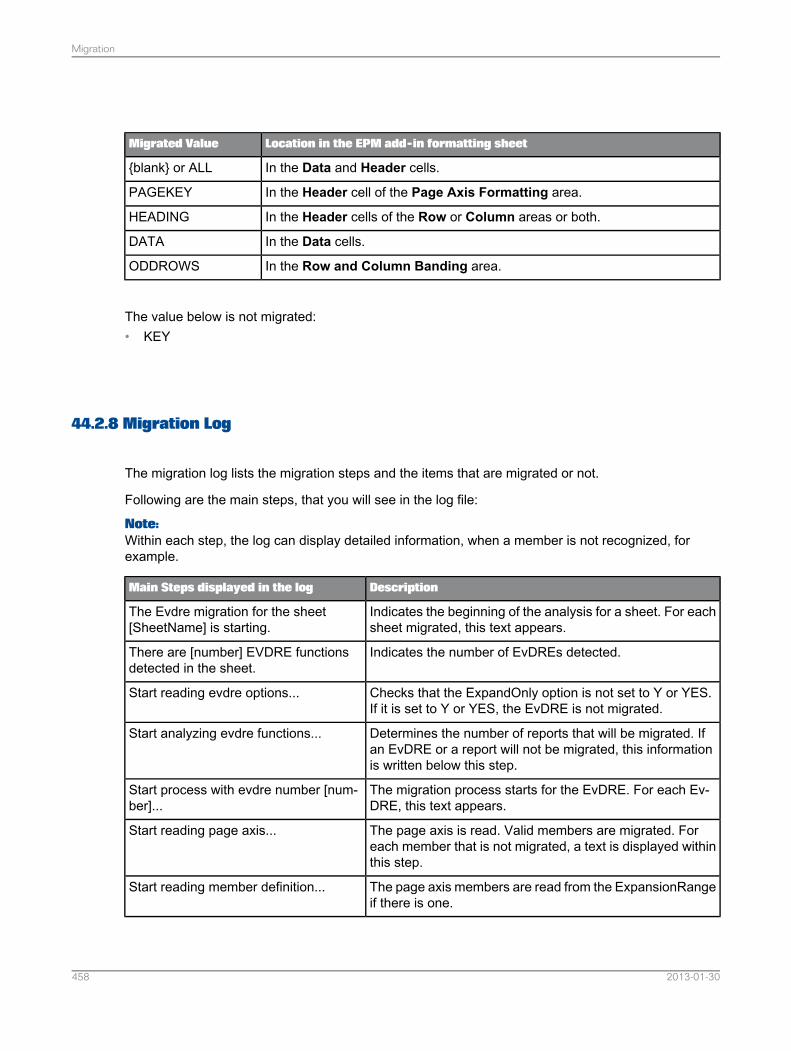
Location in the EPM add-in formatting sheetMigrated Value
In the Data and Header cells.{blank} or ALL
In the Header cell of the Page Axis Formatting area.PAGEKEY
In the Header cells of the Row or Column areas or both.HEADING
In the Data cells.DATA
In the Row and Column Banding area.ODDROWS
The value below is not migrated:• KEY
44.2.8 Migration Log
The migration log lists the migration steps and the items that are migrated or not.
Following are the main steps, that you will see in the log file:
Note:Within each step, the log can display detailed information, when a member is not recognized, forexample.
DescriptionMain Steps displayed in the log
Indicates the beginning of the analysis for a sheet. For eachsheet migrated, this text appears.
The Evdre migration for the sheet[SheetName] is starting.
Indicates the number of EvDREs detected.There are [number] EVDRE functionsdetected in the sheet.
Checks that the ExpandOnly option is not set to Y or YES.If it is set to Y or YES, the EvDRE is not migrated.
Start reading evdre options...
Determines the number of reports that will be migrated. Ifan EvDRE or a report will not be migrated, this informationis written below this step.
Start analyzing evdre functions...
The migration process starts for the EvDRE. For each Ev-DRE, this text appears.
Start process with evdre number [num-ber]...
The page axis is read. Valid members are migrated. Foreach member that is not migrated, a text is displayed withinthis step.
Start reading page axis...
The page axis members are read from the ExpansionRangeif there is one.
Start reading member definition...
2013-01-30458
Migration
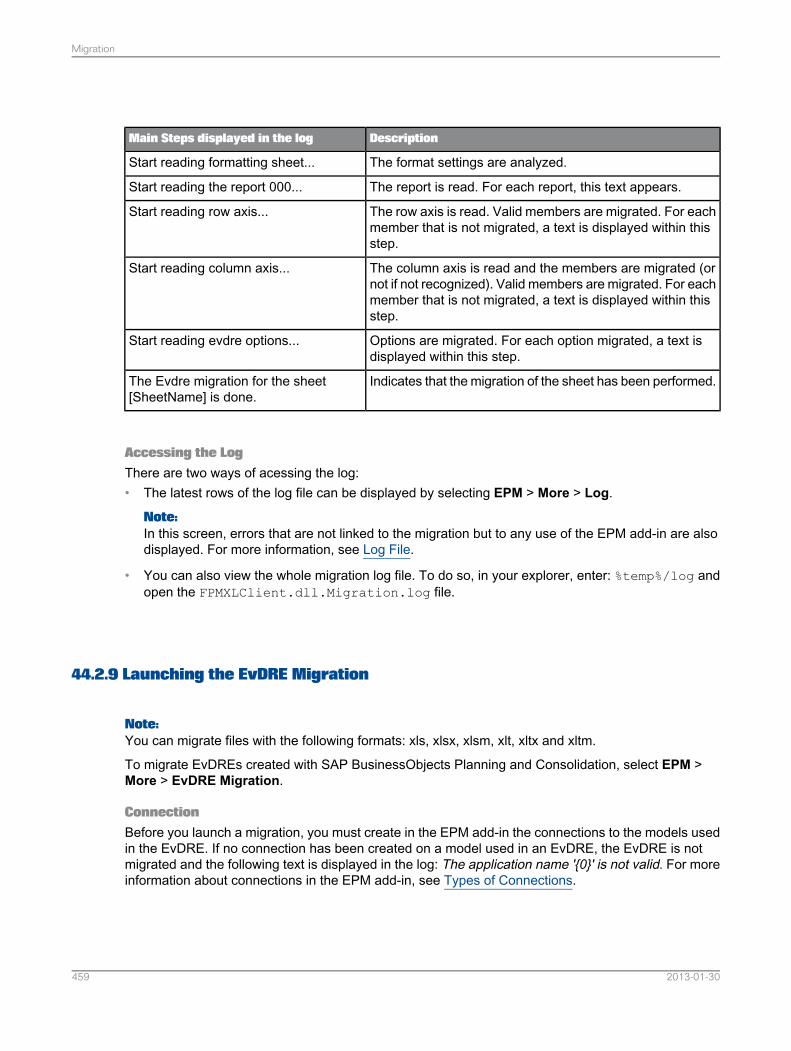
DescriptionMain Steps displayed in the log
The format settings are analyzed.Start reading formatting sheet...
The report is read. For each report, this text appears.Start reading the report 000...
The row axis is read. Valid members are migrated. For eachmember that is not migrated, a text is displayed within thisstep.
Start reading row axis...
The column axis is read and the members are migrated (ornot if not recognized). Valid members are migrated. For eachmember that is not migrated, a text is displayed within thisstep.
Start reading column axis...
Options are migrated. For each option migrated, a text isdisplayed within this step.
Start reading evdre options...
Indicates that the migration of the sheet has been performed.The Evdre migration for the sheet[SheetName] is done.
Accessing the LogThere are two ways of acessing the log:• The latest rows of the log file can be displayed by selecting EPM > More > Log.
Note:In this screen, errors that are not linked to the migration but to any use of the EPM add-in are alsodisplayed. For more information, see Log File.
• You can also view the whole migration log file. To do so, in your explorer, enter: %temp%/log andopen the FPMXLClient.dll.Migration.log file.
44.2.9 Launching the EvDRE Migration
Note:You can migrate files with the following formats: xls, xlsx, xlsm, xlt, xltx and xltm.
To migrate EvDREs created with SAP BusinessObjects Planning and Consolidation, select EPM >More > EvDRE Migration.
ConnectionBefore you launch a migration, you must create in the EPM add-in the connections to the models usedin the EvDRE. If no connection has been created on a model used in an EvDRE, the EvDRE is notmigrated and the following text is displayed in the log: The application name '{0}' is not valid. For moreinformation about connections in the EPM add-in, see Types of Connections.
2013-01-30459
Migration
When launching the migration, the Change Connection dialog box opens and enables you to selecta connection to a model used in the EvDRE.
If there are several EvDREs in a sheet on several models, you can migrate all the EvDREs at the sametime, provided that:• All the models are on the same environment.
If there several EvDREs in a sheet on several models that do not have the same environment, youcannot perform the migration all at once.
• The connections to all the models used in the EvDRE are created in the EPM add-in.
Selection of the Worksheets and Workbooks to MigrateUsing the EvDRE Migration dialog box, you can migrate:• All the EvDREs on the active worksheet.• All the EvDREs in the active workbook.
Caution:The migration of a worksheet or a workbook can only be performed once. For this reason, it isrecommended that you make a copy of your version 7.5 workbooks before migrating.
• All workbooks contained in a specified folder (and its subfolders) on the Planning and Consolidationserver.
• All workbooks contained in a specified folder (and its subfolders) on your local machine or elsewhereon the network.
Note:If you select the Planning and Consolidation Server or Local option, the migrated workbooks donot overwrite the original workbooks. You can choose whether the original workbooks and themigrated workbooks will be stored in the same folder or in different ones, using the Do not moveoriginal workbooks in a different folder option.• To ensure that each original workbook is kept in the folder you select, select the Do not move
original workbooks in a different folder option. For each workbook, the folder will contain: theoriginal workbook, the migrated workbook and - only for folders that are not on the Planning andConsolidation server - one log file per workbook.
Note:When migrating workbooks on the Planning and Consolidation server, you can still view thegeneral log of the EPM add-in by selecting EPM > More > Log.
• Alternatively, you can also specify that the original workbooks are automatically moved to adedicated folder calledMigration Copy. Therefore, the folder you have selected will only containthe migrated workbooks. And the Migration Copy folder will contain the original workbooks and,only for folders that are not on the Planning and Consolidation server - one log file per workbook.To do so, simply deselect the Do not move original workbooks in a different folder option.
Note:
• An original workbook is automatically renamed as follows: #Copy of Original#[original name]
A file whose name begins with #Copy of Original# cannot be migrated (using the Planningand Consolidation Server or Local option).
2013-01-30460
Migration
• A migrated workbook is automatically named with the original name.
Note:
• If there are sub-folders, the same structure with the same sub-folders is created.• A refresh is not automatically performed after the migration.
44.2.10 After Migration
Once you have performed an EvDRE migration, colors can be displayed in some cells:• Cells in magenta indicate that members are not recognized (for example, a member has been deleted
from the database).• Cells in yellow contain EPM functions after the migration of the MemberSet, BeforeRange or
AfterRange parameters.
Caution:So that the migrated reports continue to function, do not delete cells in yellow.
Here is what you can do after the migration:• If you have migrated the active worksheet or workbook (using the Active Worsheet or Active
Workbook option) and you are not satisfied with the migration: Close your file without saving it.Open it again, make your modifications and launch the migration again.
• If you have migrated all the workbooks contained in a specified folder (using the Planning andConsolidation Server or Local option) and you are not satisfied with the migration of one or morefiles: Delete the migrated workbook(s). Make a copy of the original workbook(s). Rename theworbook(s), deleting the prefix #Copy of Original# (to be able to launch a migration again). Makeyour modifications and launch the migration again.
• If you are satisfied with the migration, perform the following actions:• If cells appear in magenta, indicating unrecognized members, be sure that you do not want to
use these members anymore. For more information on unrecognized members, see RowKeyRangeand ColKeyRange Members and PageKeyRange Members.
• Once you are sure that you want to validate the migration process, perform a refresh: row andcolumns containing cells in magenta are deleted.
• If cells appear in yellow, indicating EPM functions, move the EPM functions to other cells in thesheet and do not delete them.
Note:However, always leave a blank row or column between a function and a report. Also, it isrecommended that you move the function above all the reports. Otherwise, if you move a reportin the sheet, the functions will also be moved.
• You can then delete all the ranges that are linked to the EvDRE and that are not used by theEPM add-in. Do not delete the cells containing formulas beginning with =EPMOlapMemberO( or=EPMOlapMultiMember( or =EPMInsertedMember(.
2013-01-30461
Migration
Note:If outside the reports certain format settings remain from the EvDRE, you can use the standard MicrosoftOffice Excel feature to delete the formatting. You can then refresh the reports and the migrated formattingwill be applied.
Tip:
• If you want to use a report as a template using any Planning and Consolidation connection, selecta cell in the report, then select EPM > Edit Report > Options and select the Do not StoreConnection option. For more information, see Do not Store Connection and Do not Store Environmentin the Connection.
• If a report was used before migration as an input form, select a cell in the report, then select EPM> Edit Report > Options and select the Use as an Input Form option. For more information, seeUse as Input Form.
2013-01-30462
Migration
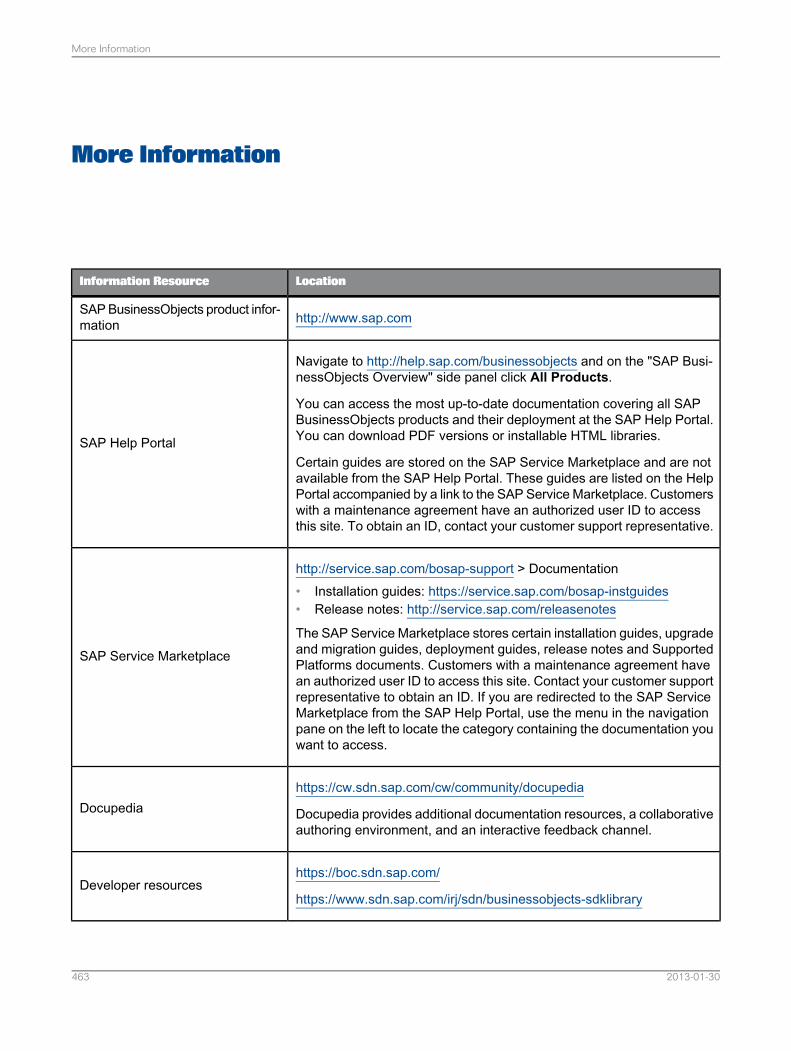
More Information
LocationInformation Resource
http://www.sap.comSAP BusinessObjects product infor-mation
Navigate to http://help.sap.com/businessobjects and on the "SAP Busi-nessObjects Overview" side panel click All Products.
You can access the most up-to-date documentation covering all SAPBusinessObjects products and their deployment at the SAP Help Portal.You can download PDF versions or installable HTML libraries.
Certain guides are stored on the SAP Service Marketplace and are notavailable from the SAP Help Portal. These guides are listed on the HelpPortal accompanied by a link to the SAP Service Marketplace. Customerswith a maintenance agreement have an authorized user ID to accessthis site. To obtain an ID, contact your customer support representative.
SAP Help Portal
http://service.sap.com/bosap-support > Documentation• Installation guides: https://service.sap.com/bosap-instguides• Release notes: http://service.sap.com/releasenotes
The SAP Service Marketplace stores certain installation guides, upgradeand migration guides, deployment guides, release notes and SupportedPlatforms documents. Customers with a maintenance agreement havean authorized user ID to access this site. Contact your customer supportrepresentative to obtain an ID. If you are redirected to the SAP ServiceMarketplace from the SAP Help Portal, use the menu in the navigationpane on the left to locate the category containing the documentation youwant to access.
SAP Service Marketplace
https://cw.sdn.sap.com/cw/community/docupedia
Docupedia provides additional documentation resources, a collaborativeauthoring environment, and an interactive feedback channel.
Docupedia
https://boc.sdn.sap.com/
https://www.sdn.sap.com/irj/sdn/businessobjects-sdklibraryDeveloper resources
2013-01-30463
More Information
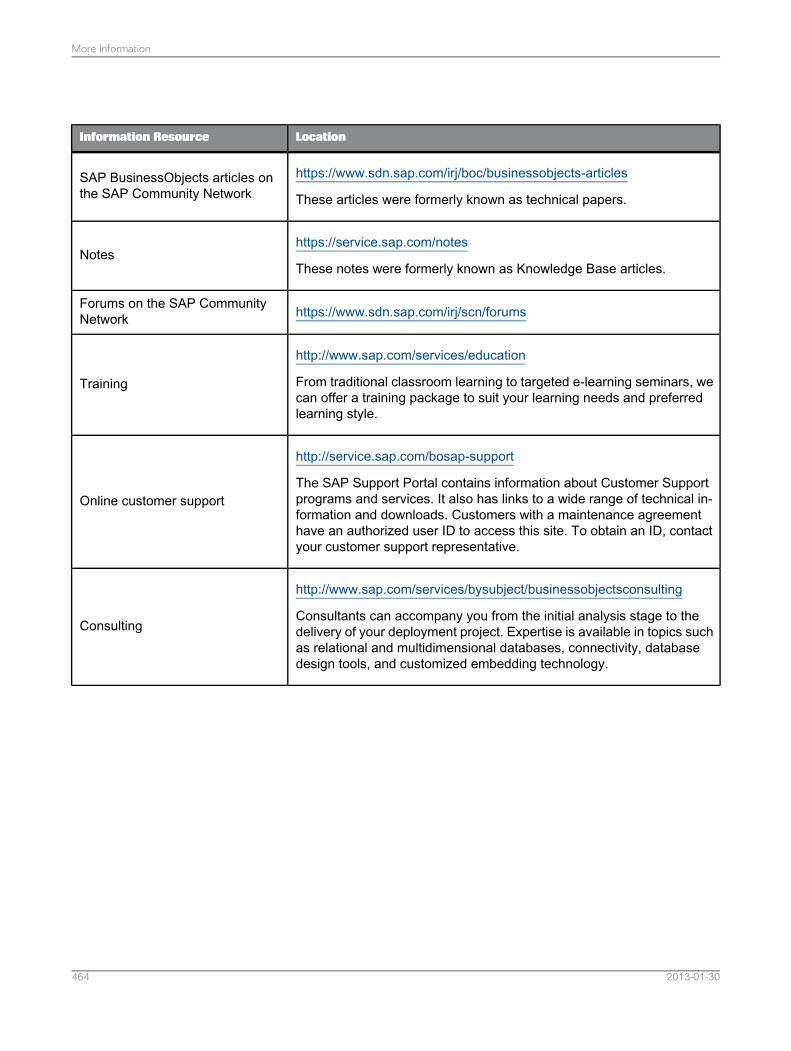
LocationInformation Resource
https://www.sdn.sap.com/irj/boc/businessobjects-articles
These articles were formerly known as technical papers.SAP BusinessObjects articles onthe SAP Community Network
https://service.sap.com/notes
These notes were formerly known as Knowledge Base articles.Notes
https://www.sdn.sap.com/irj/scn/forumsForums on the SAP CommunityNetwork
http://www.sap.com/services/education
From traditional classroom learning to targeted e-learning seminars, wecan offer a training package to suit your learning needs and preferredlearning style.
Training
http://service.sap.com/bosap-support
The SAP Support Portal contains information about Customer Supportprograms and services. It also has links to a wide range of technical in-formation and downloads. Customers with a maintenance agreementhave an authorized user ID to access this site. To obtain an ID, contactyour customer support representative.
Online customer support
http://www.sap.com/services/bysubject/businessobjectsconsulting
Consultants can accompany you from the initial analysis stage to thedelivery of your deployment project. Expertise is available in topics suchas relational and multidimensional databases, connectivity, databasedesign tools, and customized embedding technology.
Consulting
2013-01-30464
More Information
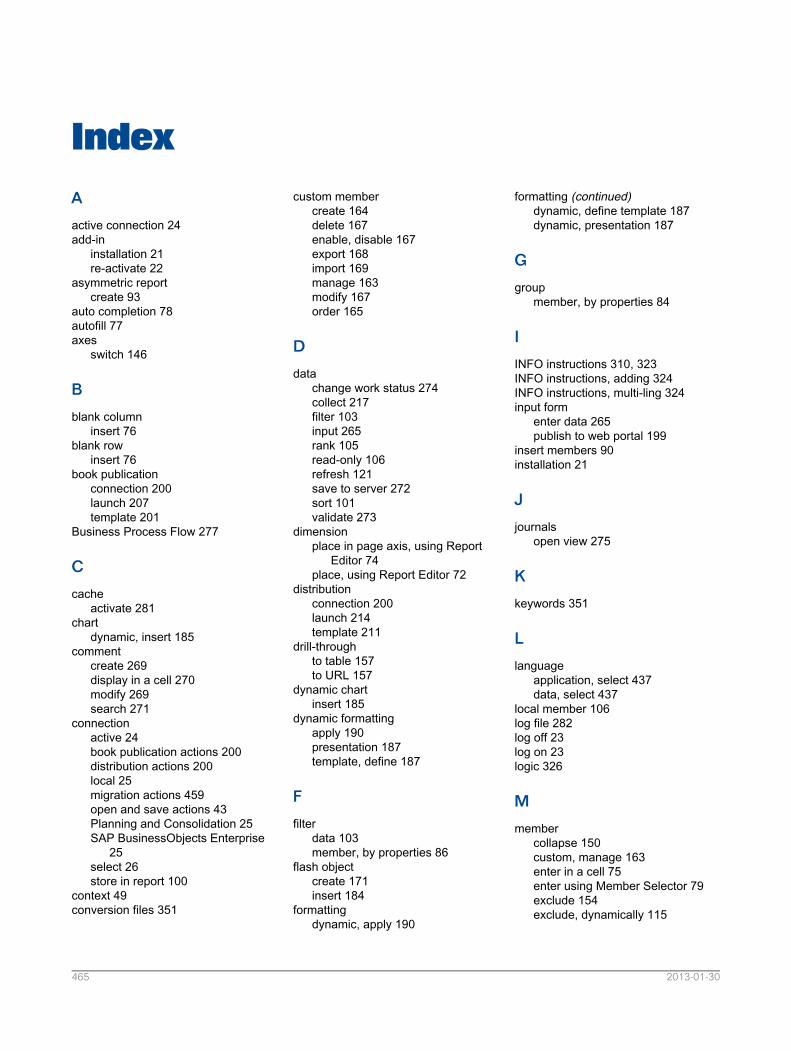
IndexA
active connection 24add-in
installation 21re-activate 22
asymmetric reportcreate 93
auto completion 78autofill 77axes
switch 146
B
blank columninsert 76
blank rowinsert 76
book publicationconnection 200launch 207template 201
Business Process Flow 277
C
cacheactivate 281
chartdynamic, insert 185
commentcreate 269display in a cell 270modify 269search 271
connectionactive 24book publication actions 200distribution actions 200local 25migration actions 459open and save actions 43Planning and Consolidation 25SAP BusinessObjects Enterprise
25select 26store in report 100
context 49conversion files 351
custom membercreate 164delete 167enable, disable 167export 168import 169manage 163modify 167order 165
D
datachange work status 274collect 217filter 103input 265rank 105read-only 106refresh 121save to server 272sort 101validate 273
dimensionplace in page axis, using Report
Editor 74place, using Report Editor 72
distributionconnection 200launch 214template 211
drill-throughto table 157to URL 157
dynamic chartinsert 185
dynamic formattingapply 190presentation 187template, define 187
F
filterdata 103member, by properties 86
flash objectcreate 171insert 184
formattingdynamic, apply 190
formatting (continued)dynamic, define template 187dynamic, presentation 187
G
groupmember, by properties 84
I
INFO instructions 310, 323INFO instructions, adding 324INFO instructions, multi-ling 324input form
enter data 265publish to web portal 199
insert members 90installation 21
J
journalsopen view 275
K
keywords 351
L
languageapplication, select 437data, select 437
local member 106log file 282log off 23log on 23logic 326
M
membercollapse 150custom, manage 163enter in a cell 75enter using Member Selector 79exclude 154exclude, dynamically 115
2013-01-30465

member (continued)expand 146filter by properties 86group by properties 84identification 67insert 90keep 153local 106name to display 82properties, display 68rename 115select using Member Selector 79select using Report Editor 73sort by properties 84
member recognitionactivate 78presentation 75
O
offline mode 195
P
package descriptions 291package link 330package list 327package, definition 289packages, adding 308packages, properties 307packages, scheduling 328PowerPoint
add-in features 285
process chain, definition 290process chain, FTP 306publication
book, connection 200book, launch 207book, template 201
Q
quick linkcreate 161
R
rankdata 105
refreshdata 121report 121
reportasymmetric, create 93create manually 75create using copy/paste 92create using the pane 68create using the Report Editor 70delete 119highlight 119layout rules 53move 74options 99ownership-based hierarchies,
create 95publish to web portal 199
report (continued)refresh 121several reports 117shift 74store connection 100
Report Editorcreate report 70insert shift 74move 74place dimension 72place dimension in page axis 74select member 73
S
sheetscreated automatically 193
sortdata 101member, by properties 84
U
update 21
W
wild cards 351Word
add-in features 285work status
change 274
2013-01-30466
Index


![· 'ds-qned ops we ep sepepwn seu osn e]ed BioeJ a epepwpeuoo e 01uewesse00Jd '01ueweuezeuue ep epeploedeo woo ape] ep senpwes oe5eu-lJ0J11! ep e!ôqouoel ep soluewedlnbê ep e VOVZ180-LflV](https://img.pdfslide.us/doc/110x75/5e5073a69b60a6537d338078/ds-qned-ops-we-ep-sepepwn-seu-osn-eed-bioej-a-epepwpeuoo-e-01uewesse00jd-01ueweuezeuue.jpg)