Embed Size (px)
Citation preview
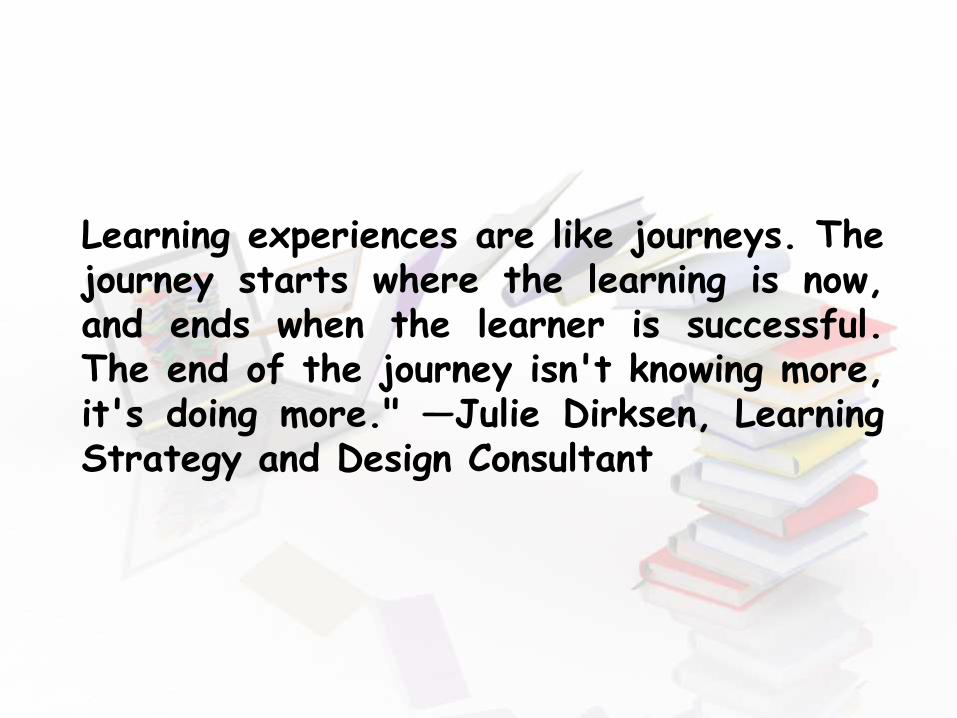
Learning experiences are like journeys. Thejourney starts where the learning is now,and ends when the learner is successful.The end of the journey isn't knowing more,it's doing more." —Julie Dirksen, LearningStrategy and Design Consultant
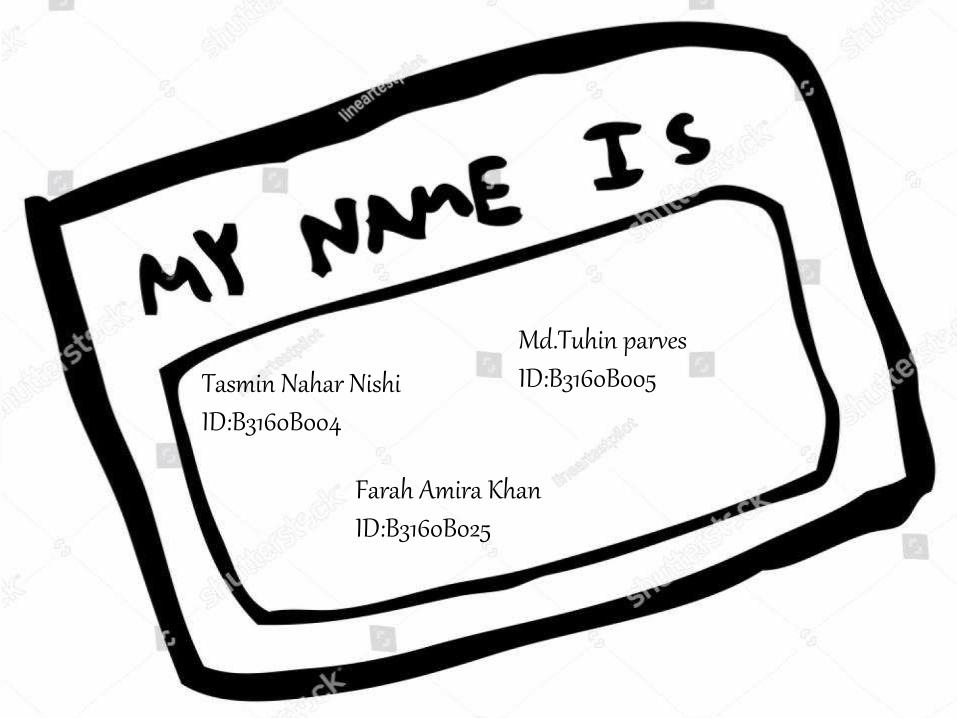
Farah Amira KhanID:B3160B025
Tasmin Nahar NishiID:B3160B004
Md.Tuhin parvesID:B3160B005
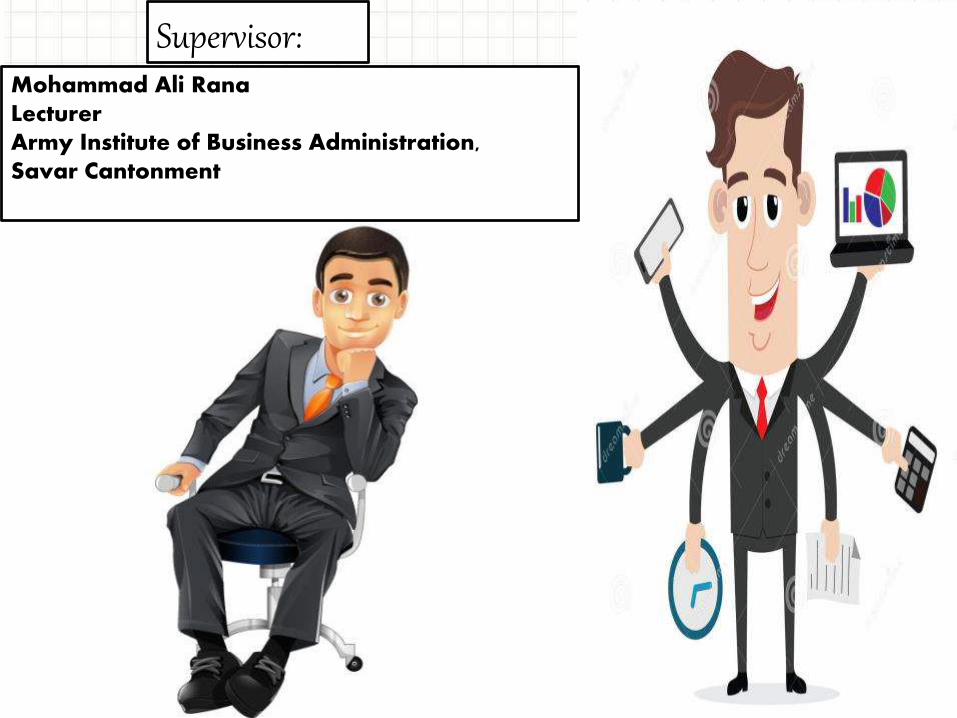
Supervisor:Mohammad Ali RanaLecturerArmy Institute of Business Administration,Savar Cantonment
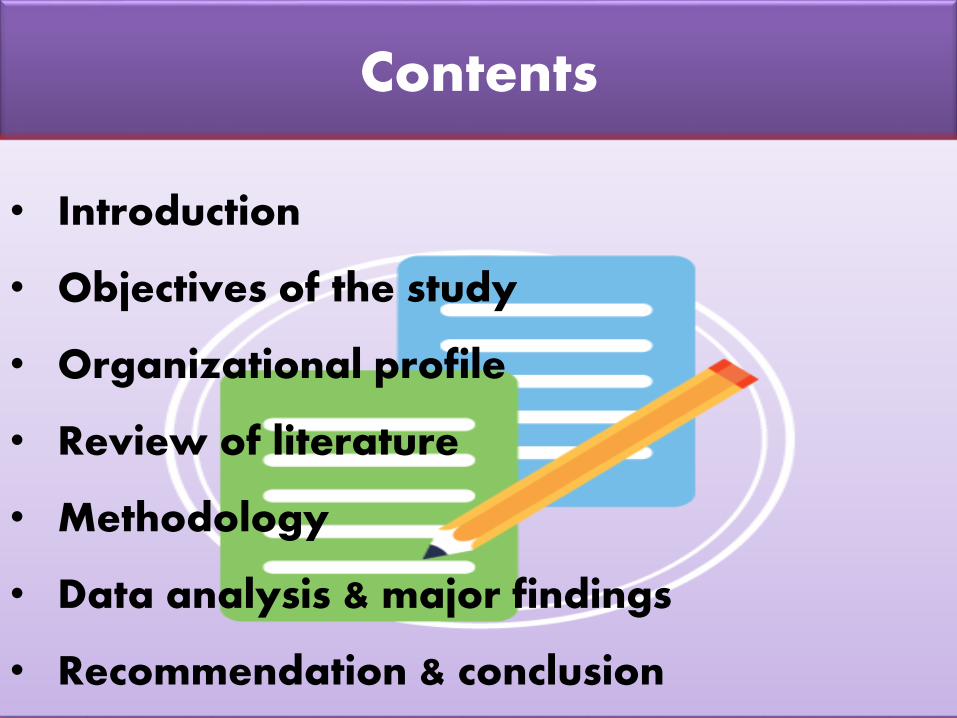
Contents
• Introduction
• Objectives of the study
• Organizational profile
• Review of literature
• Methodology
• Data analysis & major findings
• Recommendation & conclusion
OBJECTIVES
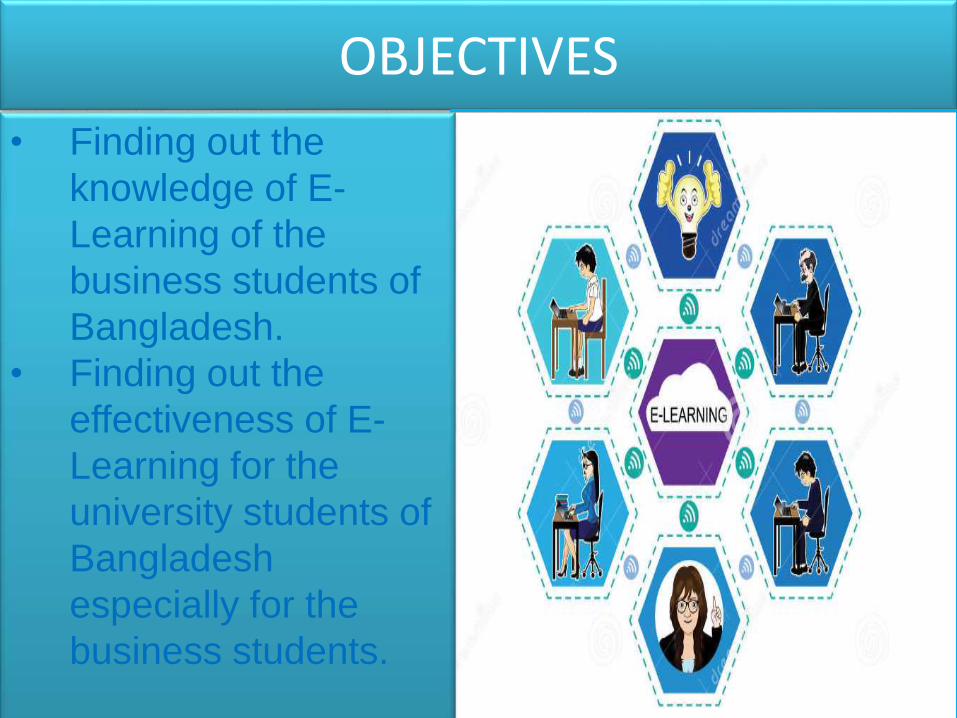
• Finding out the
knowledge of E-
Learning of the
business students of
Bangladesh.
• Finding out the
effectiveness of E-
Learning for the
university students of
Bangladesh
especially for the
business students.
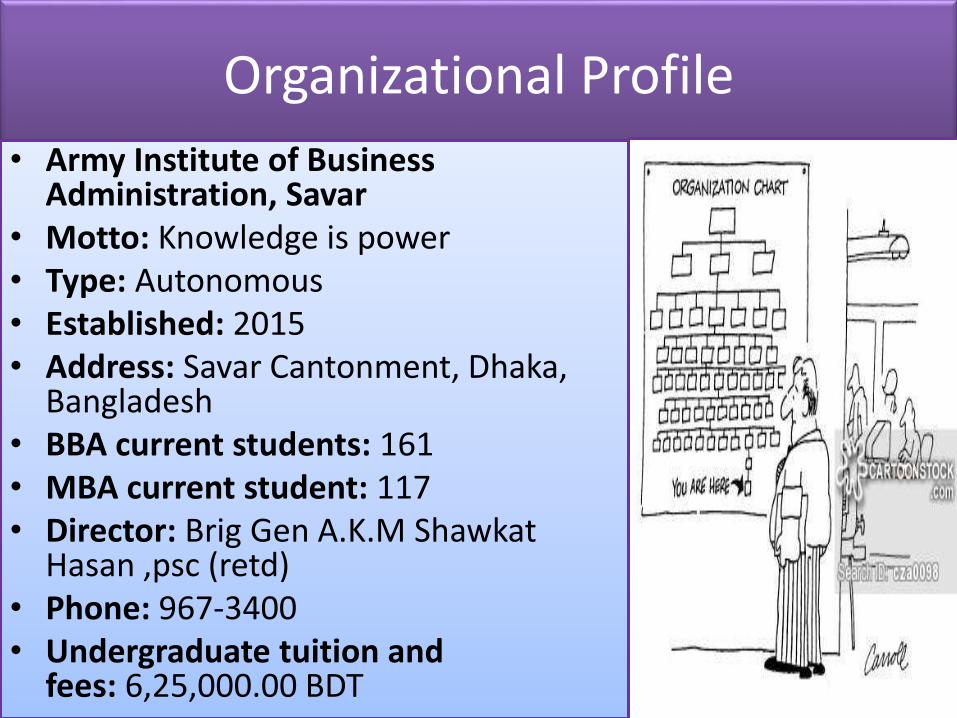
Organizational Profile
• Army Institute of Business Administration, Savar
• Motto: Knowledge is power• Type: Autonomous• Established: 2015• Address: Savar Cantonment, Dhaka,
Bangladesh• BBA current students: 161• MBA current student: 117• Director: Brig Gen A.K.M Shawkat
Hasan ,psc (retd)• Phone: 967-3400• Undergraduate tuition and
fees: 6,25,000.00 BDT
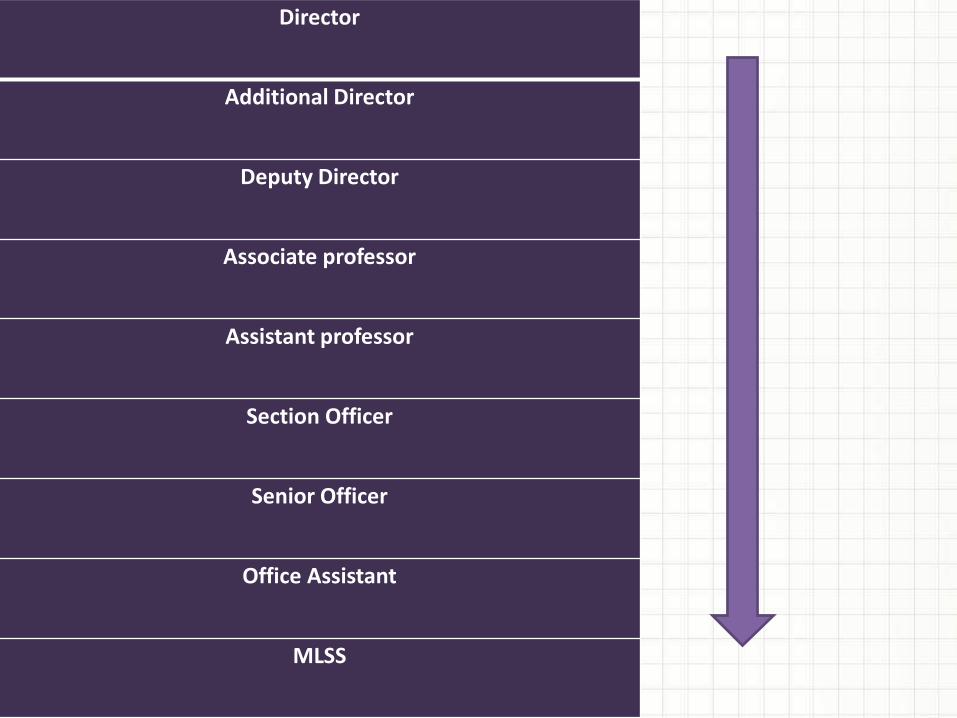
Director
Additional Director
Deputy Director
Associate professor
Assistant professor
Section Officer
Senior Officer
Office Assistant
MLSS
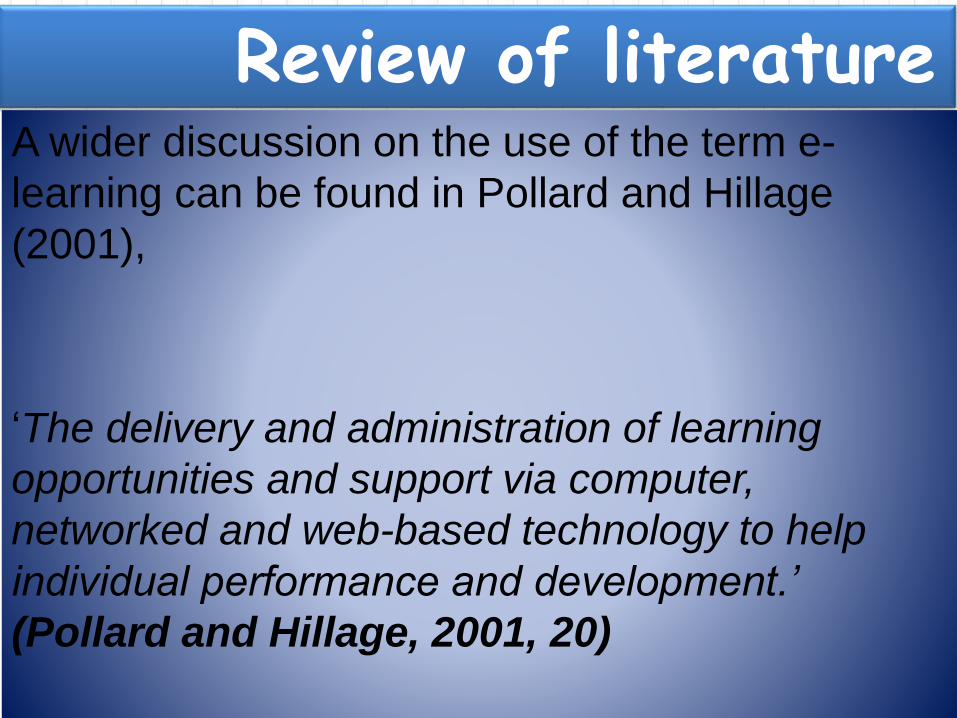
Review of literatureA wider discussion on the use of the term e-
learning can be found in Pollard and Hillage
(2001),
‘The delivery and administration of learning
opportunities and support via computer,
networked and web-based technology to help
individual performance and development.’
(Pollard and Hillage, 2001, 20)
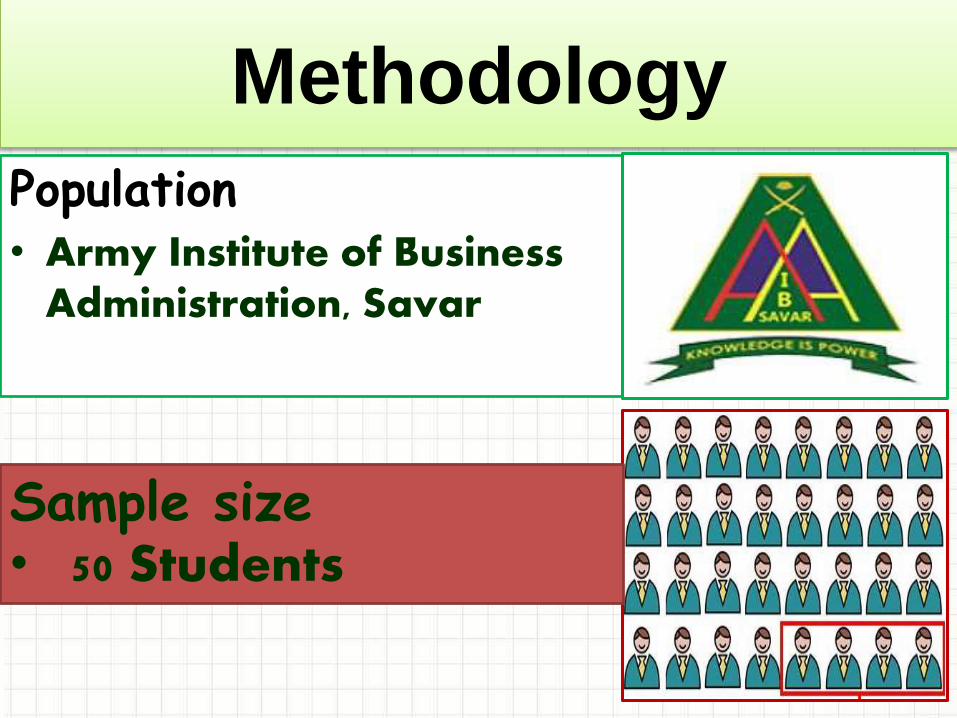
Methodology
Population• Army Institute of Business
Administration, Savar
Sample size• 50 Students
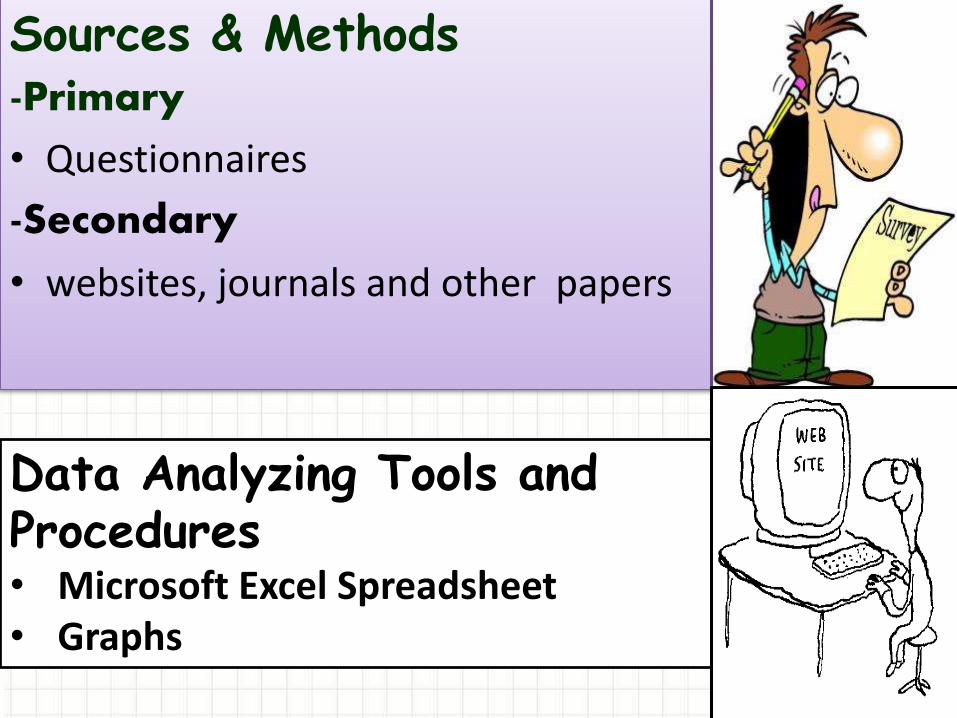
Sources & Methods-Primary
• Questionnaires
-Secondary
• websites, journals and other papers
Data Analyzing Tools and Procedures• Microsoft Excel Spreadsheet• Graphs
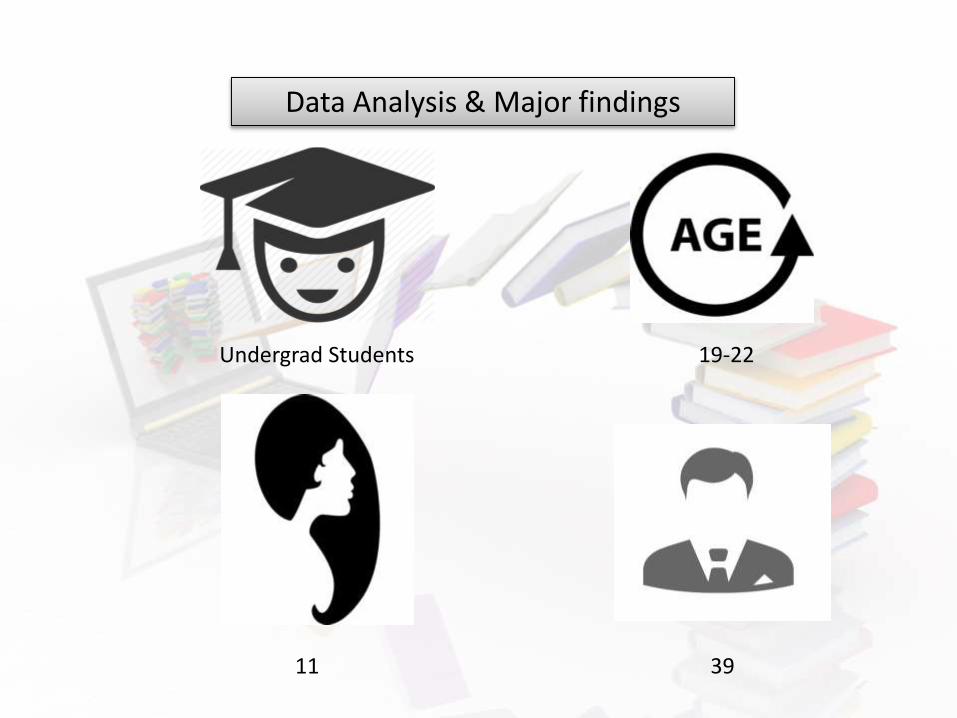
Data Analysis & Major findings
Undergrad Students 19-22
11 39
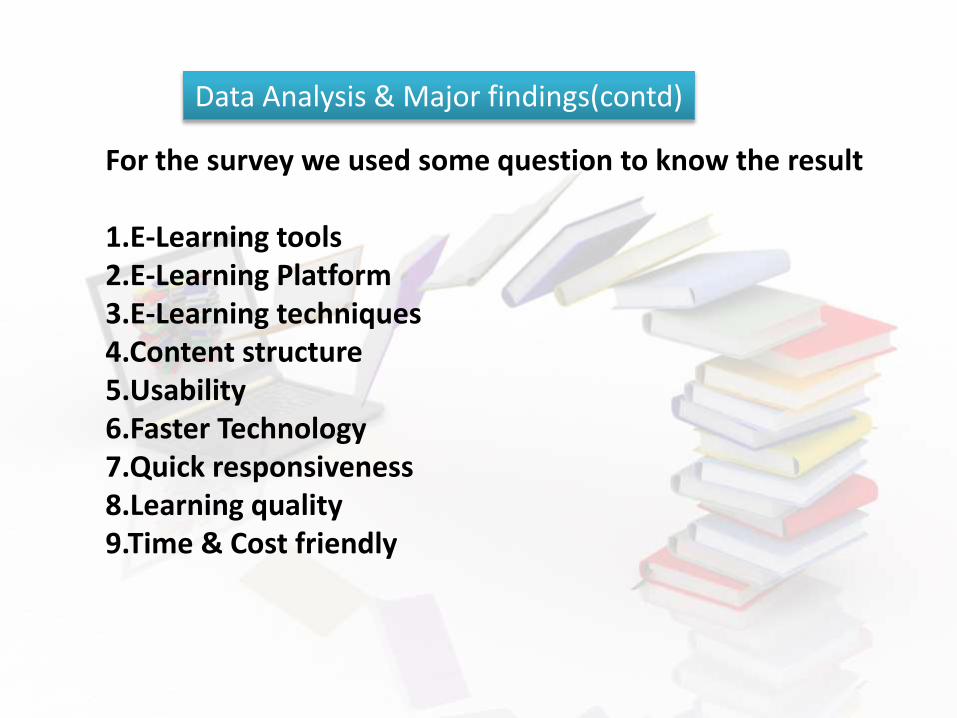
For the survey we used some question to know the result
1.E-Learning tools2.E-Learning Platform3.E-Learning techniques4.Content structure5.Usability6.Faster Technology7.Quick responsiveness8.Learning quality9.Time & Cost friendly
Data Analysis & Major findings(contd)
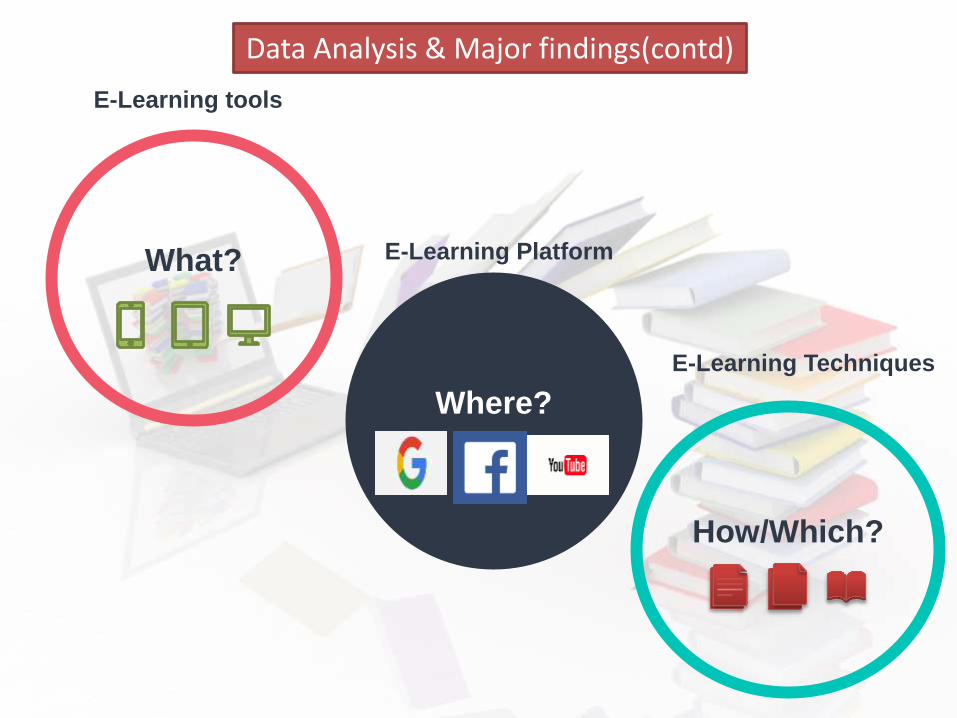
Where?
What?
How/Which?
E-Learning tools
E-Learning Platform
E-Learning Techniques
Data Analysis & Major findings(contd)
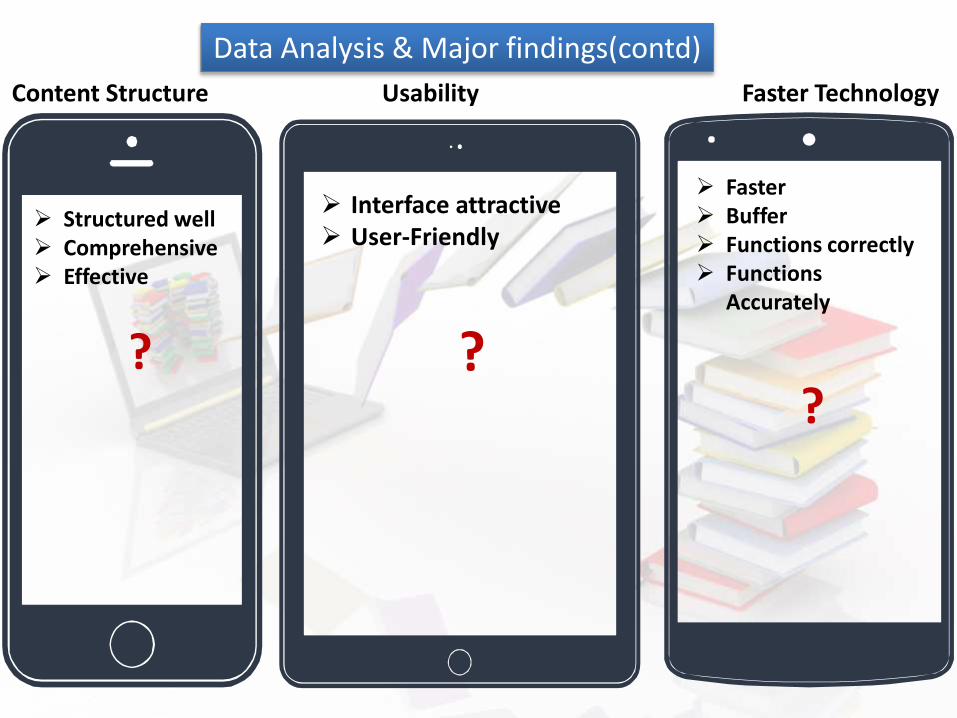
Content Structure Usability Faster Technology
Structured well Comprehensive Effective
?
Interface attractive User-Friendly
?
Faster Buffer Functions correctly Functions
Accurately
?
Data Analysis & Major findings(contd)
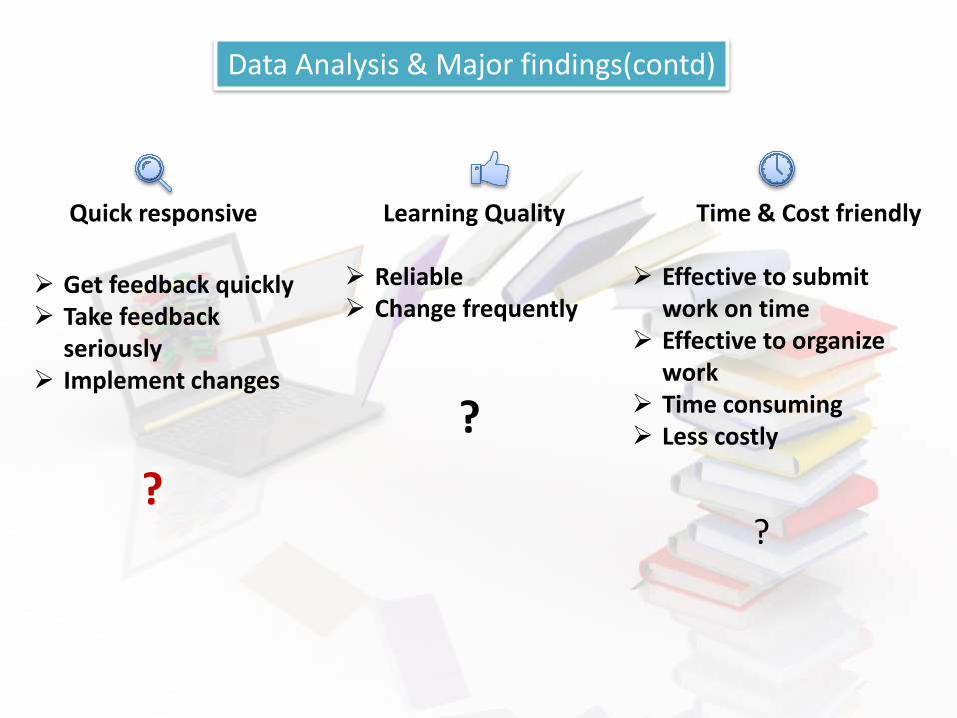
Quick responsive Learning Quality Time & Cost friendly
Get feedback quickly Take feedback
seriously Implement changes
?
Reliable Change frequently
?
Effective to submit work on time
Effective to organize work
Time consuming Less costly
?
Data Analysis & Major findings(contd)
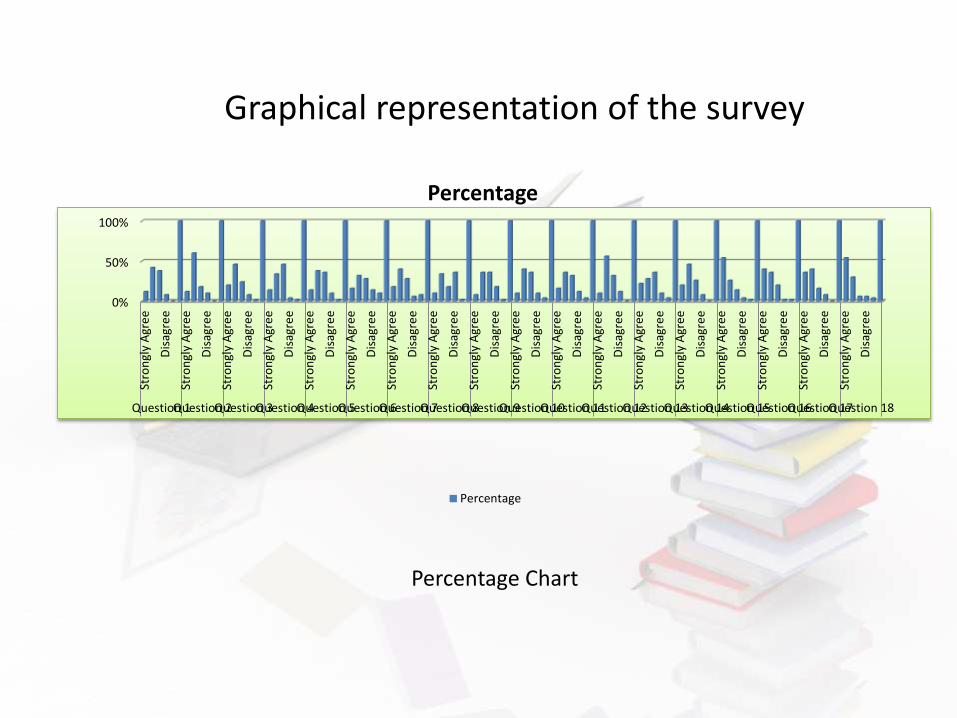
Graphical representation of the survey
0%
50%
100%
Stro
ngl
y A
gre
e
Dis
agre
e
Stro
ngl
y A
gre
e
Dis
agre
e
Stro
ngl
y A
gre
e
Dis
agre
e
Stro
ngl
y A
gre
e
Dis
agre
e
Stro
ngl
y A
gre
e
Dis
agre
e
Stro
ngl
y A
gre
e
Dis
agre
e
Stro
ngl
y A
gre
e
Dis
agre
e
Stro
ngl
y A
gre
e
Dis
agre
e
Stro
ngl
y A
gre
e
Dis
agre
e
Stro
ngl
y A
gre
e
Dis
agre
e
Stro
ngl
y A
gre
e
Dis
agre
e
Stro
ngl
y A
gre
e
Dis
agre
e
Stro
ngl
y A
gre
e
Dis
agre
e
Stro
ngl
y A
gre
e
Dis
agre
e
Stro
ngl
y A
gre
e
Dis
agre
e
Stro
ngl
y A
gre
e
Dis
agre
e
Stro
ngl
y A
gre
e
Dis
agre
e
Stro
ngl
y A
gre
e
Dis
agre
e
Question 1Question 2Question 3Question 4Question 5Question 6Question 7Question 8Question 9Question 10Question 11Question 12Question 13Question 14Question 15Question 16Question 17Question 18
Percentage
Percentage
Percentage Chart
0
5
10
15
20
25
30
35
40
45
50
Stro
ngl
y A
gre
e
Dis
agre
e
Stro
ngl
y A
gre
e
Dis
agre
e
Stro
ngl
y A
gre
e
Dis
agre
e
Stro
ngl
y A
gre
e
Dis
agre
e
Stro
ngl
y A
gre
e
Dis
agre
e
Stro
ngl
y A
gre
e
Dis
agre
e
Stro
ngl
y A
gre
e
Dis
agre
e
Stro
ngl
y A
gre
e
Dis
agre
e
Stro
ngl
y A
gre
e
Dis
agre
e
Stro
ngl
y A
gre
e
Dis
agre
e
Stro
ngl
y A
gre
e
Dis
agre
e
Stro
ngl
y A
gre
e
Dis
agre
e
Stro
ngl
y A
gre
e
Dis
agre
e
Stro
ngl
y A
gre
e
Dis
agre
e
Stro
ngl
y A
gre
e
Dis
agre
e
Stro
ngl
y A
gre
e
Dis
agre
e
Stro
ngl
y A
gre
e
Dis
agre
e
Stro
ngl
y A
gre
e
Dis
agre
e
Question 1Question 2Question 3Question 4Question 5Question 6Question 7Question 8Question 9Question 10Question 11Question 12Question 13Question 14Question 15Question 16Question 17Question 18
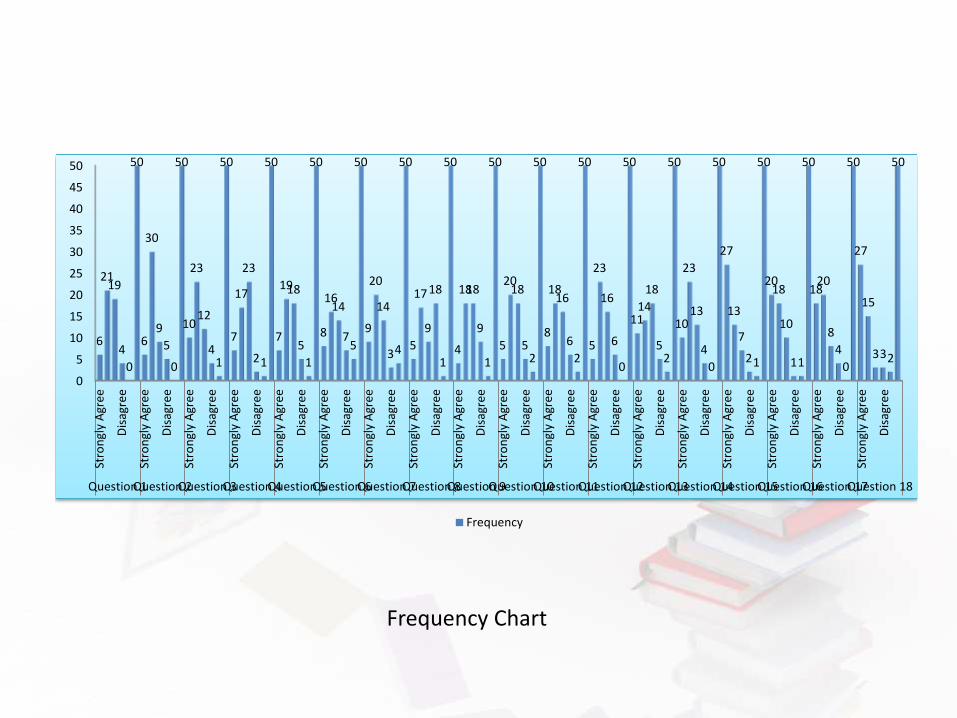
6
2119
4
0
50
6
30
9
5
0
50
10
23
12
41
50
7
17
23
21
50
7
1918
5
1
50
8
1614
75
50
9
20
14
34
50
5
17
9
18
1
50
4
1818
9
1
50
5
2018
52
50
8
1816
6
2
50
5
23
16
6
0
50
1114
18
52
50
10
23
13
4
0
50
27
13
7
21
50
2018
10
11
50
1820
8
4
0
50
27
15
332
50
Frequency
Frequency Chart
Major findings
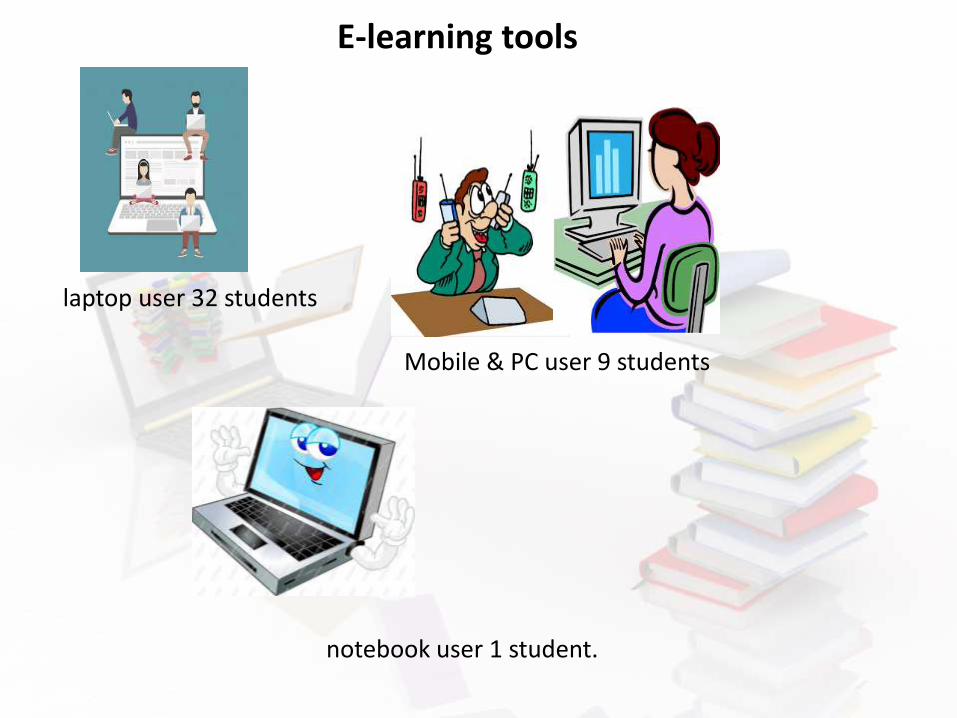
E-learning tools
laptop user 32 students
Mobile & PC user 9 students
notebook user 1 student.
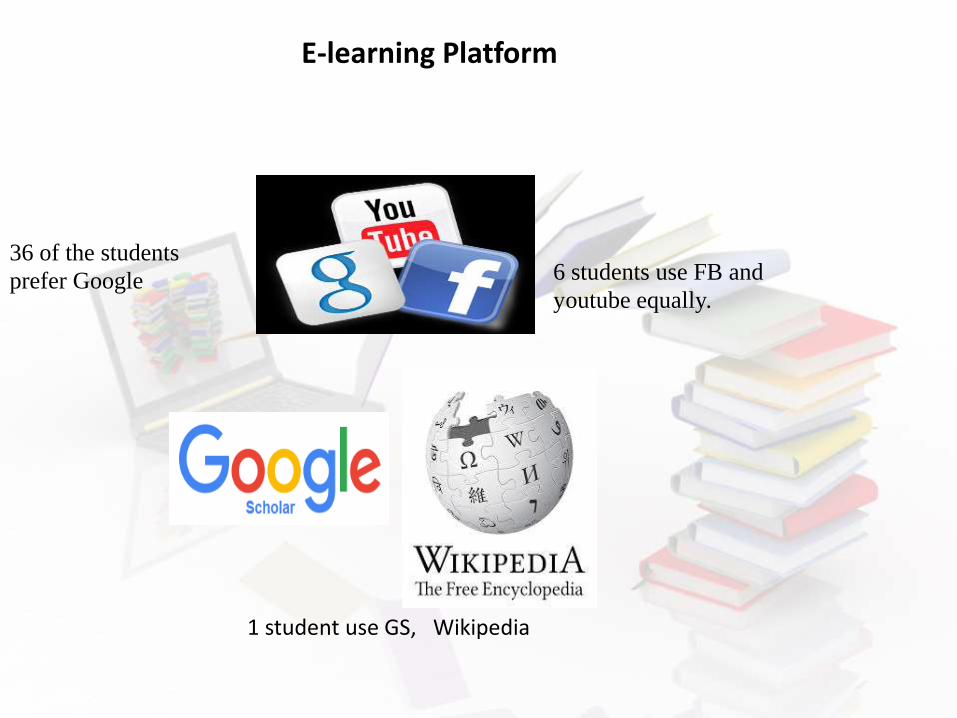
E-learning Platform
36 of the students
prefer Google 6 students use FB and
youtube equally.
1 student use GS, Wikipedia
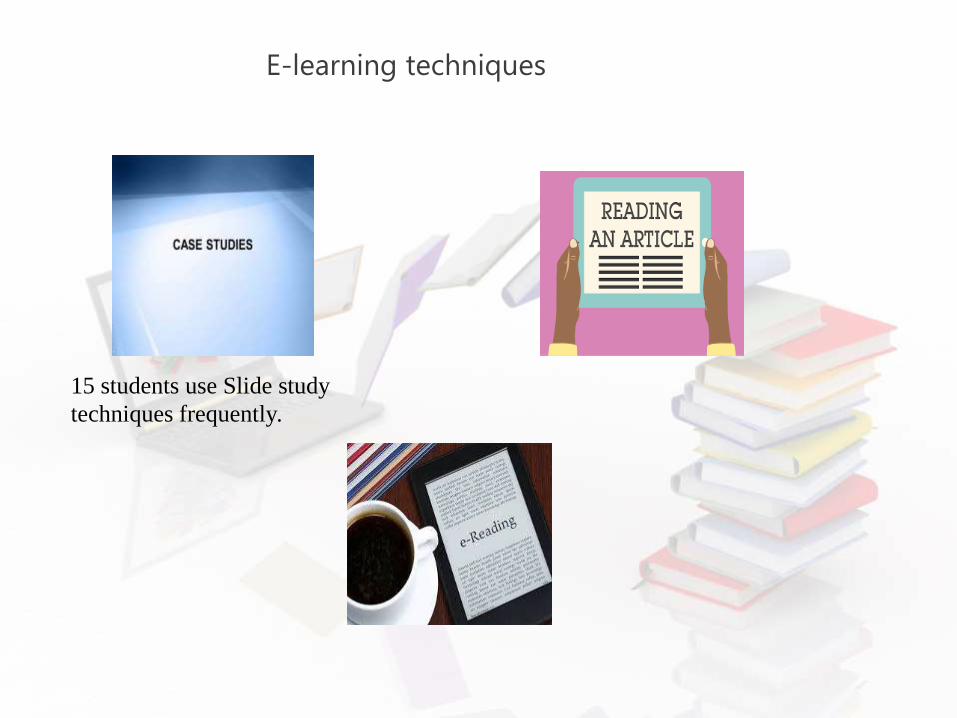
E-learning techniques
15 students use Slide study
techniques frequently.
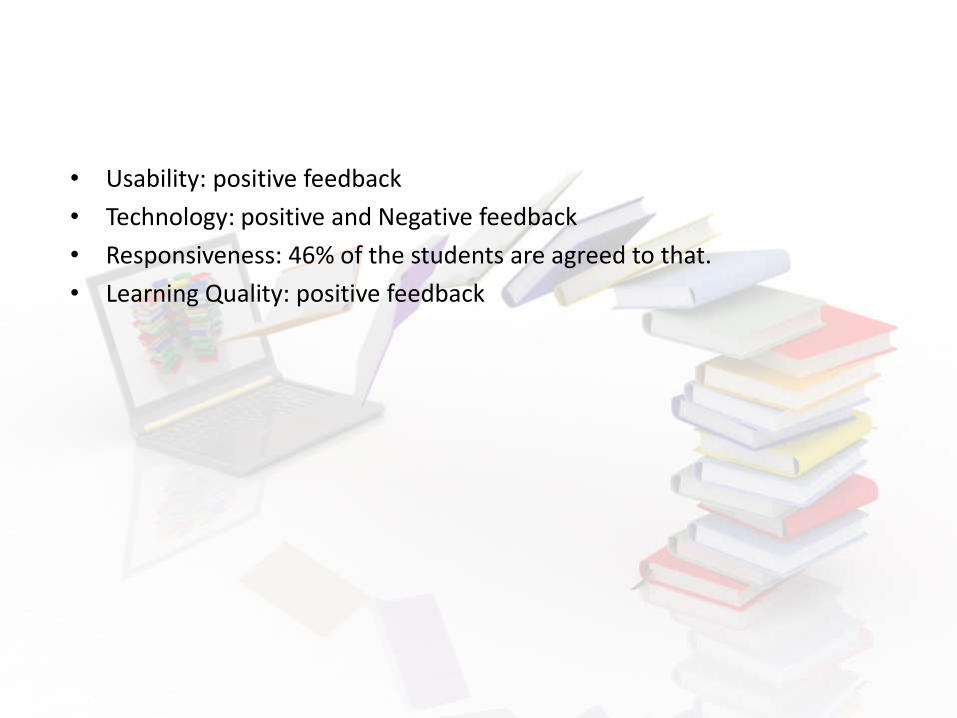
• Usability: positive feedback
• Technology: positive and Negative feedback
• Responsiveness: 46% of the students are agreed to that.
• Learning Quality: positive feedback
Recommendation
• Increase the number of students
• Increase the number of universities
• Should give more time on research
Students now a days have become highlydependent on the e-learning system for theiracademic purposes. They are now spendingmore time on internet and this habit can help toimprove E-Learning.
Conclusion