Embed Size (px)
Citation preview

EDUCATIONAL
OPPORTUNITY FOR ALL:
OVERCOMING INEQUALITY
THROUGHOUT THE LIFE
COURSE
Dirk Van Damme
OECD/EDU

2

3
Educational disadvantages are transmitted
from one generation to the other
4
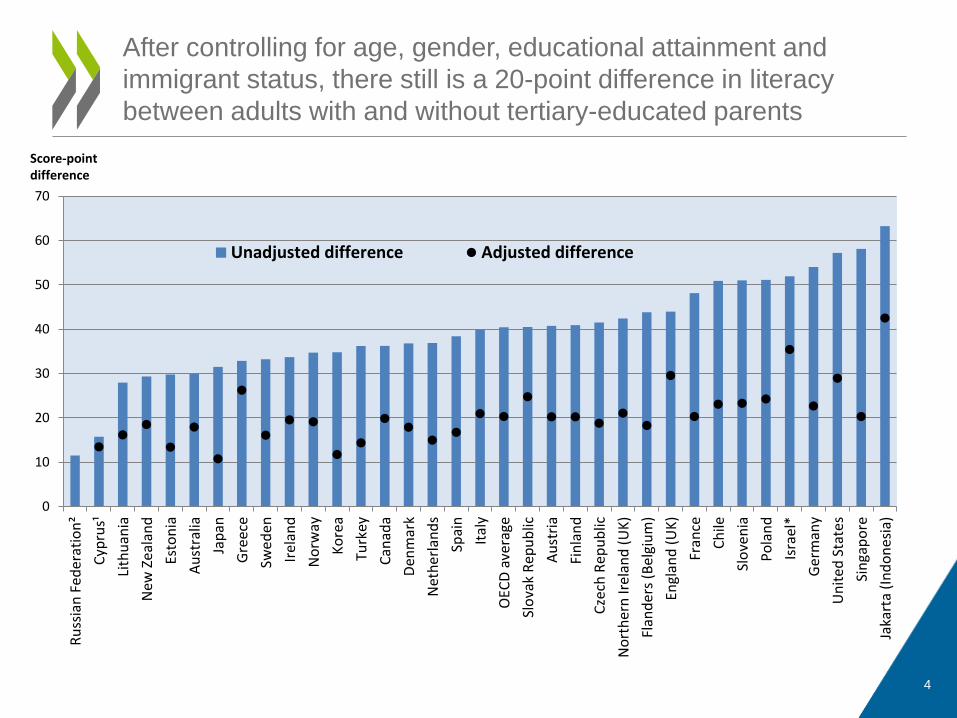
After controlling for age, gender, educational attainment and
immigrant status, there still is a 20-point difference in literacy
between adults with and without tertiary-educated parents
0
10
20
30
40
50
60
70
Ru
ssia
n F
eder
atio
n²
Cyp
rus¹
Lith
uan
ia
New
Ze
alan
d
Esto
nia
Au
stra
lia
Jap
an
Gre
ece
Swed
en
Irel
and
No
rway
Ko
rea
Turk
ey
Can
ada
Den
mar
k
Net
her
lan
ds
Spai
n
Ital
y
OEC
D a
vera
ge
Slo
vak
Rep
ub
lic
Au
stri
a
Fin
lan
d
Cze
ch R
epu
blic
No
rth
ern
Irel
and
(U
K)
Flan
der
s (B
elgi
um
)
Engl
and
(U
K)
Fran
ce
Ch
ile
Slo
ven
ia
Po
lan
d
Isra
el*
Ger
man
y
Un
ited
Sta
tes
Sin
gap
ore
Jaka
rta
(In
do
nes
ia)
Unadjusted difference Adjusted difference
Score-pointdifference

• The intergenerational transmission of inequality through education
– Less well-off families tend to relatively invest less in education
– Inequality and poverty lead to harms (malnutrition, brain damage, etc.) which affect educational achievement
– Lower quality of education and lower learning outcomes at bottom of distribution in countries with higher inequality
– ‘Opportunity hoarding’ by middle class
– The education gradient in various other outcomes: education redistributes many other ‘goods’ such as jobs, health, income, … living standards and life satisfaction which in turn determine investments and life choices for the next generation
The central role of education in transmitting inequality
5

Educational disadvantage in the life-course
Individual’s background (micro level)Gender, Ethnicity,
Cognitive and socio-emotional skills, Socio-economic status
Learning environments (meso level)
Socio-Economic and Cultural Status
(income and wealth, education, occupation,
social class)
Education institutions (public/private institutions,
teachers, coaches, principals and supporting staff)
Neighbourhood(peers, colleagues, local
authorities and community facilities)
Socio-economic, cultural and political context (macro level)
Political and economic context(economic, labour market and political conditions and technological change)
Education policies related to equity (policies supporting equitable provision of
quality education for all)
Social and cultural context
(openness, trust, perceptions, beliefs)
6

Amount of money spent by US households on child
development
7

8

Across OECD countries, disadvantaged students are
almost 3 times more likely to not attain the baseline
level of proficiency in science
3.8 3.8
3.5
3.4 3.43.3
3.2 3.2 3.1
2.9 2.92.8 2.8 2.8 2.8 2.8 2.7
2.6 2.6 2.6 2.6 2.6 2.6 2.6 2.62.4
2.32.2
2.12.0
1.7
1.0
1.5
2.0
2.5
3.0
3.5
4.0
Fra
nce
Hung
ary
Luxe
mb
ou
rg
Bulg
aria
Belg
ium
Cze
ch R
ep
ub
lic
Slo
vak R
epu
blic
Germ
any
Sw
itze
rla
nd
Spa
in
Austr
ia
Port
ug
al
Pola
nd
OE
CD
ave
rag
e
Ma
lta
Ire
land
Gre
ece
Rom
ania
Slo
ven
ia
Italy
Fin
land
Ne
the
rla
nds
Sw
ede
n
Mo
ldova
Lithu
ania
Denm
ark
Norw
ay
Un
ited
Kin
gd
om
Esto
nia
Latv
ia
Icela
nd
Odds ratioIncreased likelihood of students in the bottom quarter of ESCS scoring below Level 2 in science,relative to non-disadvantaged students (3 other quarters of ESCS)
9

Percentage of resilient students
48
43
3938
35 35 35 3534
3130 29 29
28 27 27 27 26 26 25 25 2423
2221
1918 18 17
14 1311
9
0
10
20
30
40
50
60
Esto
nia
Fin
land
Spa
in
Port
ug
al
Un
ited
Kin
gd
om
Latv
ia
Slo
ven
ia
Pola
nd
Germ
any
Neth
erla
nds
Ire
land
OE
CD
ave
rag
e
Sw
itze
rla
nd
Denm
ark
Belg
ium
Fra
nce
Italy
Norw
ay
Austr
ia
Czech R
ep
ub
lic
Sw
ede
n
Cro
atia
Lithu
ania
Ma
lta
Luxe
mb
ou
rg
Hung
ary
Gre
ece
Slo
vak R
epu
blic
Icela
nd
Bulg
aria
Mo
ldova
Rom
ania
Mo
nte
neg
ro
% Percentage of resilient students 2015
Resilient students come from the bottom 25% of the
ESCS index within their country/economy and
perform among the top 25% across all
countries/economies, after accounting for socio-
10

Societies with more social inequality, show larger skills
gaps by parental education backgroundAverage numeracy score by parent educational background (PEB) and inequality
240
250
260
270
280
290
300
0.18 0.23 0.28 0.33 0.38
Nu
mer
acy
sco
re
Inequality (Gini coefficient)
Low PEB Medium PEB High PEB
11
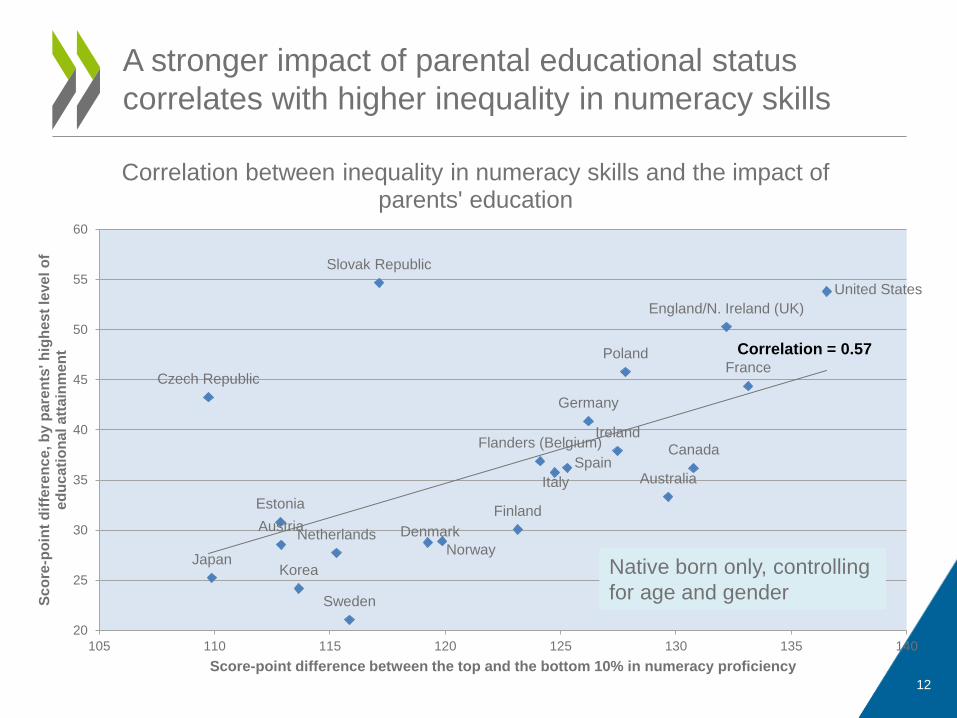
A stronger impact of parental educational status
correlates with higher inequality in numeracy skills
Australia
Austria
Flanders (Belgium)Canada
Czech Republic
Denmark
EstoniaFinland
France
Germany
Ireland
Italy
JapanKorea
NetherlandsNorway
Poland
Slovak Republic
Spain
Sweden
England/N. Ireland (UK)
United States
20
25
30
35
40
45
50
55
60
105 110 115 120 125 130 135 140
Sc
ore
-po
int
dif
fere
nc
e, b
y p
are
nts
' h
igh
es
t le
ve
l o
f e
du
ca
tio
na
l a
tta
inm
en
t
Score-point difference between the top and the bottom 10% in numeracy proficiency
Correlation between inequality in numeracy skills and the impact of parents' education
Correlation = 0.57
Native born only, controlling
for age and gender
12

Participation in adult education and training by skills,
education, parents’ education and labour market status
0
10
20
30
40
50
60
70
80
90
100
Pa
rti
cip
ati
on
ra
tes
of
25
-64
ye
ar
-old
s i
n
for
ma
l a
nd
/or
no
n-f
or
ma
l e
du
ca
tio
n
Level 4/5
Level 3
Level 2
Level 0/1
Literacy proficiency level:
0
10
20
30
40
50
60
70
80
90
100
Tertiary
Upper secondary or post-secondary non-tertiary
Below upper secondary
Educational attainment level:
0
10
20
30
40
50
60
70
80
90
100
Employed
Unemployed
Inactive
Labour market status:
0
10
20
30
40
50
60
70
80
90
100
Tertiary
Upper secondary or post-secondary non-tertiary
Below upper secondary
Educational attainment level of parents:
13

Skills and skills use foster adult learning
Adult participation in formal and/or non-formal education, by frequency of use of reading skills in everyday life (2012 or 2015)
0
10
20
30
40
50
60
70
80
90
Fin
land
Den
ma
rk
Sw
ed
en
Isra
el
Neth
erl
an
ds
Esto
nia
New
Zea
land
Norw
ay
Slo
ve
nia
Ko
rea
Unite
d S
tate
s
Chile
Sin
ga
pore
Sp
ain
Can
ad
a
Au
str
alia
OE
CD
avera
ge
Ire
lan
d
Po
lan
d
EU
22
avera
ge
Lith
uan
ia
Czech
Rep
ublic
Ge
rma
ny
En
gla
nd (
UK
)
Fla
nd
ers
(B
elg
ium
)
Tu
rke
y
Nort
he
rn Ire
lan
d (
UK
)
Au
str
ia
Jakart
a (
Ind
one
sia
)
Jap
an
Slo
va
k R
ep
ub
lic
Italy
Gre
ece
Fra
nce
Ru
ssia
n F
ed
era
tio
n
%
Participation among adults with the highest frequency of use of reading skills in everyday life
Participation among adults with the lowest frequency of use of reading skills in everyday life
14

15
Gap in literacy performance between adults
with and without tertiary-educated parents

0%
10%
20%
30%
40%
50%
60%
70%
80%
90%
100%
Pola
nd
Ire
lan
d
Hu
ng
ary
Czech
Re
pu
blic
Au
str
alia
Gre
ece
Ita
ly
Fra
nce
Spain
Sw
ed
en
Un
ite
d K
ing
do
m
Lu
xe
mb
ou
rg
Be
lgiu
m
Slo
ve
nia
Ne
the
rla
nd
s
Po
rtu
ga
l
OE
CD
ave
rag
e
Ca
na
da
Tu
rke
y
Sw
itzerland
De
nm
ark
Fin
lan
d
Ne
w Z
ea
land
Au
str
ia
Ice
lan
d
No
rwa
y
Un
ite
d S
tate
s
Ge
rma
ny
Slo
va
k R
ep
ub
lic
Esto
nia
High Medium Low Downward mobility Upward mobility
Intergenerational mobility in education (2009)Percentage of 25-34 year-old non-students whose educational attainment is higher than their parents’
(upward mobility), lower (downward mobility) or the same (status quo) and status quo by parents'
educational level (low, medium, high)

Intergenerational educational mobility
(PIAAC)
0
10
20
30
40
50
60
70
Czech…
Ger
man
y
Au
stri
a
Un
ited
Sta
tes
Slovak…
Ital
y
No
rway
Den
mar
k
Englan
d/N
.…
Spai
n
Ave
rage
Au
stra
lia
Jap
an
Swed
en
Esto
nia
Can
ada
Net
her
lan
ds
Po
lan
d
Irel
and
Fran
ce
Flan
ders…
Fin
lan
d
Ko
rea
Russian…
Downward mobility Upward mobility%
17

Intergenerational upward mobility by age group
15
20
25
30
35
40
45
50
55
55-64 45-54 35-44 25-34
Up
wa
rd M
ob
ility
Age groups
Average France Germany Italy
Spain Sweden United States England/N. Ireland (UK)
18
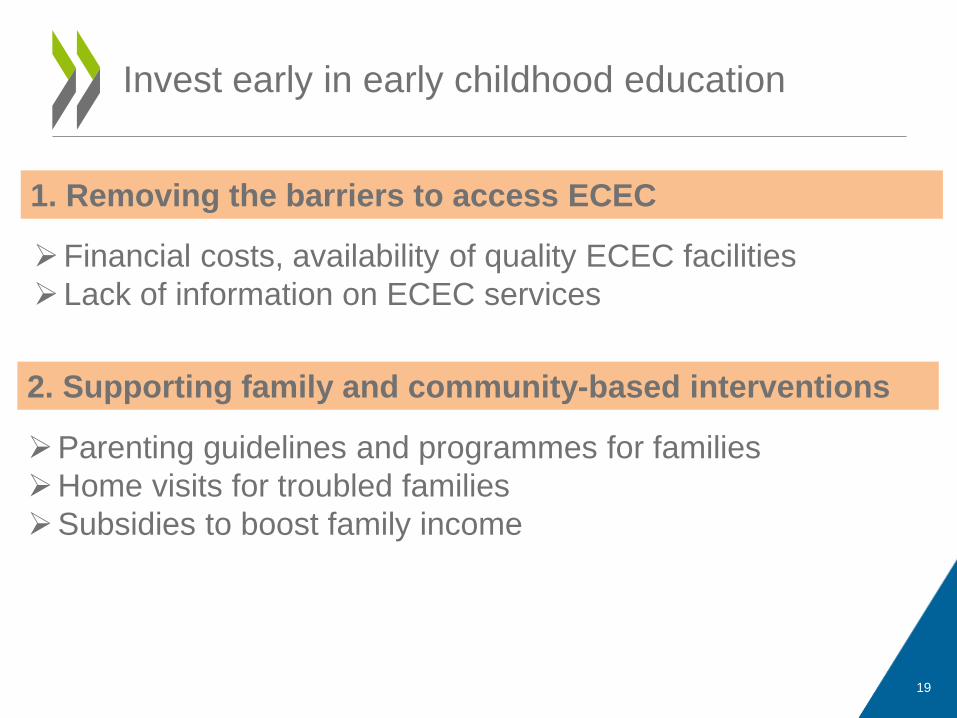
Invest early in early childhood education
1. Removing the barriers to access ECEC
2. Supporting family and community-based interventions
Financial costs, availability of quality ECEC facilities
Lack of information on ECEC services
Parenting guidelines and programmes for families
Home visits for troubled families
Subsidies to boost family income
19

1. Identifying low performers early on and provide targeted
support
2. Supporting disadvantaged schools
Early identification and support for low performers
Delaying tracking and minimizing grade repetition
Holding high expectations for all students
Allocation of adequate resources to disadvantaged schools
Investing in high-quality human resources such as school leaders and
teachers
Creation of networks and greater opportunities for “professional
knowledge exchange”
Support low performers from disadvantaged
backgrounds and disadvantaged schools
20

Provide continuing education opportunities for
adults
1. Providing targeted learning support for the most vulnerable groups
2. Focusing on improving basic literacy, numeracy and language
acquisition
3. Providing innovative and flexible learning opportunities to overcome
access barriers
4. Combining adult education, and practical job training and career
guidance to reintegrate unemployed adults into the labour market
21

Thank you !
twitter @VanDammeEDU
22