Embed Size (px)
Citation preview

Poverty Line Estimation: Concepts and Issues in India
SUBMITTED TO :- DEPARTMENT OF AGRICULTURAL ECONOMICSS.K.N. COLLEGE OF AGRICULTURE, JOBNER
SRI KARAN NARENDRA AGRICULTURAL UNIVERSITY, JOBNER
SUBMITTED BY:- Indu Swami
M.Sc. (Ag.) AGRICULTURAL ECONOMICS
3
Poverty Line Estimation: Concepts and Issues in India
04/15/2023 10:39 AM 4
INTRODUCTION India is a prominent global voice that has made significant
progress on human development over the past 60 years, but the benefits of a growing economy are not shared equally: the country is still home to one-third of the world’s poor
More than one third of the population lacks the resources and information to meet basic human needs such as adequate food, clean drinking water, sanitation, good health provision, shelter and education.
Science, technology and innovation can play a crucial role in alleviating poverty. They have led to a wide array of developments, from boosting agricultural productivity to providing the means to generate energy cheaply.
04/15/2023 10:39 AM 5
poverty
According to World bank “Poverty is the deprivation of food, shelter, money and clothing when people can’t satisfy their basic needs. Poverty can be understood simply as a lack of money or more broadly in terms of barriers to everyday human life”.
According to Mobile Orshansky who developed the poverty measurements used by the U.S. government, “ Poor is to be deprived of those goods, services and pleasures which others around us take for granted.”According to David Kurten , “ Poverty also involve social disintegration and environmental degradation which he describe as forming the threefold human crisis in the world today”.
Types Of Poverty
(1) Absolute Poverty : (Destitution) It refers to the state of severe deprivation of basic human needs.
(2) Relative Poverty : It is defined contextually as Economic inequality in location or society in which people live.
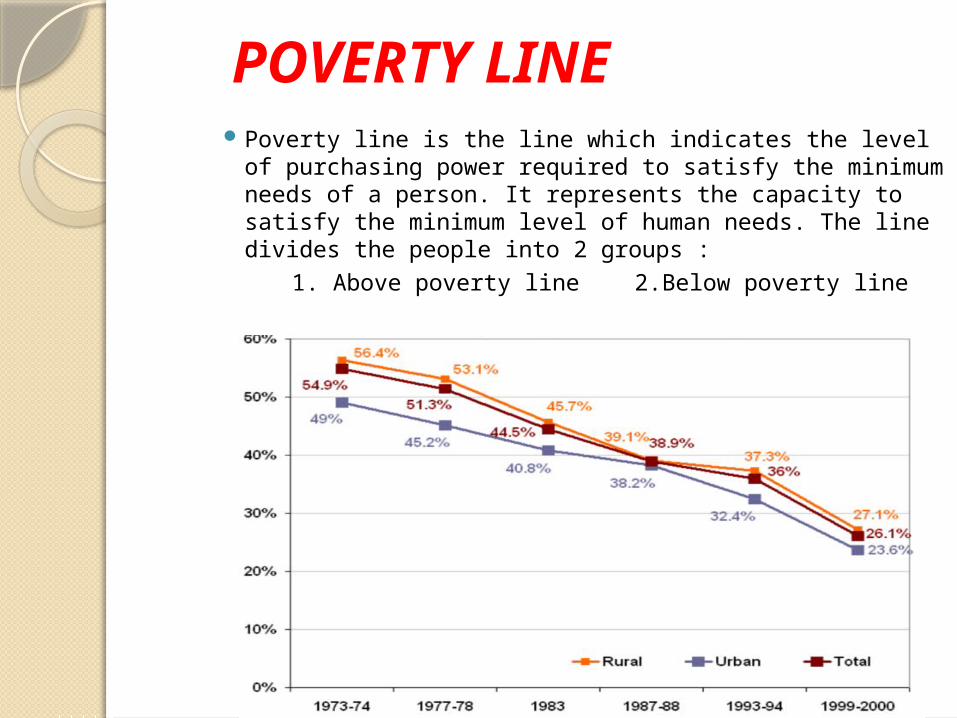
POVERTY LINE Poverty line is the line which indicates the level of
purchasing power required to satisfy the minimum needs of a person. It represents the capacity to satisfy the minimum level of human needs. The line divides the people into 2 groups :
1. Above poverty line 2.Below poverty line
8
Poverty is easy to spot but difficult to estimate.
Poverty lines are cut-off points separating the poor from the non-poor.
Everybody measures poverty in their own way.
Its multidimensional nature makes the estimation of poverty difficult and controversial.
Measurement of Poverty in World: A Chronological Examination
10
International Poverty Line : World Bank Approach
The international poverty line was first developed by World Bank, working on the 1990 World Development Report (WDR), which focused on poverty.
Dollar a day line i.e., $1 per day in terms of PPP exchange rates.
In 2000, World Bank updated it to $1.08 per day.
Armed with International Comparison Programme (ICP) 2005 data which used almost 700 surveys for 115 countries, World Bank updated new poverty line $1.25 per day that serves as the common international standard of extreme poverty (Ravallion and Chen, 2008).
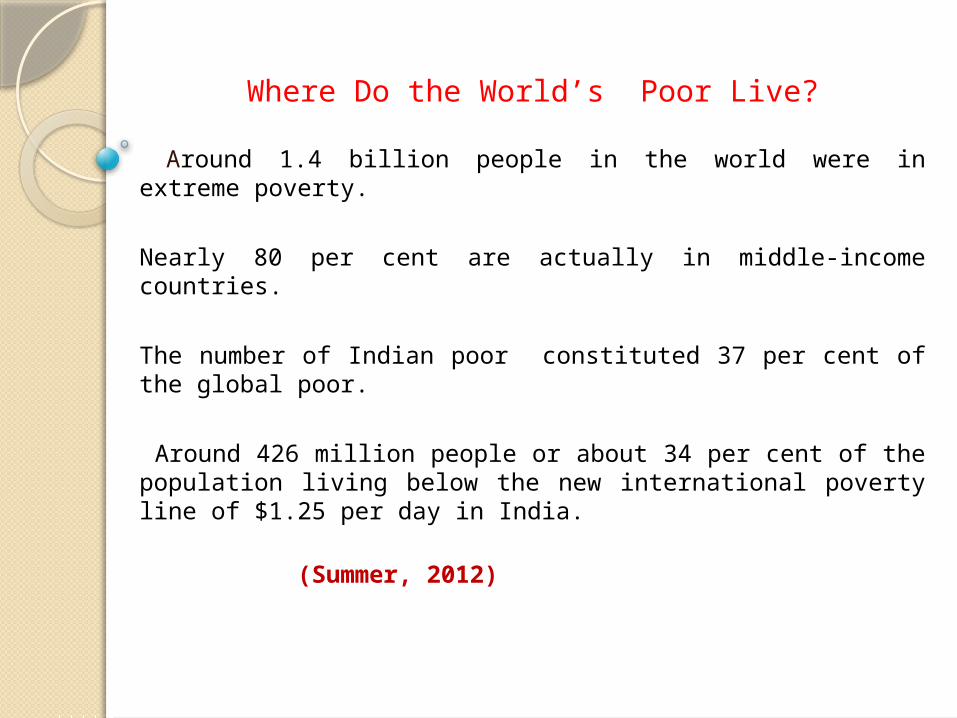
Where Do the World’s Poor Live?
Around 1.4 billion people in the world were in extreme poverty.
Nearly 80 per cent are actually in middle-income countries.
The number of Indian poor constituted 37 per cent of the global poor.
Around 426 million people or about 34 per cent of the population living below the new international poverty line of $1.25 per day in India.
(Summer, 2012)
12
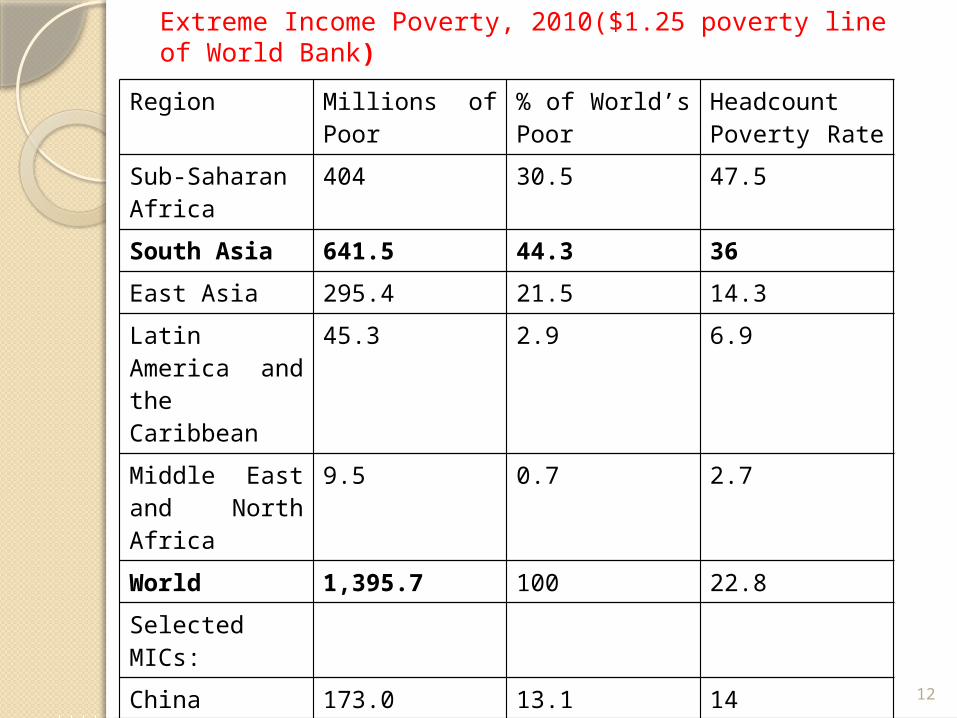
Extreme Income Poverty, 2010($1.25 poverty line of World Bank)
Region Millions of Poor % of World’s Poor
Headcount Poverty Rate
Sub-Saharan Africa
404 30.5 47.5
South Asia 641.5 44.3 36
East Asia 295.4 21.5 14.3
Latin America and the Caribbean
45.3 2.9 6.9
Middle East and North Africa
9.5 0.7 2.7
World 1,395.7 100 22.8
Selected MICs:
China 173.0 13.1 14
India 426 37.4 34.5
Indonesia 51.5 4.2 22.6
Nigeria 100.5 8.1 66.5
Poverty Line Estimation in Developed Countries
In most of Europe, a family with a net income of less than 60% of the “ net disposable income” is counted as poor.
In USA, poverty line represents the basic cost of food for a family multiplied by three. The threshold level is adjusted for inflation every year. A family is counted as poor if its pre-tax income is below this threshold.
(Nanda and Suresh, 2012)
13
Measurement of Poverty in India: A Chronological Examination
15
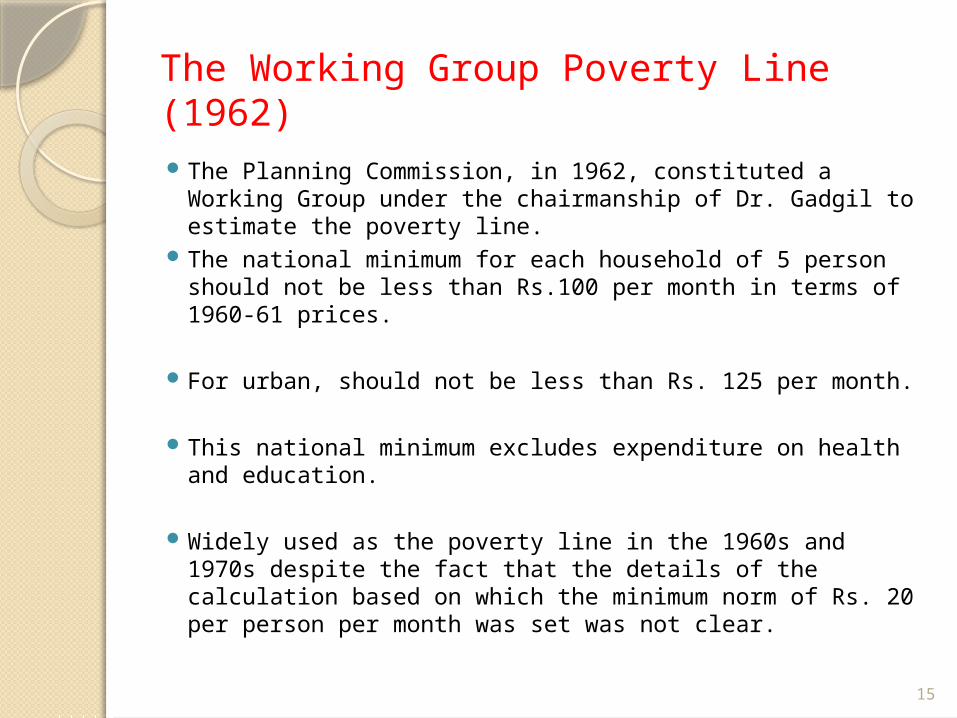
The Working Group Poverty Line (1962)
The Planning Commission, in 1962, constituted a Working Group under the chairmanship of Dr. Gadgil to estimate the poverty line.
The national minimum for each household of 5 person should not be less than Rs.100 per month in terms of 1960-61 prices.
For urban, should not be less than Rs. 125 per month.
This national minimum excludes expenditure on health and education.
Widely used as the poverty line in the 1960s and 1970s despite the fact that the details of the calculation based on which the minimum norm of Rs. 20 per person per month was set was not clear.
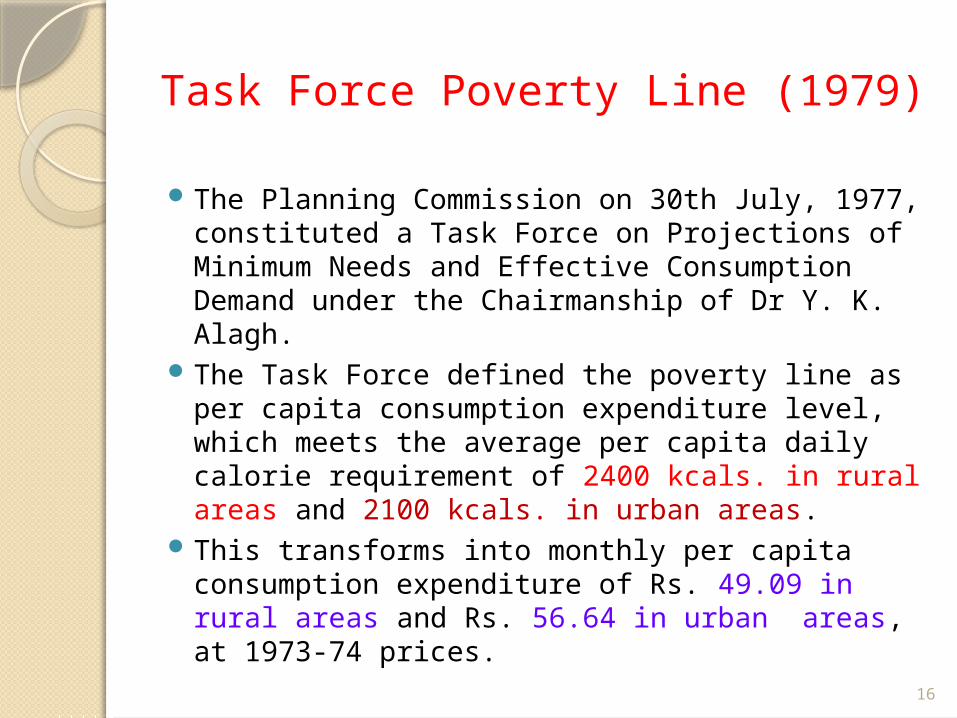
Task Force Poverty Line (1979)
The Planning Commission on 30th July, 1977, constituted a Task Force on Projections of Minimum Needs and Effective Consumption Demand under the Chairmanship of Dr Y. K. Alagh.
The Task Force defined the poverty line as per capita consumption expenditure level, which meets the average per capita daily calorie requirement of 2400 kcals. in rural areas and 2100 kcals. in urban areas.
This transforms into monthly per capita consumption expenditure of Rs. 49.09 in rural areas and Rs. 56.64 in urban areas, at 1973-74 prices.
16
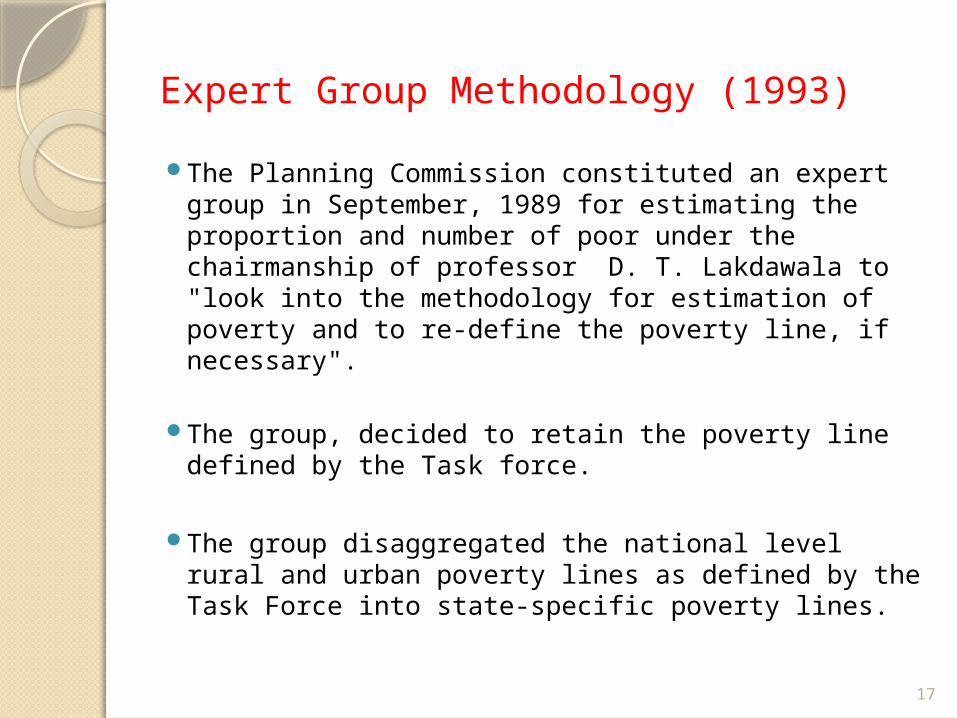
Expert Group Methodology (1993)
The Planning Commission constituted an expert group in September, 1989 for estimating the proportion and number of poor under the chairmanship of professor D. T. Lakdawala to "look into the methodology for estimation of poverty and to re-define the poverty line, if necessary".
The group, decided to retain the poverty line defined by the Task force.
The group disaggregated the national level rural and urban poverty lines as defined by the Task Force into state-specific poverty lines.
17
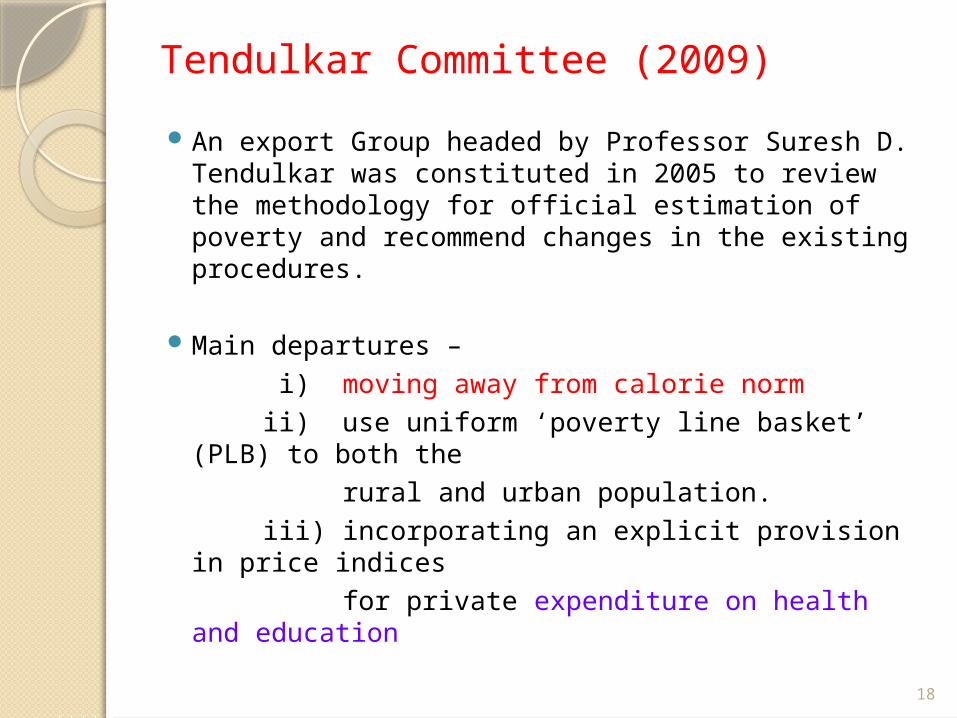
Tendulkar Committee (2009)
An export Group headed by Professor Suresh D. Tendulkar was constituted in 2005 to review the methodology for official estimation of poverty and recommend changes in the existing procedures.
Main departures –
i) moving away from calorie norm
ii) use uniform ‘poverty line basket’ (PLB) to both the
rural and urban population.
iii) incorporating an explicit provision in price indices
for private expenditure on health and education
18
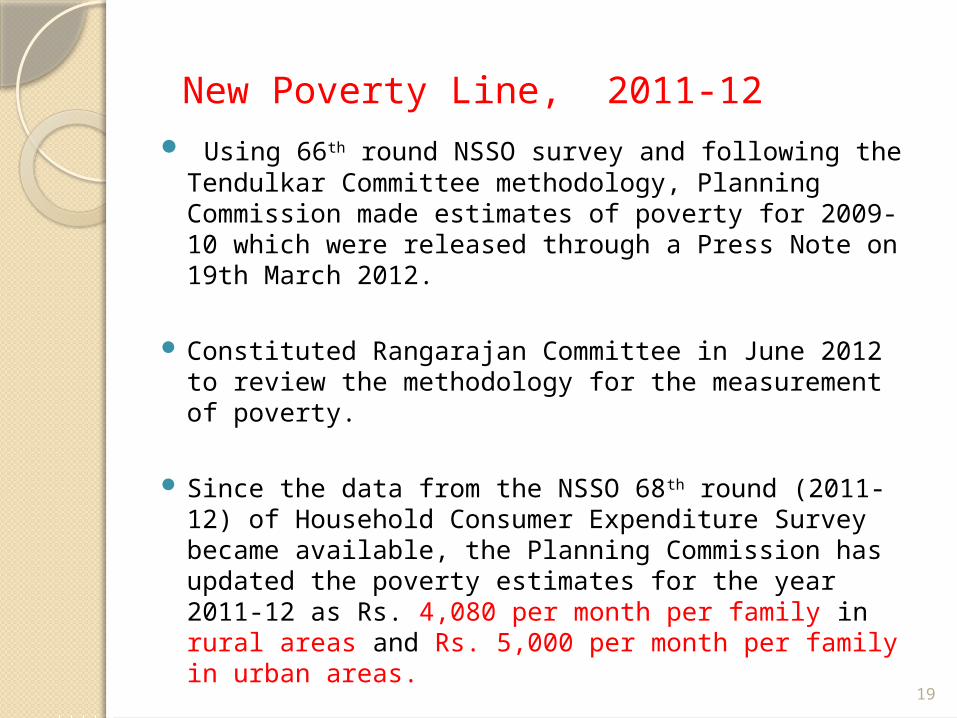
New Poverty Line, 2011-12
Using 66th round NSSO survey and following the Tendulkar Committee methodology, Planning Commission made estimates of poverty for 2009-10 which were released through a Press Note on 19th March 2012.
Constituted Rangarajan Committee in June 2012 to review the methodology for the measurement of poverty.
Since the data from the NSSO 68th round (2011-12) of Household Consumer Expenditure Survey became available, the Planning Commission has updated the poverty estimates for the year 2011-12 as Rs. 4,080 per month per family in rural areas and Rs. 5,000 per month per family in urban areas.
19
04/15/2023 10:39 AM 20
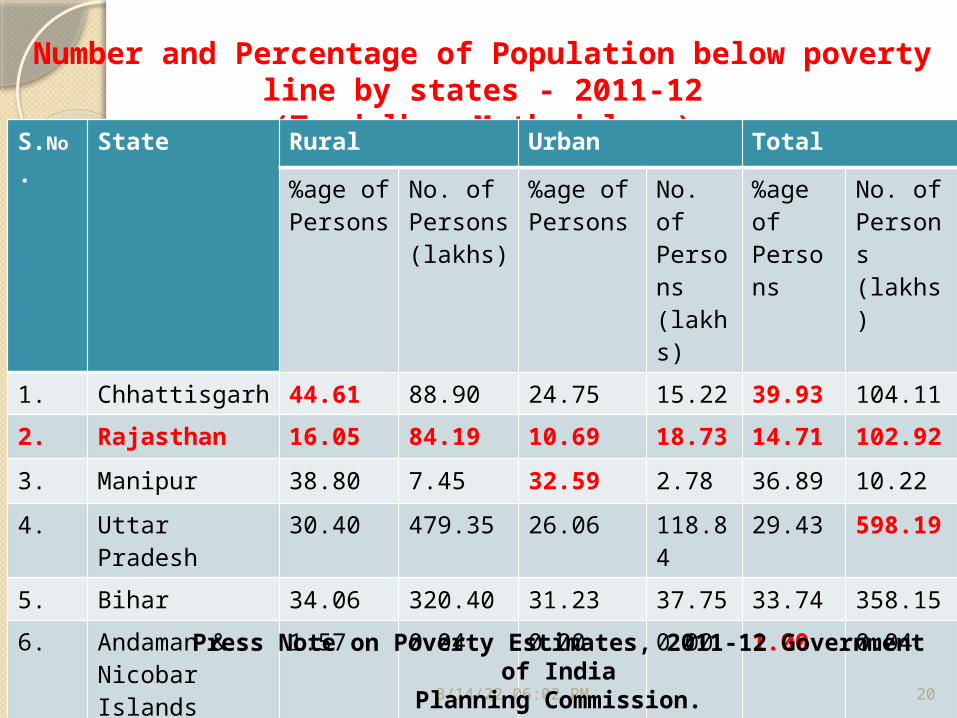
Number and Percentage of Population below poverty line by states - 2011-12
(Tendulkar Methodology)S.No
.State Rural Urban Total
%age ofPersons
No. ofPersons(lakhs)
%age ofPersons
No. ofPersons(lakhs)
%age ofPersons
No. ofPersons(lakhs)
1. Chhattisgarh 44.61 88.90 24.75 15.22 39.93 104.11
2. Rajasthan 16.05 84.19 10.69 18.73 14.71 102.92
3. Manipur 38.80 7.45 32.59 2.78 36.89 10.22
4. Uttar Pradesh 30.40 479.35 26.06 118.84
29.43 598.19
5. Bihar 34.06 320.40 31.23 37.75 33.74 358.15
6. Andaman & Nicobar Islands
1.57 0.04 0.00 0.00 1.00 0.04
7. India 25.70 2166.58 13.70 531.25
21.92 2697.83
Press Note on Poverty Estimates, 2011-12 Government of India
Planning Commission.
21
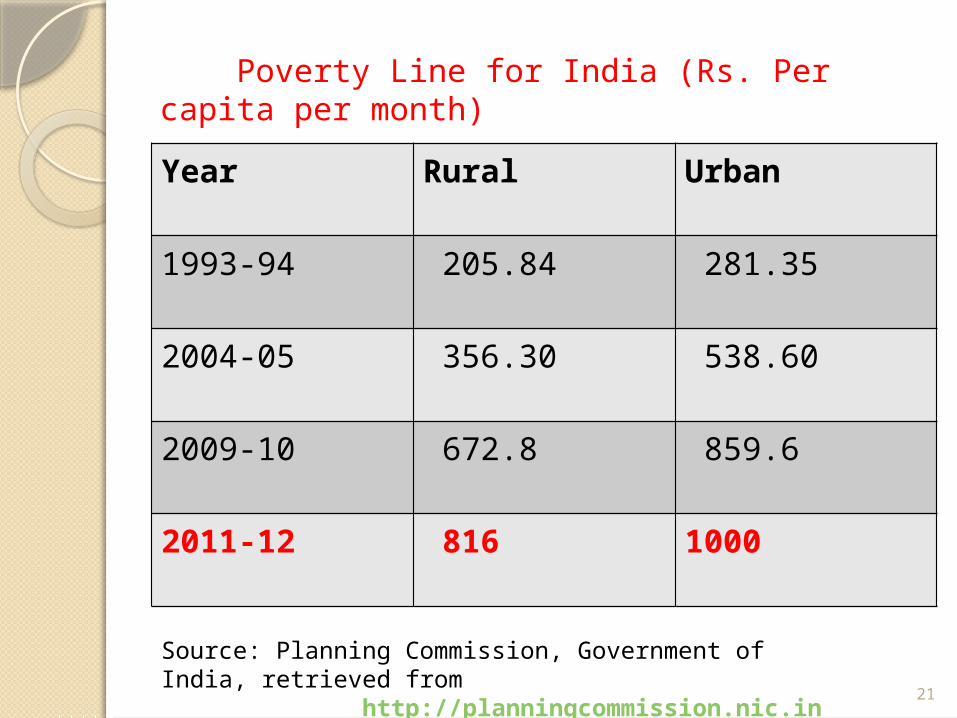
Poverty Line for India (Rs. Per capita per month)
Year Rural Urban
1993-94 205.84 281.35
2004-05 356.30 538.60
2009-10 672.8 859.6
2011-12 816 1000
Source: Planning Commission, Government of India, retrieved from http://planningcommission.nic.in
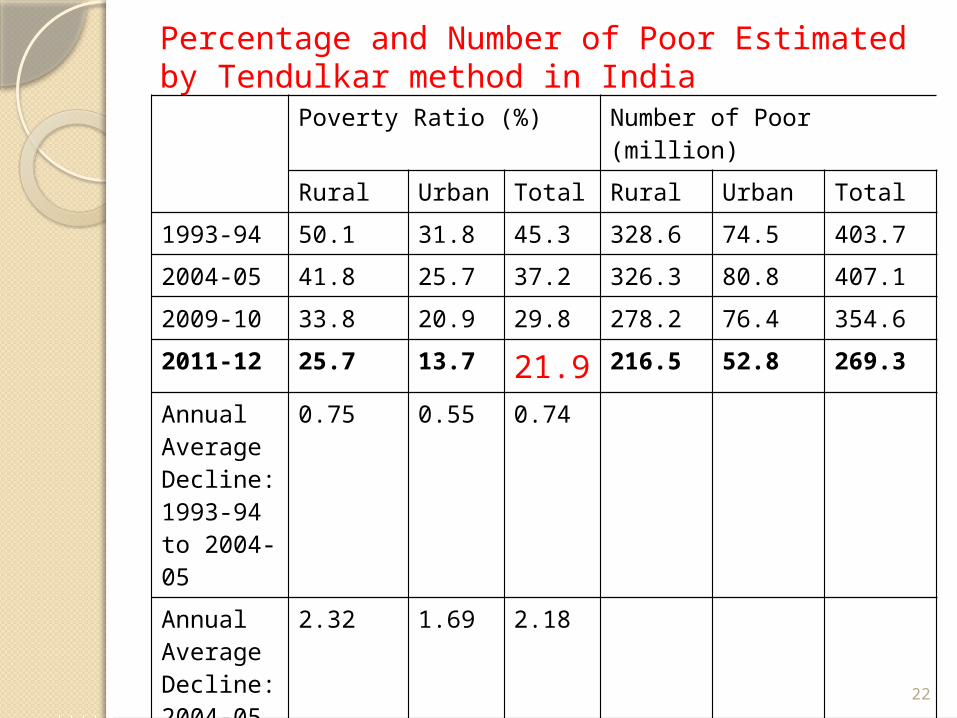
Percentage and Number of Poor Estimated by Tendulkar method in India
Poverty Ratio (%) Number of Poor (million)
Rural Urban Total Rural Urban Total
1993-94 50.1 31.8 45.3 328.6 74.5 403.7
2004-05 41.8 25.7 37.2 326.3 80.8 407.1
2009-10 33.8 20.9 29.8 278.2 76.4 354.6
2011-12 25.7 13.7 21.9 216.5 52.8 269.3
Annual Average Decline: 1993-94 to 2004-05
0.75 0.55 0.74
Annual Average Decline: 2004-05 to 2011-12
2.32 1.69 2.18
22
23
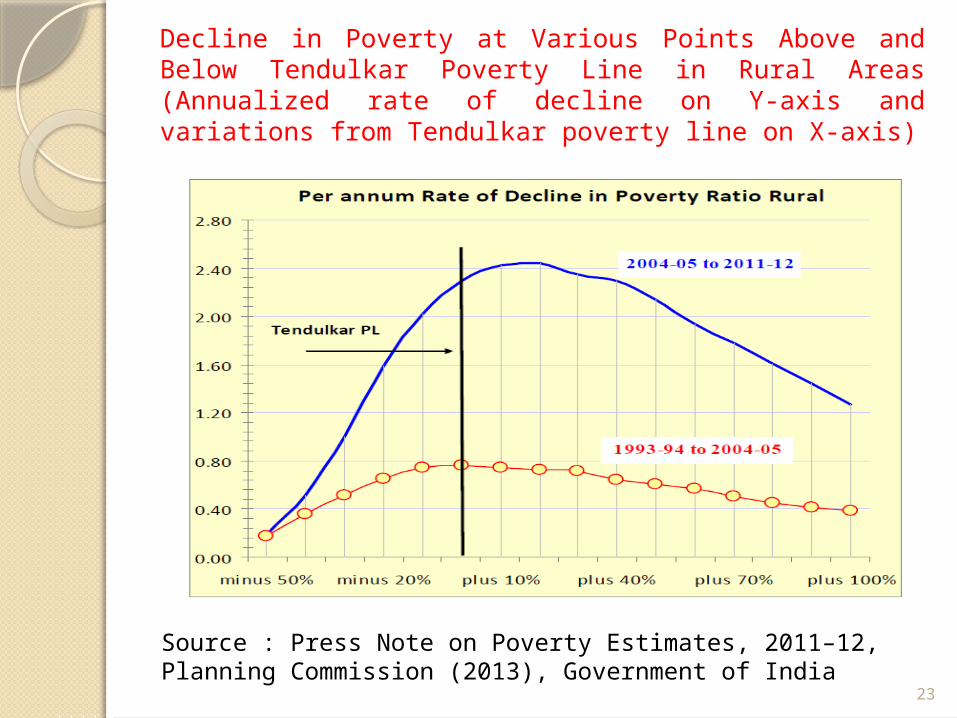
Decline in Poverty at Various Points Above and Below Tendulkar Poverty Line in Rural Areas (Annualized rate of decline on Y-axis and variations from Tendulkar poverty line on X-axis)
Source : Press Note on Poverty Estimates, 2011–12, Planning Commission (2013), Government of India
24
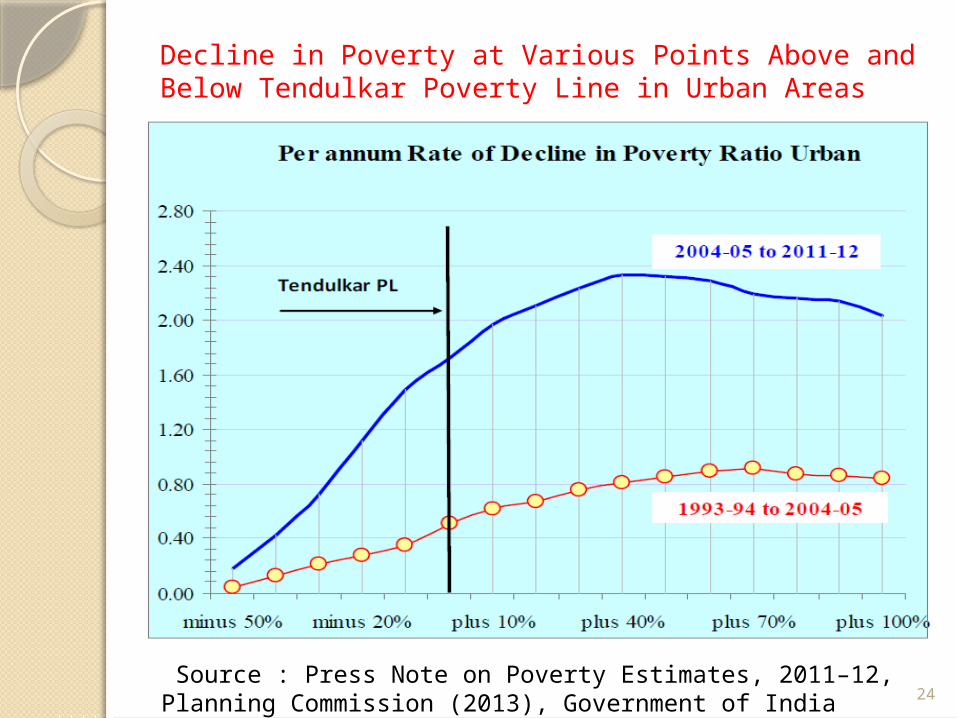
Decline in Poverty at Various Points Above and Below Tendulkar Poverty Line in Urban Areas
Source : Press Note on Poverty Estimates, 2011–12, Planning Commission (2013), Government of India
Trend decline claimed based on the Tendulkar poverty line is not going to alter with increase in the poverty line.
While the absolute levels of poverty would be higher, the rate of decline would be similar.
25
Facts say……Tendulkar line is roughly equal to the World Bank’s
well-established poverty line of $1.25 per day in Purchasing Power Parity terms.
The Tendulkar poverty line is 92% of the median expenditure in rural areas and 69% of the median expenditure in urban areas in 2004-2005.
(Himanshu, 2010)
26
04/15/2023 10:39 AM 27
Critics……
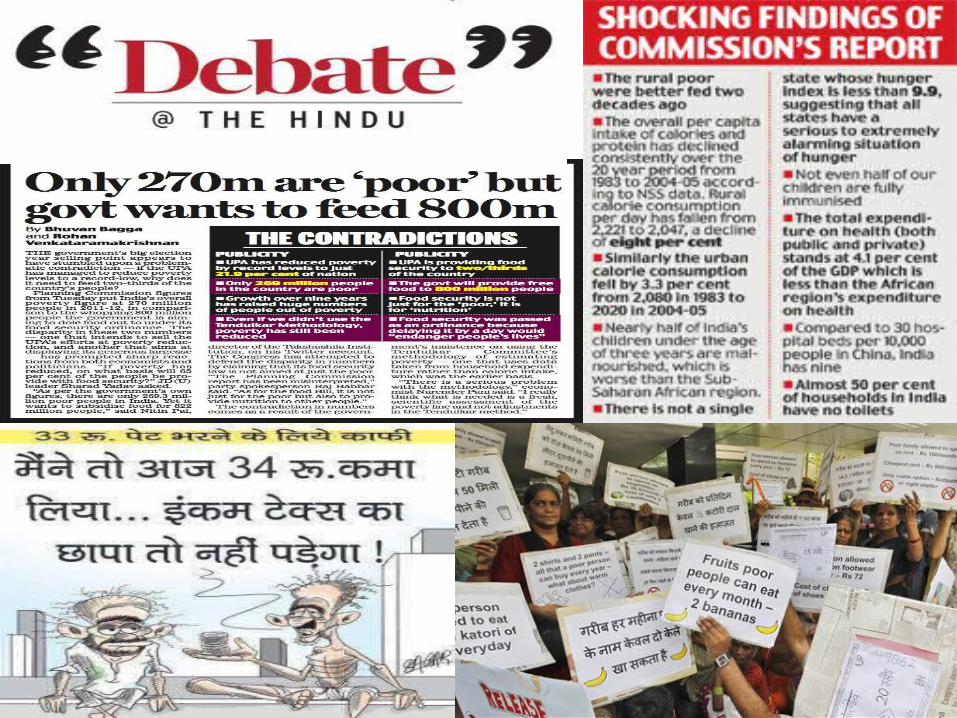
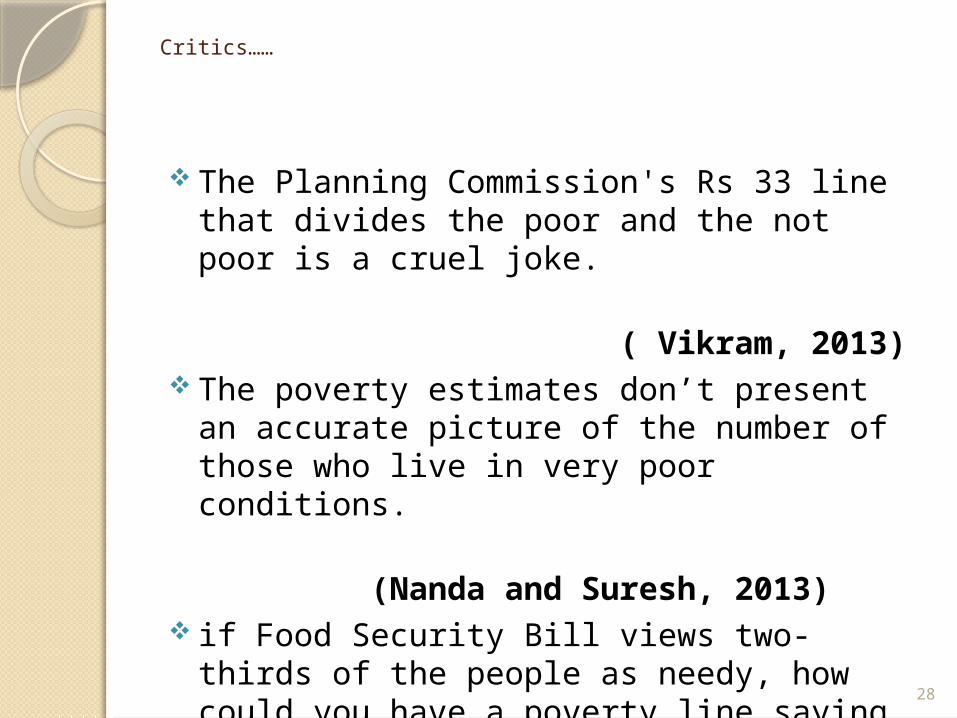
The Planning Commission's Rs 33 line that divides the poor and the not poor is a cruel joke.
( Vikram, 2013) The poverty estimates don’t present an accurate picture
of the number of those who live in very poor conditions.
(Nanda and Suresh, 2013) if Food Security Bill views two-thirds of the people as
needy, how could you have a poverty line saying only one third are poor?
(Aiyar,2013)
28
29
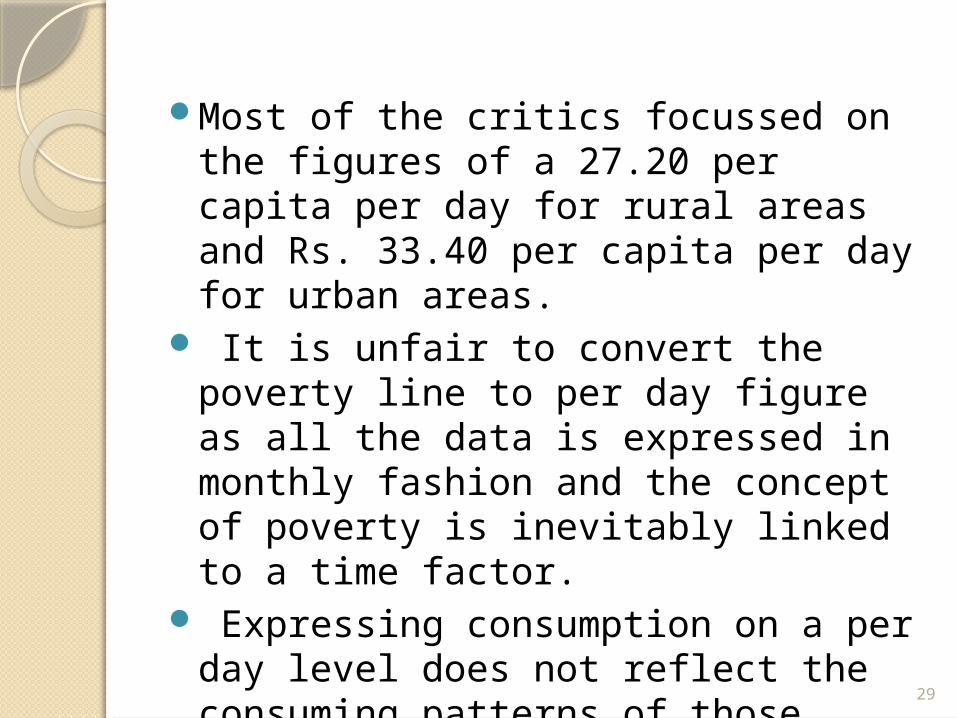
Most of the critics focussed on the figures of a 27.20 per capita per day for rural areas and Rs. 33.40 per capita per day for urban areas.
It is unfair to convert the poverty line to per day figure as all the data is expressed in monthly fashion and the concept of poverty is inevitably linked to a time factor.
Expressing consumption on a per day level does not reflect the consuming patterns of those surveyed because households budget on a monthly, not a daily basis.
(Pratima, 2013)
We can Conclude…….
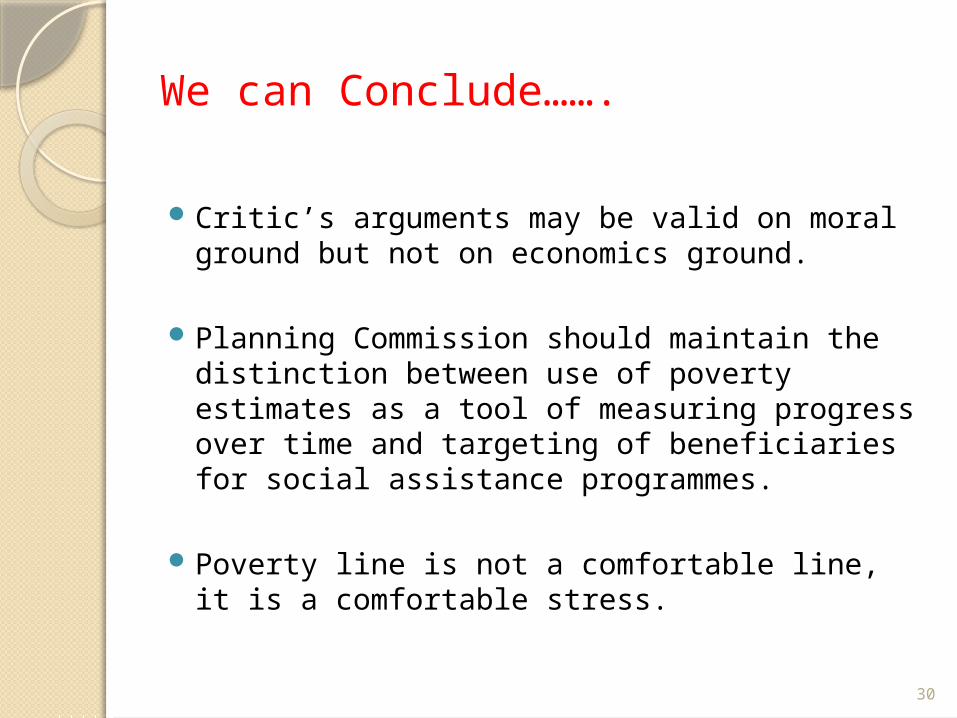
Critic’s arguments may be valid on moral ground but not on economics ground.
Planning Commission should maintain the distinction between use of poverty estimates as a tool of measuring progress over time and targeting of beneficiaries for social assistance programmes.
Poverty line is not a comfortable line, it is a comfortable stress.
30

From the viewpoint of keeping track of the fortunes of the destitute, poverty line is not crazy as the critics made out.
With limited revenue resources, we should target the destitute first.
Targeting above poverty line may be a good politics but very Bad Economics
Set higher poverty line, but be ready for another 1991-style Disaster.
31

32
Around 2.5 million people die every year due to hunger in India. So,
Please Do Not Waste Food

Help UsBe a Human
THANK YOU