Embed Size (px)
Citation preview
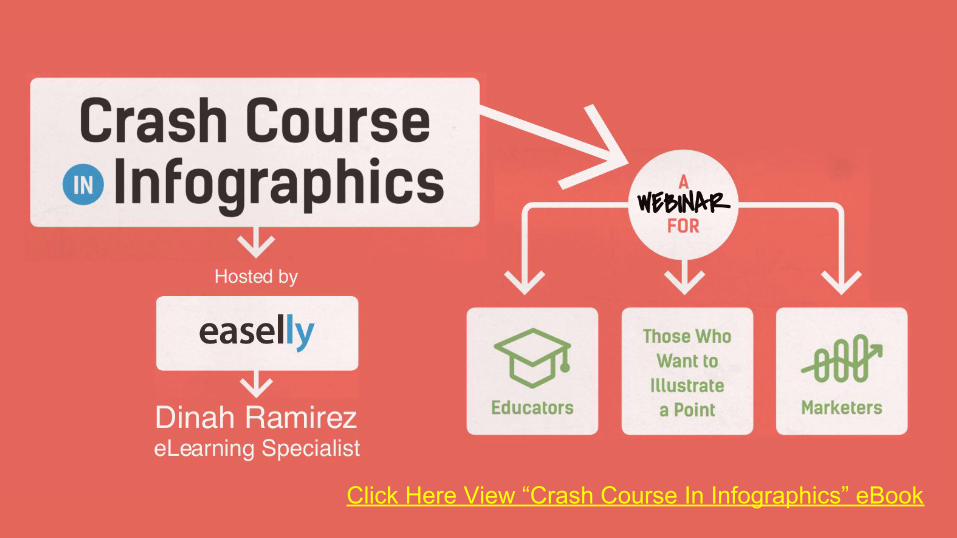
Click Here View “Crash Course In Infographics” eBook

Infographics Educate and Inform
What are you
looking to inform about?
Who are you
looking to inform?
Why do you want to inform?

How to Generate Ideas for an Infographic
Use the newsCurrent events are timely and can offer access to new data
Help a Reporterwww.helpareporter.comDaily emails for media opportunities that could turn into infographics
Check what’s trendingReddit, Twitter, and Facebook
showcase what’s popular through Trending Topics
Lean on your expertiseCreate an infographic on a
niche you know wellExplore Existing InfographicsUse Google Images, Pinterest, or an infographic directory for inspiration

Basic Infographic StructureTitle or Topic
Beginning
Middle
End
Infographic should only include content related to the topic
Provide a brief introduction to topic
Provide multiple examples and facts to support your topic or argument
Summarize / reinforce your argument and / or provide a call to action

7 Most Common Types of Infographics

1. List
Supports a claim through a series of steps

2. Comparison (vs)
Compares two things in a head-to-head study
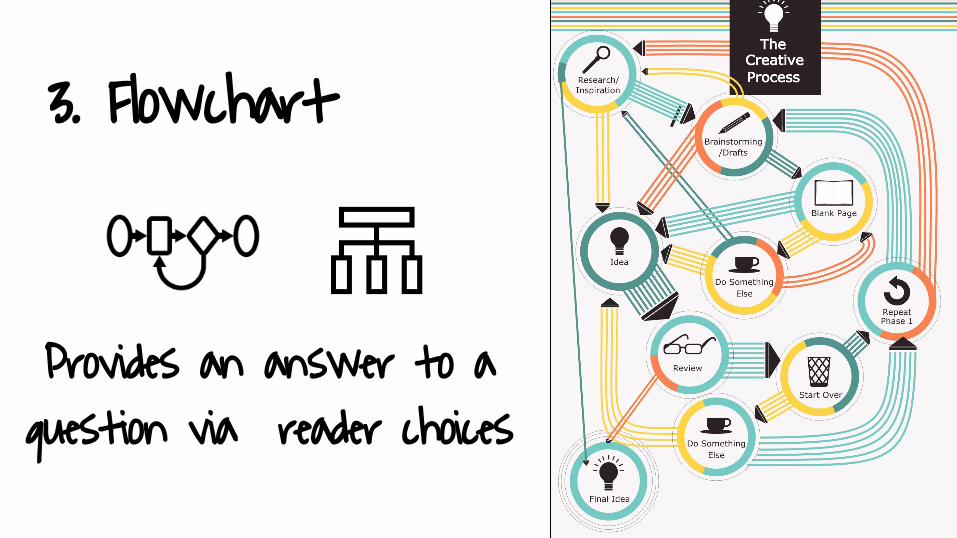
3. Flowchart
Provides an answer to a question via reader choices
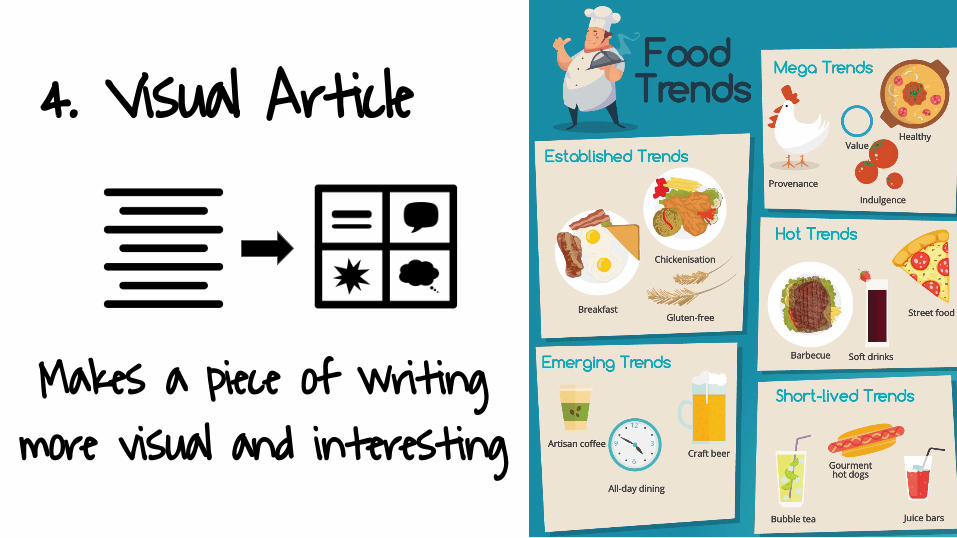
4. Visual Article
Makes a piece of writing more visual and interesting

5. Map
Showcases data trends based on location

6. Data Visualization
Communicates data through charts, graphs,
and/or design

7. Timeline
Tells a story through chronological flow

Key Steps to Building an Infographic
Create an outline
Design your infographic
Ensure the quality
● Consider your audience● Create a thesis/question● Focus / Narrow it down● Tell a story
● Be brief / Use graphics● Limit color and fonts● Is it viewable and legible?● Whitespace is good
● Use accurate data● Credit your sources● Sign it / Credit self
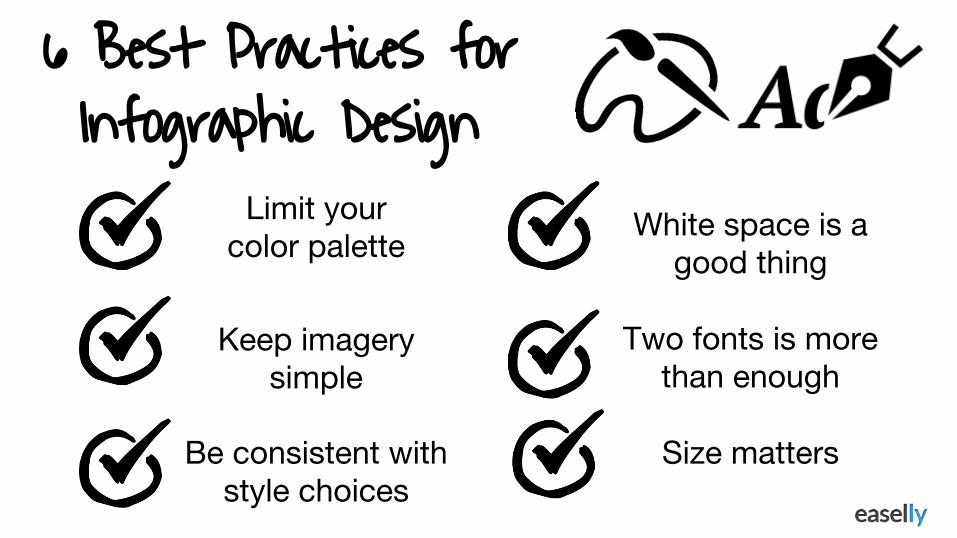
6 Best Practices for Infographic Design
Limit your color palette
Keep imagery simple
Be consistent with style choices
White space is a good thing
Two fonts is more than enough
Size matters

How to Get Started on Your Infographic with Easel.ly
Browse and Select Template or Start Fresh
Design with Drag and Drop editor and
other tools
Save, share, and/or Present

Go Pro! Free 14 Day Trial

Easel.ly Basic Account is Always FREE
Business$36/yr
per user
Nonprofit $18/yr
per user
Teacher$18/yr
Teacher w/ class$36/yr30 students
Please contact us directly for your discount! [email protected]