Embed Size (px)
DESCRIPTION
Citation preview
China Retail Industry Report, 2010-2011
July 2011
This report
Analyzes the market environment and status quo of
retail industry.
Focuses on retail industry by business form: general
merchandise Industry, supermarket industry, home
appliance chain Industry, gold & jewelry industry,
clothing Industry and food industry
Please visit our website to order this report and find more information about other titles at www.researchinchina.com
Related Products
China Mobile Payment Industry Report, 2010-2011
China City Commercial Bank Market Report, 2010-2011
China Financial POS Machine Industry Report, 2010-2011
China Guarantee Industry Report, 2010-2011
China Automatic Fare Collection (AFC) Machine Industry Report, 2010-2011
China Automated Teller Machine (ATM) Industry Report, 2010
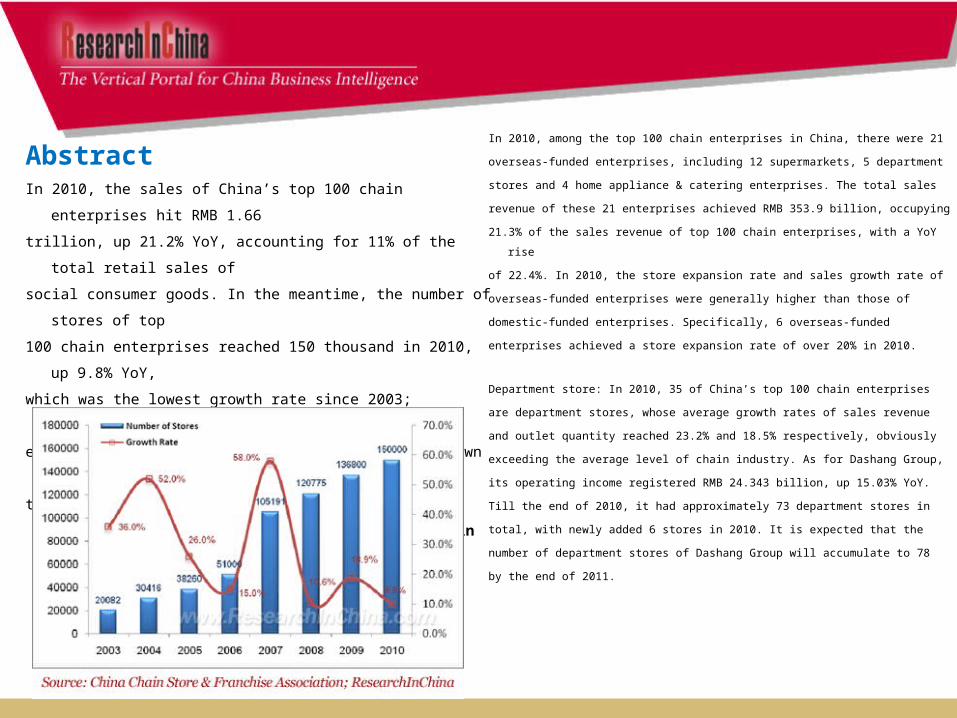
In 2010, among the top 100 chain enterprises in China, there were 21
overseas-funded enterprises, including 12 supermarkets, 5 department
stores and 4 home appliance & catering enterprises. The total sales
revenue of these 21 enterprises achieved RMB 353.9 billion, occupying
21.3% of the sales revenue of top 100 chain enterprises, with a YoY rise
of 22.4%. In 2010, the store expansion rate and sales growth rate of
overseas-funded enterprises were generally higher than those of
domestic-funded enterprises. Specifically, 6 overseas-funded
enterprises achieved a store expansion rate of over 20% in 2010.
Department store: In 2010, 35 of China’s top 100 chain enterprises
are department stores, whose average growth rates of sales revenue
and outlet quantity reached 23.2% and 18.5% respectively, obviously
exceeding the average level of chain industry. As for Dashang Group,
its operating income registered RMB 24.343 billion, up 15.03% YoY.
Till the end of 2010, it had approximately 73 department stores in
total, with newly added 6 stores in 2010. It is expected that the
number of department stores of Dashang Group will accumulate to 78
by the end of 2011.
AbstractIn 2010, the sales of China’s top 100 chain enterprises hit RMB 1.66
trillion, up 21.2% YoY, accounting for 11% of the total retail sales of
social consumer goods. In the meantime, the number of stores of top
100 chain enterprises reached 150 thousand in 2010, up 9.8% YoY,
which was the lowest growth rate since 2003; moreover, 18 of the 100
enterprises didn’t open new stores or even shut down existing stores in
the year.
Number of Stores and Growth Rate of Top 100 Chain Enterprises
in China, 2003-2010

status quo of China’s retail industry, related policies,
investment and financing situation, operation of
enterprises, and market segments.
Supermarket: In 2010, overseas-funded supermarket enterprises
kept a rapid development pace in general. Top 5 overseas-
funded supermarkets opened 140 new stores, up 22% YoY.
Among domestic-funded supermarket enterprises, CR Vanguard
continued to hold the leading position, with its operating income
increased by 5.6% YoY to RMB 71.8 billion in 2010. As of the
end of 2010, it had approximately 3,155 stores, up 7.8% YoY.
Jewelry: During 2010-2011, among domestic jewelry enterprises,
Shanghai Lao Fengxiang Co., Ltd. has kept the leading position,
with its operating income increased by 49% YoY to RMB 6.49
billion in Q1 2011. Till the end of 2010, Lao Fengxiang had 516
franchised stores, and plans to add 150-160 more in 2011.
With an aim to explore the market potential and master the
development trend of China’s retail industry, this report makes
an in-depth analysis of key issues in the industry, including the
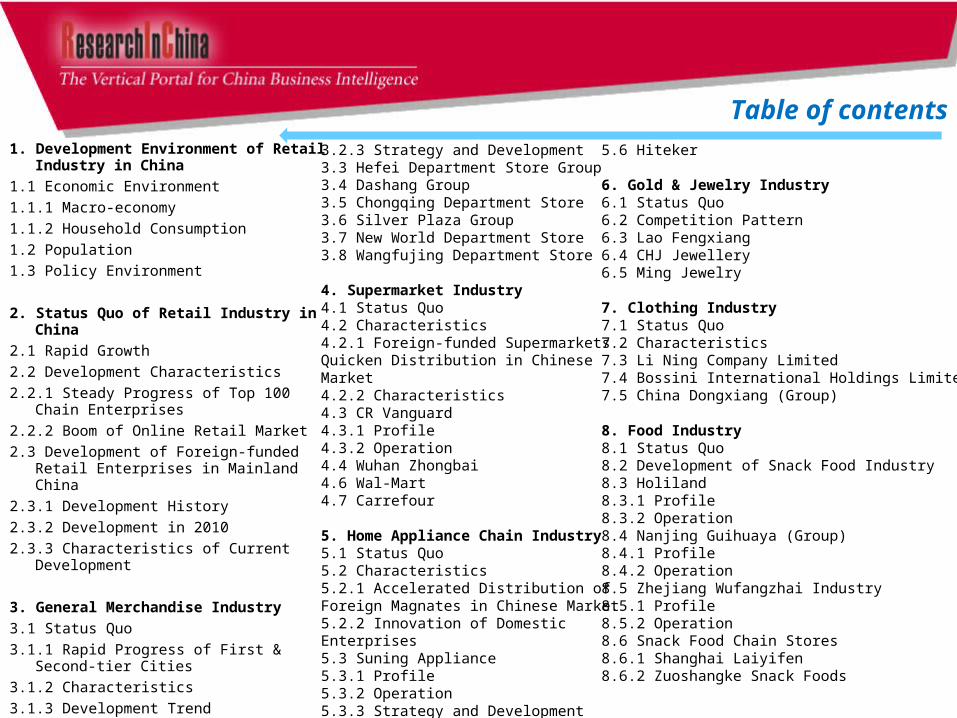
1. Development Environment of Retail Industry in China
1.1 Economic Environment
1.1.1 Macro-economy
1.1.2 Household Consumption
1.2 Population
1.3 Policy Environment
2. Status Quo of Retail Industry in China
2.1 Rapid Growth
2.2 Development Characteristics
2.2.1 Steady Progress of Top 100 Chain Enterprises
2.2.2 Boom of Online Retail Market
2.3 Development of Foreign-funded Retail Enterprises in Mainland China
2.3.1 Development History
2.3.2 Development in 2010
2.3.3 Characteristics of Current Development
3. General Merchandise Industry
3.1 Status Quo
3.1.1 Rapid Progress of First & Second-tier Cities
3.1.2 Characteristics
3.1.3 Development Trend
3.2 Bailian Group
3.2.1 Profile
3.2.2 Operation
Table of contents5.6 Hiteker
6. Gold & Jewelry Industry 6.1 Status Quo6.2 Competition Pattern 6.3 Lao Fengxiang 6.4 CHJ Jewellery6.5 Ming Jewelry
7. Clothing Industry 7.1 Status Quo7.2 Characteristics7.3 Li Ning Company Limited 7.4 Bossini International Holdings Limited 7.5 China Dongxiang (Group)
8. Food Industry 8.1 Status Quo8.2 Development of Snack Food Industry 8.3 Holiland 8.3.1 Profile 8.3.2 Operation 8.4 Nanjing Guihuaya (Group) 8.4.1 Profile 8.4.2 Operation 8.5 Zhejiang Wufangzhai Industry8.5.1 Profile 8.5.2 Operation 8.6 Snack Food Chain Stores 8.6.1 Shanghai Laiyifen8.6.2 Zuoshangke Snack Foods
3.2.3 Strategy and Development 3.3 Hefei Department Store Group 3.4 Dashang Group 3.5 Chongqing Department Store 3.6 Silver Plaza Group3.7 New World Department Store3.8 Wangfujing Department Store
4. Supermarket Industry 4.1 Status Quo4.2 Characteristics 4.2.1 Foreign-funded Supermarkets Quicken Distribution in Chinese Market 4.2.2 Characteristics 4.3 CR Vanguard 4.3.1 Profile 4.3.2 Operation 4.4 Wuhan Zhongbai 4.6 Wal-Mart 4.7 Carrefour
5. Home Appliance Chain Industry5.1 Status Quo5.2 Characteristics 5.2.1 Accelerated Distribution of Foreign Magnates in Chinese Market 5.2.2 Innovation of Domestic Enterprises 5.3 Suning Appliance 5.3.1 Profile5.3.2 Operation5.3.3 Strategy and Development 5.4 Gome Electrical Appliances5.5 Jiangsu Five-Star Appliance
• GDP Growth in China, 2007Q1-2011Q1
• Contribution of Final Consumption to GDP in China, 2009-2011
• Business Climate Index of Retail Industry in China, Mar.2006 – Mar.2011
• Changes of CPI in China, Jan.2007 – Mar.2011
• Consumer Spending Growth of Urban Residents in China, 2000-2010
• China's Population Structure, 2008-2010
• Total Retail Sales and Growth of Social Consumer Goods, 2002-2011
• Retail Sales Index of 1000 Key Enterprises in China, Mar.2009 –Mar.2011
• Revenue Growth of Key Retail Enterprises in China (by Industry), 2006-2011
• Revenue Growth of Key Retail Enterprises in China (by Product), 2006-2011
• Average Operating Income and Growth of Retail Industry in China, 2007-2010
• Average Net Income and Growth of Retail Industry in China, 2008Q1-2011Q1
• Revenue Proportion of Top 100 Chain Retailers in Total Retail Sales of Social Consumer Goods, 2002-2010
• Revenue and Growth of Top 100 Chain Retailers, 2006-2010
• Store Quantity and Growth of Top 100 Chain Retailers, 2003-2010
• Market Size of Online Shopping in China, 2007-2013E
• Proportion of Online Shopping Market Size in Total Retail Sales of Social Consumer Goods in China, 2007-2013E
• B2C & C2C Transaction Scale Proportion of Online Retail Markets in China, 2003-2013E
• Development History of Foreign-funded Retail Enterprises in China since 1978
• Sales and Store Quantity of Major International Retail Brands in China, 2010
• Sales Growth of General Merchandise Industry in China, Jan.2006 – Mar.2011
• Sales and Store Quantity of Department Stores in China, 2010
• Quarterly Gross Margin of General Merchandise Industry, 2008Q1-2011Q1
• Revenue Growth Comparison between National and Regional Department Stores, 2011Q1
• Revenue Growth Comparison between National and Regional Department Stores, 2011Q1
Selected Charts

• Per Capita Disposable Income and Growth of First & Second-tier Cities in China, 2010
• Brand Positioning of Major Department Stores in Chinese First & Second-tier Cities
• Operating Income and Net Income of Bailian Group, 2007-2011
• Gross Margin of Bailian Group, 2010Q1-2011Q1
• Business Structure and Growth of Bailian Group (by Industry), 2010
• Profit Growth of Subsidiaries of Bailian Group, 2005-2010
• Operating Income and Growth of Bailian Group (by Region), 2009-2010
• Operating Income and Growth of Hefei Department Store Group, 2007-2011
• Business Structure and Growth of Hefei Department Store Group (by Industry), 2010
• Business Structure of Hefei Department Store Group, 2010
• Net Income and Growth of Hefei Department Store Group, 2005-2010
• Operating Income Growth and Gross Margin of Hefei Department Store Group (by Sector), 2009-2010
• Quantity of Newly-added Supermarkets of Hefei Department Store Group (excluding Franchised Outlets), 2006-2010
• Operation of Major Subsidiaries of Hefei Department Store Group, 2010
• Operating Income and Profit of Dashang Group, 2007-2011
• Business Structure and Growth of Dashang Group (by Industry), 2010
• Business Structure of Dashang Group, 2010
• Main Business of Dashang Group (by Region), 2010
• Estimated Performance of Loss-making Stores of Dashang Group, 2009-2010
• Newly-added Stores of Dashang Group, 2008-2010
• Operating Income and Profit of Chongqing Department Store, 2007-2011
• Business Structure and Growth of Chongqing Department Store (by Industry), 2010
• Business Structure of Chongqing Department Store, 2010
• Revenue of Key Stores of Chongqing Department Store, 2010
• Revenue Growth of Chongqing Department Store (by Region), 2010
Selected Charts
• Quantity of Newly-added Stores of Chongqing Department Store, 2011-2012E
• Operating Income and Profit of Silver Plaza Group, 2007-2011
• Business Structure and Growth of Silver Plaza Group (by Region), 2009-2010
• Stores and Business Areas of Silver Plaza Group, 2005-2010
• Newly-added Stores of Silver Plaza Group, 2010
• Store Proportion of Silver Plaza Group by Age, Mar.2011
• Operating Income and Net Income of New World Department Store, 2007-2011
• Business Structure and Growth of New World Department Store (by Industry), 2010
• Operating Income and Net Income of Wangfujing Department Store, 2007-2011
• Business Structure and Growth of Wangfujing Department Store (by Industry), 2010
• Scale of Supermarket Industry in China, 2003-2014E
• Sales Growth of Supermarkets in 1000 Commercial Enterprises under MOC, 2006-2010
• Sales and Store Quantity of Supermarkets in Top 100 Chain Retailers, 2009-2010
• M&A of Supermarket Industry in China, 2002-2010
• Store Quantity and Distribution of Four Big Foreign-funded Supermarkets in China, 2010
• Store Quantity and Gross Margin Growth of Wal-Mart, FY1996-FY2010
• Store Quantity and Gross Margin Growth of Carrefour, FY1998-FY2010
• Operating Income and Gross Profit of China Resources, 2007-2010
• Operation Structure of China Resources (by Industry), 2010
• Operating Income and Net Income of Wuhan Zhongbai, 2007-2011
• Quarterly Store Expansion of Wuhan Zhongbai, 2009-2010
• Operating Income and Gross Margin of Wuhan Zhongbai (by Industry), 2010
• Business Performance of Major Subsidiaries of Wuhan Zhongbai, 2010
• Operating Income and Total Profit of Hualian Hypermarket, 2006-2011
• Distribution and Net Income of New Stores of Hualian Hypermarket, 2010
Selected Charts
• Net Income and Growth of Major Subsidiaries of Hualian Hypermarket, 2009-2010
• Sales Growth of Audio Appliances of Home Appliance Retailers above Designated Size, 2003- 2010
• Sales and Store Quantity of Home Appliance Retailers in China, 2010
• M&A of 2 Big Home Appliance Retailers in China, 2005-2010
• Retail Volume of Kitchen & Bathroom Appliances and Small Appliances in China, 2010
• Operating Income and Total Profit of Suning Appliance, 2007-2011
• Store Quantity and Different-tier Store Quantity Comparison of Suning Appliance, 2006-2011
• Business Structure and Growth of Suning Appliance (by Product), 2010
• Business Structure and Growth of Suning Appliance (by Region), 2010
• Sales Growth of Retail Stores of Suning Appliance, 2010
• Detailed Objectives of 10-Year Strategic Planning of Suning Appliance, 2011-2020E
• Operating Income and Net Income of Gome Electrical Appliances, 2007-2011
• Network Development of Gome Electrical Appliances, 2010 Year-end
• Store Quantity of Gome Electrical Appliances by Region, 2010 Year-end
• Business Structure and Growth of Gome Electrical Appliances (by Region), 2009-2010
• Business Structure and Growth of Gome Electrical Appliances (by Product), 2010
• Revenue and Growth of Jiangsu Five-Star Appliance, 2003-2010
• Store Quantity of Jiangsu Five-Star Appliance, 2003-2010
• Operating Income and Total Profit of Hiteker, 2006-2011
• Store Quantity and Growth of Hiteker E-commerce Business, 2005-2010
• Sales Proportion of Hiteker E-commerce Business, 2006-2010
• Sales Growth of Jewelry Enterprises above Designated Size, 2003-2010
• Sales Proportion of Jewelry Enterprises above Designated Size in Total Retail Sales of Commodities, 2005Q1-2011Q1
• Sales Growth of Jewelry Enterprises above Designated Size, GDP, and Resident Income Growth, 2005Q1-2011Q1
• Market Size and Growth Rate of Jewelry Industry in China, 2005-2010
Selected Charts
• Revenue and Profit Growth Rate of Listed Companies in Chinese Jewelry Industry, 2009-2011
• Sales Model and Store Quantity of Major Jewelry Enterprises in China
• Operating Income of Major Jewelry Enterprises in Mainland China, 2009-2010
• Store Quantity of Major Jewelry Enterprises in China (including Direct Chain Stores, Distributors, and Franchised Stores), 2009-2010
• Value of Major Jewelry Brands in China, 2010
• Operating Income and Growth of Lao Fengxiang, 2006-2011
• Business Structure of Lao Fengxiang (by Product), 2010
• Jewelry Business Growth of Lao Fengxiang, 2010
• Gross Margin of Jewelry Business of Lao Fengxiang, 2006-2010
• Operating Income and Growth of CHJ Jewellery, 2007-2011
• Business Structure and Growth of CHJ Jewellery (by Product), 2010
• Business Structure and Growth of CHJ Jewellery (by Region), 2010
• Operating Income Structure of CHJ Jewellery (by Product), 2010
• Operating Income Proportion and Gross Margin of K-gold Series of CHJ Jewellery, 2006-2010
• Store Quantity of CHJ Jewellery, 2007-2010
• Operating Income and Net Income of Ming Jewelry, 2008-2011
• Main Business of Ming Jewelry (by Product), 2010
• Store Quantity of Ming Jewelry, 2008-2010
• Sales Growth of Clothing & Textile Enterprises above Designated Size, 2003-2010
• Growth of Major Indices of Clothing Industry in China, 2010
• Sales and Store Quantity of Clothing Chain Enterprises in China, 2010
• Operating Income and Profit Growth of Li Ning, 2006-2010
• Distributor and Retail Store Quantity of Li Ning in China, 2010 Year-end
• Revenue Structure of Li Ning (by Marketing Channel), 2009-2010
Selected Charts
• Operating Income and Growth of Li Ning (by Region), 2009-2010
• Operating Income and Growth of Li Ning (by Brand and Product), 2009-2010
• Operating Income and Profit Growth of Bossini, FY2006-FY2011
• Store Quantity and Growth of Bossini Global Marketing Network, 2009-2010
• Operating Income and Profit Growth of Bossini (by Region), FY2006-FY2011
• Operating Income and Profit Growth of China Dongxiang (Group), 2006-2010
• Operating Profit and Growth of China Dongxiang (Group) by Brand and Product, 2006-2010
• Sales Growth of Food Retailers above Designated Size, 2003-2010
• Business Scale and Store Quantity of Food Retailers in China, 2010
• Total Retail Sales of Snack Food in China,1998-2010
• Operating Income Growth of Holiland, 2008-2010
• Store Quantity of Holiland, 2008-2010
• Operating Income Growth of Nanjing Guihuaya (Group), 2008-2010
• Store Quantity of Nanjing Guihuaya (Group), 2008-2010
• Operating Income Growth of Zhejiang Wufangzhai Industry, 2008-2010
• Store Quantity of Zhejiang Wufangzhai Industry, 2008-2010
• Store Quantity of Shanghai Laiyifen (by Region), 2010 Year-end
• Store Quantity of Zuoshangke Snack Foods (by Region), 2010 Year-end
Selected Charts

You can place your order in the following alternative ways:
1.Order online at www.researchinchina.com
2.Fax order sheet to us at fax number:+86 10 82601570
3. Email your order to: [email protected]
4. Phone us at +86 10 82600828/ 82600893
Party A:Name:Address:Contact Person: TelE-mail: Fax
Party B:Name: Beijing Waterwood Technologies Co., Ltd (ResearchInChina)Address: Room 1008, A2, Tower A, Changyuan Tiandi Building, No. 18, Suzhou
Street, Haidian District, Beijing, China 100080Contact Person:
Liao Yan Phone:
86-10-82600828
E-mail: [email protected] Fax: 86-10-82601570Bank details:
Beneficial Name: Beijing Waterwood Technologies Co., LtdBank Name: Bank of Communications, Beijing BranchBank Address: NO.1 jinxiyuan shijicheng,Landianchang,Haidian District,BeijingBank Account No #: 110060668012015061217Routing No # : 332906Bank SWIFT Code: COMMCNSHBJG
Title Format Cost
Total
Choose type of format
Hard copy …………………………2100 USD
PDF (Single user license) ………......2000 USD
PDF (Enterprisewide license)….. ......3100 USD
※ Reports will be dispatched immediately
once full payment has been received.
Payment may be made by wire transfer or
credit card via Paypal.
Room 1008, A2, Tower A, Changyuan Tiandi Building, No. 18, Suzhou Street, Haidian District, Beijing, China 100080 Phone: +86 10 82600828 ● Fax: +86 10 82601570 ● www.researchinchina.com ● [email protected]
How to Buy