Embed Size (px)
DESCRIPTION
AccountingChapter 08- Inventories and Cost of Goods Sold
Citation preview
© The McGraw-Hill Companies, Inc., 2003McGraw-Hill/Irwin
INVENTORIES AND THE COST OF GOODS SOLD
Chapter
8
© The McGraw-Hill Companies, Inc., 2003McGraw-Hill/Irwin
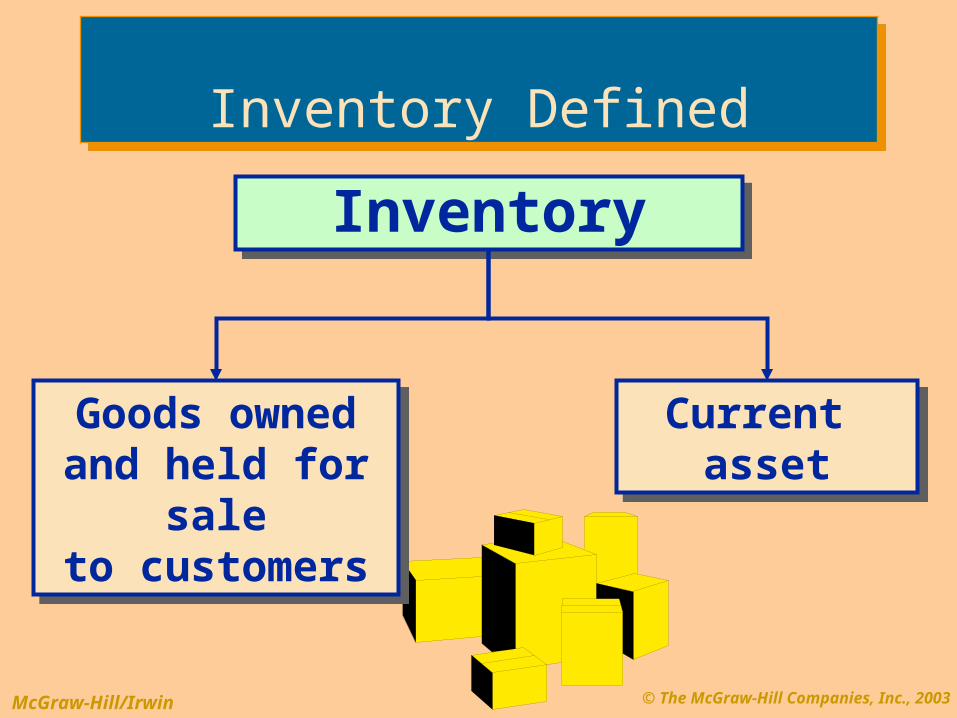
InventoryInventory
Goods ownedand held for sale
to customers
Goods ownedand held for sale
to customers
Current asset
Current asset
Inventory DefinedInventory Defined
© The McGraw-Hill Companies, Inc., 2003McGraw-Hill/Irwin
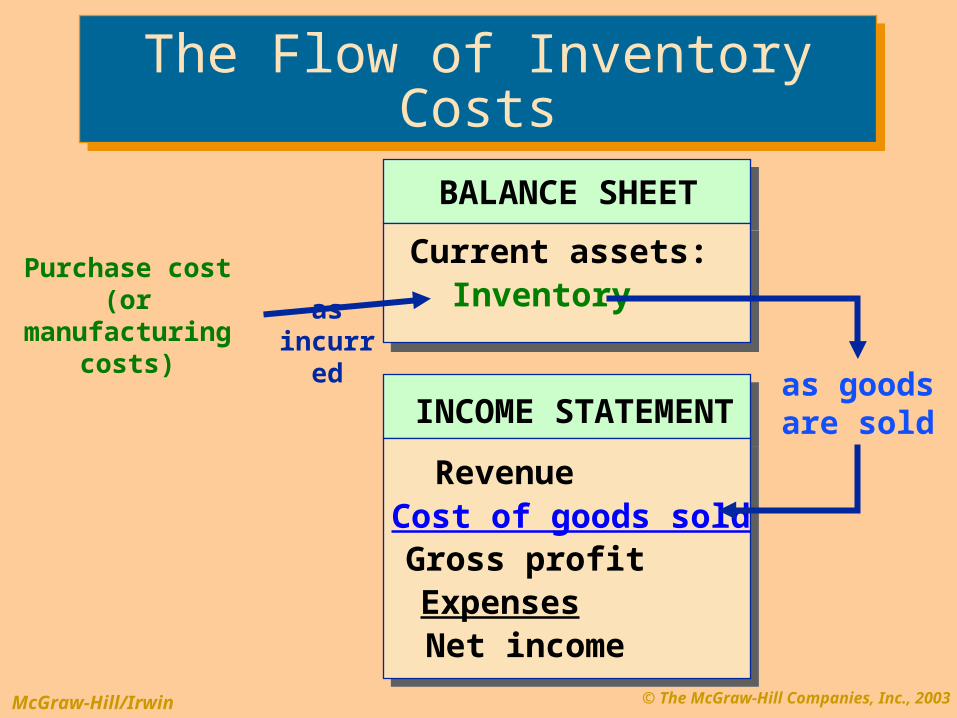
INCOME STATEMENT
Revenue Cost of goods sold Gross profit Expenses Net income
Purchase cost (or manufacturing
costs)
as goods are sold
BALANCE SHEET
Current assets: Inventoryas
incurred
The Flow of Inventory CostsThe Flow of Inventory Costs
© The McGraw-Hill Companies, Inc., 2003McGraw-Hill/Irwin
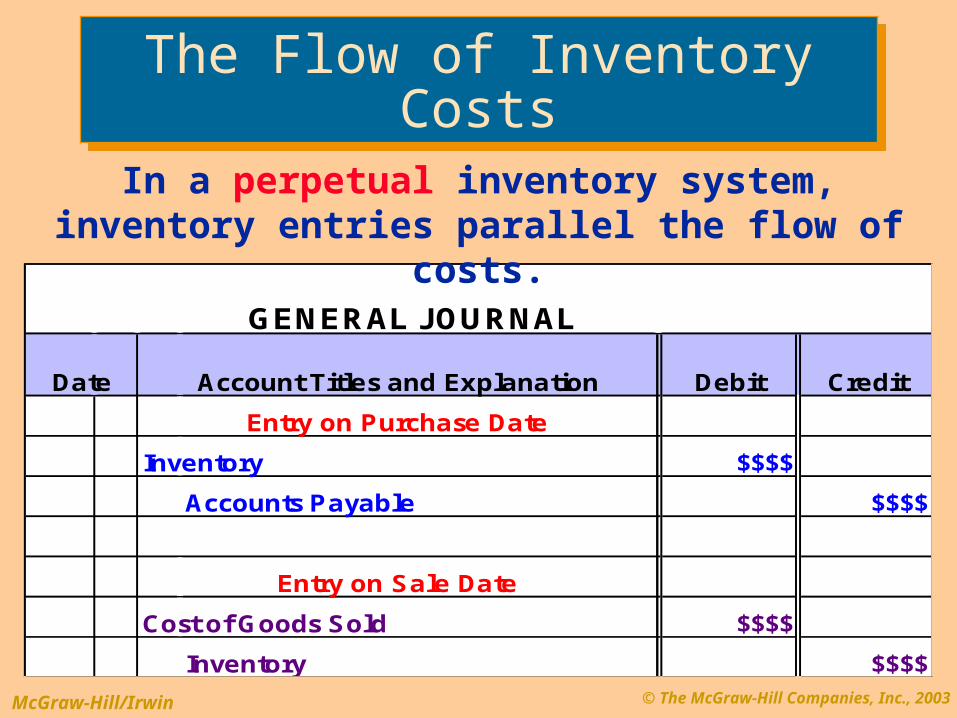
GENERAL JOURNAL
Date Account Titles and ExplanationPR Debit Credit
Entry on Purchase Date
Inventory $$$$
Accounts Payable $$$$
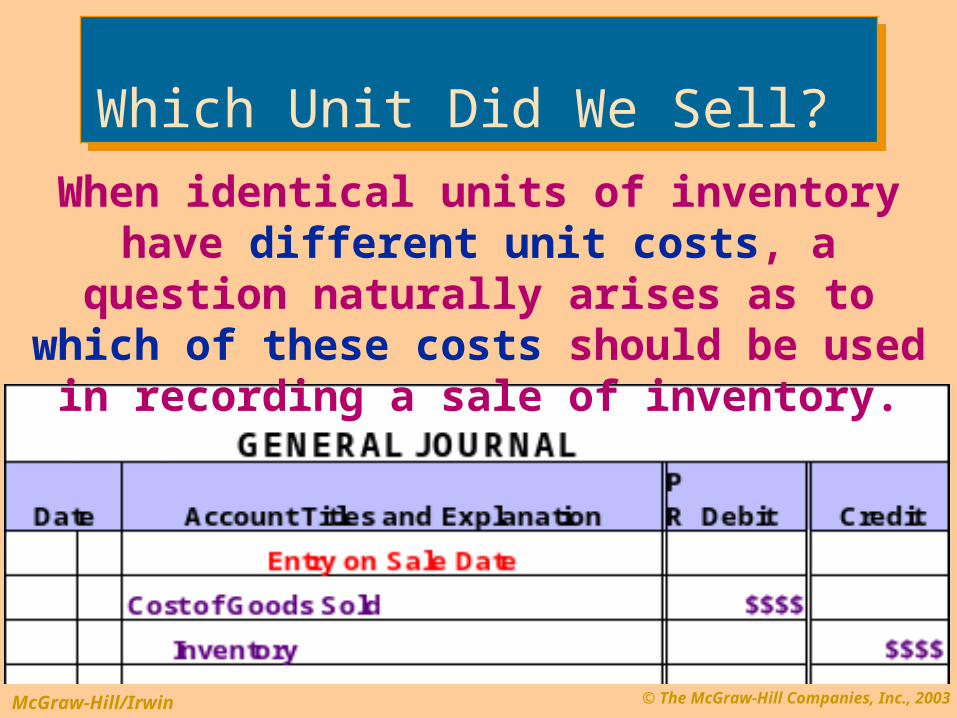
Entry on Sale Date
Cost of Goods Sold $$$$
Inventory $$$$
In a perpetual inventory system, inventory entries parallel the flow of costs.
The Flow of Inventory CostsThe Flow of Inventory Costs
© The McGraw-Hill Companies, Inc., 2003McGraw-Hill/Irwin
When identical units of inventory have different unit costs, a question naturally
arises as to which of these costs should be used in recording a sale of inventory.
Which Unit Did We Sell? Which Unit Did We Sell?
© The McGraw-Hill Companies, Inc., 2003McGraw-Hill/Irwin
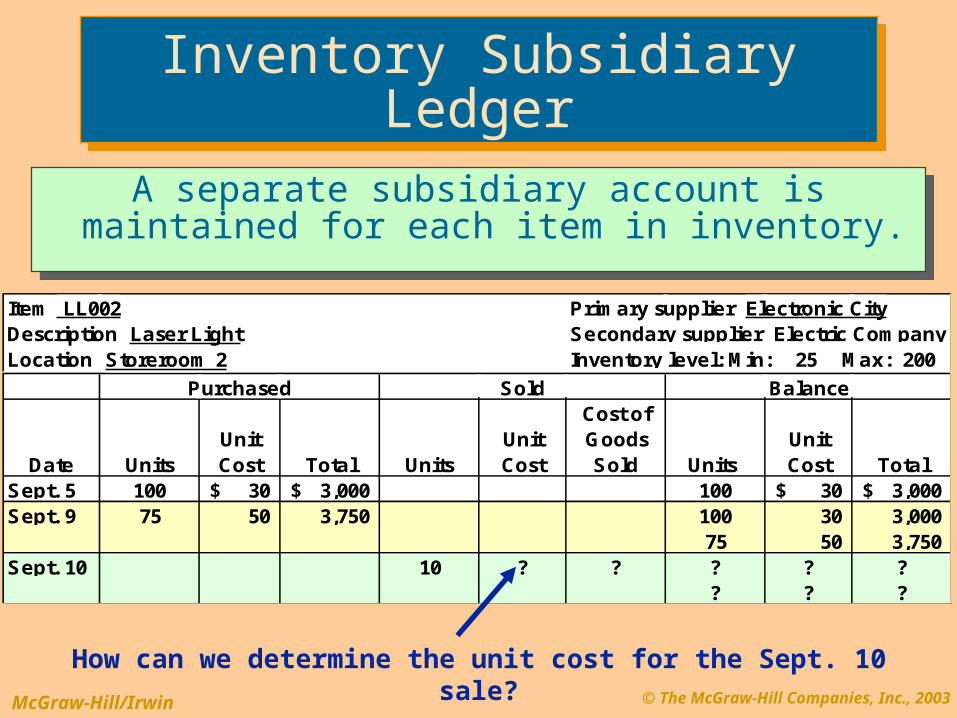
A separate subsidiary account is maintained for each item in inventory.
A separate subsidiary account is maintained for each item in inventory.
How can we determine the unit cost for the Sept. 10 sale?
Item LL002 Primary supplier Electronic CityDescription Laser Light Secondary supplier Electric CompanyLocation Storeroom 2 Inventory level: Min: 25 Max: 200
Purchased Sold Balance
Date UnitsUnit Cost Total Units
Unit Cost
Cost of Goods Sold Units
Unit Cost Total
Sept. 5 100 30$ 3,000$ 100 30$ 3,000$ Sept. 9 75 50 3,750 100 30 3,000
75 50 3,750 Sept. 10 10 ? ? ? ? ?
? ? ?
Inventory Subsidiary LedgerInventory Subsidiary Ledger
© The McGraw-Hill Companies, Inc., 2003McGraw-Hill/Irwin
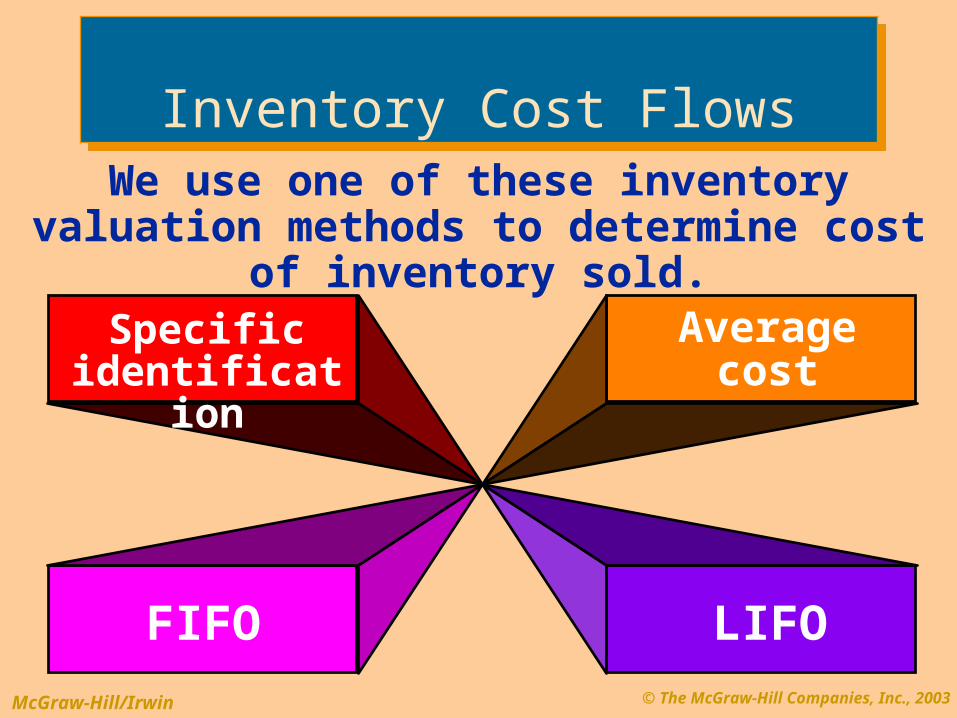
Specific identification
LIFO
Average cost
FIFO
We use one of these inventory valuation methods to determine cost of inventory sold.
Inventory Cost FlowsInventory Cost Flows
© The McGraw-Hill Companies, Inc., 2003McGraw-Hill/Irwin
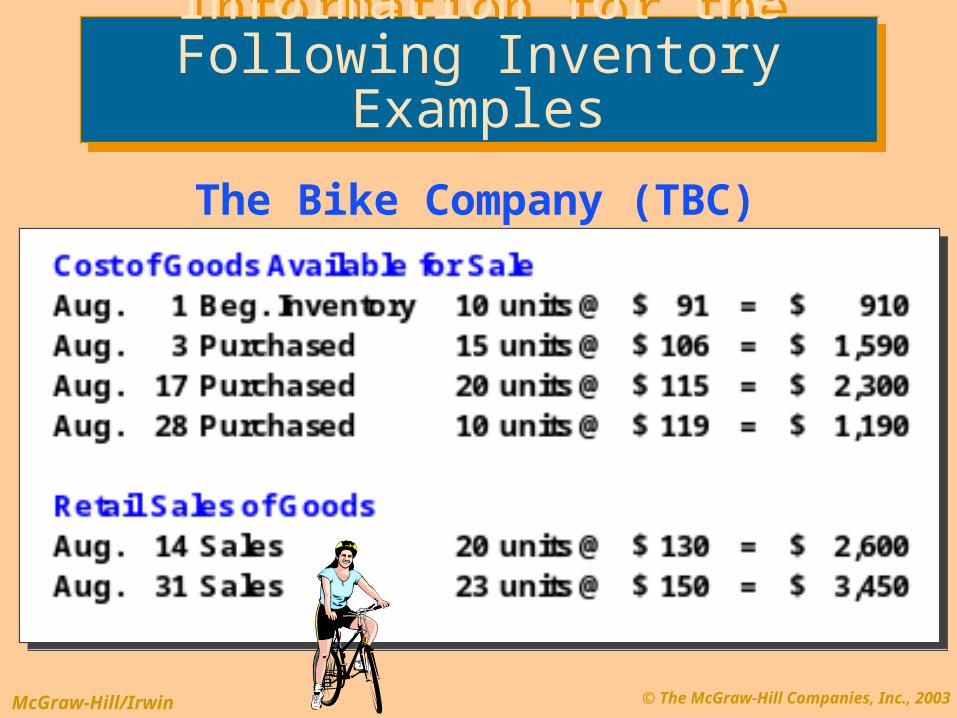
The Bike Company (TBC)
Information for the Following Inventory Examples
Information for the Following Inventory Examples
© The McGraw-Hill Companies, Inc., 2003McGraw-Hill/Irwin
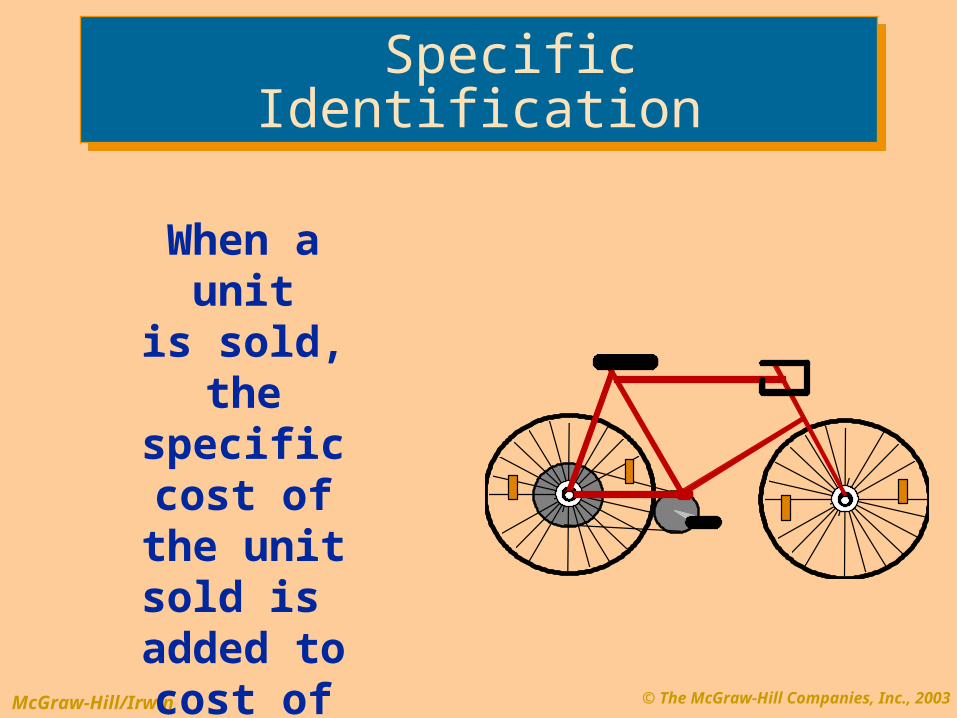
Specific Identification Specific Identification
When a unit
is sold, the specific
cost of the unit sold is added to
cost of goods sold.
© The McGraw-Hill Companies, Inc., 2003McGraw-Hill/Irwin
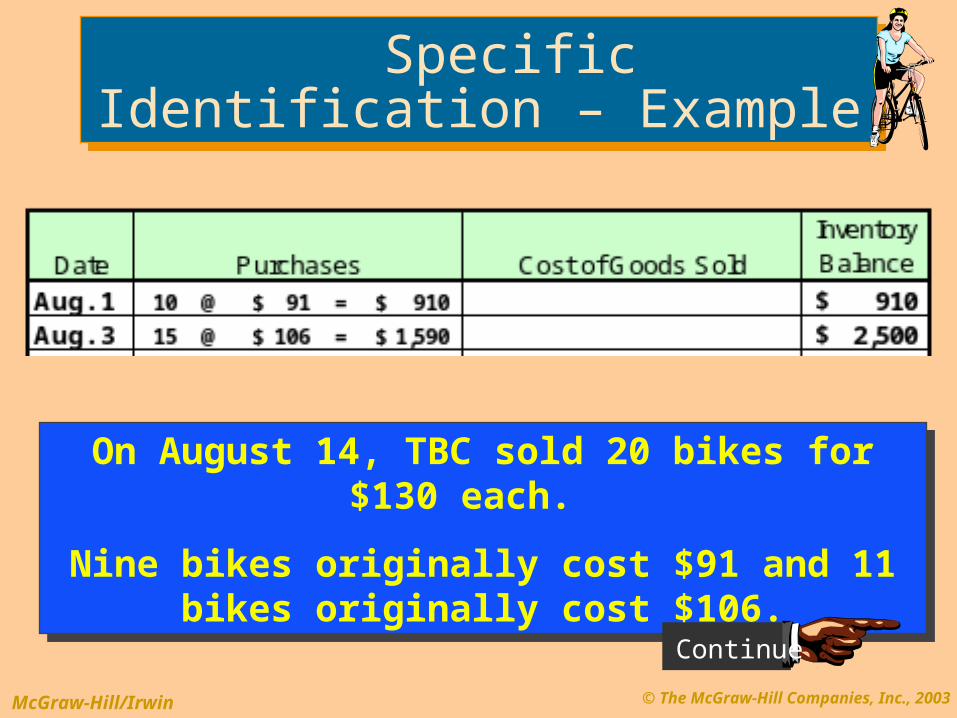
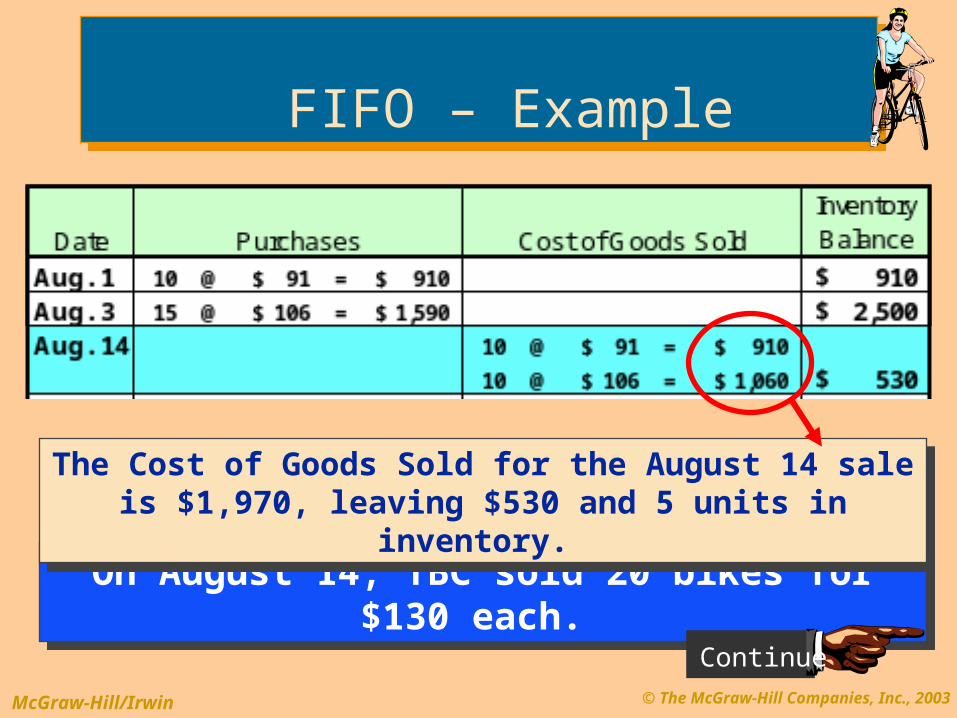
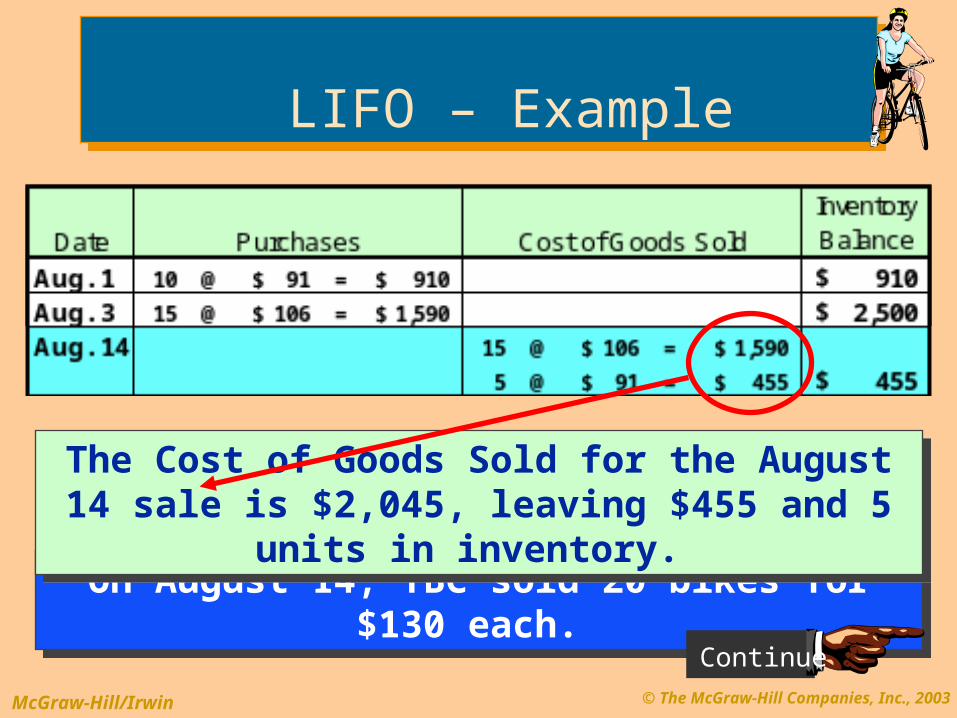
On August 14, TBC sold 20 bikes for $130 each.
Nine bikes originally cost $91 and 11 bikes originally cost $106.
On August 14, TBC sold 20 bikes for $130 each.
Nine bikes originally cost $91 and 11 bikes originally cost $106.
Continue
Specific Identification – Example Specific Identification – Example
© The McGraw-Hill Companies, Inc., 2003McGraw-Hill/Irwin
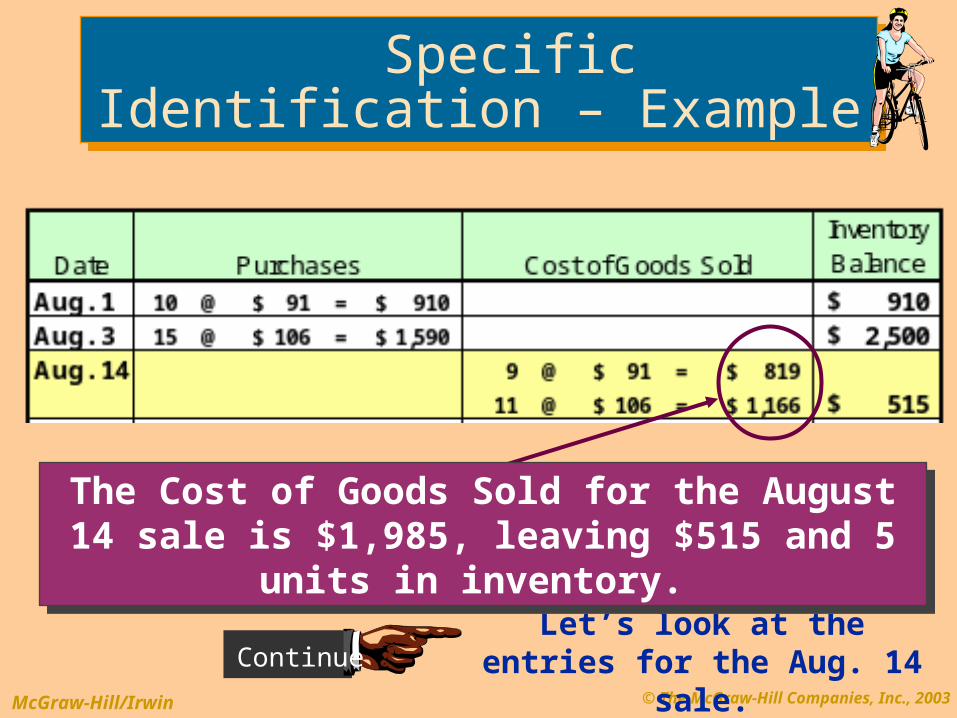
ContinueLet’s look at the entries for
the Aug. 14 sale.
Specific Identification – Example Specific Identification – Example
The Cost of Goods Sold for the August 14 sale is $1,985, leaving $515 and 5 units in inventory.
The Cost of Goods Sold for the August 14 sale is $1,985, leaving $515 and 5 units in inventory.
© The McGraw-Hill Companies, Inc., 2003McGraw-Hill/Irwin
Continue
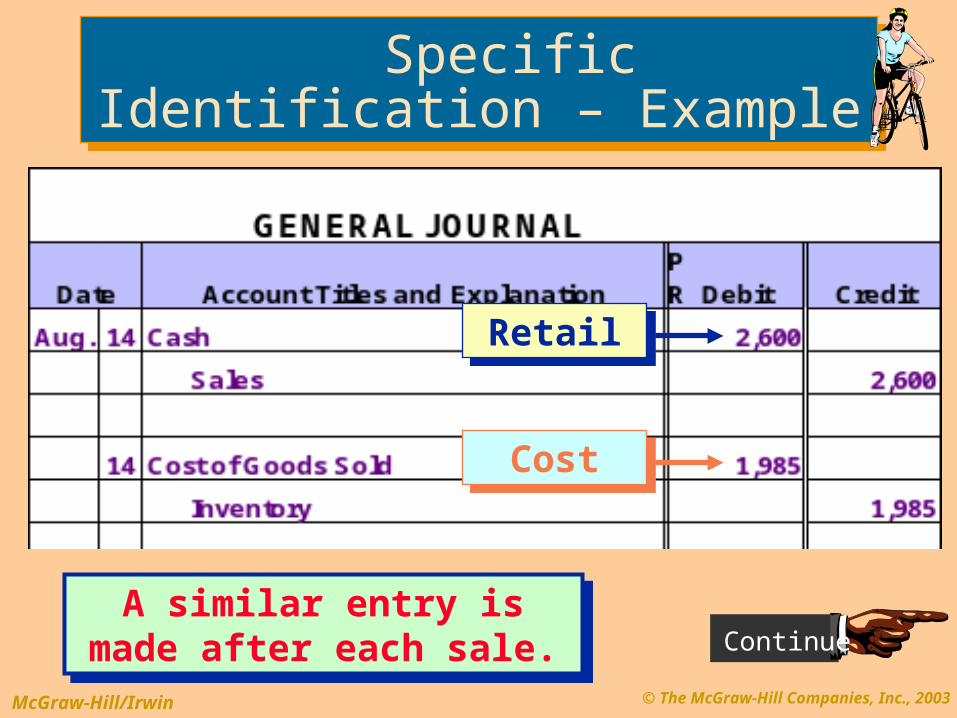
RetailRetail
CostCost
A similar entry ismade after each sale.
A similar entry ismade after each sale.
Specific Identification – Example Specific Identification – Example
© The McGraw-Hill Companies, Inc., 2003McGraw-Hill/Irwin
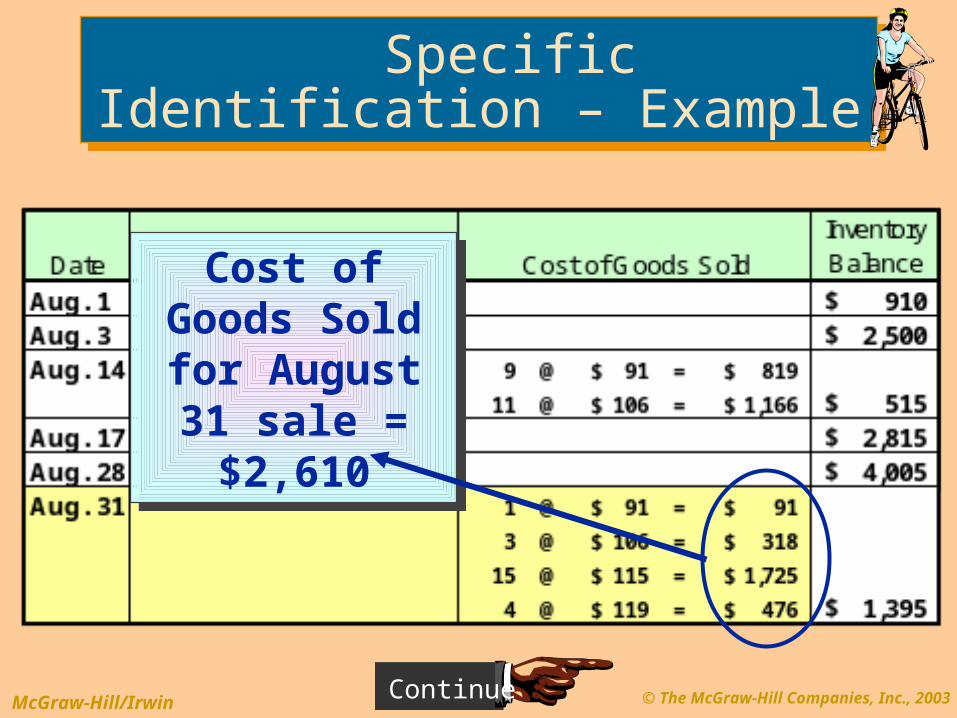
Additional purchases were made on August 17 and 28.
Costs associated with sales on August 31 were as follows: 1 @ $91, 3 @ $106, 15 @ $115, & 4 @ $119.
Additional purchases were made on August 17 and 28.
Costs associated with sales on August 31 were as follows: 1 @ $91, 3 @ $106, 15 @ $115, & 4 @ $119.
Continue
Specific Identification – Example Specific Identification – Example
Cost of Goods Sold for
August 31 sale = $2,610
Cost of Goods Sold for
August 31 sale = $2,610

© The McGraw-Hill Companies, Inc., 2003McGraw-Hill/Irwin
Balance Sheet
Inventory = $1,395
Income Statement
COGS = $4,595
1 @ 106$ = 106$ 5 @ 115$ = 575 6 @ 119$ = 714
End. Inv. 1,395$
1 @ 106$ = 106$ 5 @ 115$ = 575 6 @ 119$ = 714
End. Inv. 1,395$
Specific Identification – Example Specific Identification – Example

© The McGraw-Hill Companies, Inc., 2003McGraw-Hill/Irwin
Since specific identification is so
easy, can’t we use it all the time?
Not really. Specific identification is hard to use
when we sell a lot of inventory that has lots of
different costs.
© The McGraw-Hill Companies, Inc., 2003McGraw-Hill/Irwin
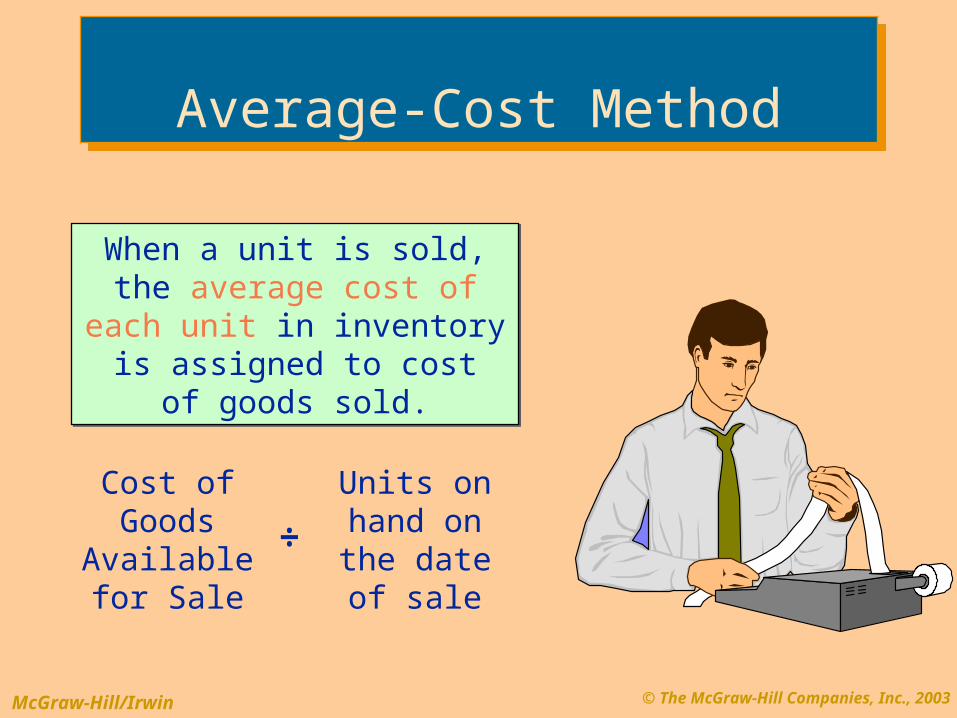
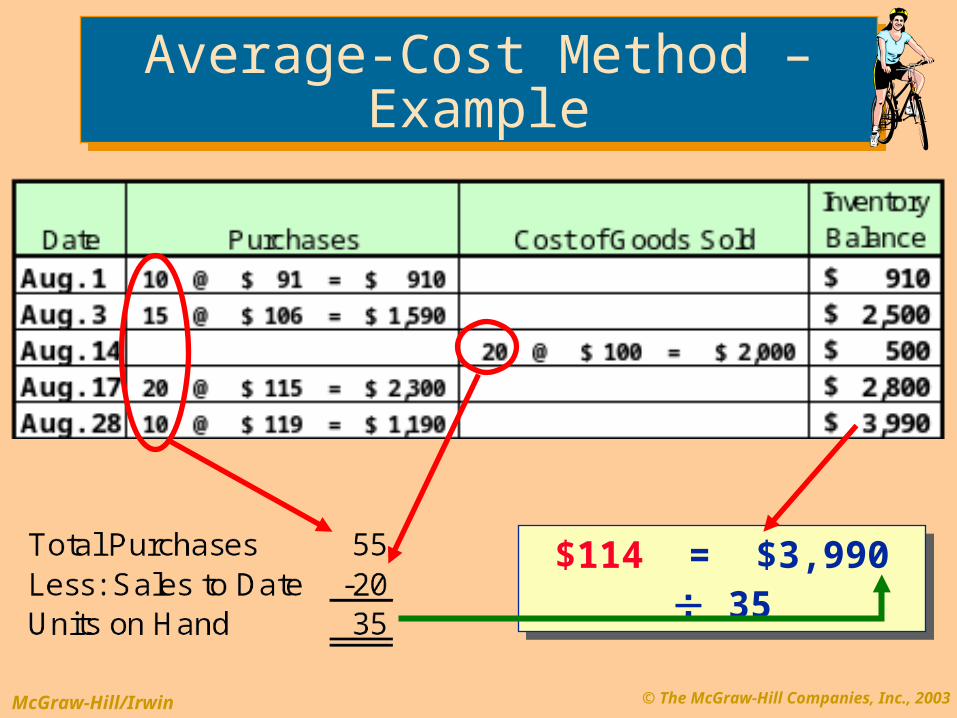
Cost of Goods Available for
Sale
Units on hand on the date of
sale÷
Average-Cost MethodAverage-Cost Method
When a unit is sold,the average cost of each unit
in inventory is assigned to cost
of goods sold.
When a unit is sold,the average cost of each unit
in inventory is assigned to cost
of goods sold.
© The McGraw-Hill Companies, Inc., 2003McGraw-Hill/Irwin
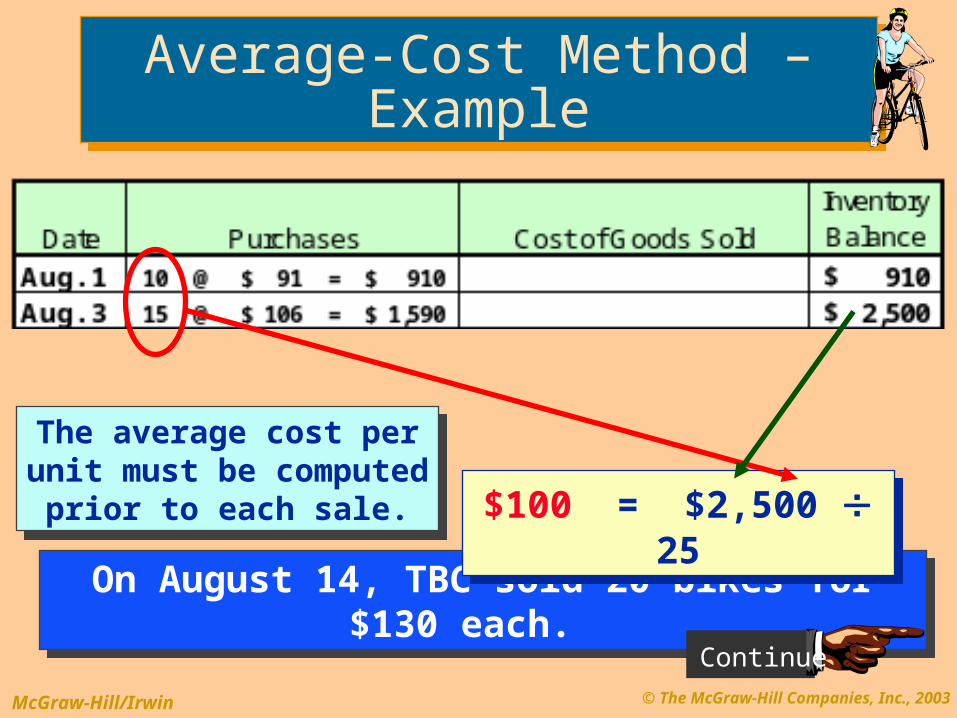
On August 14, TBC sold 20 bikes for $130 each. On August 14, TBC sold 20 bikes for $130 each.
Continue
The average cost per unit must be computed prior
to each sale.
The average cost per unit must be computed prior
to each sale.
Average-Cost Method – ExampleAverage-Cost Method – Example
$100 = $2,500 25$100 = $2,500 25
© The McGraw-Hill Companies, Inc., 2003McGraw-Hill/Irwin
Continue
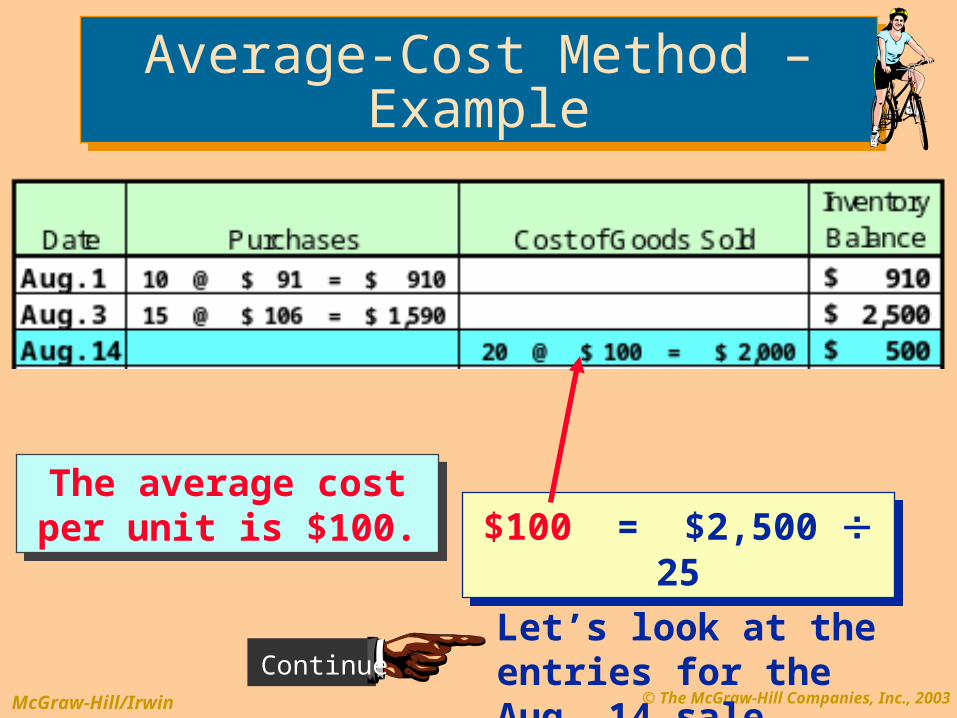
The average cost per unit is $100.
The average cost per unit is $100.
Let’s look at the entries for the Aug. 14 sale.
Average-Cost Method – ExampleAverage-Cost Method – Example
$100 = $2,500 25$100 = $2,500 25
© The McGraw-Hill Companies, Inc., 2003McGraw-Hill/Irwin
Continue
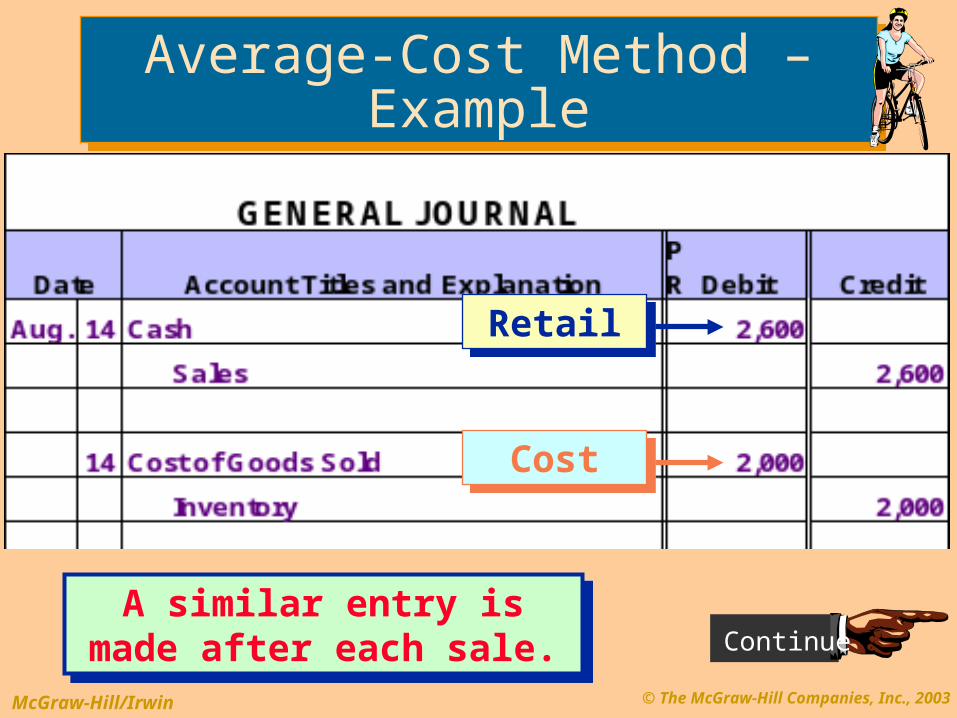
RetailRetail
CostCost
A similar entry ismade after each sale.
A similar entry ismade after each sale.
Average-Cost Method – ExampleAverage-Cost Method – Example

© The McGraw-Hill Companies, Inc., 2003McGraw-Hill/Irwin
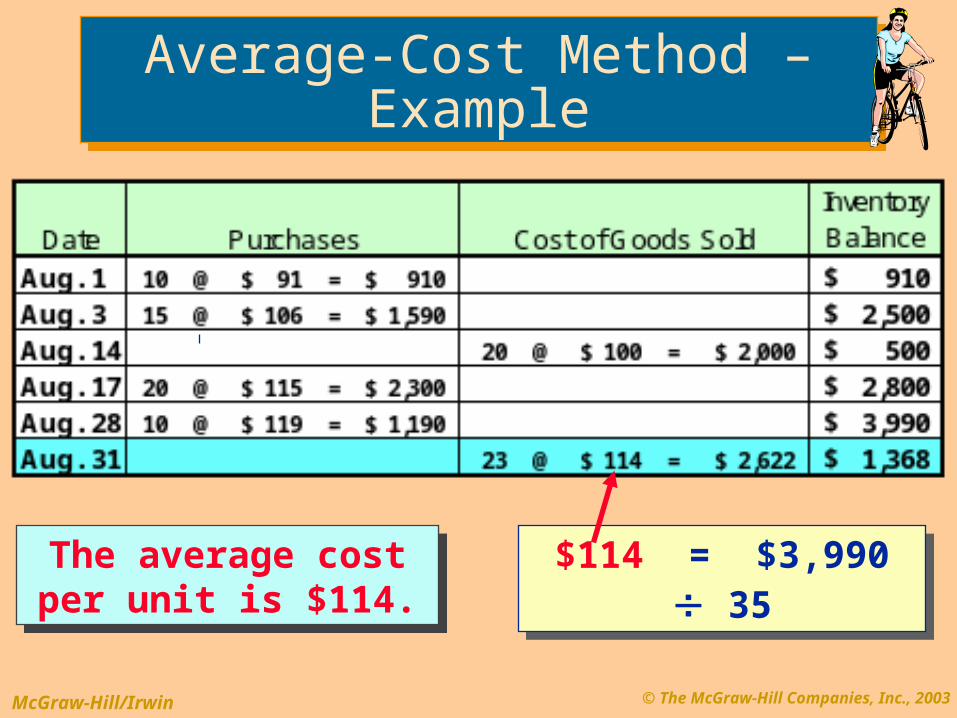
Additional purchases were made on August 17 and August 28.
On August 31, an additional 23 units were sold.
Additional purchases were made on August 17 and August 28.
On August 31, an additional 23 units were sold.
Continue
Average-Cost Method – ExampleAverage-Cost Method – Example
© The McGraw-Hill Companies, Inc., 2003McGraw-Hill/Irwin
$114 = $3,990 35$114 = $3,990 35
Average-Cost Method – ExampleAverage-Cost Method – Example
© The McGraw-Hill Companies, Inc., 2003McGraw-Hill/Irwin
$114 = $3,990 35$114 = $3,990 35The average cost per unit is $114.
The average cost per unit is $114.
Average-Cost Method – ExampleAverage-Cost Method – Example
© The McGraw-Hill Companies, Inc., 2003McGraw-Hill/Irwin
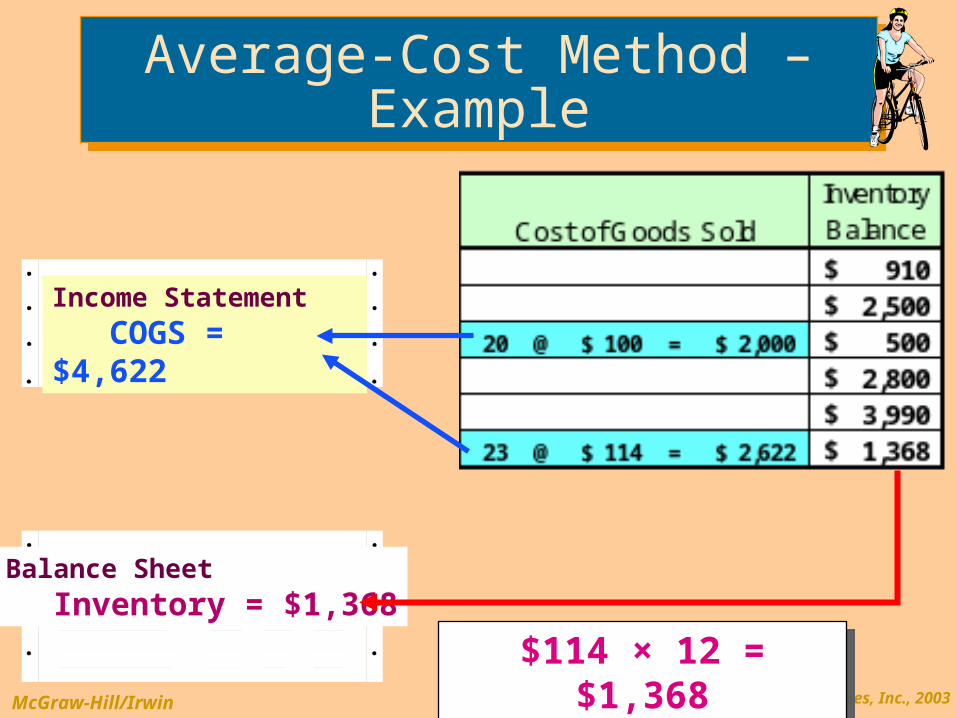
Income Statement
COGS = $4,622
Balance Sheet
Inventory = $1,368
$114 × 12 = $1,368$114 × 12 = $1,368
Average-Cost Method – ExampleAverage-Cost Method – Example
© The McGraw-Hill Companies, Inc., 2003McGraw-Hill/Irwin
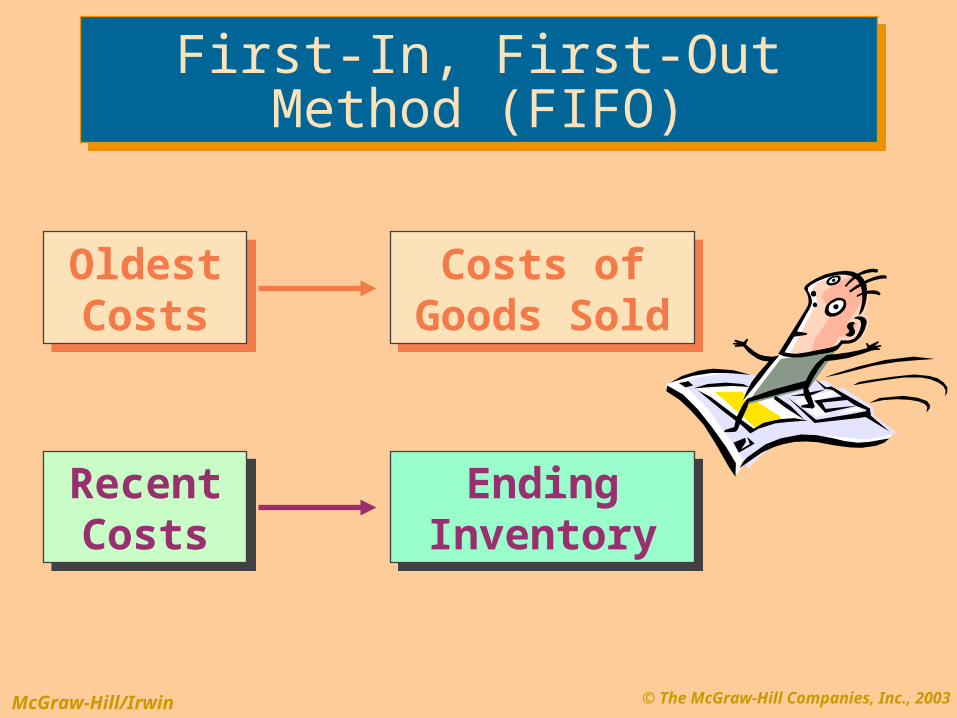
Costs of Goods Sold
Costs of Goods Sold
Ending InventoryEnding
Inventory
Oldest Costs
Oldest Costs
Recent Costs
Recent Costs
First-In, First-Out Method (FIFO)First-In, First-Out Method (FIFO)
© The McGraw-Hill Companies, Inc., 2003McGraw-Hill/Irwin
On August 14, TBC sold 20 bikes for $130 each. On August 14, TBC sold 20 bikes for $130 each.
Continue
The Cost of Goods Sold for the August 14 sale is $1,970, leaving $530 and 5 units in inventory.
The Cost of Goods Sold for the August 14 sale is $1,970, leaving $530 and 5 units in inventory.
FIFO – Example FIFO – Example
© The McGraw-Hill Companies, Inc., 2003McGraw-Hill/Irwin
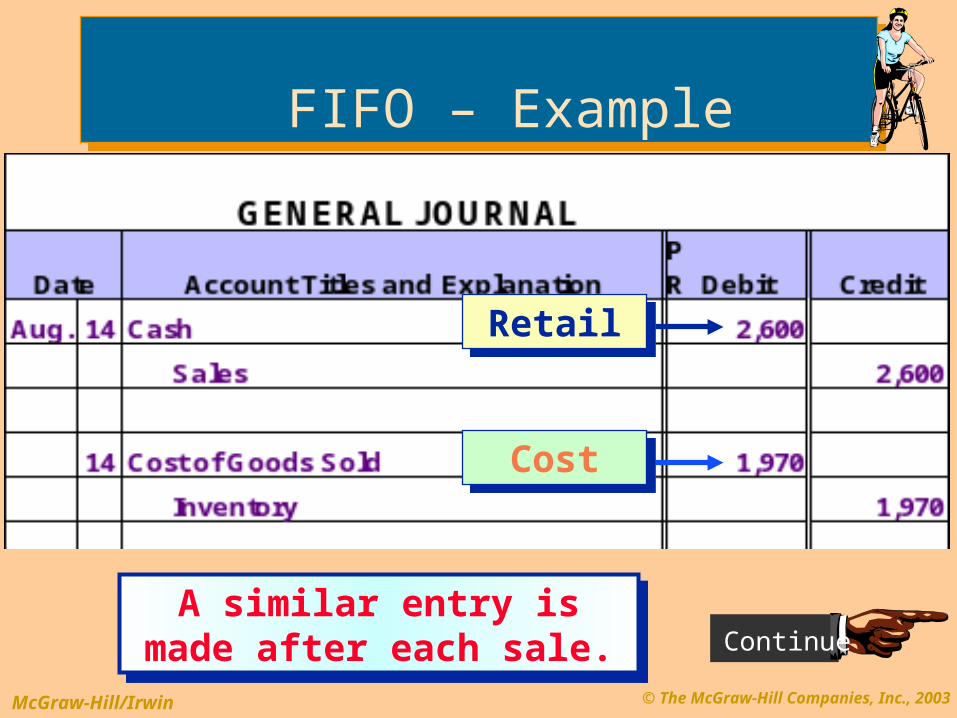
RetailRetail
CostCost
ContinueA similar entry is
made after each sale.
A similar entry ismade after each sale.
FIFO – Example FIFO – Example
© The McGraw-Hill Companies, Inc., 2003McGraw-Hill/Irwin
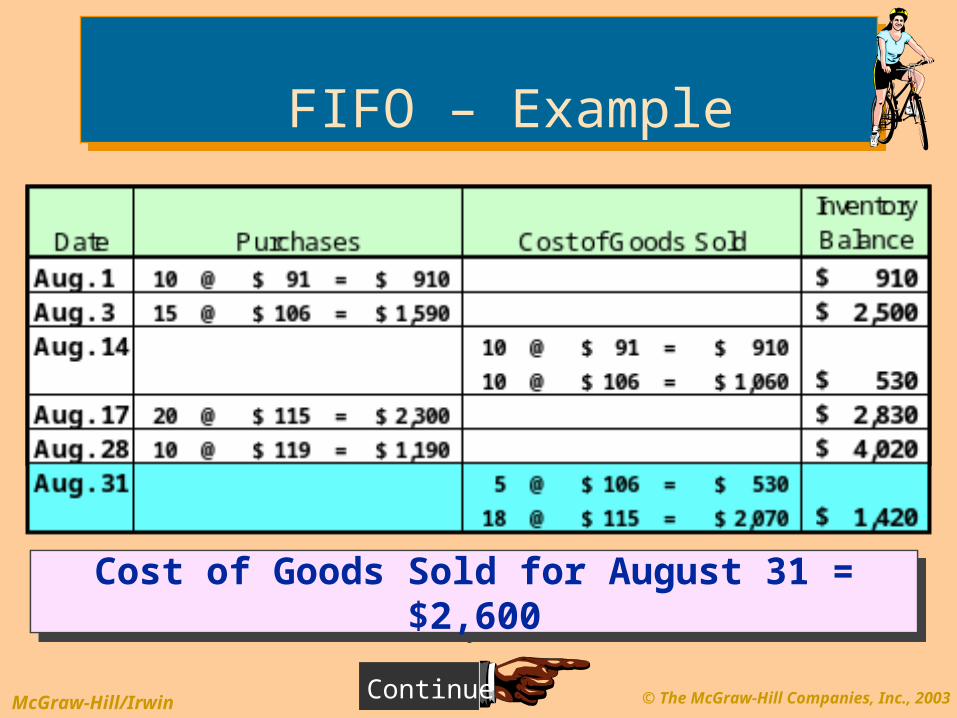
Additional purchases were made on Aug. 17 and Aug. 28.
On August 31, an additional 23 units were sold.
Additional purchases were made on Aug. 17 and Aug. 28.
On August 31, an additional 23 units were sold.
Continue
FIFO – Example FIFO – Example
Cost of Goods Sold for August 31 = $2,600Cost of Goods Sold for August 31 = $2,600
© The McGraw-Hill Companies, Inc., 2003McGraw-Hill/Irwin
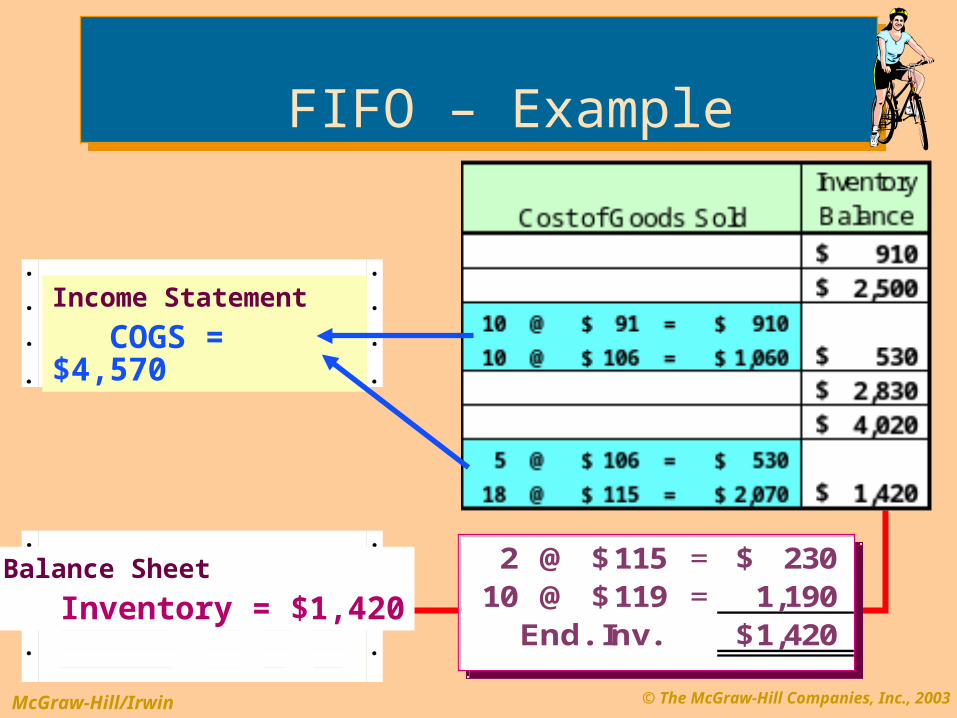
Balance Sheet
Inventory = $1,420
Income Statement
COGS = $4,570
2 @ 115$ = 230$ 10 @ 119$ = 1,190
End. Inv. 1,420$
2 @ 115$ = 230$ 10 @ 119$ = 1,190
End. Inv. 1,420$
FIFO – Example FIFO – Example

© The McGraw-Hill Companies, Inc., 2003McGraw-Hill/Irwin
Costs of Goods Sold
Costs of Goods Sold
Ending InventoryEnding
Inventory
Recent Costs
Recent Costs
Oldest Costs
Oldest Costs
Last-In, First-Out Method (LIFO)Last-In, First-Out Method (LIFO)
© The McGraw-Hill Companies, Inc., 2003McGraw-Hill/Irwin
On August 14, TBC sold 20 bikes for $130 each. On August 14, TBC sold 20 bikes for $130 each.
Continue
LIFO – Example LIFO – Example
The Cost of Goods Sold for the August 14 sale is $2,045, leaving $455 and 5 units in inventory.
The Cost of Goods Sold for the August 14 sale is $2,045, leaving $455 and 5 units in inventory.
© The McGraw-Hill Companies, Inc., 2003McGraw-Hill/Irwin
Continue
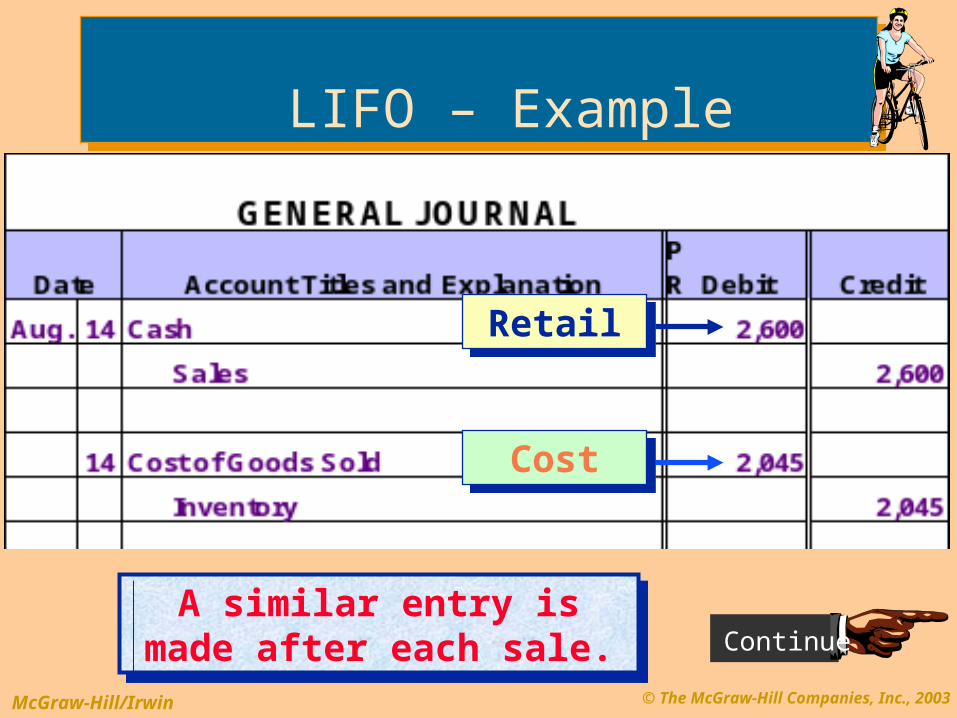
RetailRetail
CostCost
A similar entry ismade after each sale.
A similar entry ismade after each sale.
LIFO – Example LIFO – Example

© The McGraw-Hill Companies, Inc., 2003McGraw-Hill/IrwinContinue
LIFO – Example LIFO – Example
Additional purchases were made on Aug. 17 and Aug. 28.
On Aug. 31, an additional 23 units were sold.
Additional purchases were made on Aug. 17 and Aug. 28.
On Aug. 31, an additional 23 units were sold.Cost of Goods Sold for August 31 = $2,685Cost of Goods Sold for August 31 = $2,685
© The McGraw-Hill Companies, Inc., 2003McGraw-Hill/Irwin
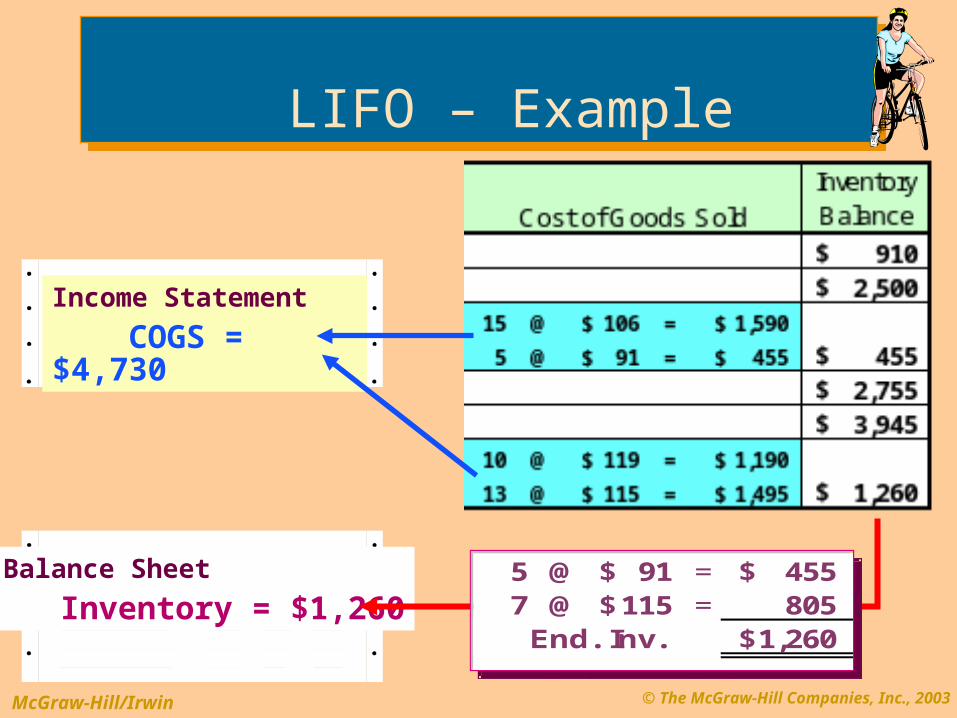
Balance Sheet
Inventory = $1,260
Income Statement
COGS = $4,730
LIFO – Example LIFO – Example
5 @ 91$ = 455$ 7 @ 115$ = 805
End. Inv. 1,260$
5 @ 91$ = 455$ 7 @ 115$ = 805
End. Inv. 1,260$
© The McGraw-Hill Companies, Inc., 2003McGraw-Hill/Irwin
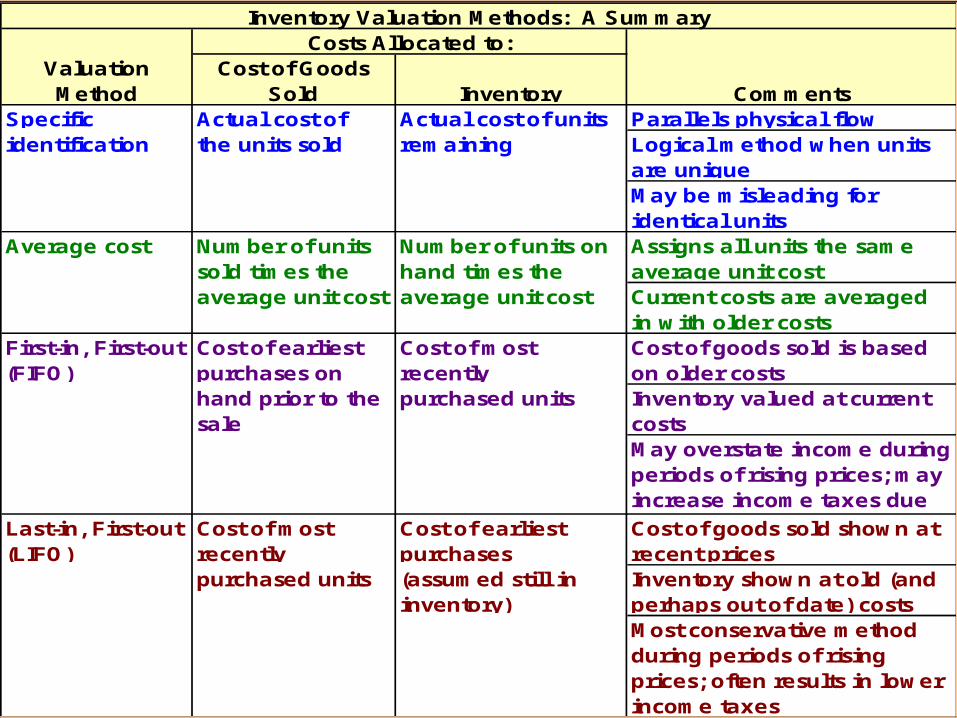
Inventory Valuation Methods: A SummaryCosts Allocated to:
Valuation Method
Cost of Goods Sold Inventory Comments
Specific Actual cost of Actual cost of units Parallels physical flow identification the units sold remaining Logical method when units
are uniqueMay be misleading for identical units
Average cost Number of units sold times the
Number of units on hand times the
Assigns all units the same average unit cost
average unit cost average unit cost Current costs are averaged in with older costs
First-in, First-out (FIFO)
Cost of earliest purchases on
Cost of most recently
Cost of goods sold is based on older costs
hand prior to the sale
purchased units Inventory valued at current costsMay overstate income during periods of rising prices; may increase income taxes due
Last-in, First-out (LIFO)
Cost of most recently
Cost of earliest purchases
Cost of goods sold shown at recent prices
purchased units (assumed still in inventory)
Inventory shown at old (and perhaps out of date) costsMost conservative method during periods of rising prices; often results in lower income taxes
© The McGraw-Hill Companies, Inc., 2003McGraw-Hill/Irwin
Once a company has adopted a particular
accounting method, it should follow that
method consistently, rather than switch methods from one year to the next.
The Principle of ConsistencyThe Principle of Consistency

© The McGraw-Hill Companies, Inc., 2003McGraw-Hill/Irwin
This inventory arrived just in time for us to use
in the manufacturing process.
Just-In-Time (JIT) Inventory Systems
Just-In-Time (JIT) Inventory Systems
© The McGraw-Hill Companies, Inc., 2003McGraw-Hill/Irwin
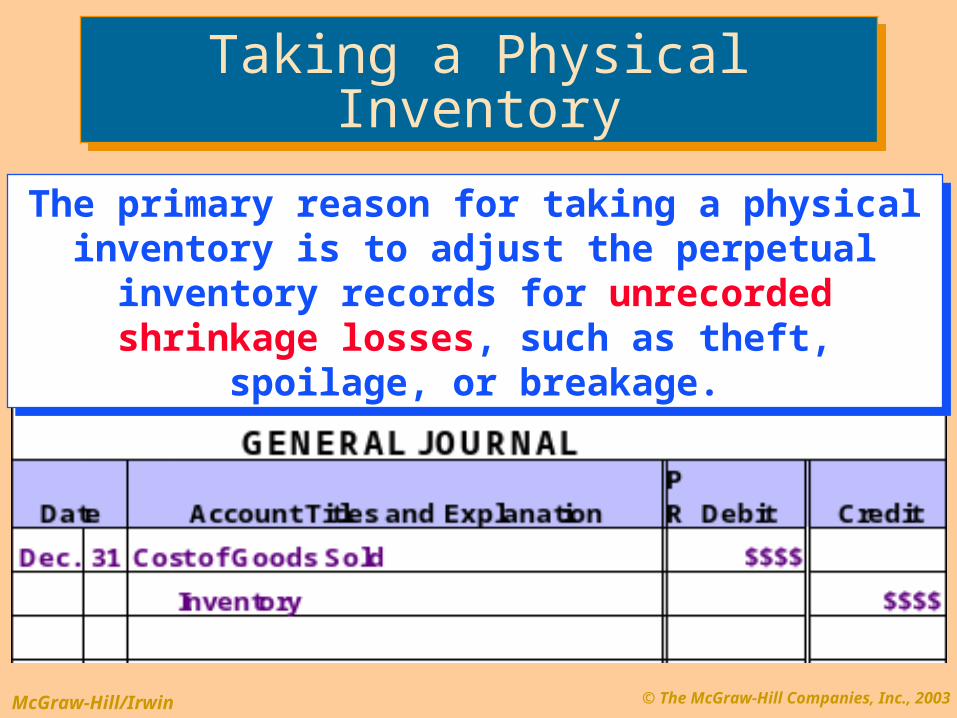
The primary reason for taking a physical inventory is to adjust the perpetual inventory records for
unrecorded shrinkage losses, such as theft, spoilage, or breakage.
The primary reason for taking a physical inventory is to adjust the perpetual inventory records for
unrecorded shrinkage losses, such as theft, spoilage, or breakage.
Taking a Physical InventoryTaking a Physical Inventory
© The McGraw-Hill Companies, Inc., 2003McGraw-Hill/Irwin
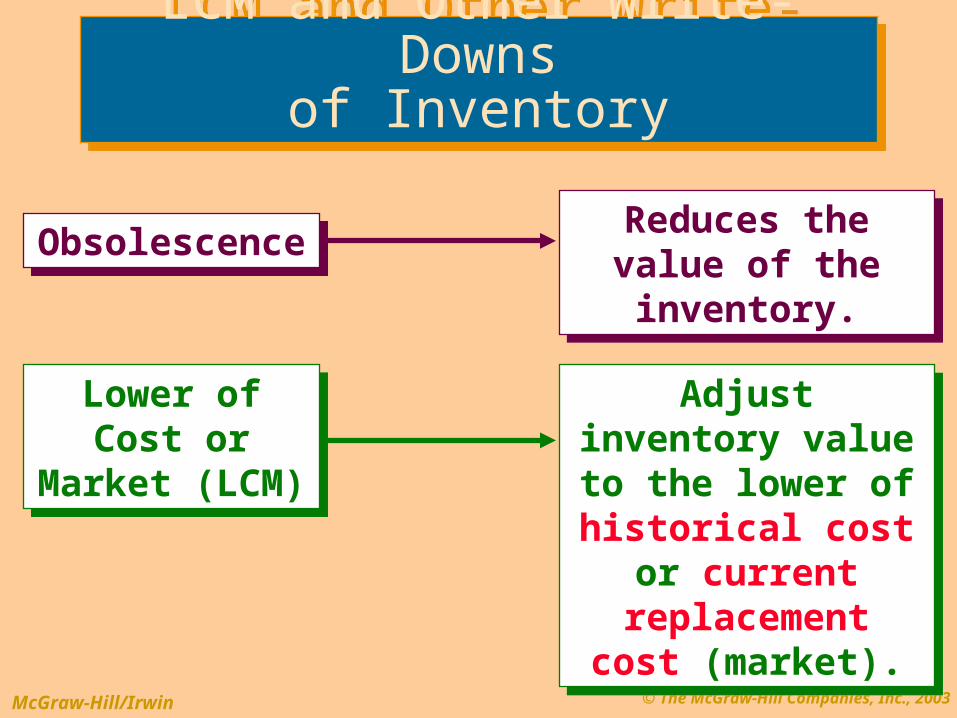
Reduces the value of the inventory.
Reduces the value of the inventory.
Adjust inventory value to the lower
of historical cost or current
replacement cost (market).
Adjust inventory value to the lower
of historical cost or current
replacement cost (market).
ObsolescenceObsolescence
Lower of Cost or Market
(LCM)
Lower of Cost or Market
(LCM)
LCM and Other Write-Downsof Inventory
LCM and Other Write-Downsof Inventory
© The McGraw-Hill Companies, Inc., 2003McGraw-Hill/Irwin
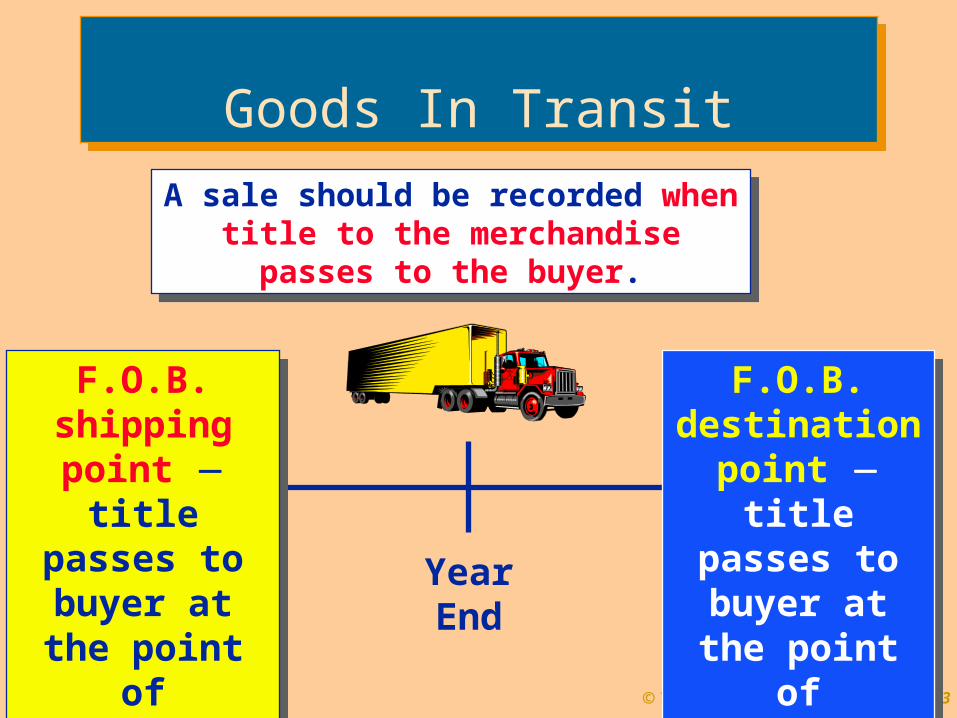
Year End
A sale should be recorded when title to the merchandise passes to the
buyer.
A sale should be recorded when title to the merchandise passes to the
buyer.
F.O.B. shipping
point title passes to
buyer at the point of
shipment.
F.O.B. shipping
point title passes to
buyer at the point of
shipment.
F.O.B. destination point title passes to
buyer at the point of
destination.
F.O.B. destination point title passes to
buyer at the point of
destination.
Goods In TransitGoods In Transit
© The McGraw-Hill Companies, Inc., 2003McGraw-Hill/Irwin
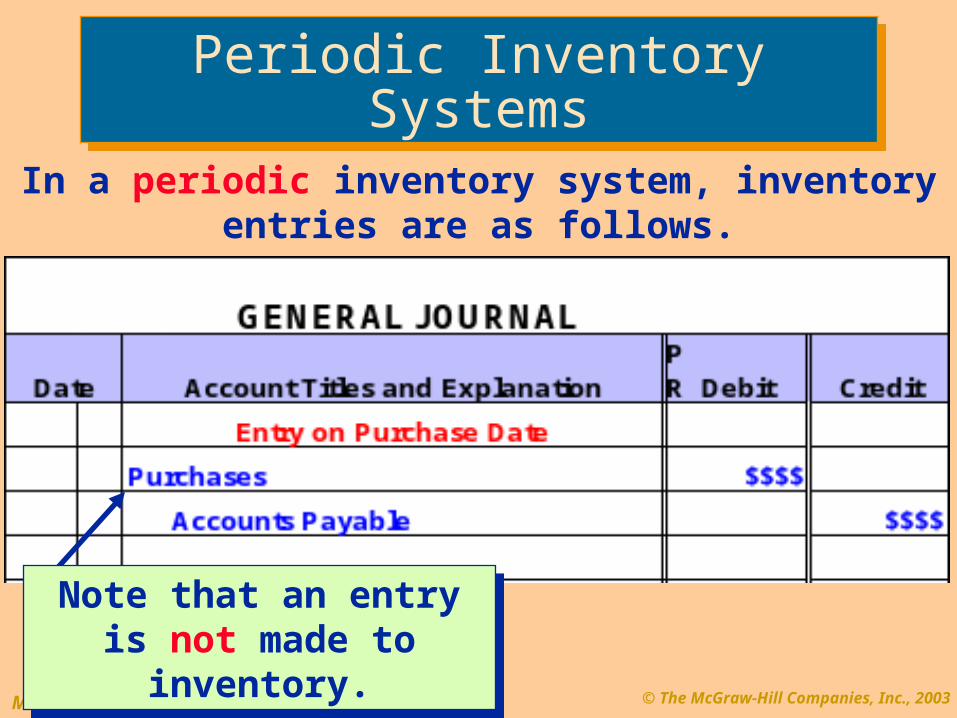
In a periodic inventory system, inventory entries are as follows.
Note that an entry is not made to inventory.
Note that an entry is not made to inventory.
Periodic Inventory SystemsPeriodic Inventory Systems
© The McGraw-Hill Companies, Inc., 2003McGraw-Hill/Irwin
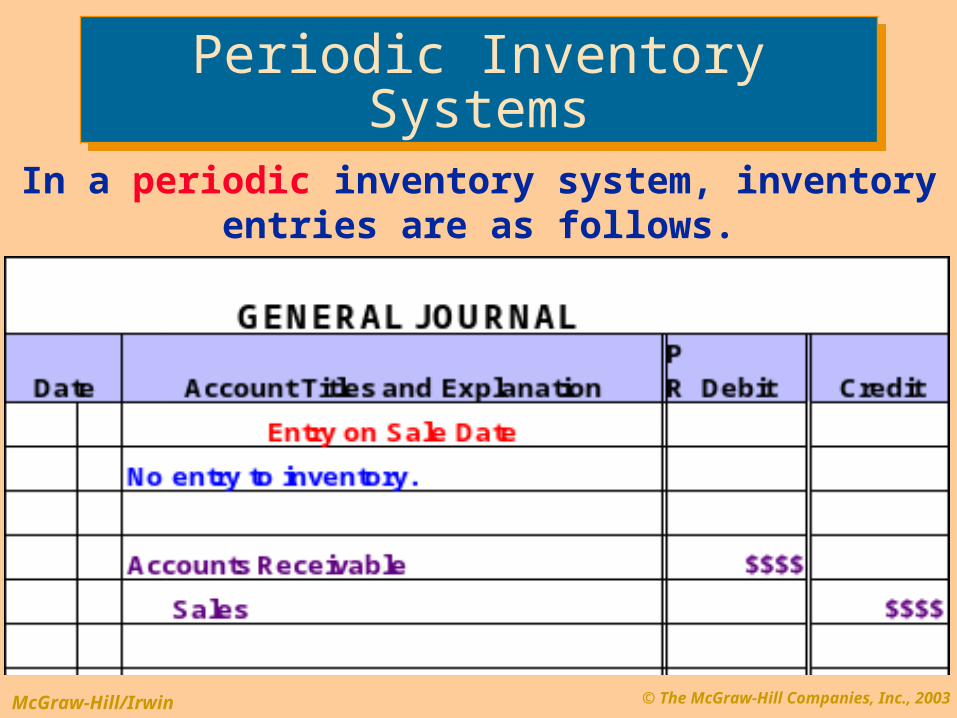
In a periodic inventory system, inventory entries are as follows.
Periodic Inventory SystemsPeriodic Inventory Systems
© The McGraw-Hill Companies, Inc., 2003McGraw-Hill/Irwin
The inventory on hand and the cost of goods
sold for the year are not
determined until year-end.
Periodic Inventory SystemsPeriodic Inventory Systems
© The McGraw-Hill Companies, Inc., 2003McGraw-Hill/Irwin
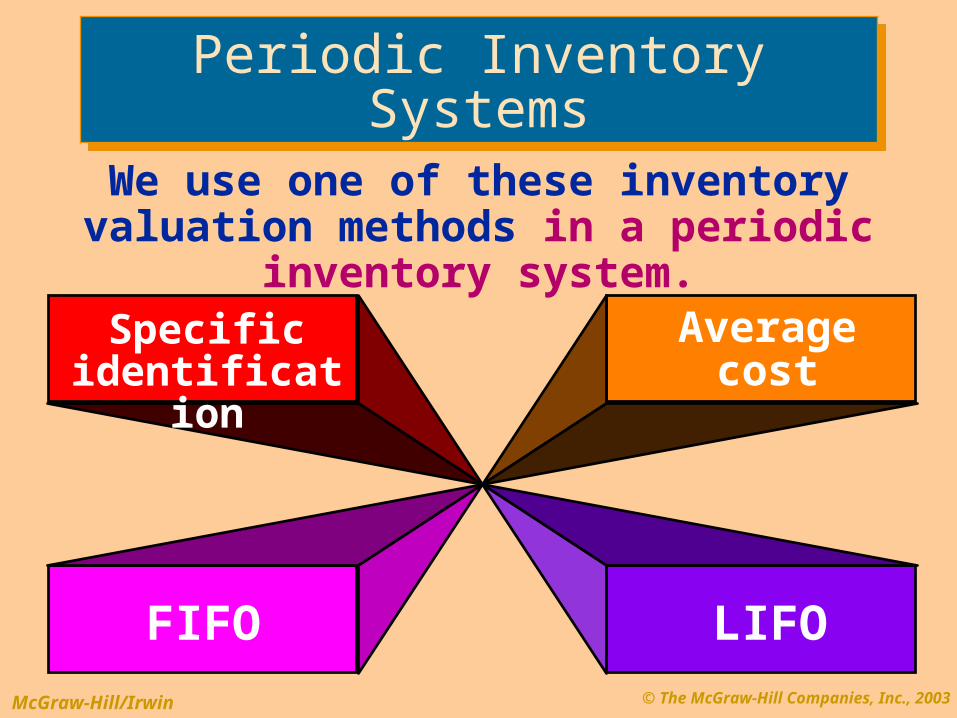
Specific identification
LIFO
Average cost
FIFO
We use one of these inventory valuation methods in a periodic inventory system.
Periodic Inventory SystemsPeriodic Inventory Systems
© The McGraw-Hill Companies, Inc., 2003McGraw-Hill/Irwin
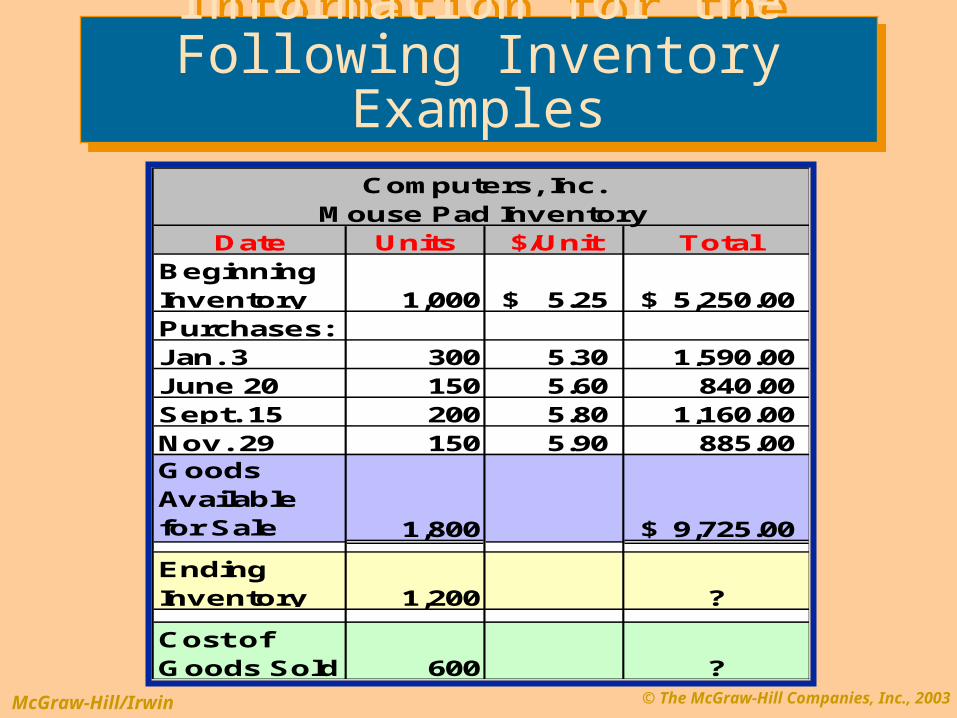
Computers, Inc.Mouse Pad Inventory
Date Units $/Unit TotalBeginning Inventory 1,000 5.25$ 5,250.00$ Purchases:Jan. 3 300 5.30 1,590.00 June 20 150 5.60 840.00 Sept. 15 200 5.80 1,160.00 Nov. 29 150 5.90 885.00 Goods Available for Sale 1,800 9,725.00$
Ending Inventory 1,200 ?
Cost of Goods Sold 600 ?
Information for the Following Inventory Examples
Information for the Following Inventory Examples
© The McGraw-Hill Companies, Inc., 2003McGraw-Hill/Irwin
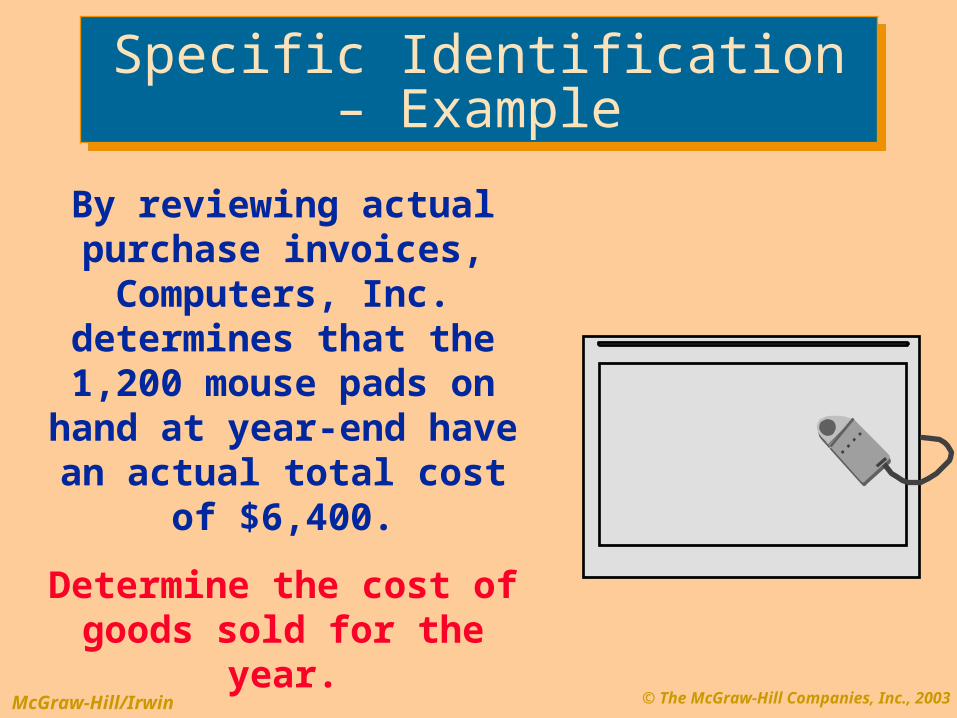
By reviewing actual purchase invoices,
Computers, Inc. determines that the 1,200 mouse pads on hand at year-end have
an actual total cost of $6,400.
Determine the cost of goods sold for the year.
Specific Identification – ExampleSpecific Identification – Example
© The McGraw-Hill Companies, Inc., 2003McGraw-Hill/Irwin
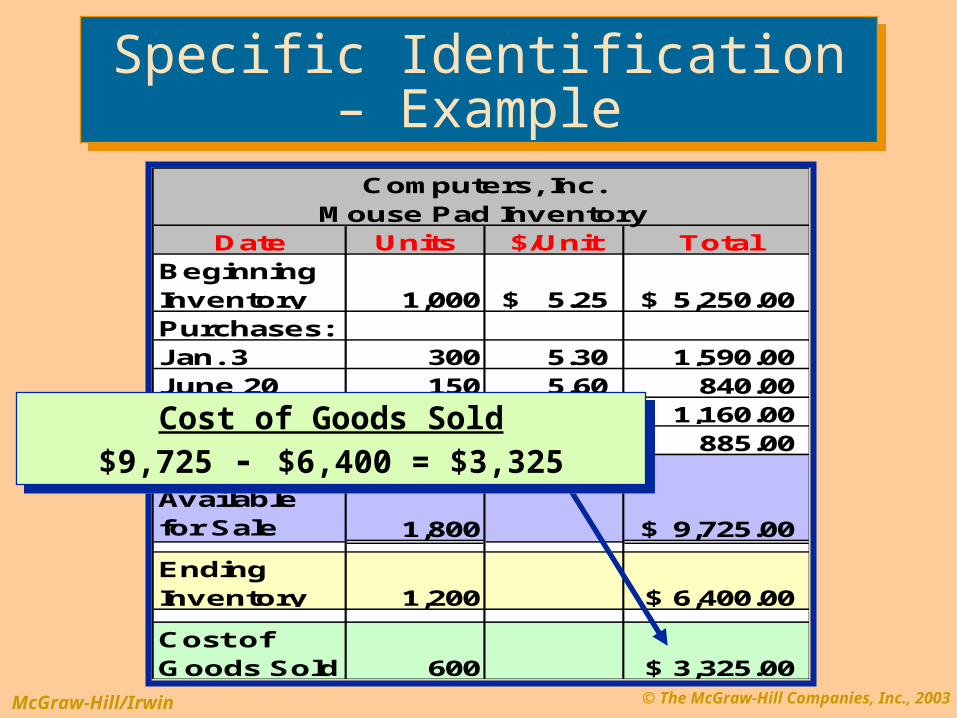
Computers, Inc.Mouse Pad Inventory
Date Units $/Unit TotalBeginning Inventory 1,000 5.25$ 5,250.00$ Purchases:Jan. 3 300 5.30 1,590.00 June 20 150 5.60 840.00 Sept. 15 200 5.80 1,160.00 Nov. 29 150 5.90 885.00 Goods Available for Sale 1,800 9,725.00$
Ending Inventory 1,200 6,400.00$
Cost of Goods Sold 600 3,325.00$
Cost of Goods Sold$9,725 - $6,400 = $3,325
Cost of Goods Sold$9,725 - $6,400 = $3,325
Specific Identification – ExampleSpecific Identification – Example
© The McGraw-Hill Companies, Inc., 2003McGraw-Hill/Irwin
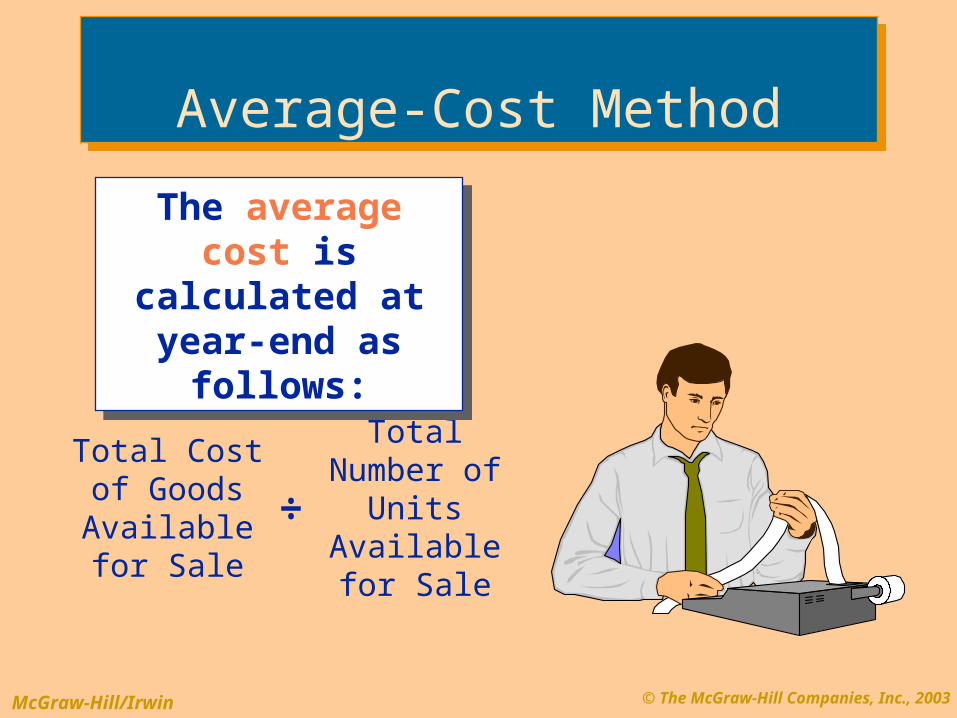
Total Cost of Goods
Available for Sale
Total Number of Units
Available for Sale
÷
The average cost is calculated at year-
end as follows:
The average cost is calculated at year-
end as follows:
Average-Cost MethodAverage-Cost Method
© The McGraw-Hill Companies, Inc., 2003McGraw-Hill/Irwin
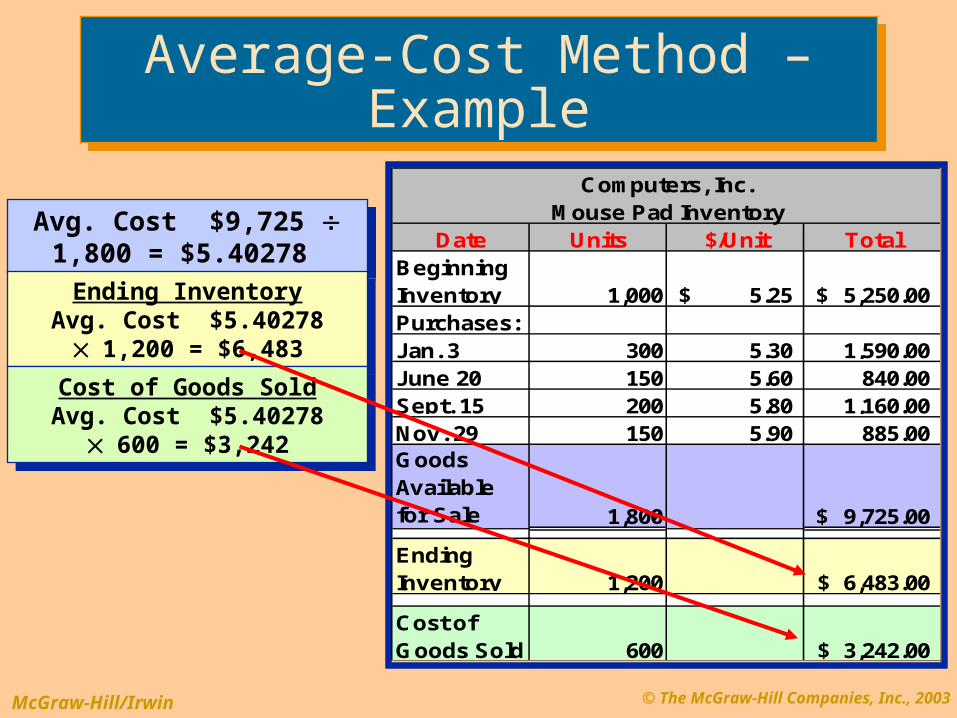
Computers, Inc.Mouse Pad Inventory
Date Units $/Unit TotalBeginning Inventory 1,000 5.25$ 5,250.00$ Purchases:Jan. 3 300 5.30 1,590.00 June 20 150 5.60 840.00 Sept. 15 200 5.80 1,160.00 Nov. 29 150 5.90 885.00 Goods Available for Sale 1,800 9,725.00$
Ending Inventory 1,200 ?
Cost of Goods Sold 600 ?
Avg. Cost $9,725 1,800 = $5.40278
Avg. Cost $9,725 1,800 = $5.40278
Average-Cost Method – ExampleAverage-Cost Method – ExampleComputers, Inc.
Mouse Pad InventoryDate Units $/Unit Total
Beginning Inventory 1,000 5.25$ 5,250.00$ Purchases:Jan. 3 300 5.30 1,590.00 June 20 150 5.60 840.00 Sept. 15 200 5.80 1,160.00 Nov. 29 150 5.90 885.00 Goods Available for Sale 1,800 9,725.00$
Ending Inventory 1,200 6,483.00$
Cost of Goods Sold 600 3,242.00$
Ending InventoryAvg. Cost $5.40278 1,200
= $6,483
Ending InventoryAvg. Cost $5.40278 1,200
= $6,483
Cost of Goods SoldAvg. Cost $5.40278 600 =
$3,242
Cost of Goods SoldAvg. Cost $5.40278 600 =
$3,242

© The McGraw-Hill Companies, Inc., 2003McGraw-Hill/Irwin
Costs of Goods Sold
Costs of Goods Sold
Ending InventoryEnding
Inventory
Oldest Costs
Oldest Costs
Recent Costs
Recent Costs
First-In, First-Out Method (FIFO)First-In, First-Out Method (FIFO)
© The McGraw-Hill Companies, Inc., 2003McGraw-Hill/Irwin
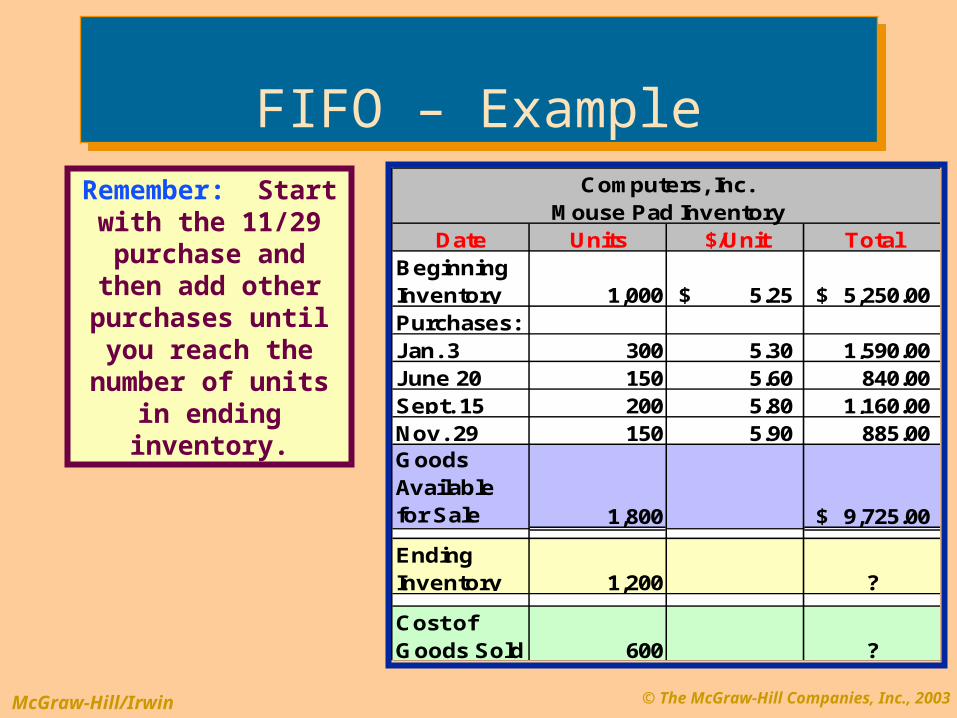
Remember: Start with the 11/29
purchase and then add other purchases until you reach the number of units in ending inventory.
FIFO – ExampleFIFO – ExampleComputers, Inc.
Mouse Pad InventoryDate Units $/Unit Total
Beginning Inventory 1,000 5.25$ 5,250.00$ Purchases:Jan. 3 300 5.30 1,590.00 June 20 150 5.60 840.00 Sept. 15 200 5.80 1,160.00 Nov. 29 150 5.90 885.00 Goods Available for Sale 1,800 9,725.00$
Ending Inventory 1,200 ?
Cost of Goods Sold 600 ?
© The McGraw-Hill Companies, Inc., 2003McGraw-Hill/Irwin
Date Beg. Inv. Purchases End. Inv.Cost of
Goods Sold
Nov. 29 150@$5.90 150@$5.90Units 150
Now, let’s complete the table.
Now, let’s complete the table.
FIFO – ExampleFIFO – Example
Date Beg. Inv. Purchases End. Inv.Cost of
Goods Sold1,000@$5.25 600@$5.25
400@$5.25Jan. 3 300@$5.30 300@$5.30June 20 150@$5.60 150@$5.60Sept. 15 200@$5.80 200@$5.80Nov. 29 150@$5.90 150@$5.90Units 1,200 600
Now, we have allocated the cost to all 1,200 units
in ending inventory.
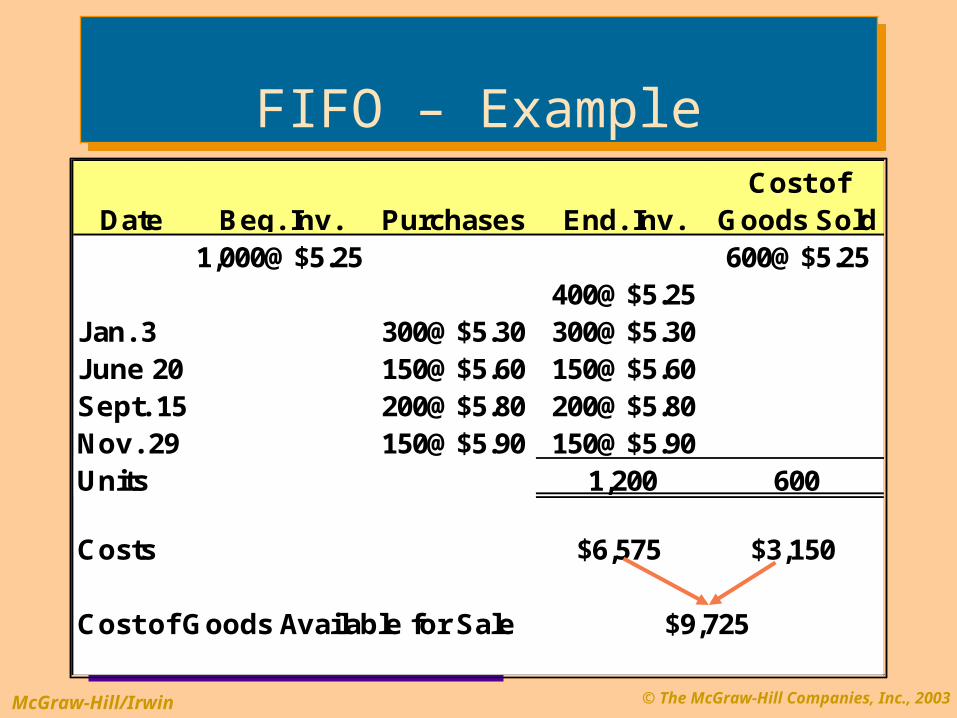
Date Beg. Inv. Purchases End. Inv.Cost of
Goods Sold1,000@$5.25 600@$5.25
400@$5.25Jan. 3 300@$5.30 300@$5.30June 20 150@$5.60 150@$5.60Sept. 15 200@$5.80 200@$5.80Nov. 29 150@$5.90 150@$5.90Units 1,200 600
Costs $6,575 $3,150
Cost of Goods Available for Sale $9,725

© The McGraw-Hill Companies, Inc., 2003McGraw-Hill/Irwin
Completing the table summarizes the
computations just made.
FIFO – ExampleFIFO – ExampleComputers, Inc.
Mouse Pad InventoryDate Units $/Unit Total
Beginning Inventory 1,000 5.25$ 5,250.00$ Purchases:Jan. 3 300 5.30 1,590.00 June 20 150 5.60 840.00 Sept. 15 200 5.80 1,160.00 Nov. 29 150 5.90 885.00 Goods Available for Sale 1,800 9,725.00$
Ending Inventory 1,200 6,575.00$
Cost of Goods Sold 600 3,150.00$
© The McGraw-Hill Companies, Inc., 2003McGraw-Hill/Irwin
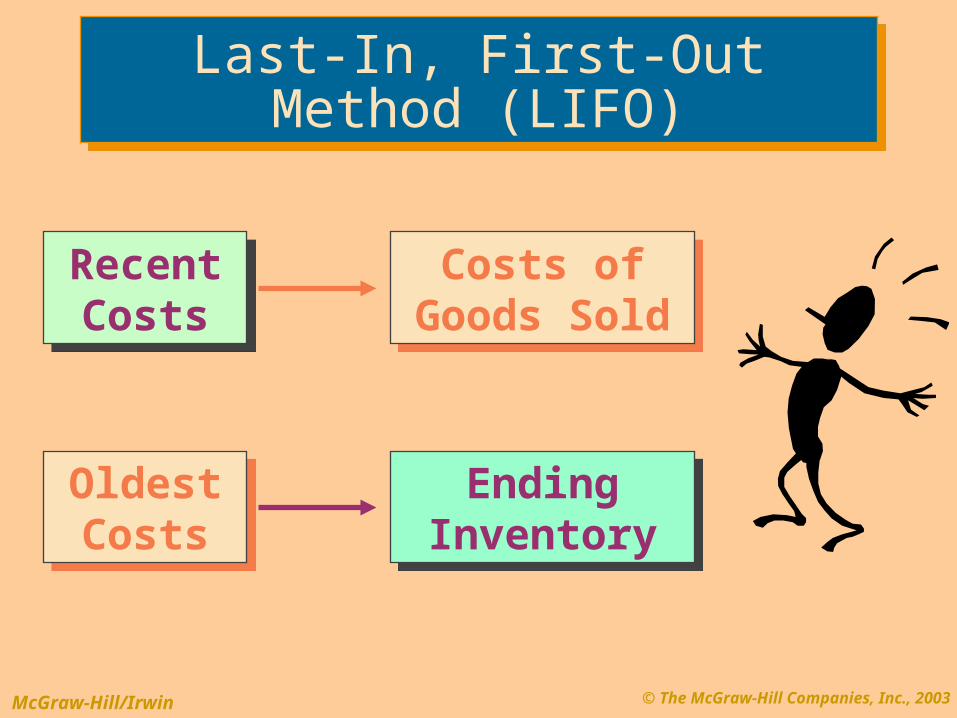
Costs of Goods Sold
Costs of Goods Sold
Ending InventoryEnding
Inventory
Recent Costs
Recent Costs
Oldest Costs
Oldest Costs
Last-In, First-Out Method (LIFO)Last-In, First-Out Method (LIFO)
© The McGraw-Hill Companies, Inc., 2003McGraw-Hill/Irwin
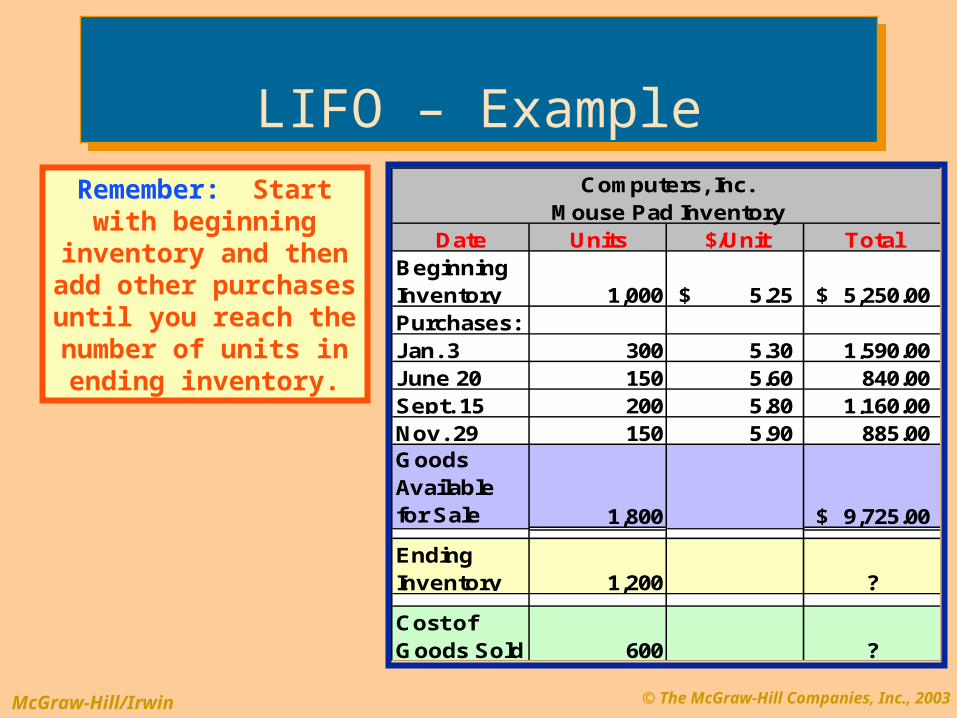
Remember: Start with beginning inventory and then add other purchases until you reach the number of
units in ending inventory.
LIFO – ExampleLIFO – ExampleComputers, Inc.
Mouse Pad InventoryDate Units $/Unit Total
Beginning Inventory 1,000 5.25$ 5,250.00$ Purchases:Jan. 3 300 5.30 1,590.00 June 20 150 5.60 840.00 Sept. 15 200 5.80 1,160.00 Nov. 29 150 5.90 885.00 Goods Available for Sale 1,800 9,725.00$
Ending Inventory 1,200 ?
Cost of Goods Sold 600 ?
© The McGraw-Hill Companies, Inc., 2003McGraw-Hill/Irwin
Date Beg. Inv. Purchases End. Inv.Cost of
Goods Sold1,000@$5.25 1,000@$5.25
Units 1,000
LIFO – ExampleLIFO – Example
Date Beg. Inv. Purchases End. Inv.Cost of
Goods Sold1,000@$5.25 1,000@$5.25
Jan. 3 300@$5.30 200@$5.30100@$5.30
Units 1,200 100
Now, we have allocated the cost to all 1,200 units
in ending inventory.
Next, let’s complete the
table.
Next, let’s complete the
table.
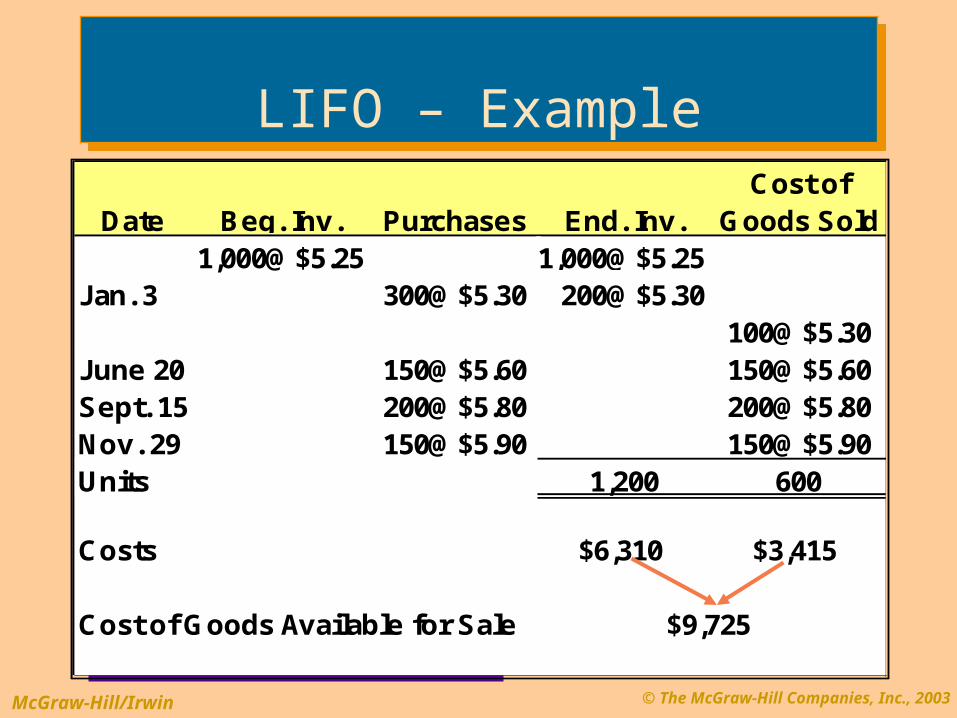
Date Beg. Inv. Purchases End. Inv.Cost of
Goods Sold1,000@$5.25 1,000@$5.25
Jan. 3 300@$5.30 200@$5.30100@$5.30
June 20 150@$5.60 150@$5.60Sept. 15 200@$5.80 200@$5.80Nov. 29 150@$5.90 150@$5.90Units 1,200 600
Costs $6,310 $3,415
Cost of Goods Available for Sale $9,725
© The McGraw-Hill Companies, Inc., 2003McGraw-Hill/Irwin
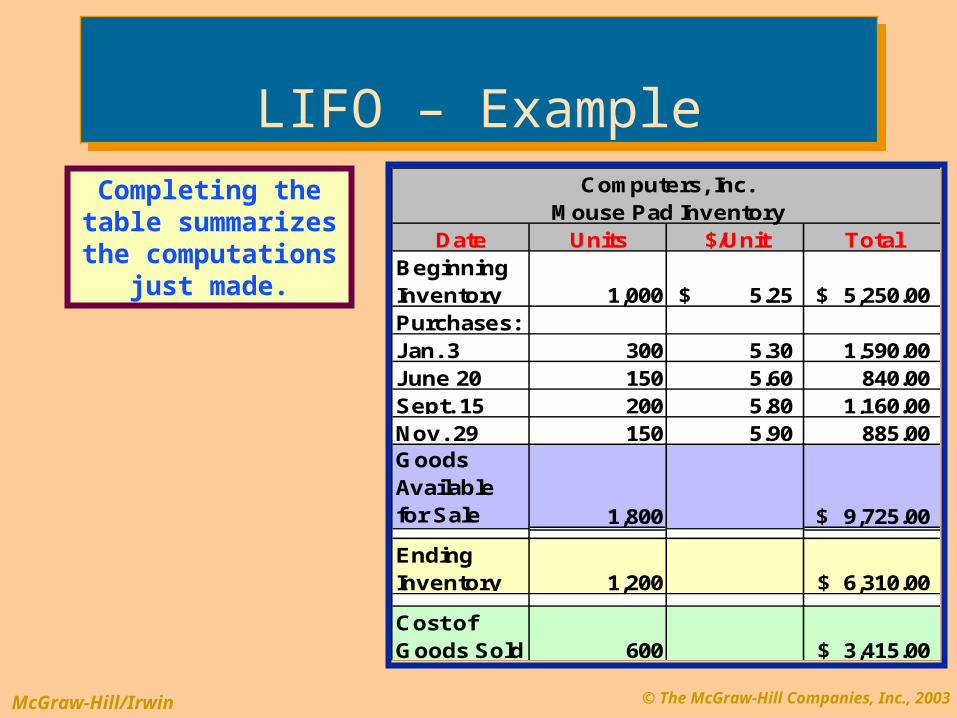
Completing the table summarizes the
computations just made.
LIFO – ExampleLIFO – ExampleComputers, Inc.
Mouse Pad InventoryDate Units $/Unit Total
Beginning Inventory 1,000 5.25$ 5,250.00$ Purchases:Jan. 3 300 5.30 1,590.00 June 20 150 5.60 840.00 Sept. 15 200 5.80 1,160.00 Nov. 29 150 5.90 885.00 Goods Available for Sale 1,800 9,725.00$
Ending Inventory 1,200 6,310.00$
Cost of Goods Sold 600 3,415.00$

© The McGraw-Hill Companies, Inc., 2003McGraw-Hill/Irwin
Errors in Measuring InventoryBeginning Inventory Ending Inventory
Effect on Income Statement Overstated Understated Overstated Understated
Goods Available for Sale + - 0 0
Cost of Goods Sold + - - +Gross Profit - + + -Net Income - + + -Effect on Balance Sheet
Ending Inventory 0 0 + -Retained Earnings - + + -
An error in ending inventory in a year will result in the same error in the beginning inventory of the next year.
An error in ending inventory in a year will result in the same error in the beginning inventory of the next year.
Importance of an Accurate Valuation of Inventory
Importance of an Accurate Valuation of Inventory

© The McGraw-Hill Companies, Inc., 2003McGraw-Hill/Irwin
For interim financial statements, we may need to estimate ending inventory and cost of goods sold.
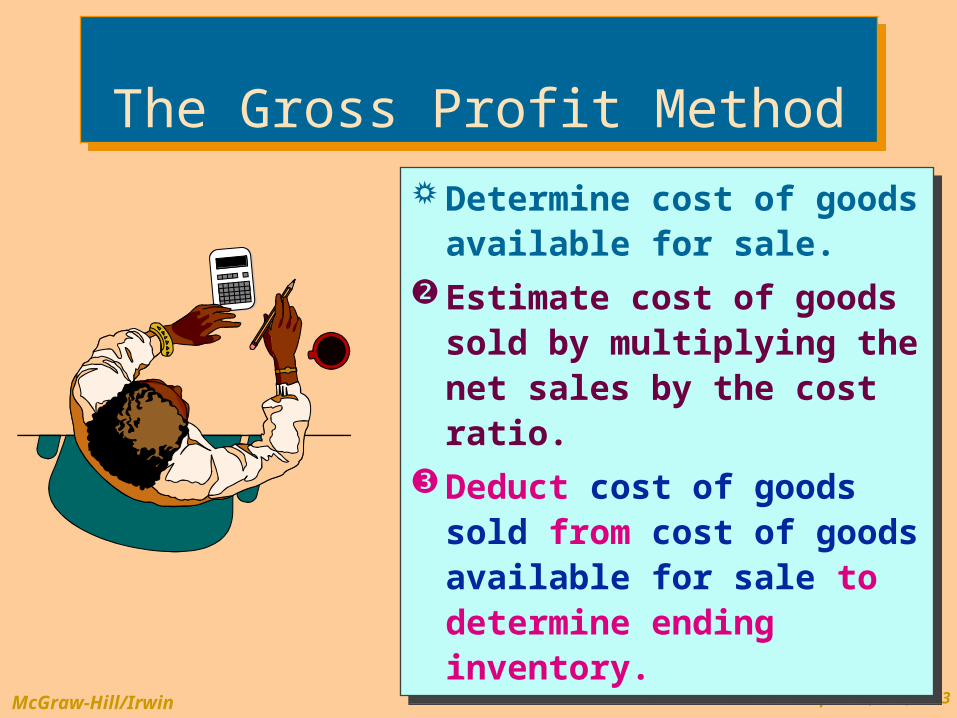
© The McGraw-Hill Companies, Inc., 2003McGraw-Hill/Irwin
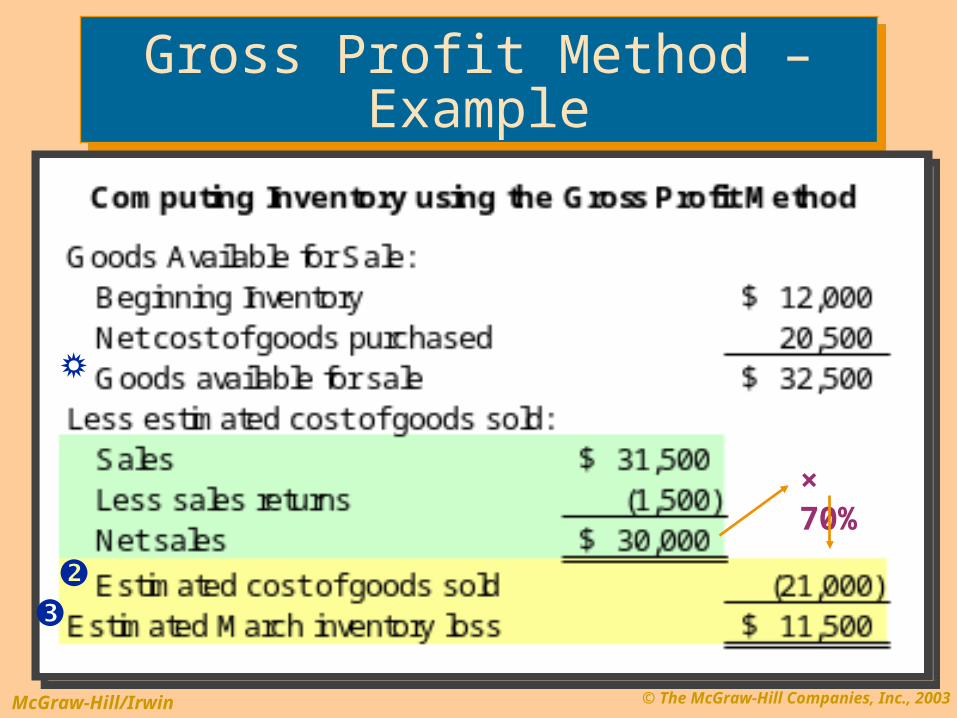
Determine cost of goods available for sale.
Estimate cost of goods sold by multiplying the net sales by the cost ratio.
Deduct cost of goods sold from cost of goods available for sale to determine ending inventory.
Determine cost of goods available for sale.
Estimate cost of goods sold by multiplying the net sales by the cost ratio.
Deduct cost of goods sold from cost of goods available for sale to determine ending inventory.
The Gross Profit MethodThe Gross Profit Method
© The McGraw-Hill Companies, Inc., 2003McGraw-Hill/Irwin
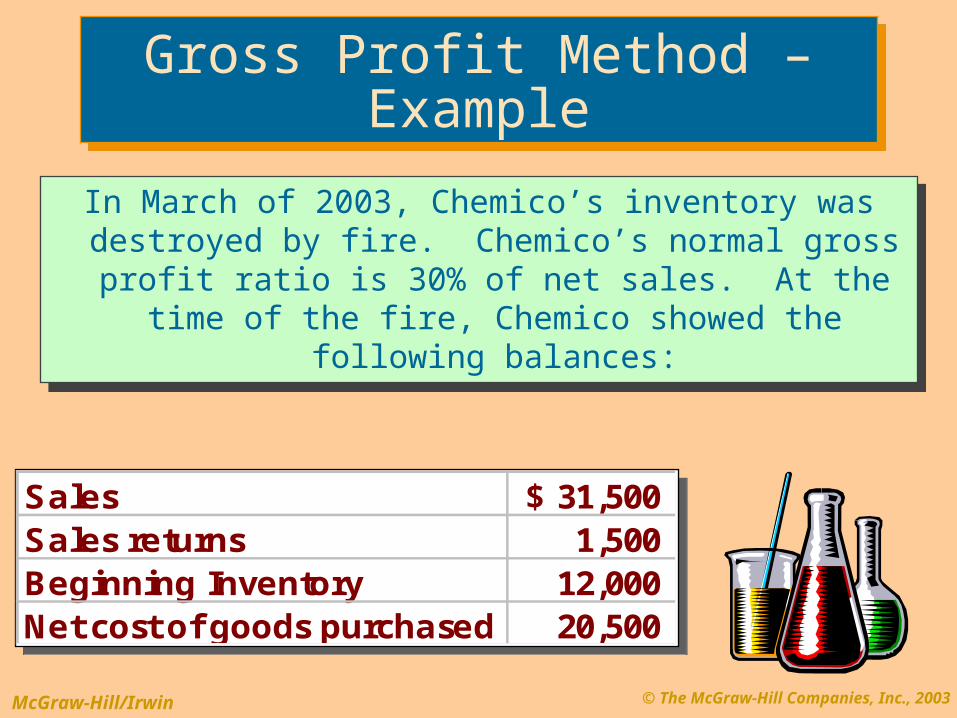
In March of 2003, Chemico’s inventory was destroyed by fire. Chemico’s normal gross profit ratio is 30% of net sales. At the time of the fire,
Chemico showed the following balances:
In March of 2003, Chemico’s inventory was destroyed by fire. Chemico’s normal gross profit ratio is 30% of net sales. At the time of the fire,
Chemico showed the following balances:
Sales 31,500$ Sales returns 1,500 Beginning Inventory 12,000 Net cost of goods purchased 20,500
Sales 31,500$ Sales returns 1,500 Beginning Inventory 12,000 Net cost of goods purchased 20,500
Gross Profit Method – ExampleGross Profit Method – Example
© The McGraw-Hill Companies, Inc., 2003McGraw-Hill/Irwin
Gross Profit Method – ExampleGross Profit Method – Example
× 70%
© The McGraw-Hill Companies, Inc., 2003McGraw-Hill/Irwin
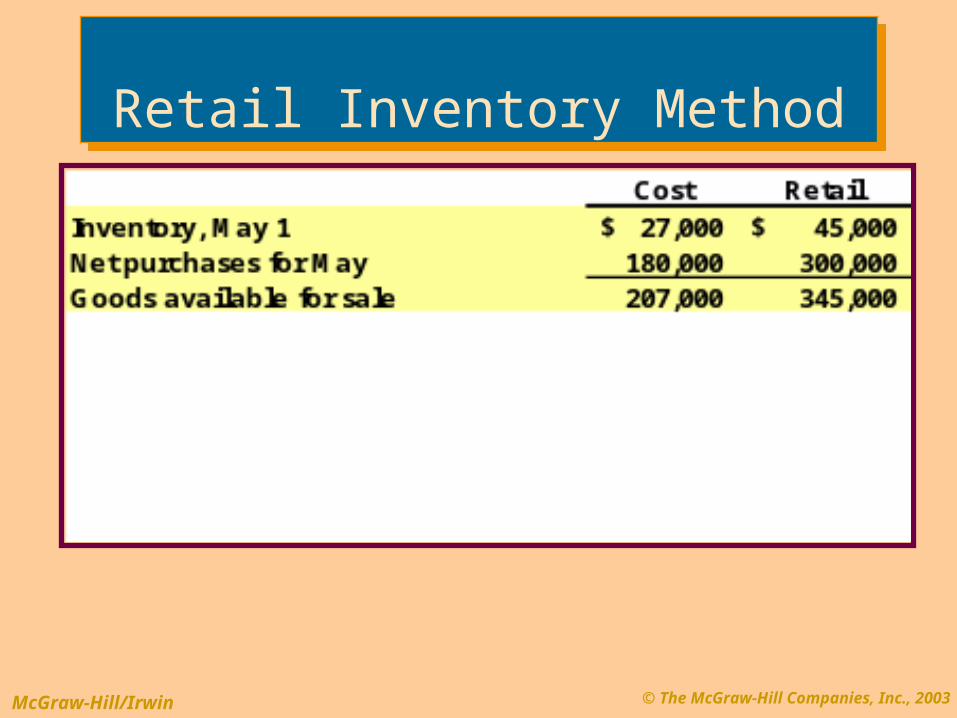
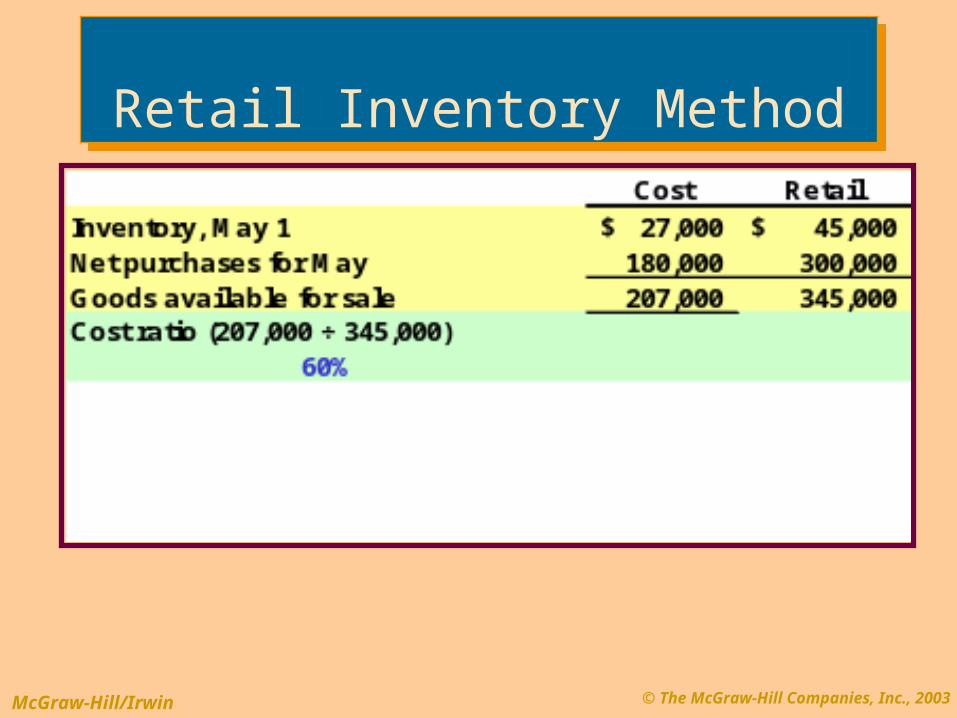
Retail Inventory MethodRetail Inventory Method
EndingInventoryat Cost
EndingInventoryat Cost
EndingInventoryat Retail
EndingInventoryat Retail
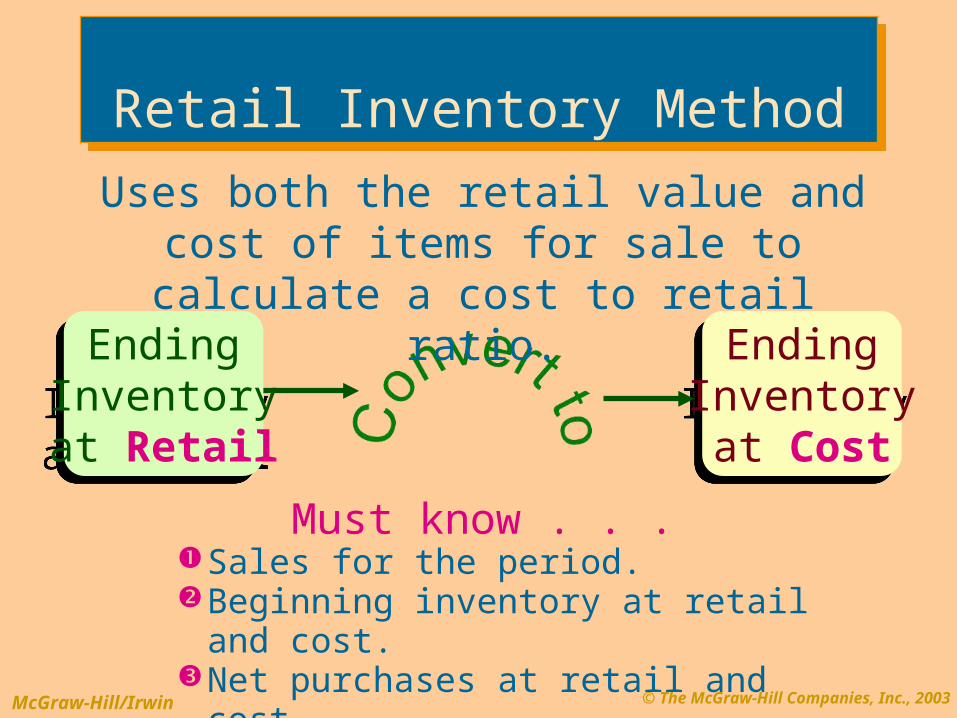
Uses both the retail value and cost of items for sale to calculate a cost
to retail ratio.
Must know . . .Sales for the period.Beginning inventory at retail and
cost.Net purchases at retail and cost.
© The McGraw-Hill Companies, Inc., 2003McGraw-Hill/Irwin
Retail Inventory MethodRetail Inventory Method
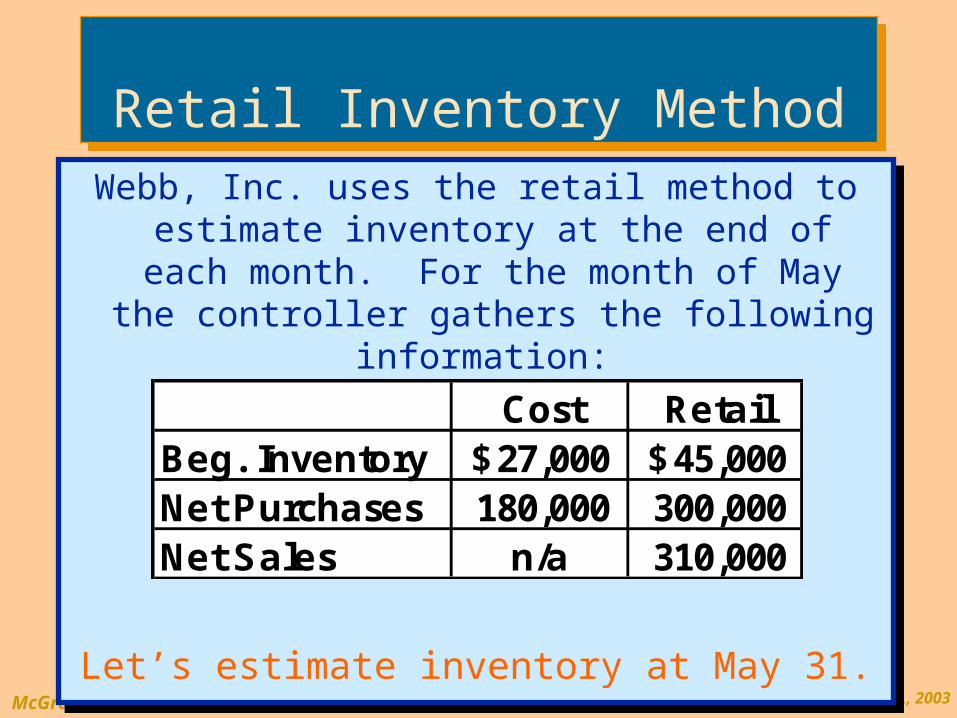
Webb, Inc. uses the retail method to estimate inventory at the end of each
month. For the month of May the controller gathers the following
information:
Let’s estimate inventory at May 31.
Webb, Inc. uses the retail method to estimate inventory at the end of each
month. For the month of May the controller gathers the following
information:
Let’s estimate inventory at May 31.
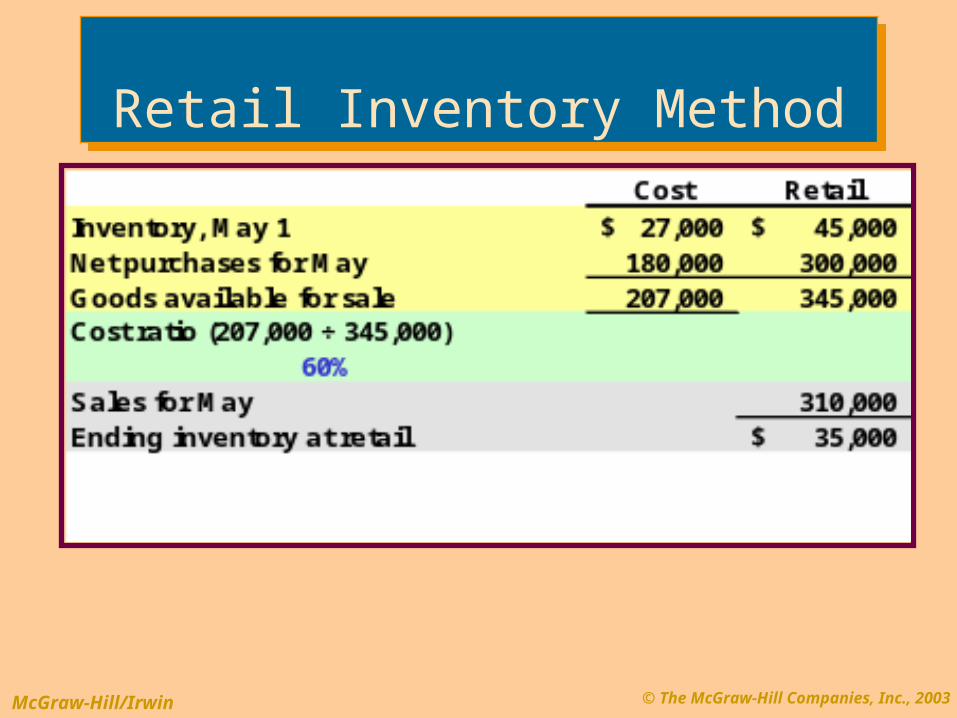
Cost RetailBeg. Inventory 27,000$ 45,000$ Net Purchases 180,000 300,000 Net Sales n/a 310,000
© The McGraw-Hill Companies, Inc., 2003McGraw-Hill/Irwin
Retail Inventory MethodRetail Inventory Method
© The McGraw-Hill Companies, Inc., 2003McGraw-Hill/Irwin
Retail Inventory MethodRetail Inventory Method
© The McGraw-Hill Companies, Inc., 2003McGraw-Hill/Irwin
Retail Inventory MethodRetail Inventory Method

© The McGraw-Hill Companies, Inc., 2003McGraw-Hill/Irwin
Retail Inventory MethodRetail Inventory Method
© The McGraw-Hill Companies, Inc., 2003McGraw-Hill/Irwin
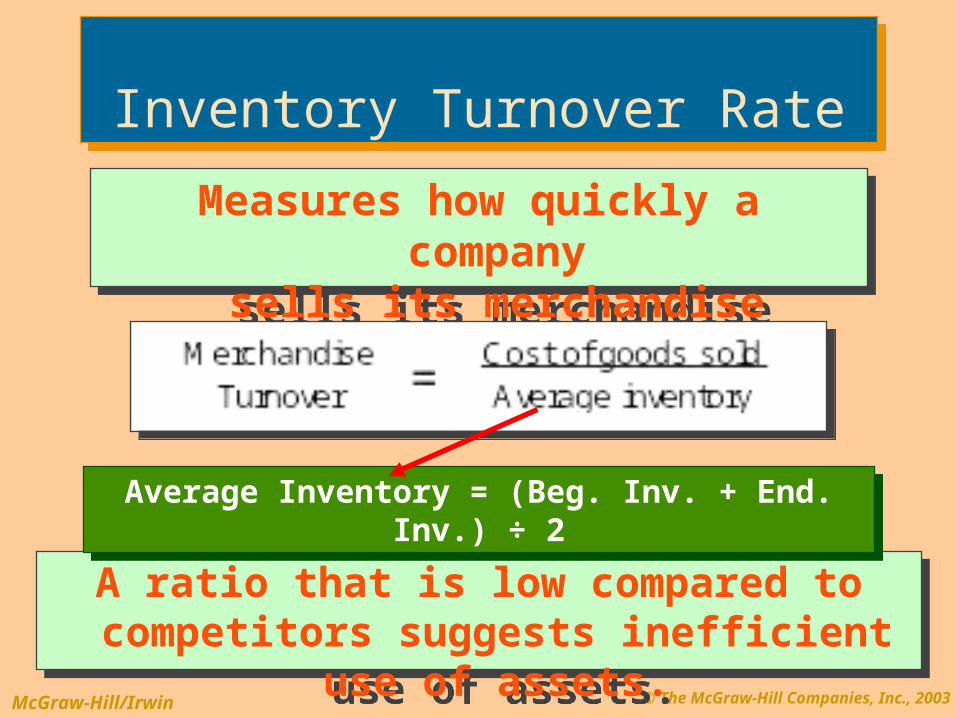
Measures how quickly a companysells its merchandise inventory.
Measures how quickly a companysells its merchandise inventory.
A ratio that is low compared to competitors suggests inefficient use of assets.
A ratio that is low compared to competitors suggests inefficient use of assets.
Average Inventory = (Beg. Inv. + End. Inv.) ÷ 2Average Inventory = (Beg. Inv. + End. Inv.) ÷ 2
Inventory Turnover RateInventory Turnover Rate
© The McGraw-Hill Companies, Inc., 2003McGraw-Hill/Irwin
Remember that identical companies that use different
inventory methods (e.g., FIFO and LIFO) will have
different inventory turnover ratios.
Accounting Methods Can Affect Analytical Ratios
Accounting Methods Can Affect Analytical Ratios
© The McGraw-Hill Companies, Inc., 2003McGraw-Hill/Irwin
End of Chapter 8End of Chapter 8