Embed Size (px)
Citation preview
1
Efficiency, Exchange, and the Invisible Hand in Action
Chapter 7
Copyright © 2013 by The McGraw-Hill Companies, Inc. All rights reserved.McGraw-Hill/Irwin
7-2
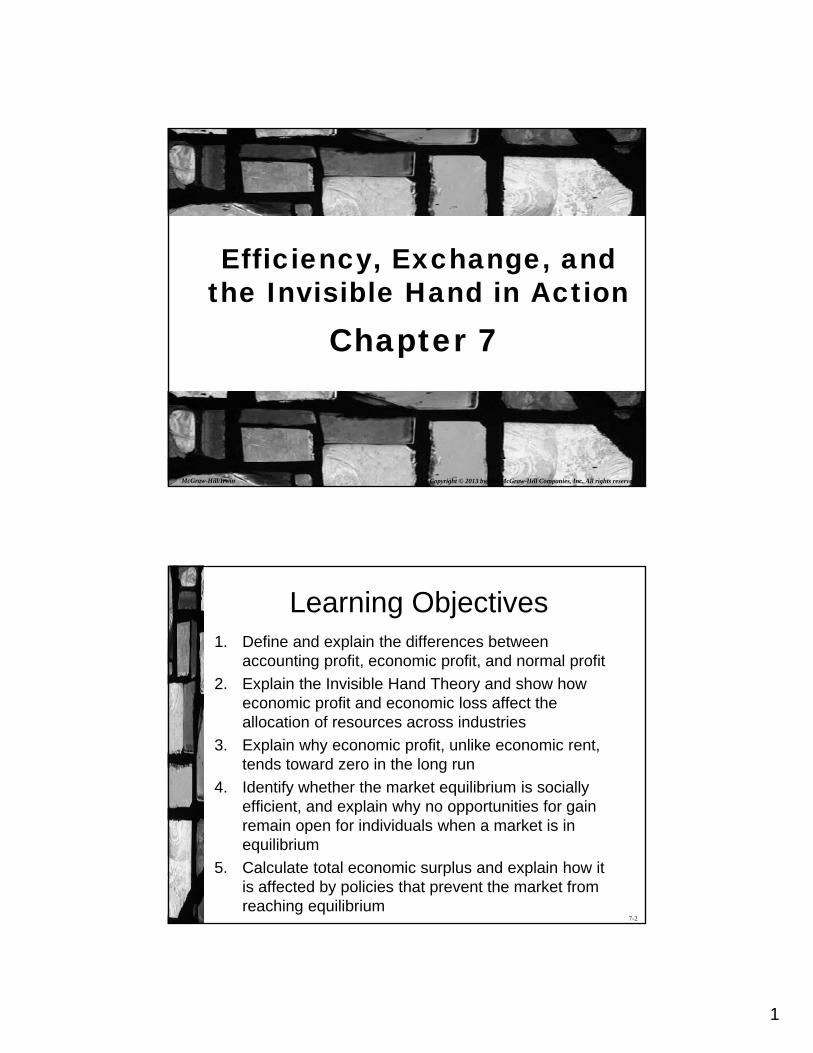
Learning Objectives1. Define and explain the differences between
accounting profit, economic profit, and normal profit
2. Explain the Invisible Hand Theory and show how economic profit and economic loss affect the allocation of resources across industries
3. Explain why economic profit, unlike economic rent, tends toward zero in the long run
4. Identify whether the market equilibrium is socially efficient, and explain why no opportunities for gain remain open for individuals when a market is in equilibrium
5. Calculate total economic surplus and explain how it is affected by policies that prevent the market from reaching equilibrium

2
7-3
Markets Are Dynamic
• Every time you see one of these signs, you see the market dynamics at work:– Store for Lease
– Going Out of Business Sale• Everything Must Go
– Now Open
– Close-Out Model
– Under New Management
7-4
The Invisible Hand
• Individuals act in their own interests– Aggregate outcome is collective well-being
• Profit motive – Produces highly valued goods and services
– Allocates resources to their highest value use• Jon Stewart does not wait tables
3
7-5
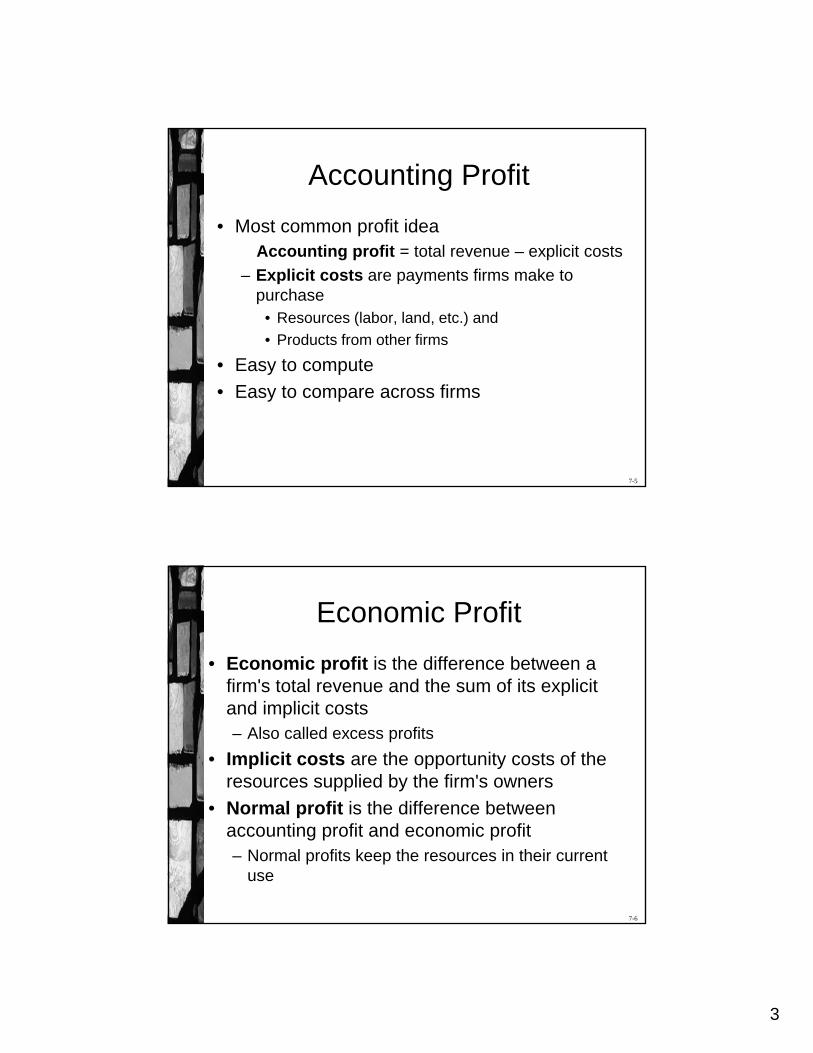
Accounting Profit
• Most common profit ideaAccounting profit = total revenue – explicit costs
– Explicit costs are payments firms make to purchase
• Resources (labor, land, etc.) and
• Products from other firms
• Easy to compute
• Easy to compare across firms
7-6
Economic Profit
• Economic profit is the difference between a firm's total revenue and the sum of its explicit and implicit costs– Also called excess profits
• Implicit costs are the opportunity costs of the resources supplied by the firm's owners
• Normal profit is the difference between accounting profit and economic profit– Normal profits keep the resources in their current
use
4
7-7
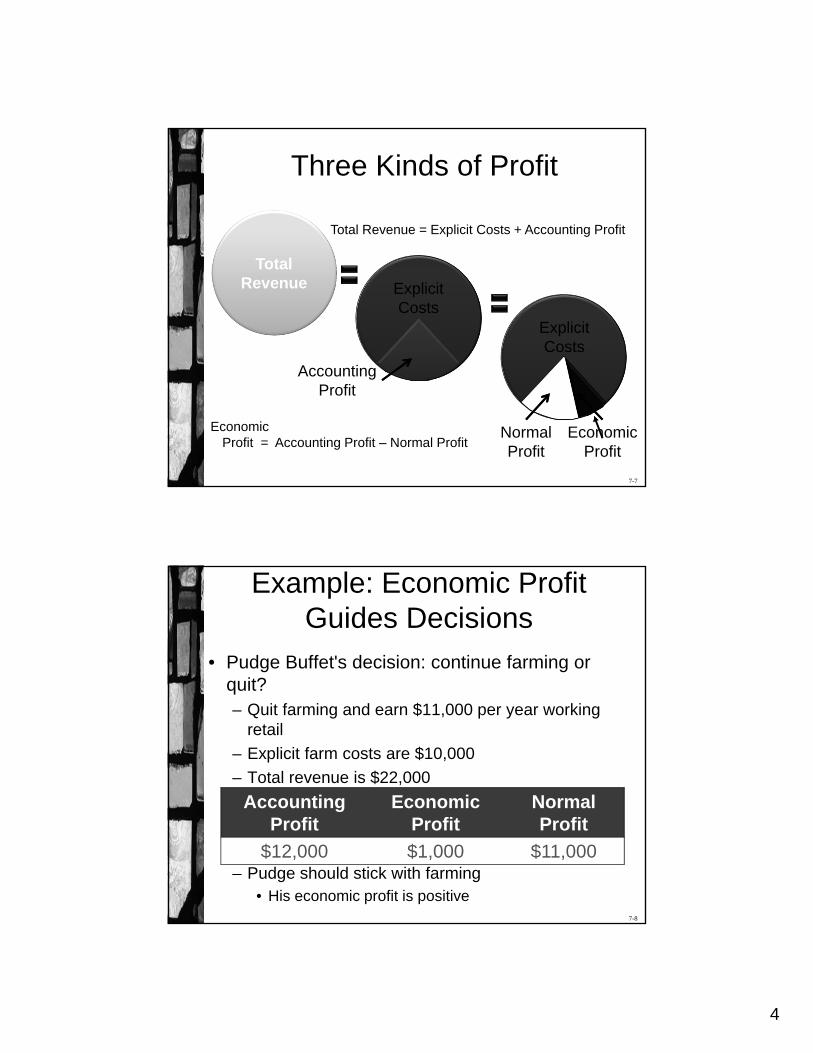
Three Kinds of Profit
TotalRevenue Explicit
Costs
AccountingProfit
Normal Profit
EconomicProfit
ExplicitCosts
Total Revenue = Explicit Costs + Accounting Profit
EconomicProfit = Accounting Profit – Normal Profit
7-8
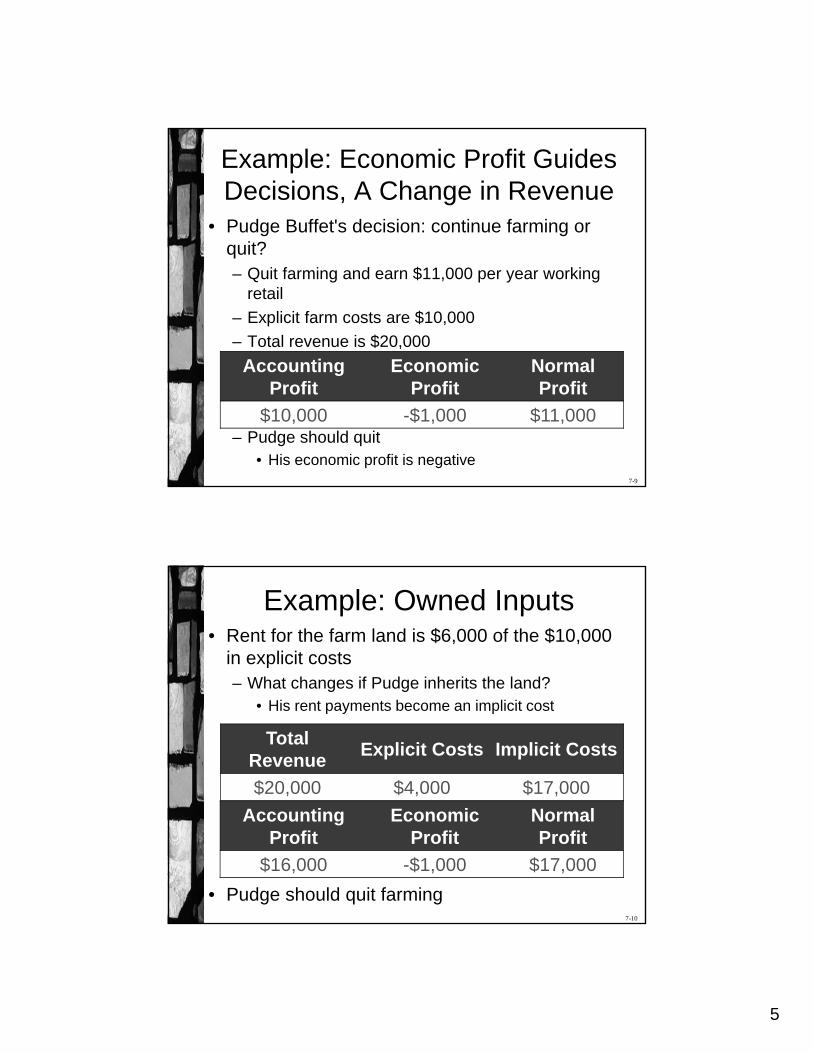
Example: Economic Profit Guides Decisions
• Pudge Buffet's decision: continue farming or quit?– Quit farming and earn $11,000 per year working
retail
– Explicit farm costs are $10,000
– Total revenue is $22,000
– Pudge should stick with farming• His economic profit is positive
Accounting Profit
Economic Profit
Normal Profit
$12,000 $1,000 $11,000
5
7-9
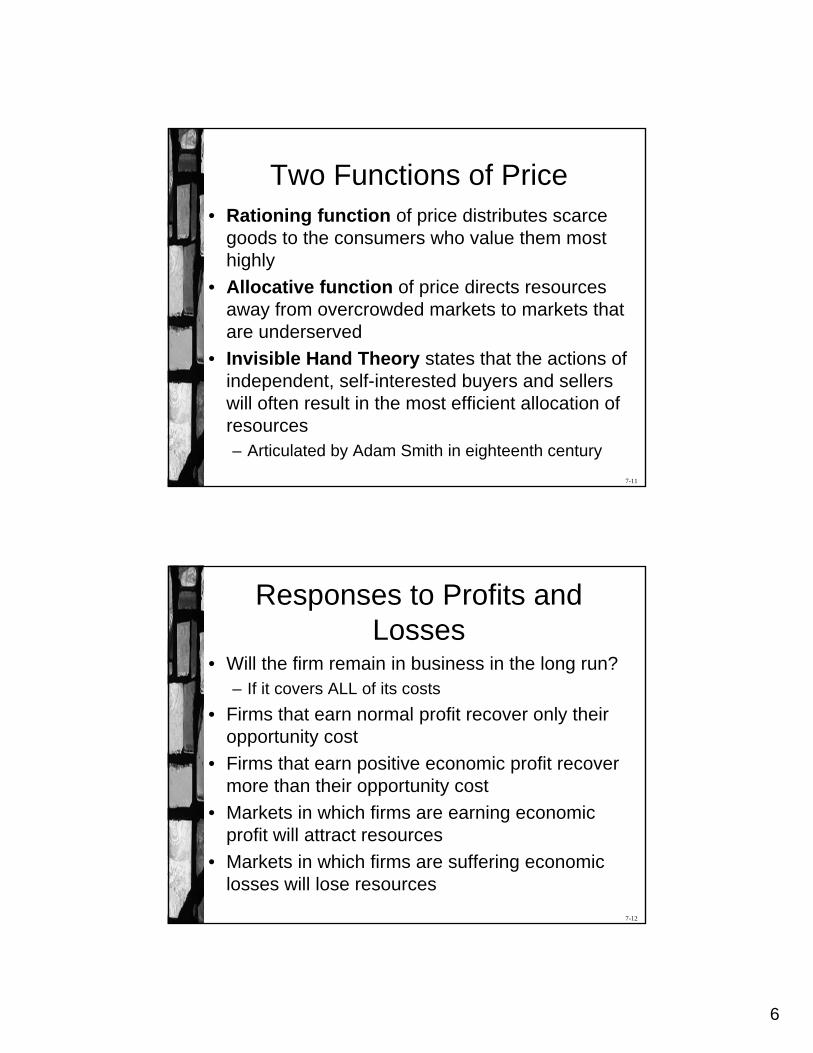
Example: Economic Profit Guides Decisions, A Change in Revenue
• Pudge Buffet's decision: continue farming or quit?– Quit farming and earn $11,000 per year working
retail
– Explicit farm costs are $10,000
– Total revenue is $20,000
– Pudge should quit• His economic profit is negative
Accounting Profit
Economic Profit
Normal Profit
$10,000 -$1,000 $11,000
7-10
Example: Owned Inputs• Rent for the farm land is $6,000 of the $10,000
in explicit costs– What changes if Pudge inherits the land?
• His rent payments become an implicit cost
• Pudge should quit farming
Total Revenue
Explicit Costs Implicit Costs
$20,000 $4,000 $17,000
Accounting Profit
Economic Profit
Normal Profit
$16,000 -$1,000 $17,000
6
7-11
Two Functions of Price• Rationing function of price distributes scarce
goods to the consumers who value them most highly
• Allocative function of price directs resources away from overcrowded markets to markets that are underserved
• Invisible Hand Theory states that the actions of independent, self-interested buyers and sellers will often result in the most efficient allocation of resources– Articulated by Adam Smith in eighteenth century
7-12
Responses to Profits and Losses
• Will the firm remain in business in the long run?– If it covers ALL of its costs
• Firms that earn normal profit recover only their opportunity cost
• Firms that earn positive economic profit recover more than their opportunity cost
• Markets in which firms are earning economic profit will attract resources
• Markets in which firms are suffering economic losses will lose resources
7
7-13
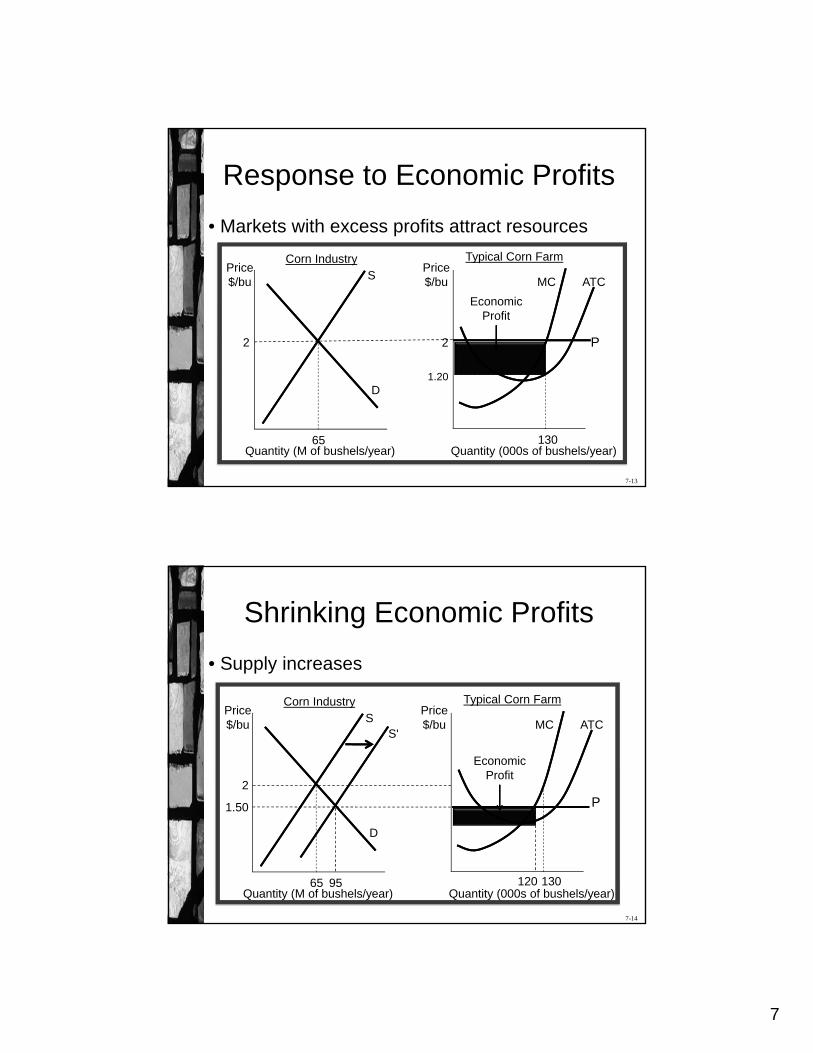
Response to Economic Profits
• Markets with excess profits attract resources
P2
Quantity (000s of bushels/year)
Price $/bu MC
130
ATC
1.20
Typical Corn FarmPrice $/bu
2
Quantity (M of bushels/year)
S
D
65
Corn Industry
Economic Profit
7-14
Shrinking Economic Profits
• Supply increases
P
Quantity (000s of bushels/year)
Price $/bu MC
130
ATC
Typical Corn FarmPrice $/bu
2
Quantity (M of bushels/year)
S
D
65
Corn Industry
Economic Profit
S'
1.50
95 120
8
7-15
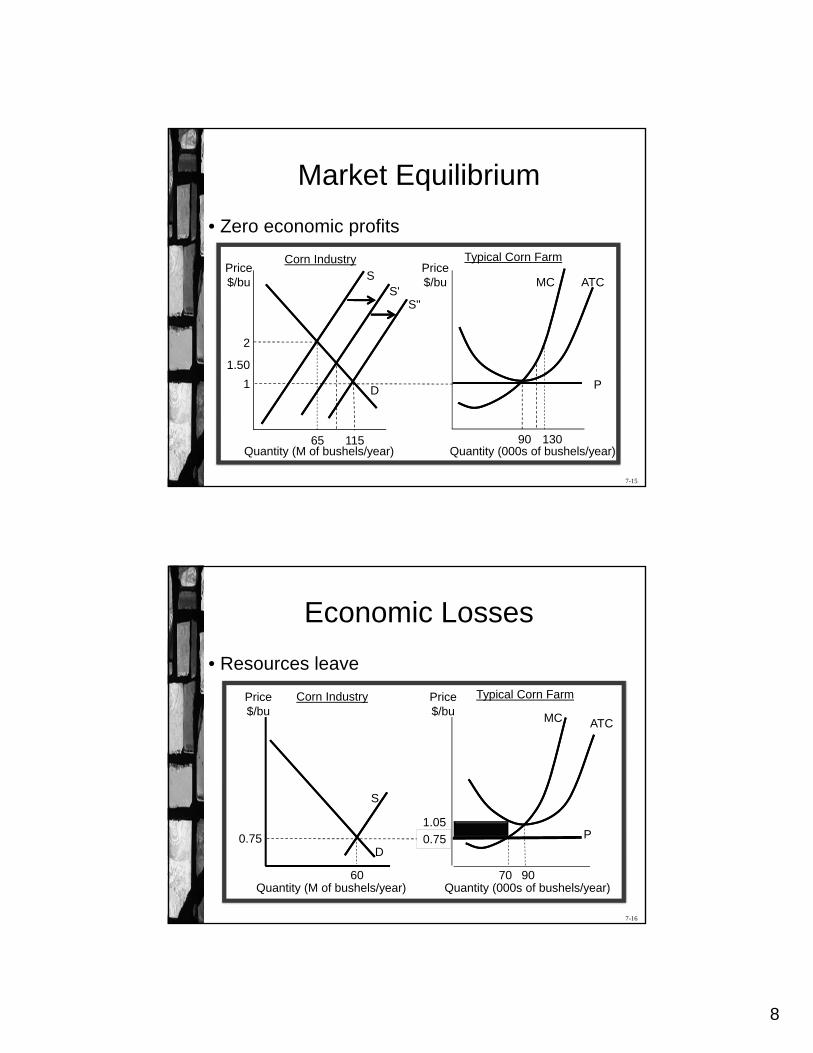
Market Equilibrium
• Zero economic profits
P
Quantity (000s of bushels/year)
Price $/bu MC
130
ATC
Typical Corn FarmPrice $/bu
2
Quantity (M of bushels/year)
S
D
65
Corn Industry
S'
1.50
115
1
S"
90
7-16
Economic Losses
• Resources leave
1.05
Quantity (M of bushels/year) Quantity (000s of bushels/year)70
0.75 P
90
ATCMC
S
D
60
Price $/bu
0.75
Price $/bu
Typical Corn FarmCorn Industry
9
7-17
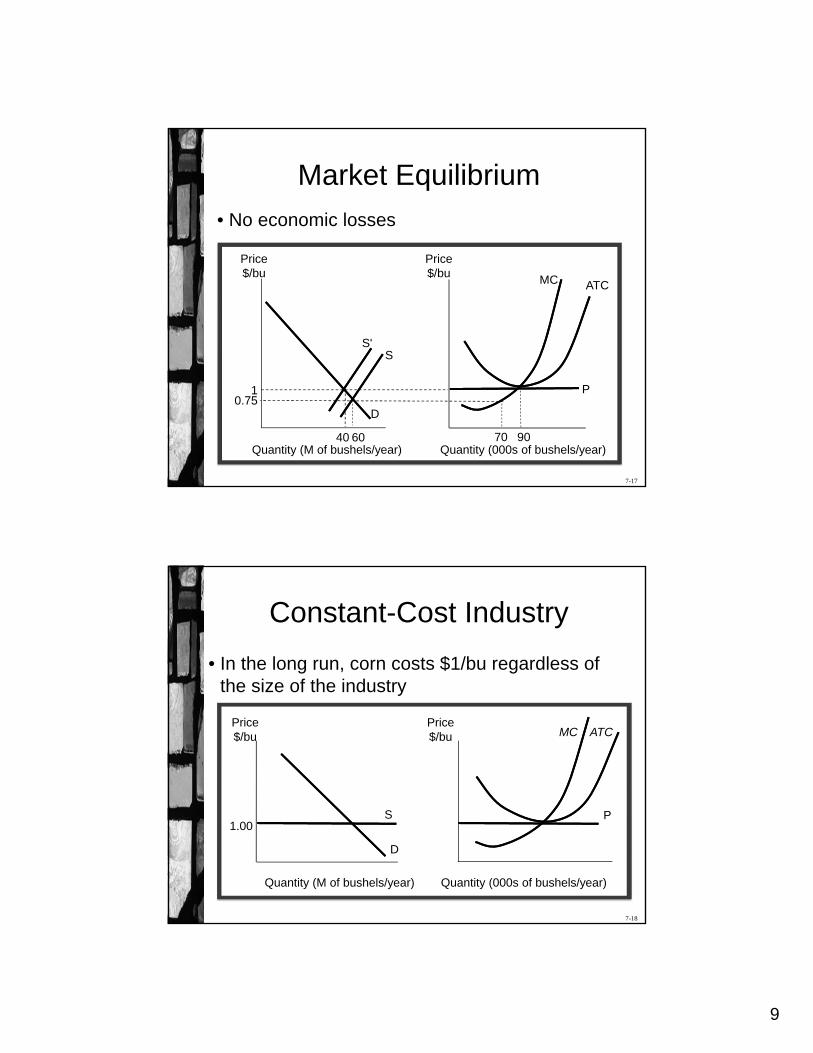
Market Equilibrium
• No economic losses
Quantity (M of bushels/year) Quantity (000s of bushels/year)70
0.75P
90
ATCMC
S
D
60
Price $/bu
Price $/bu
1
S'
40
7-18
Constant-Cost Industry
• In the long run, corn costs $1/bu regardless of the size of the industry
Quantity (M of bushels/year) Quantity (000s of bushels/year)
1.00
D
S P
MC ATCPrice $/bu
Price $/bu
10
7-19
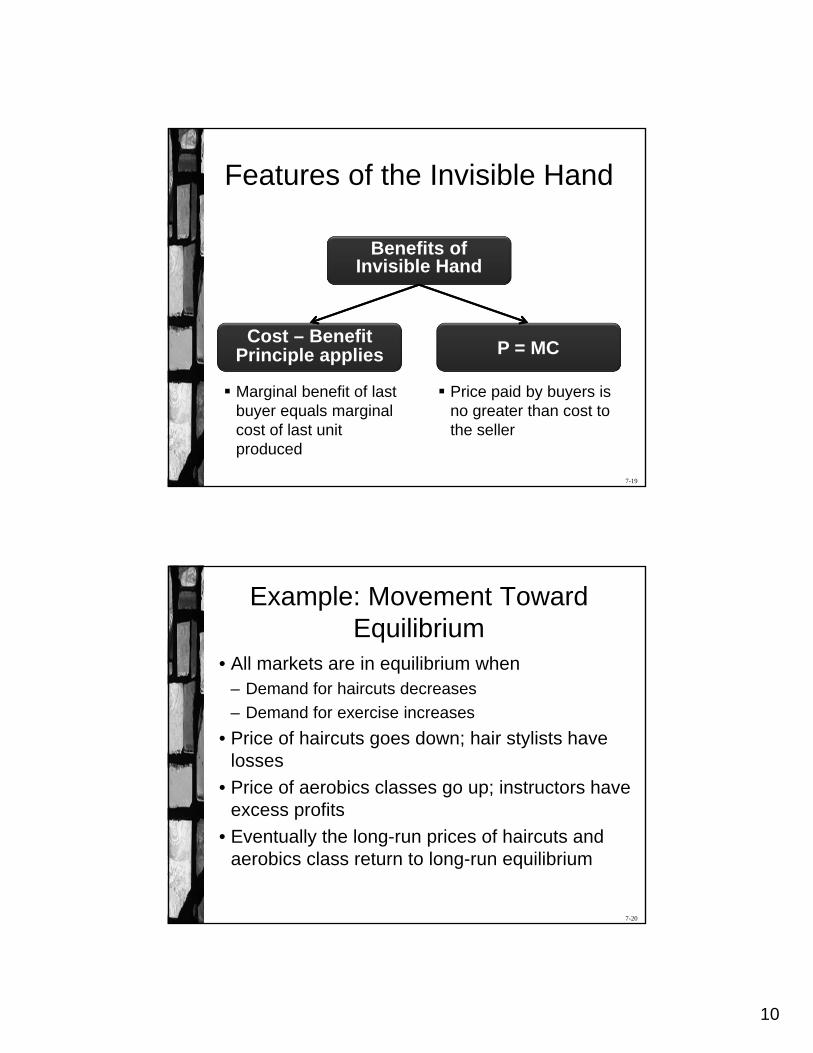
Features of the Invisible Hand
Benefits of Invisible Hand
Cost – Benefit Principle applies P = MC
Marginal benefit of last buyer equals marginal cost of last unit produced
Price paid by buyers is no greater than cost to the seller
7-20
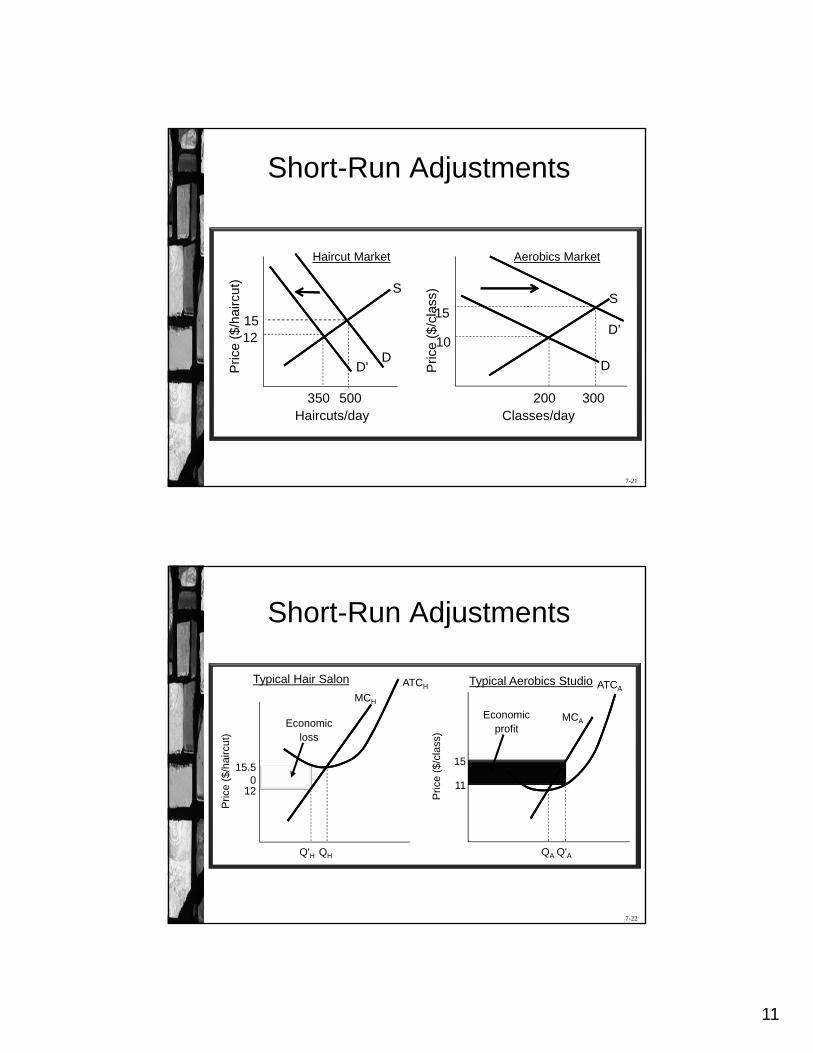
Example: Movement Toward Equilibrium
• All markets are in equilibrium when– Demand for haircuts decreases
– Demand for exercise increases
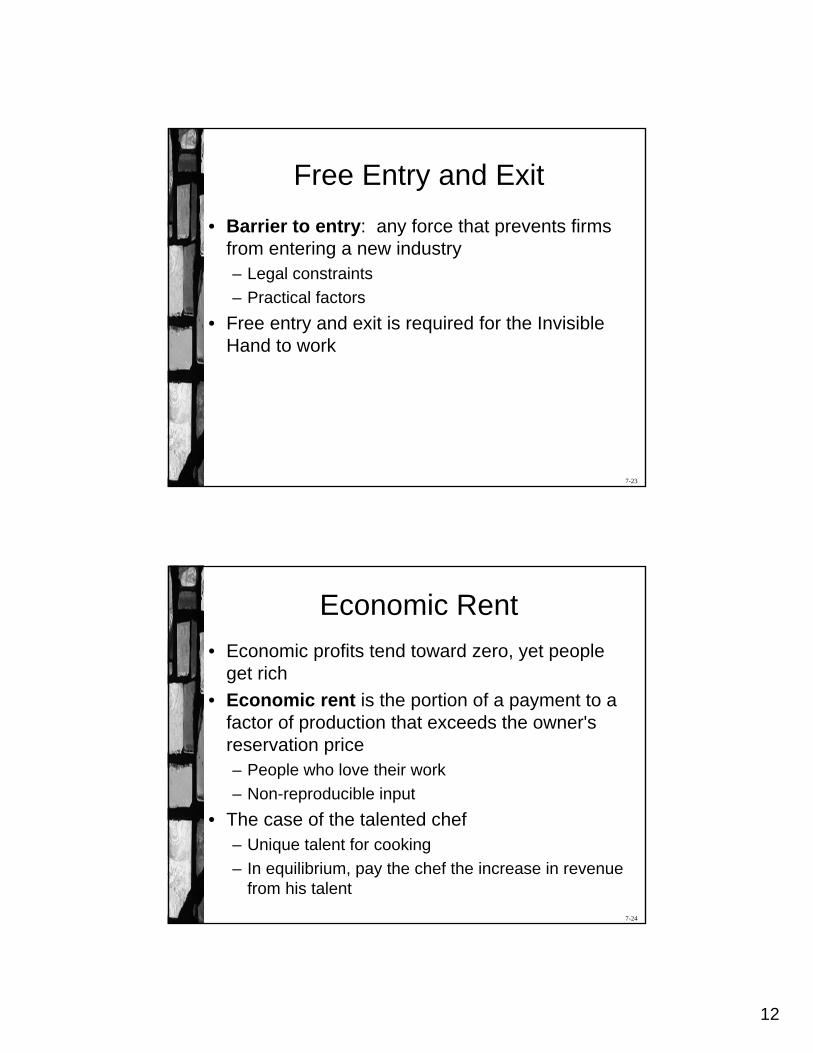
• Price of haircuts goes down; hair stylists have losses
• Price of aerobics classes go up; instructors have excess profits
• Eventually the long-run prices of haircuts and aerobics class return to long-run equilibrium
11
7-21
Short-Run Adjustments
Pric
e ($
/hai
rcut
)
Haircuts/day Classes/dayP
rice
($/c
lass
)S
D
500
15
200
10
D
S
350
15
D'
12D'
300
Haircut Market Aerobics Market
7-22
Short-Run Adjustments
MCH
QH
ATCH
Pric
e ($
/hai
rcut
)
Q'H
15.50
12
Economicloss
MCA
QA
ATCA
Pric
e (
$/cl
ass
)
Q'A
15
11
Economicprofit
Typical Hair Salon Typical Aerobics Studio
12
7-23
Free Entry and Exit
• Barrier to entry: any force that prevents firms from entering a new industry– Legal constraints
– Practical factors
• Free entry and exit is required for the Invisible Hand to work
7-24
Economic Rent
• Economic profits tend toward zero, yet people get rich
• Economic rent is the portion of a payment to a factor of production that exceeds the owner's reservation price– People who love their work
– Non-reproducible input
• The case of the talented chef– Unique talent for cooking
– In equilibrium, pay the chef the increase in revenue from his talent
13
7-25
Invisible Hand in the Supermarket
• No Cash on the Table Principle says short check-out lines get longer – quickly– Information is freely available
• Start in the shortest line– Observe the pace of all lines
• Missing price in your line
• Complaining customer next to you
– Decide whether to switch
7-26
Invisible Hand and Cost-Saving Innovations
• Competitive firms are price takers– Cost management required
• Innovation lowers cost for one firm– Profits increase by amount of cost savings
– Information is freely available
• Industry costs decrease
• Equilibrium price decreases by amount of cost savings– No excess profit
14
7-27
Example: Shipping Innovation
• 40 companies compete in trans-Atlantic shipping– Cost per trip is $500,000
• One firm innovates to save $20,000 in fuel per trip– Short-run economic profit
• Over time, competitors copy the innovation– Industry costs decrease by $20,000
– Equilibrium price decreases by $20,000
• In the long run, no firm earns economic profit
7-28
Market Equilibrium and Big Payoffs
• Equilibrium leaves no opportunities for individuals to gain– Non-equilibrium opportunities benefit individuals
• Exploiting opportunities moves the market toward equilibrium
• Three ways to earn a big payoff:1. Work exceptionally hard
2. Have some unique skill or talent
3. Be lucky
15
7-29
Invisible Hand and Socially Optimal Outcome
• Markets work best when– Buyers' marginal benefits = sellers' marginal costs
AND
– Society's marginal benefits = society's marginal costs
• Individual spending to improve a stock price forecast may benefit the individual– Some other individual loses
– Return to society of the investment is less than the benefit
7-30
Market Equilibrium and Efficiency
• Economic efficiency exists when no change could be made to benefit one party without harming the other– Sometimes called Pareto efficiency
– Different from engineering efficiency
– Equilibrium price and quantity are efficient
– Prices above or below equilibrium are not
16
7-31
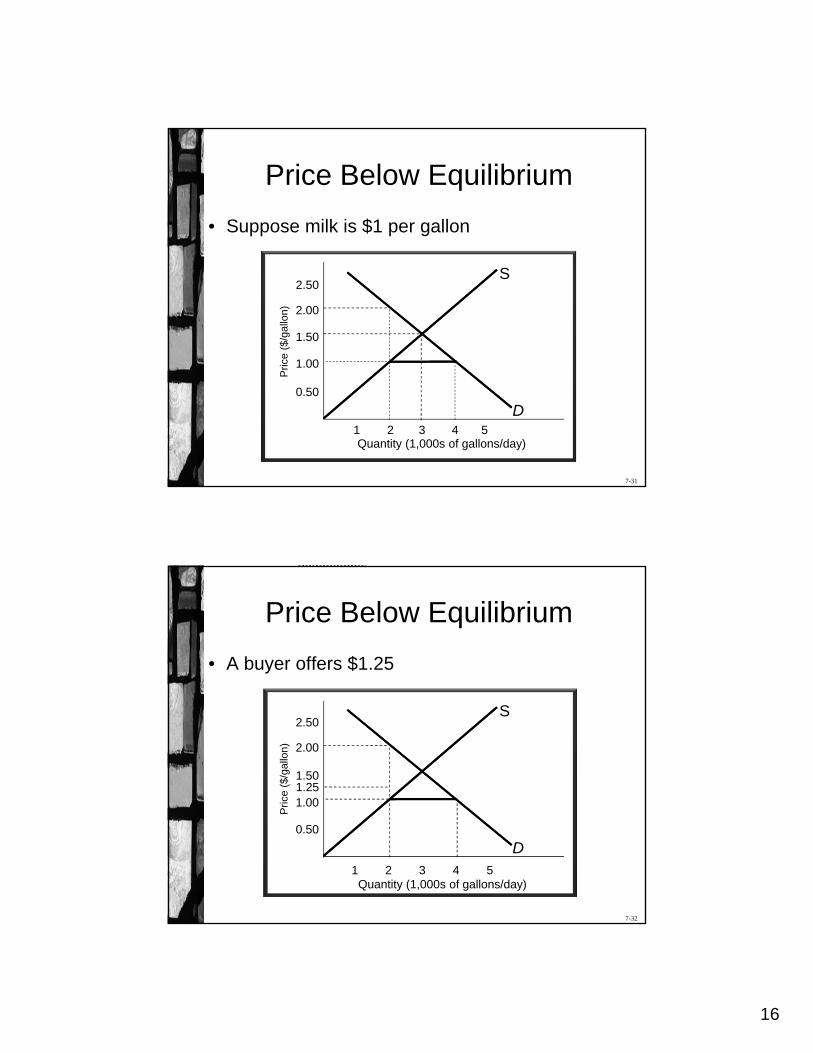
Price Below Equilibrium
• Suppose milk is $1 per gallon
2.50
Quantity (1,000s of gallons/day)
Pric
e ($
/gal
lon)
1 2 3 4 5
2.00
1.50
1.00
0.50
D
S
7-32
Price Below Equilibrium
• A buyer offers $1.25
2.50
Quantity (1,000s of gallons/day)
Pric
e ($
/gal
lon)
1 2 3 4 5
2.00
1.50
1.00
0.50
D
S
1.25
17
7-33
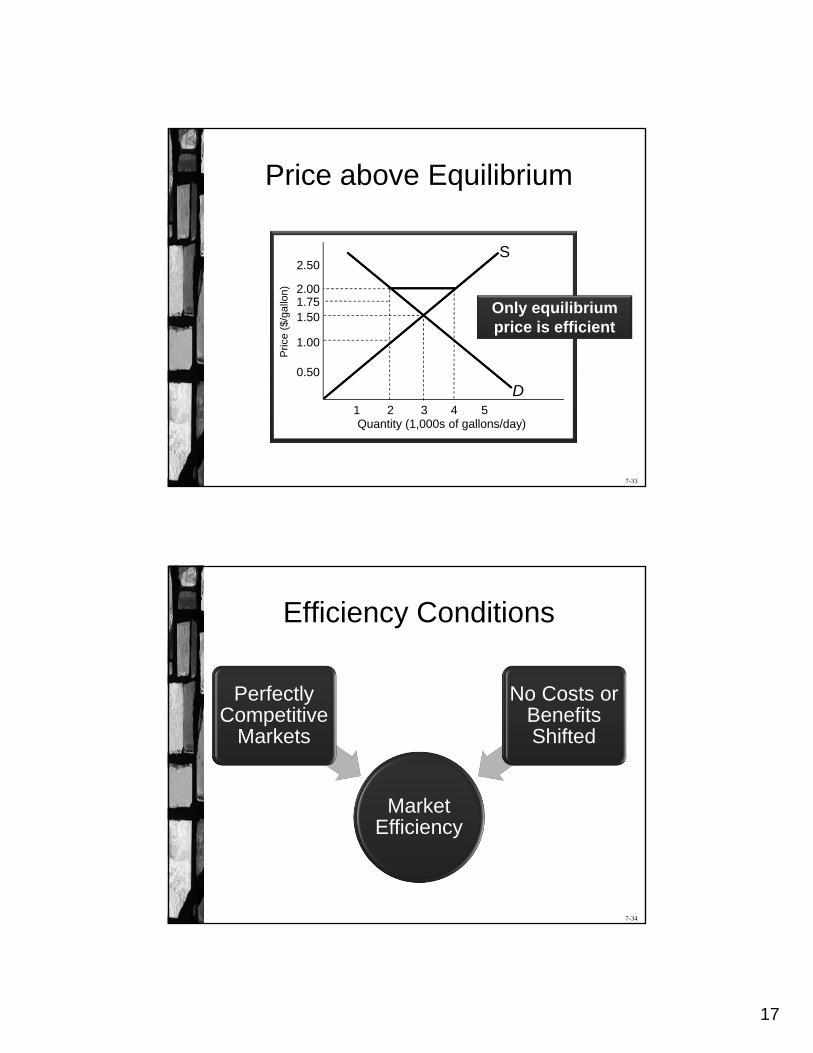
Price above Equilibrium
2.50
Quantity (1,000s of gallons/day)
Pric
e ($
/gal
lon)
1 2 3 4 5
2.00
1.50
1.00
0.50
D
S
1.75 Only equilibrium price is efficient
7-34
Efficiency Conditions
Market Efficiency
Perfectly Competitive
Markets
No Costs or Benefits Shifted
18
7-35
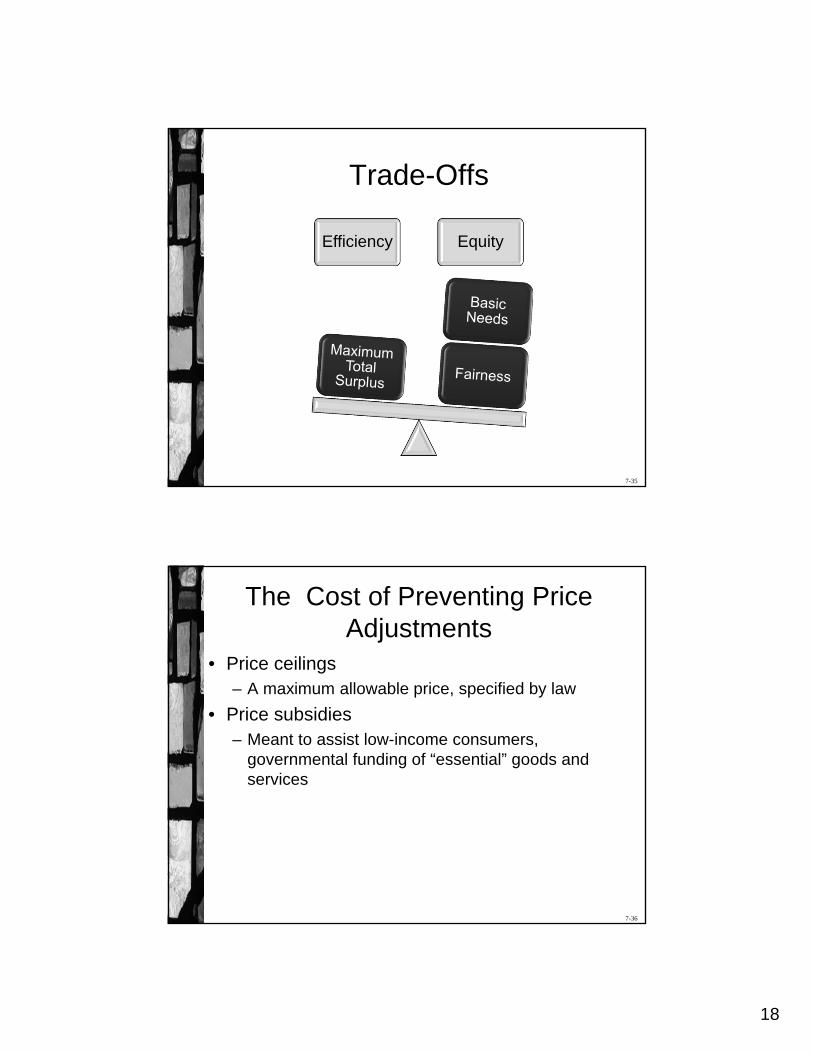
Trade-Offs
Efficiency Equity
7-36
The Cost of Preventing Price Adjustments
• Price ceilings– A maximum allowable price, specified by law
• Price subsidies– Meant to assist low-income consumers,
governmental funding of “essential” goods and services
19
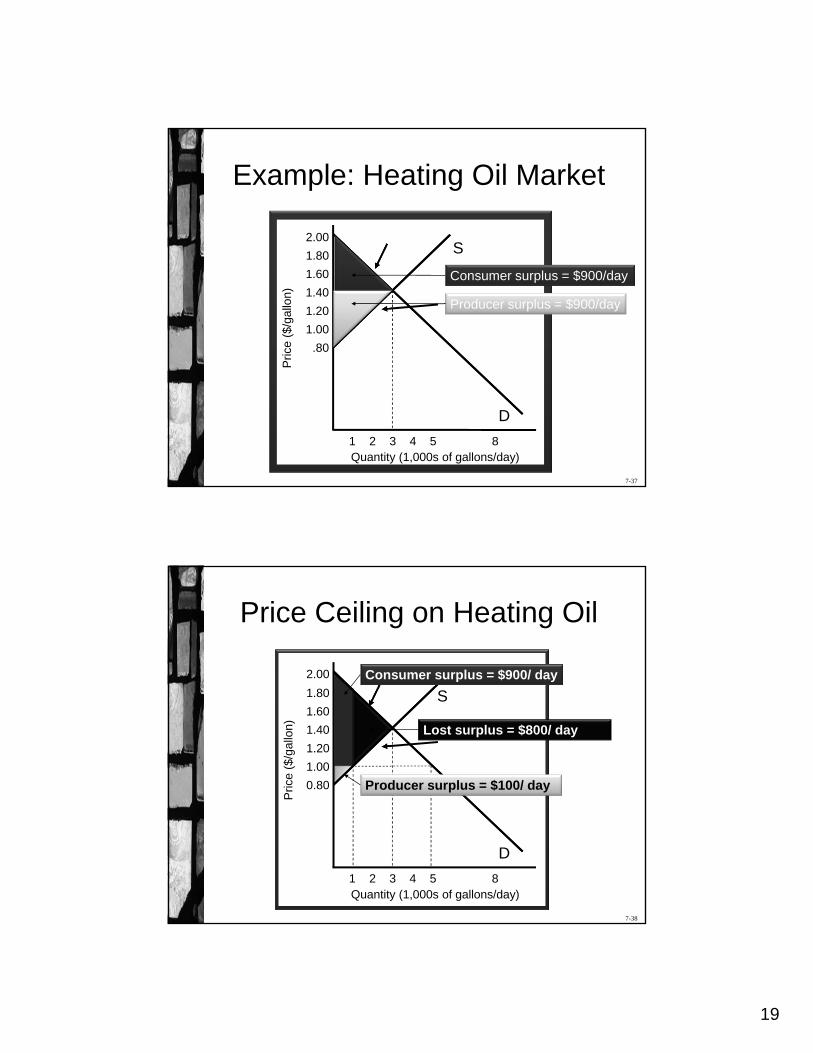
7-37
Example: Heating Oil Market
D
S2.00
Quantity (1,000s of gallons/day)
Pric
e ($
/gal
lon)
1 2 3 4 5
1.60
1.20
1.00
.80
1.80
1.40
8
Producer surplus = $900/day
Consumer surplus = $900/day
7-38
Price Ceiling on Heating Oil
D
S
2.00
Quantity (1,000s of gallons/day)
Pric
e ($
/gal
lon)
1 2 3 4 5
1.60
1.20
1.00
0.80
1.80
1.40
8
Lost surplus = $800/ day
Consumer surplus = $900/ day
Producer surplus = $100/ day
20
7-39
Surplus Lost to a Price Ceiling
• $800 underestimates surplus loss– Consumers place different values on heating oil
• If a person with a lower reservation price gets the oil, there is additional surplus lost
• Shortages increase non-market costs– Waiting in line
– Side payments
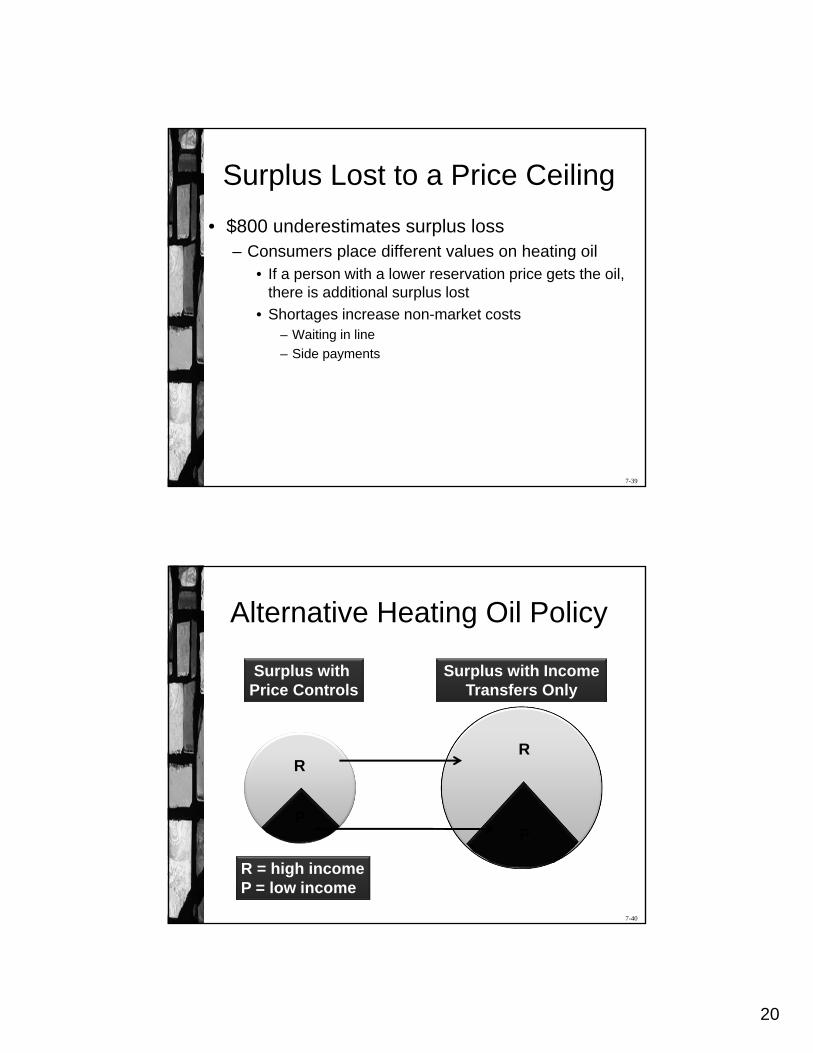
7-40
Alternative Heating Oil Policy
R
P
R
P
Surplus with Price Controls
Surplus with Income Transfers Only
R = high incomeP = low income
21
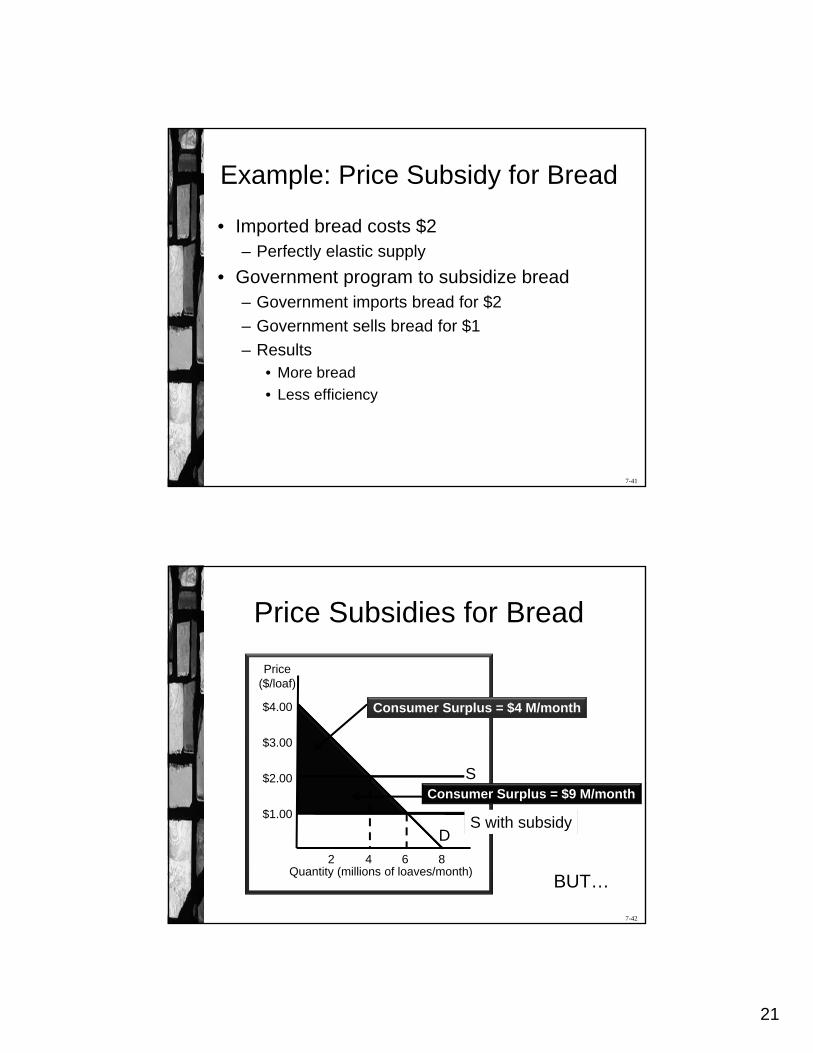
7-41
Example: Price Subsidy for Bread
• Imported bread costs $2– Perfectly elastic supply
• Government program to subsidize bread– Government imports bread for $2
– Government sells bread for $1
– Results• More bread
• Less efficiency
7-42
Price Subsidies for Bread
Quantity (millions of loaves/month)2 4 6
$3.00
$1.00
$4.00
8
$2.00
D
S
Price ($/loaf)
Consumer Surplus = $4 M/month
Consumer Surplus = $9 M/month
BUT…
S with subsidy
22
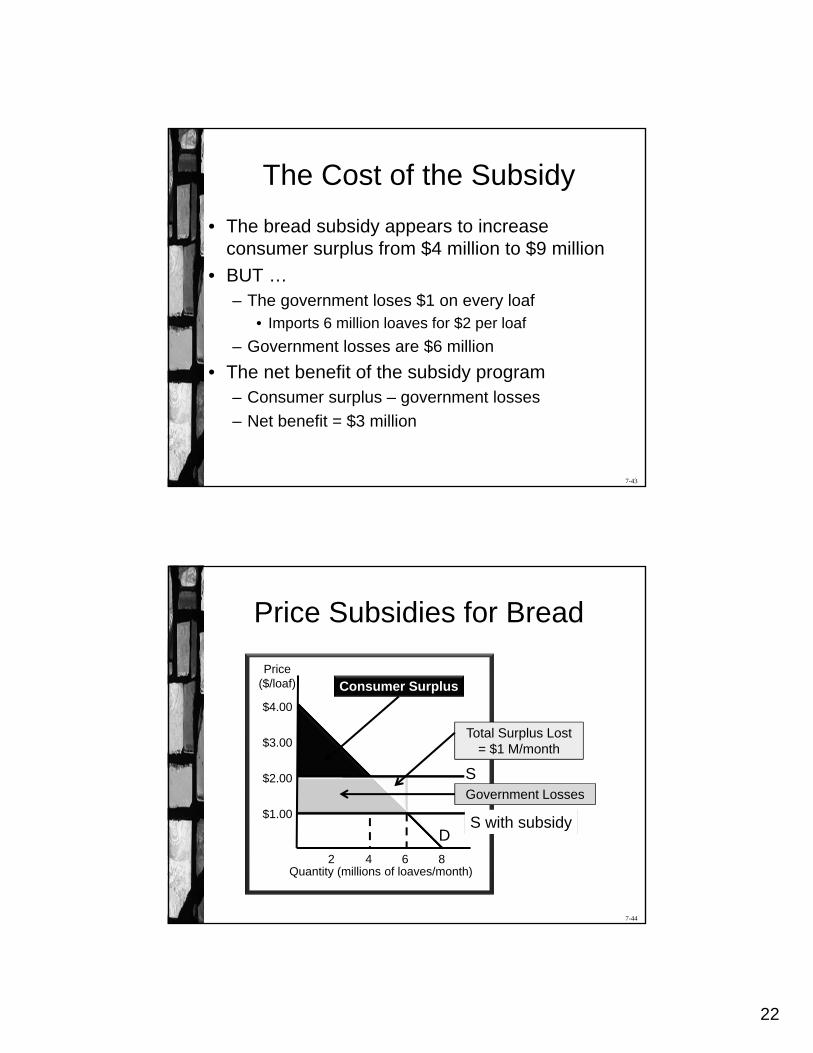
7-43
The Cost of the Subsidy
• The bread subsidy appears to increase consumer surplus from $4 million to $9 million
• BUT …– The government loses $1 on every loaf
• Imports 6 million loaves for $2 per loaf
– Government losses are $6 million
• The net benefit of the subsidy program – Consumer surplus – government losses
– Net benefit = $3 million
7-44
Price Subsidies for Bread
Quantity (millions of loaves/month)2 4 6
$3.00
$1.00
$4.00
8
$2.00
D
S
Price ($/loaf) Consumer Surplus
S with subsidy
Government Losses
Total Surplus Lost = $1 M/month
23
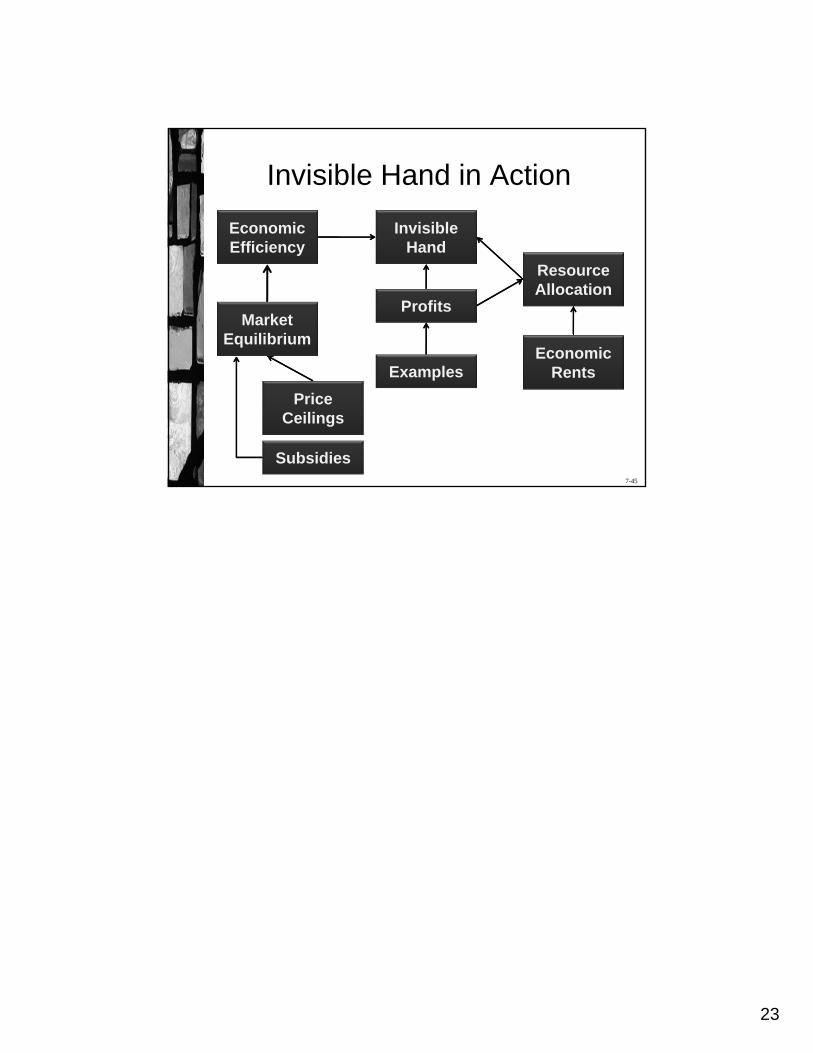
7-45
Invisible Hand in Action
Resource Allocation
Economic Rents
Invisible Hand
Profits
Examples
Economic Efficiency
Market Equilibrium
Price Ceilings
Subsidies