Embed Size (px)
Citation preview
Change the Conversation to Address Deferred Maintenance
Jim Kadamus – Vice PresidentSightlines
Cuba Plain – Assistant Vice President, Budget and PlanningUniversity of Missouri System
Walt Branson – Vice Chancellor for Finance and AdministrationMissouri University of Science and Technology
Bob Simmons – Associate Vice Chancellor for AdministrationUniversity of Missouri Kansas City
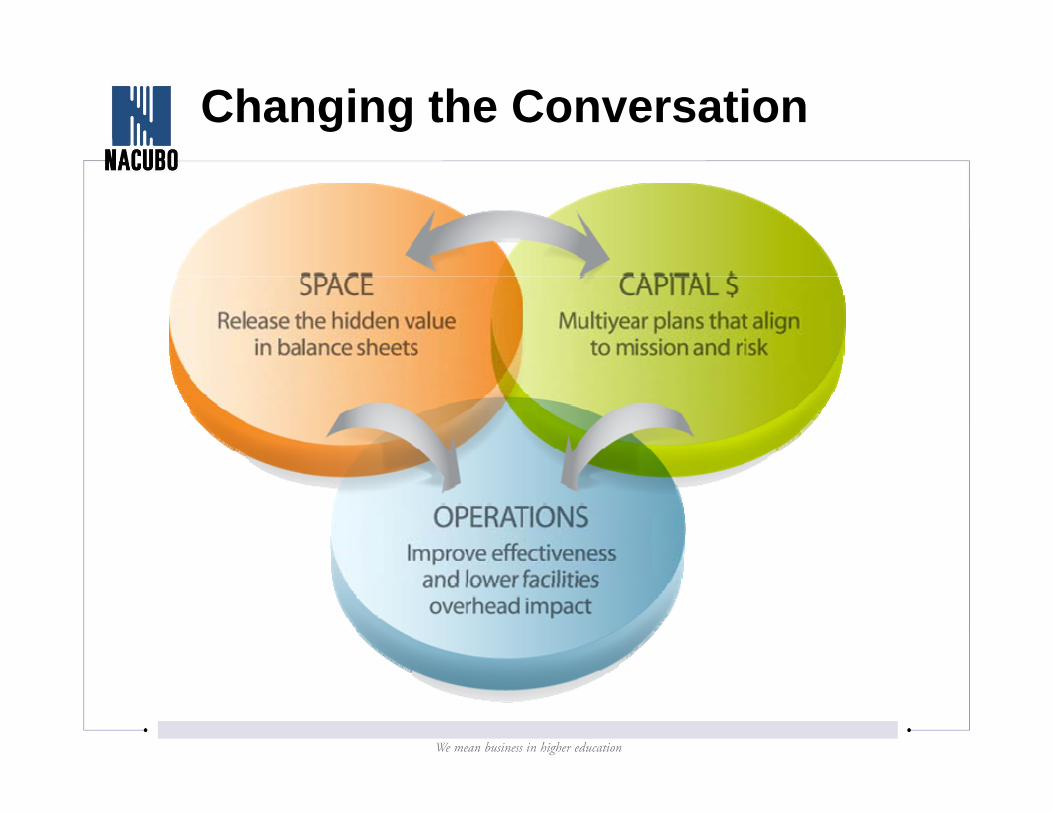
Changing the Conversation
Speaker:Jim Kadamus, Vice President
Company:Sightlines, LLC
Sightlines’ National and Regional Trends
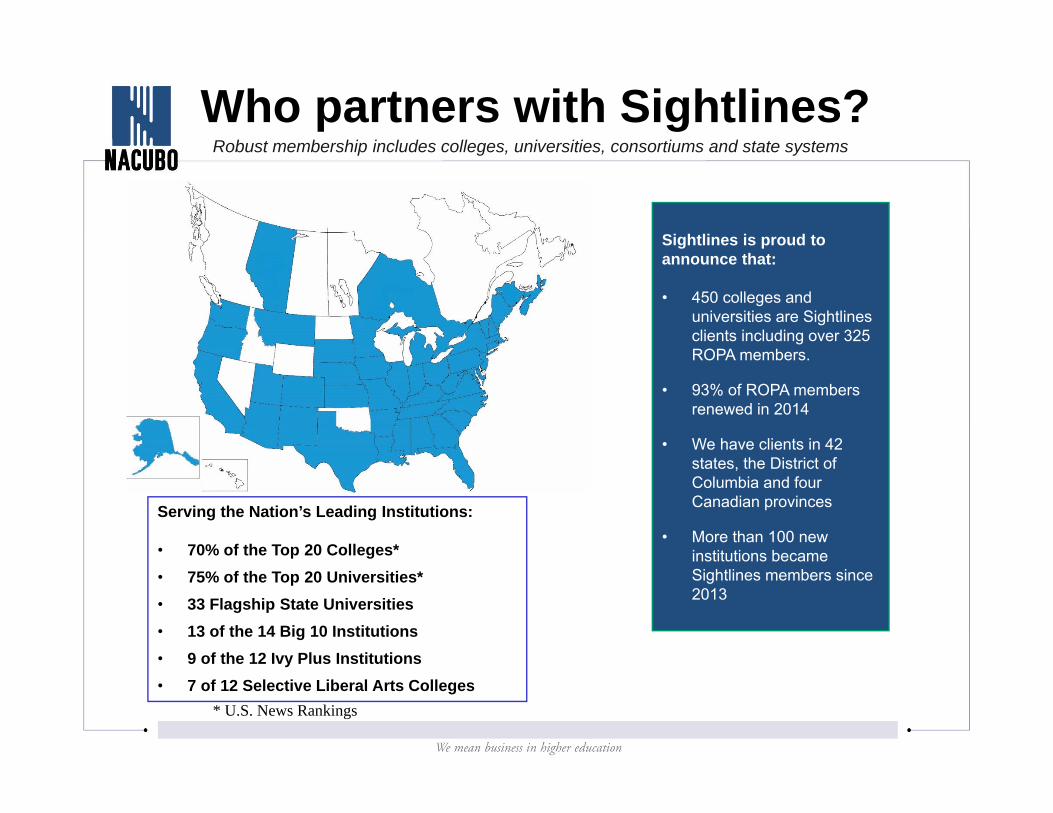
Robust membership includes colleges, universities, consortiums and state systems
* U.S. News Rankings
Serving the Nation’s Leading Institutions:
• 70% of the Top 20 Colleges*• 75% of the Top 20 Universities*• 33 Flagship State Universities• 13 of the 14 Big 10 Institutions• 9 of the 12 Ivy Plus Institutions• 7 of 12 Selective Liberal Arts Colleges
Sightlines is proud to announce that:
• 450 colleges and universities are Sightlines clients including over 325 ROPA members.
• 93% of ROPA members renewed in 2014
• We have clients in 42 states, the District of Columbia and four Canadian provinces
• More than 100 new institutions became Sightlines members since 2013
Who partners with Sightlines?
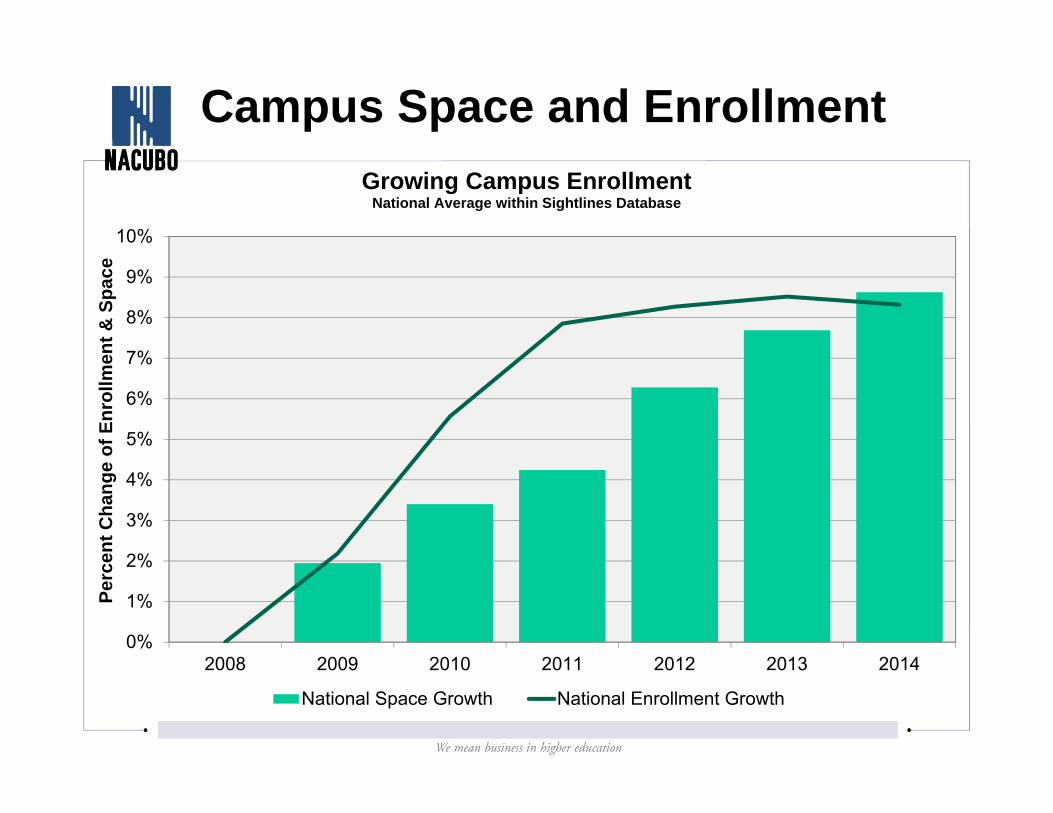
Campus Space and Enrollment
0%
1%
2%
3%
4%
5%
6%
7%
8%
9%
10%
2008 2009 2010 2011 2012 2013 2014
Perc
ent C
hang
e of
Enr
ollm
ent &
Spa
ce
Growing Campus EnrollmentNational Average within Sightlines Database
National Space Growth National Enrollment Growth
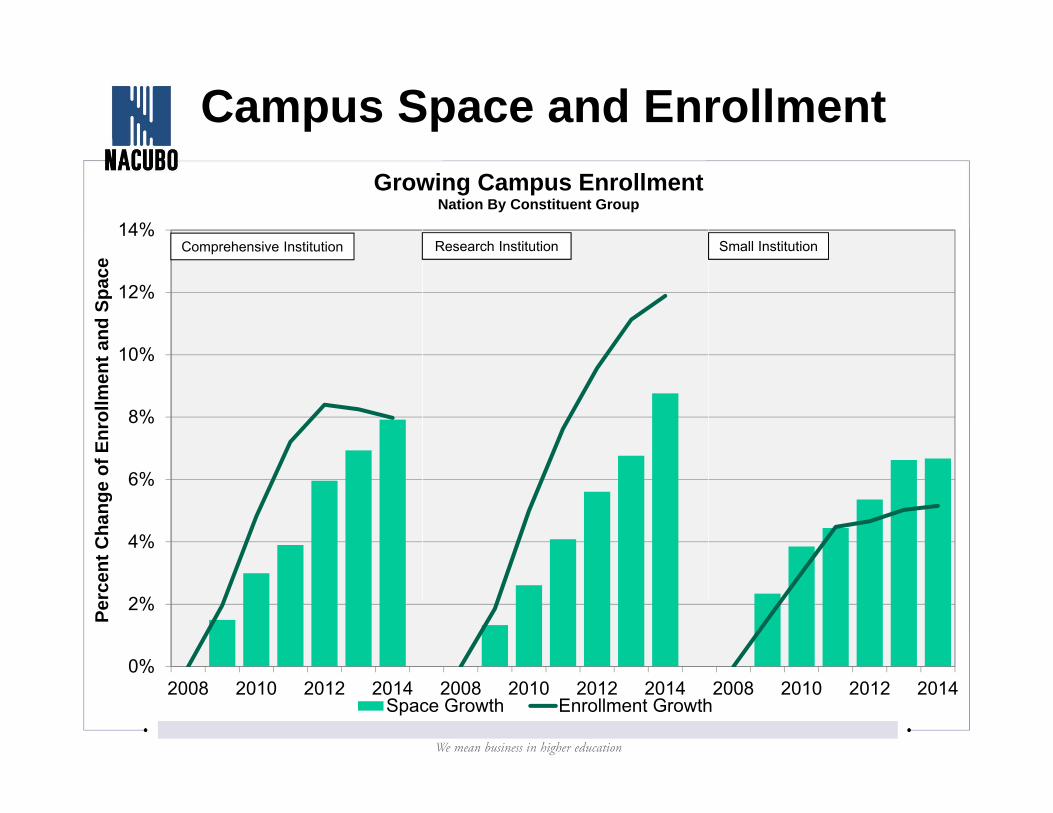
Campus Space and Enrollment
0%
2%
4%
6%
8%
10%
12%
14%
2008 2010 2012 2014 2008 2010 2012 2014 2008 2010 2012 2014
Perc
ent C
hang
e of
Enr
ollm
ent a
nd S
pace
Growing Campus EnrollmentNation By Constituent Group
Space Growth Enrollment Growth
Comprehensive Institution Research Institution Small Institution
0
0.1
0.2
0.3
0.4
0.5
0.6
0.7
0.8
0.9
1
0
10
20
30
40
50
60
1880
1885
1890
1895
1900
1905
1910
1915
1920
1925
1930
1935
1940
1945
1950
1955
1960
1965
1970
1975
1980
1985
1990
1995
2000
2005
2010
2015
Tota
l Dat
abas
e G
SF C
onst
ruct
ed (M
illio
ns)
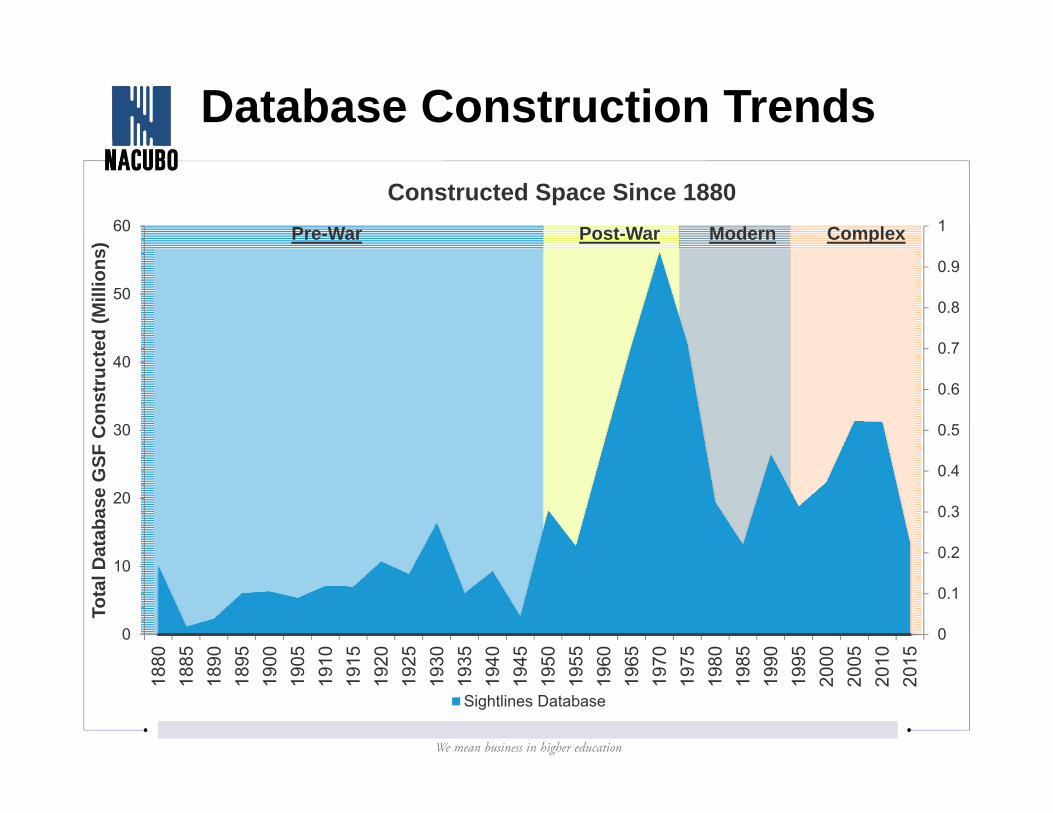
Constructed Space Since 1880
Sightlines Database
Database Construction Trends
Pre-War Post-War Modern Complex
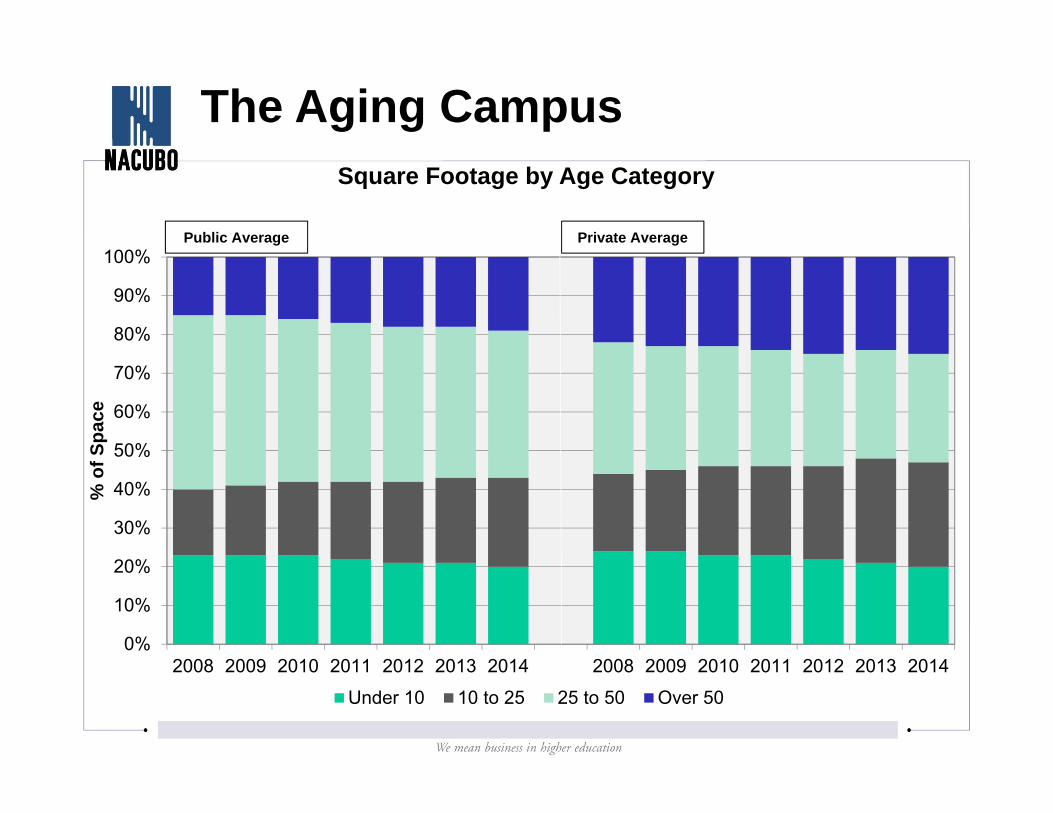
The Aging Campus
0%
10%
20%
30%
40%
50%
60%
70%
80%
90%
100%
2008 2009 2010 2011 2012 2013 2014 2008 2009 2010 2011 2012 2013 2014
% o
f Spa
ce
Square Footage by Age Category
Under 10 10 to 25 25 to 50 Over 50
Public Average Private Average
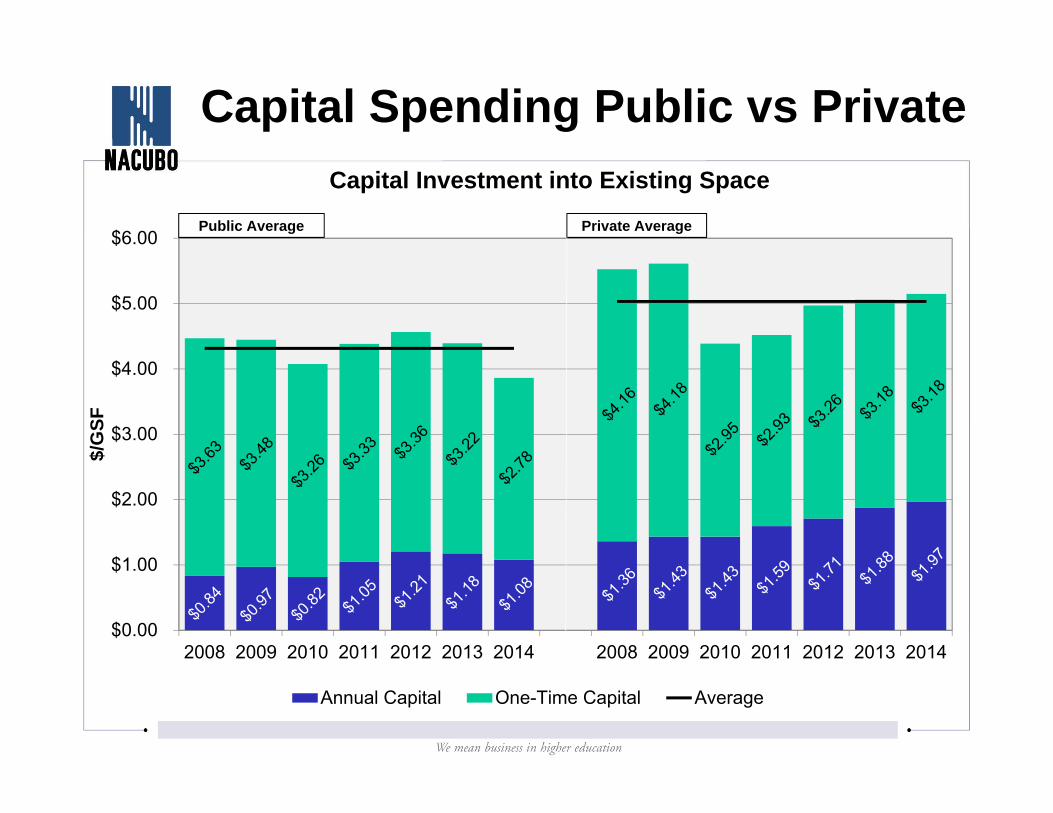
$0.00
$1.00
$2.00
$3.00
$4.00
$5.00
$6.00
2008 2009 2010 2011 2012 2013 2014 2008 2009 2010 2011 2012 2013 2014
$/G
SF
Capital Investment into Existing Space
Annual Capital One-Time Capital Average
Capital Spending Public vs Private
Public Average Private Average
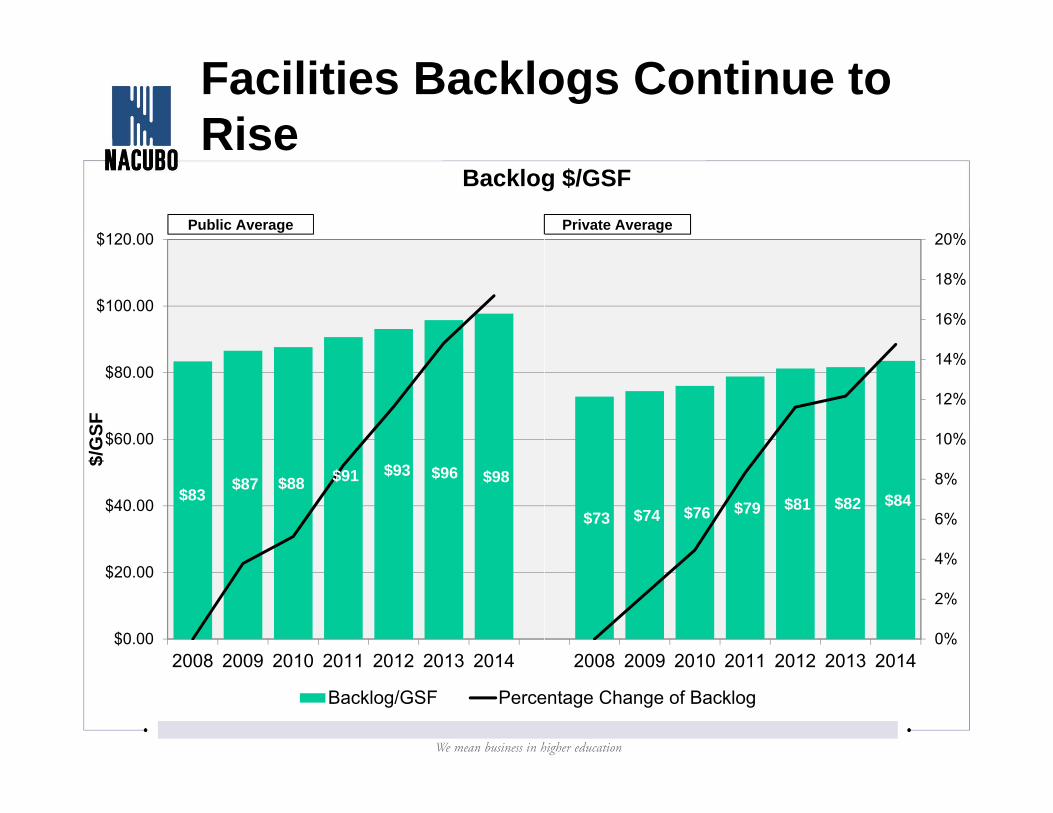
Facilities Backlogs Continue to Rise
$83 $87 $88 $91 $93 $96 $98
$73 $74 $76 $79 $81 $82 $84
0%
2%
4%
6%
8%
10%
12%
14%
16%
18%
20%
$0.00
$20.00
$40.00
$60.00
$80.00
$100.00
$120.00
2008 2009 2010 2011 2012 2013 2014 2008 2009 2010 2011 2012 2013 2014
$/G
SF
Backlog $/GSF
Backlog/GSF Percentage Change of Backlog
Public Average Private Average
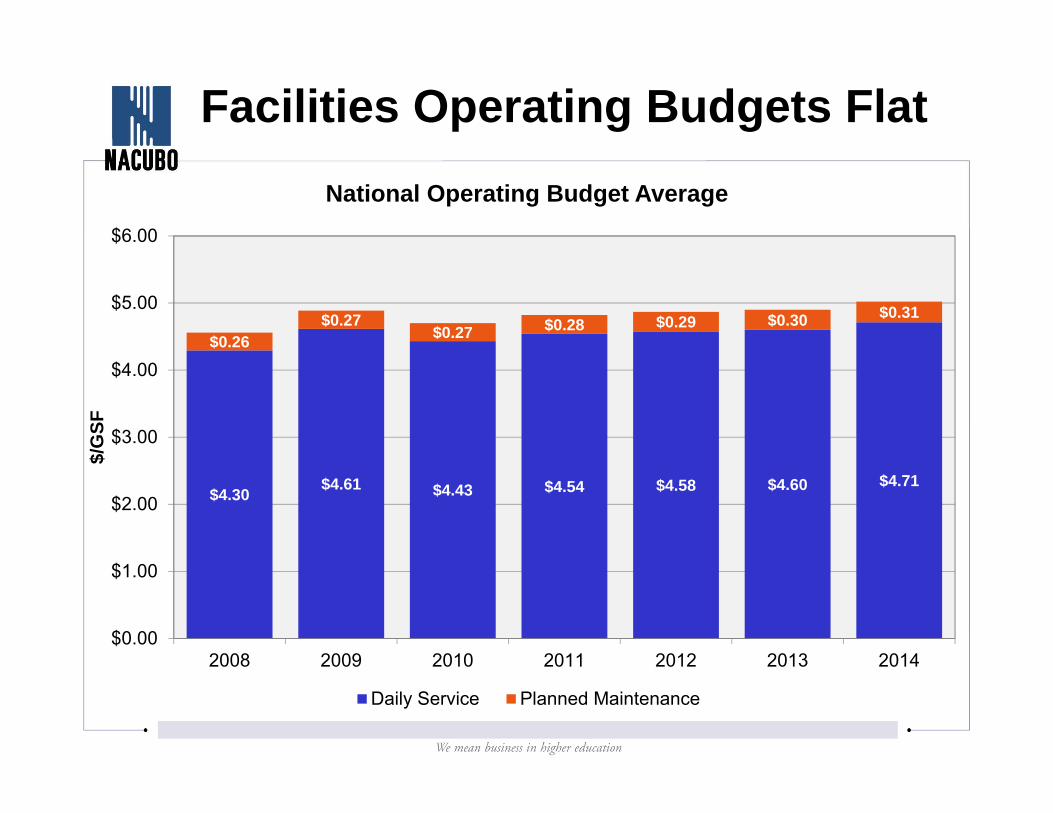
Facilities Operating Budgets Flat
$4.30 $4.61 $4.43 $4.54 $4.58 $4.60 $4.71
$0.26$0.27
$0.27 $0.28 $0.29 $0.30 $0.31
$0.00
$1.00
$2.00
$3.00
$4.00
$5.00
$6.00
2008 2009 2010 2011 2012 2013 2014
$/G
SF
National Operating Budget Average
Daily Service Planned Maintenance
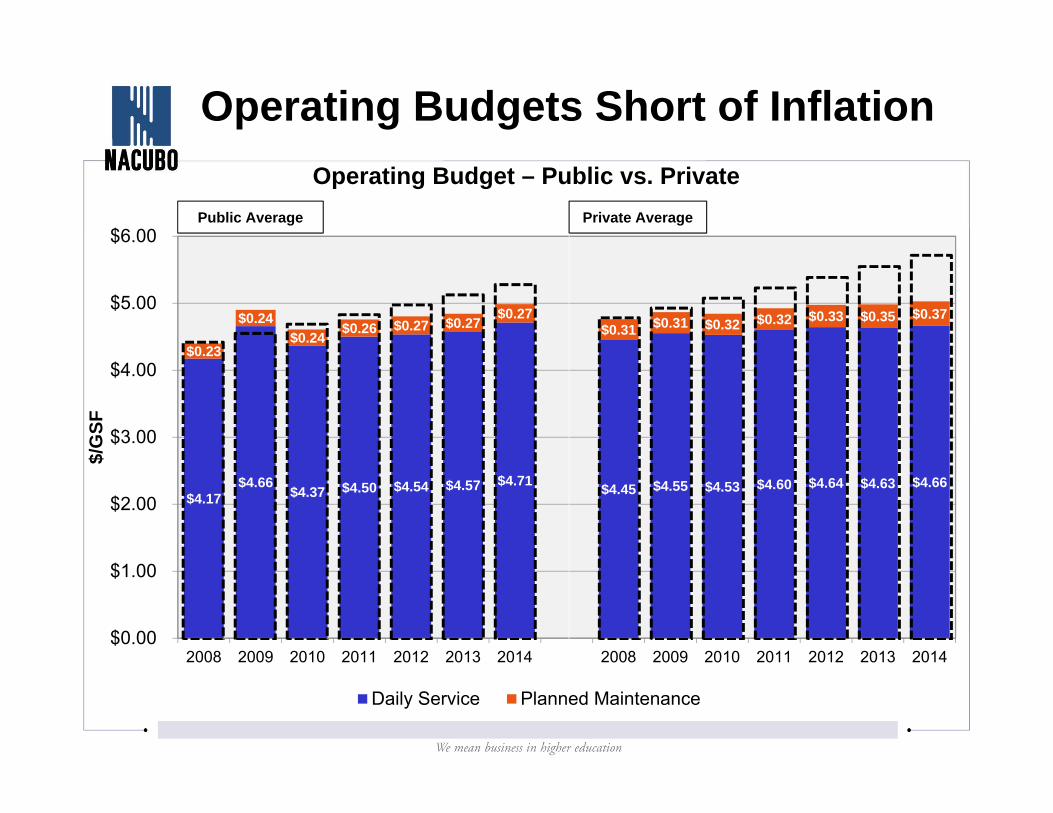
$4.17$4.66
$4.37 $4.50 $4.54 $4.57 $4.71 $4.45 $4.55 $4.53 $4.60 $4.64 $4.63 $4.66
$0.23
$0.24$0.24 $0.26 $0.27 $0.27 $0.27
$0.31 $0.31 $0.32 $0.32 $0.33 $0.35 $0.37
$0.00
$1.00
$2.00
$3.00
$4.00
$5.00
$6.00
2008 2009 2010 2011 2012 2013 2014 2008 2009 2010 2011 2012 2013 2014
$/G
SF
Operating Budget – Public vs. Private
Daily Service Planned Maintenance
Operating Budgets Short of Inflation
Public Average Private Average
The Predictions Have Not Become Reality –Why???
What Happened to Manage the Past Risks?
1. Maintenance organizations have, by default, taken an effective approach to manage the most critical repair risks for campus. Often lower cost repairs to systems rather than full system replacements have bought extra service time.
2. Because campuses are a collection of buildings – the risk is diversified over the portfolio.
3. Engineering lifecycle estimates are appropriately conservative and therefore systems tend to outperform their statistical target
4. The functional obsolescence of space drives investments that brings outside resources that fixes stuff!
How Do We Make the Case for Resources?
The old approach of defining needs in a way that makes the DM problem bigger and then requesting money will not work.
Problem is too big to address in total – must break it down in size and priority
How do we … Lower Demands - Space ManagementMake the Problem “Smaller” – Use Building Portfolio ManagementSustain Impact of Finite Funding - Create Multi Year PlansMitigate Risk - Target Capital to Safety, Reliability and Program IssuesIncrease Funding - Invest in Operations to release savings that self-funds stewardship
Speaker:Cuba PlainAssistant Vice President, Budget and Planning
University of Missouri System
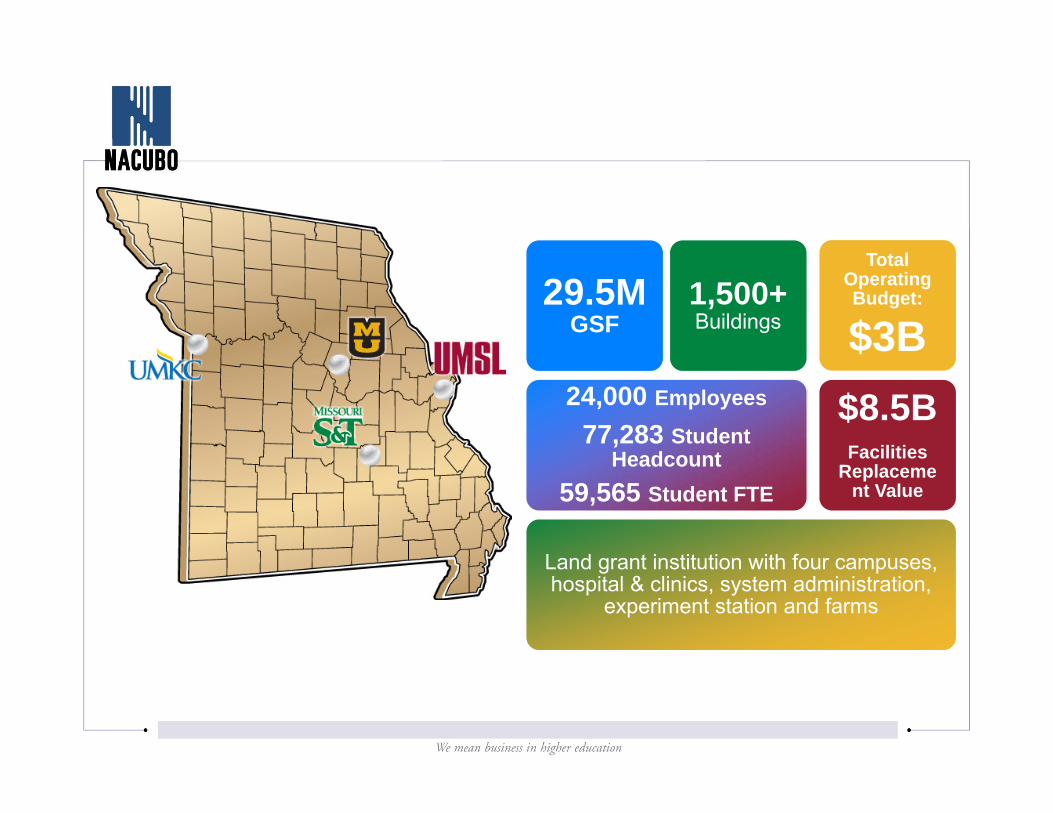
Land grant institution with four campuses, hospital & clinics, system administration,
experiment station and farms
24,000 Employees
77,283 Student Headcount
59,565 Student FTE
29.5MGSF
1,500+ Buildings
$8.5BFacilities
Replacement Value
Total Operating Budget:
$3B
System Profile
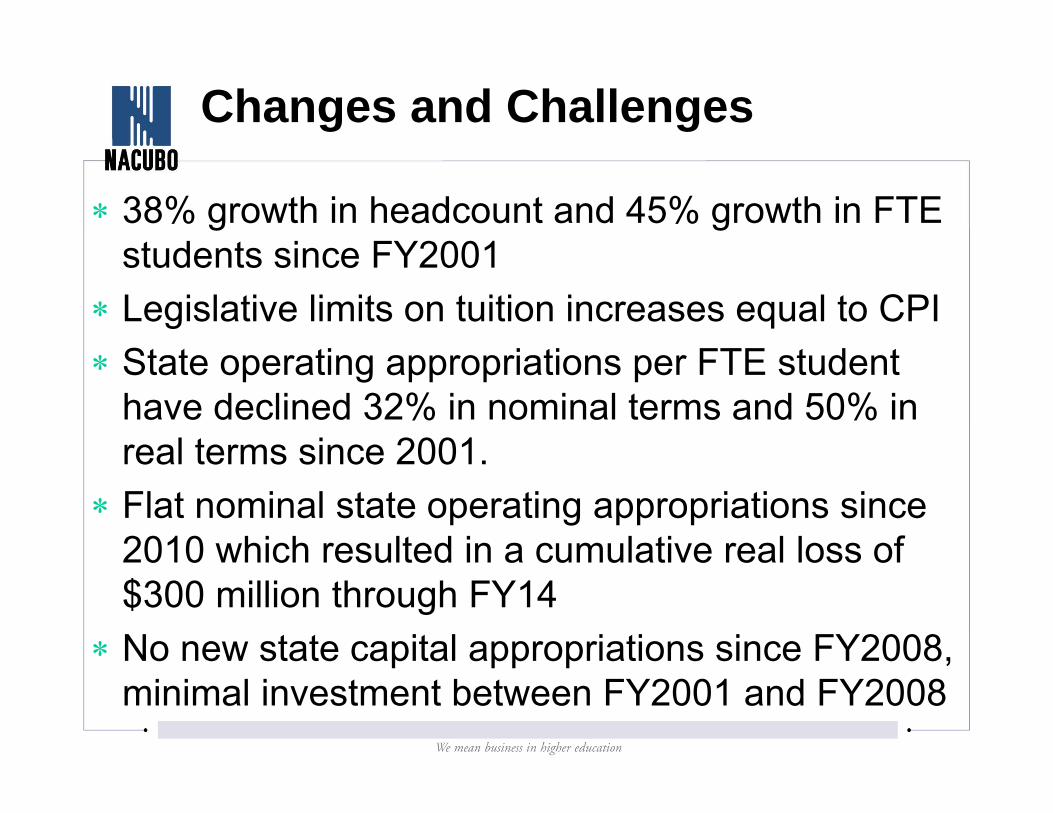
38% growth in headcount and 45% growth in FTE students since FY2001
Legislative limits on tuition increases equal to CPI State operating appropriations per FTE student
have declined 32% in nominal terms and 50% in real terms since 2001.
Flat nominal state operating appropriations since 2010 which resulted in a cumulative real loss of $300 million through FY14
No new state capital appropriations since FY2008, minimal investment between FY2001 and FY2008
Changes and Challenges
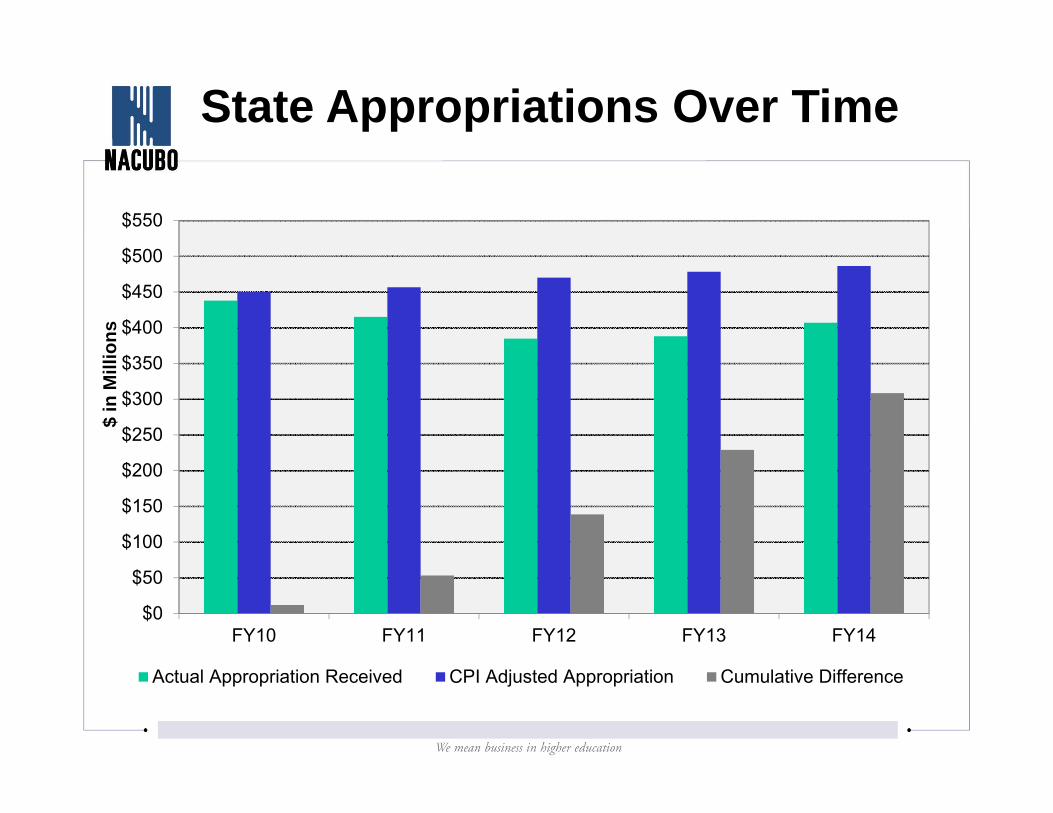
$0
$50
$100
$150
$200
$250
$300
$350
$400
$450
$500
$550
FY10 FY11 FY12 FY13 FY14
$ in
Mill
ions
Actual Appropriation Received CPI Adjusted Appropriation Cumulative Difference
State Appropriations Over Time
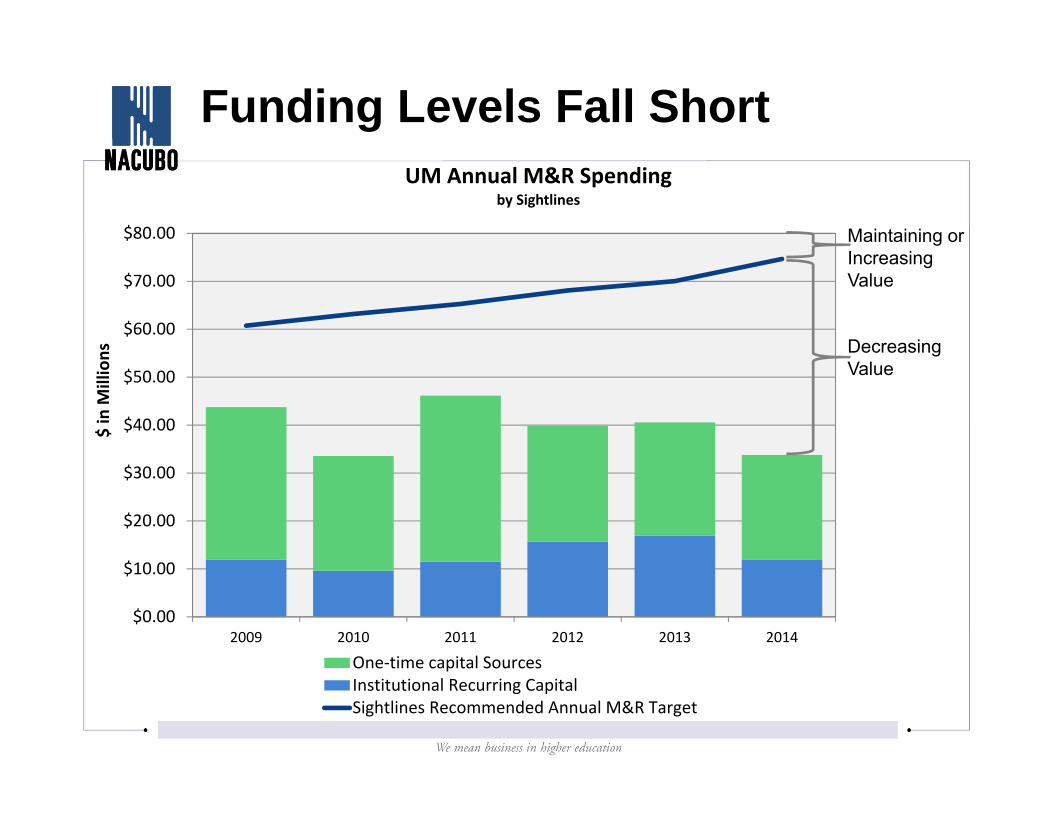
$0.00
$10.00
$20.00
$30.00
$40.00
$50.00
$60.00
$70.00
$80.00
2009 2010 2011 2012 2013 2014
$ in M
illions
UM Annual M&R Spendingby Sightlines
One‐time capital SourcesInstitutional Recurring CapitalSightlines Recommended Annual M&R Target
Maintaining or Increasing Value
Decreasing Value
Funding Levels Fall Short
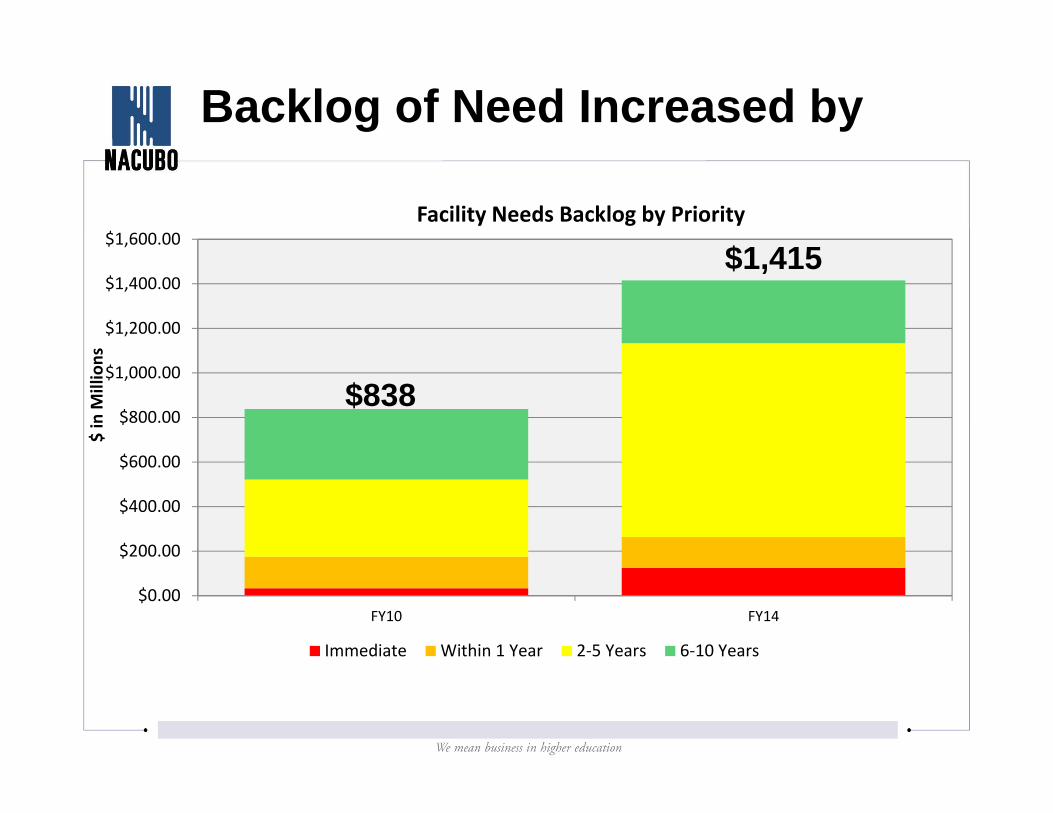
Backlog of Need Increased by 69%
$0.00
$200.00
$400.00
$600.00
$800.00
$1,000.00
$1,200.00
$1,400.00
$1,600.00
FY10 FY14
$ in M
illions
Facility Needs Backlog by Priority
Immediate Within 1 Year 2‐5 Years 6‐10 Years
$838
$1,415
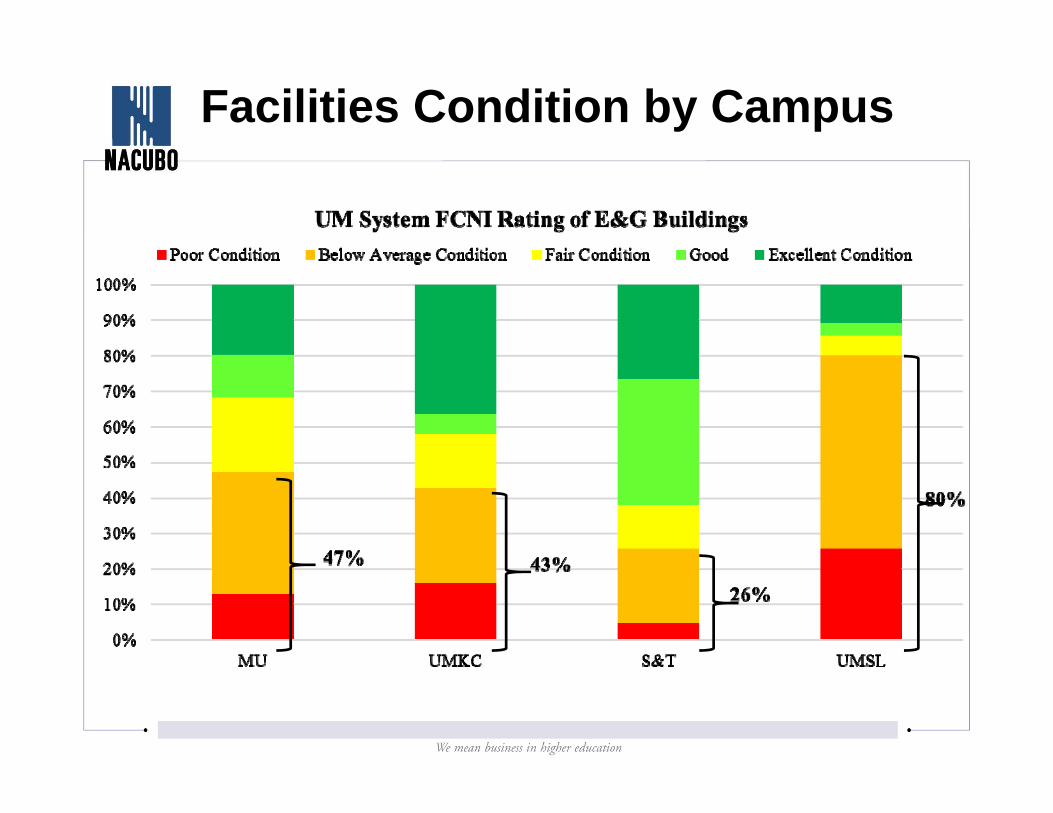
Facilities Condition by Campus
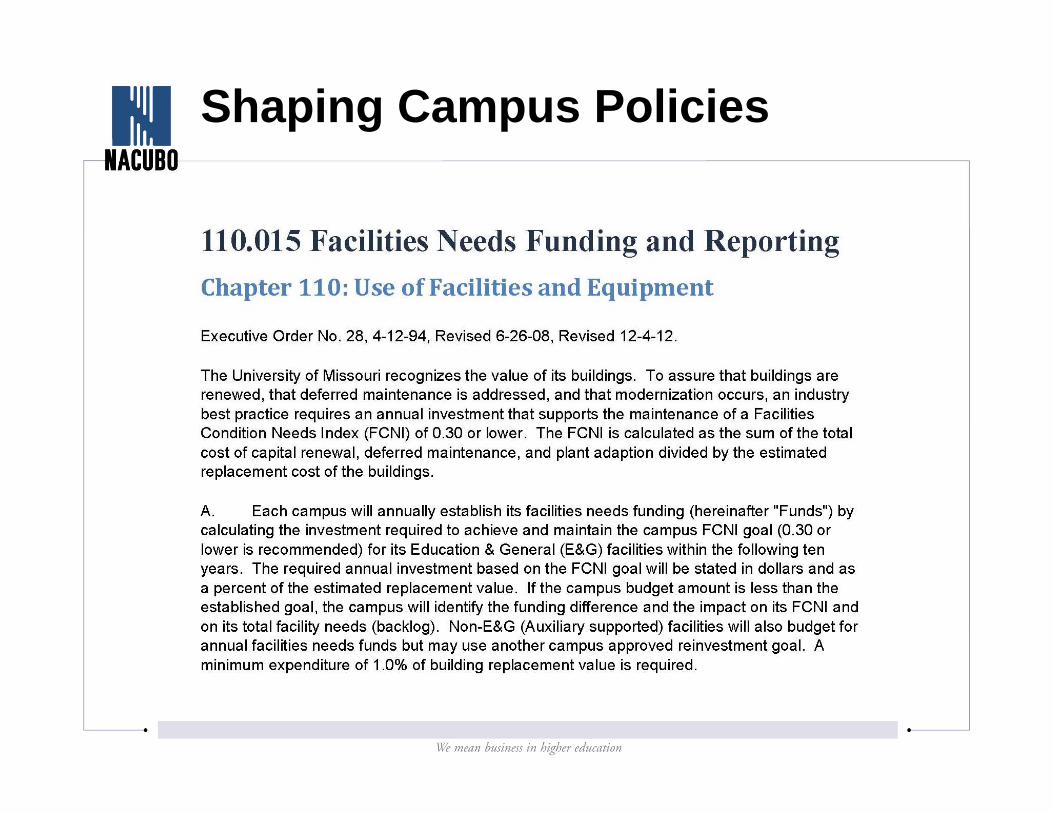
Shaping Campus Policies
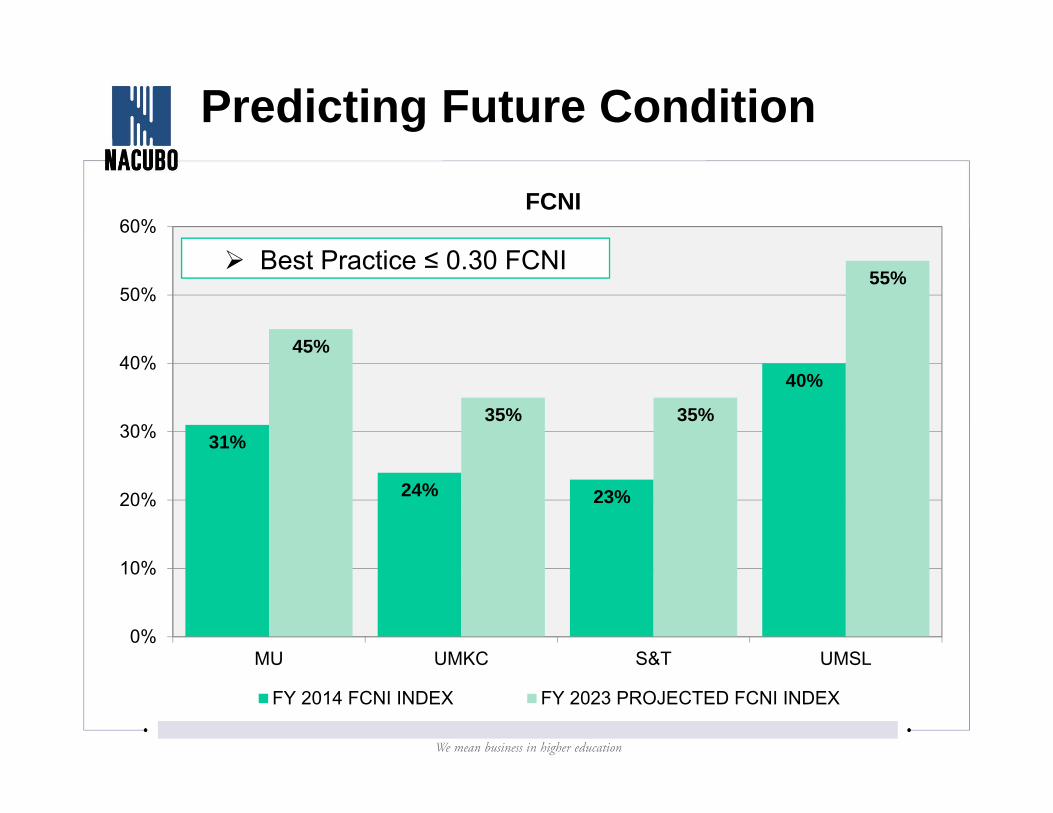
Predicting Future Condition
31%
24% 23%
40%
45%
35% 35%
55%
0%
10%
20%
30%
40%
50%
60%
MU UMKC S&T UMSL
FCNI
FY 2014 FCNI INDEX FY 2023 PROJECTED FCNI INDEX
Best Practice ≤ 0.30 FCNI
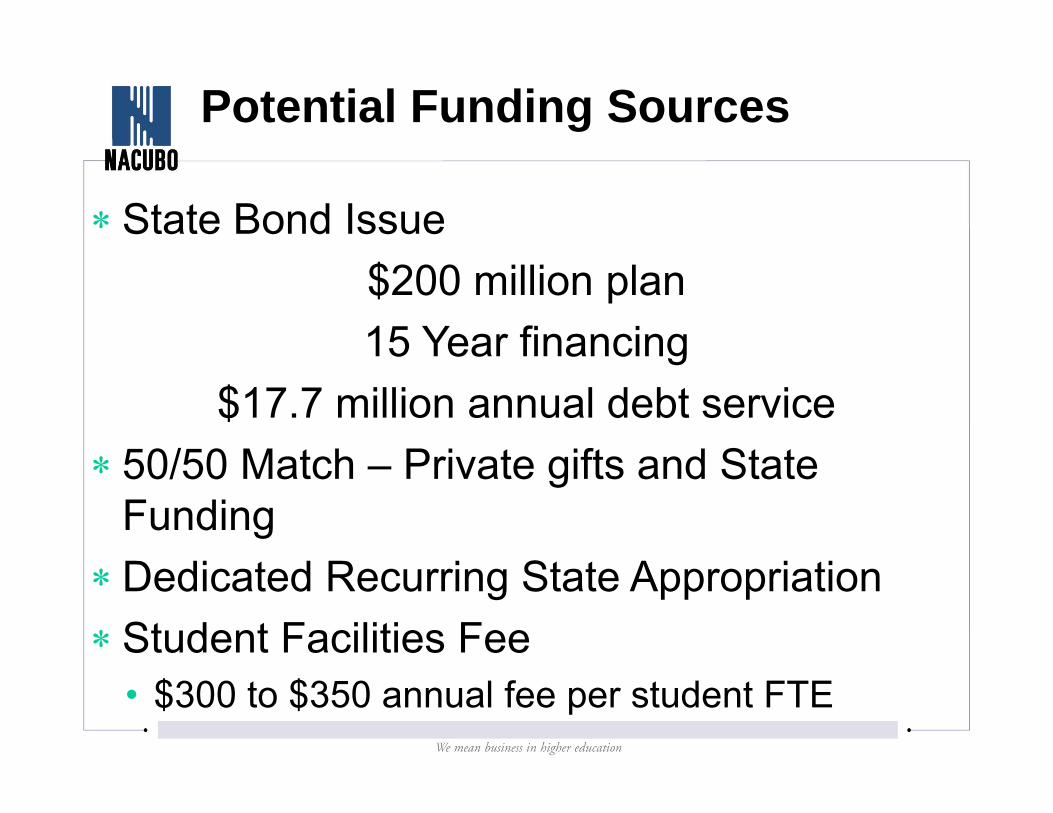
Potential Funding Sources
State Bond Issue$200 million plan15 Year financing
$17.7 million annual debt service 50/50 Match – Private gifts and State
FundingDedicated Recurring State AppropriationStudent Facilities Fee
• $300 to $350 annual fee per student FTE
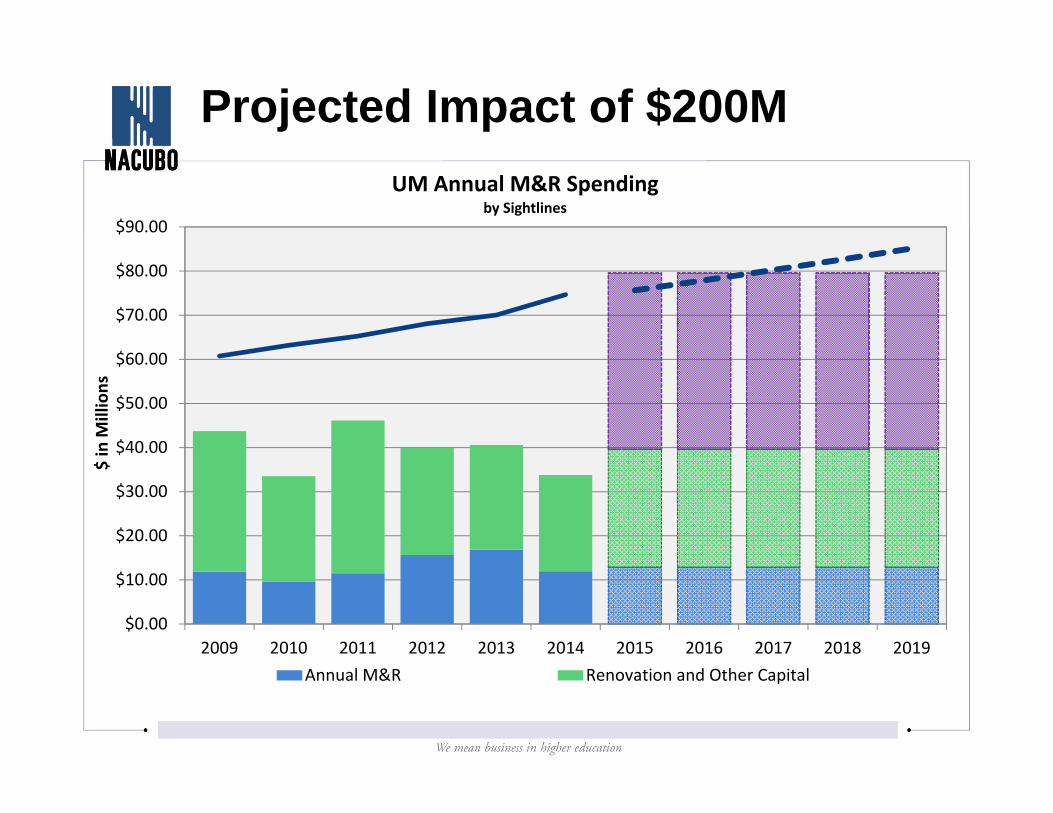
$0.00
$10.00
$20.00
$30.00
$40.00
$50.00
$60.00
$70.00
$80.00
$90.00
2009 2010 2011 2012 2013 2014 2015 2016 2017 2018 2019
$ in M
illions
UM Annual M&R Spendingby Sightlines
Annual M&R Renovation and Other Capital
Projected Impact of $200M
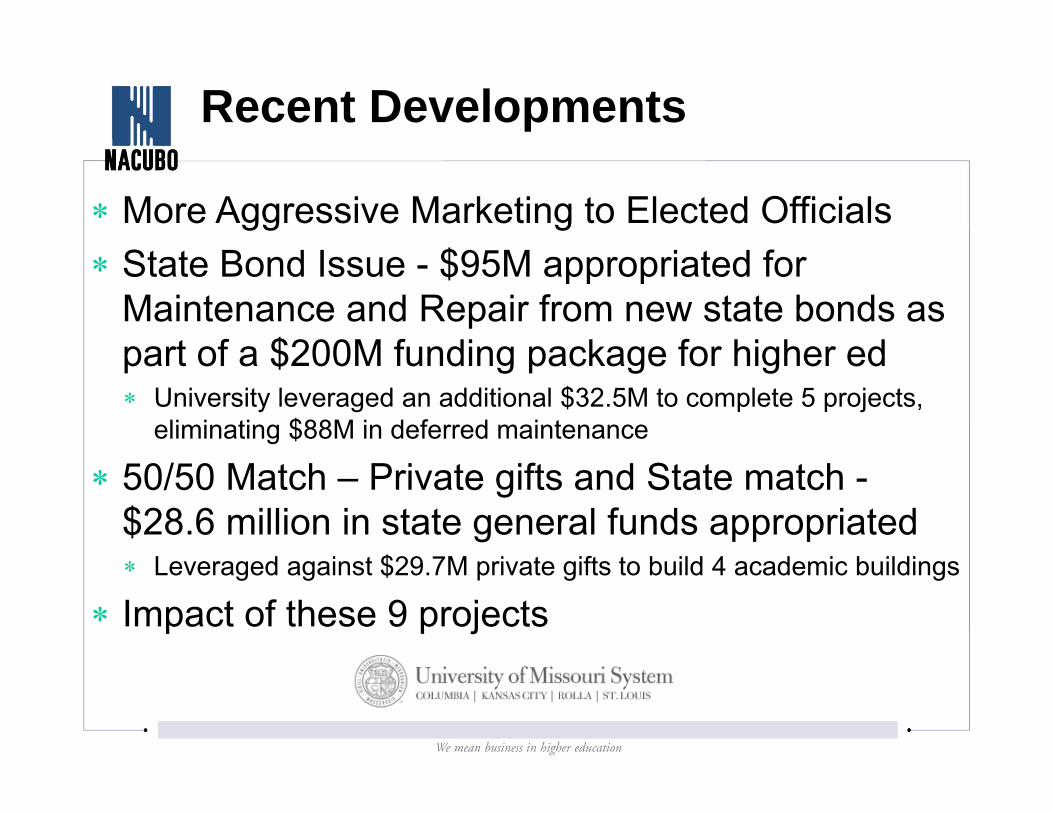
Recent Developments
More Aggressive Marketing to Elected Officials State Bond Issue - $95M appropriated for
Maintenance and Repair from new state bonds as part of a $200M funding package for higher ed University leveraged an additional $32.5M to complete 5 projects,
eliminating $88M in deferred maintenance
50/50 Match – Private gifts and State match -$28.6 million in state general funds appropriated Leveraged against $29.7M private gifts to build 4 academic buildings
Impact of these 9 projects
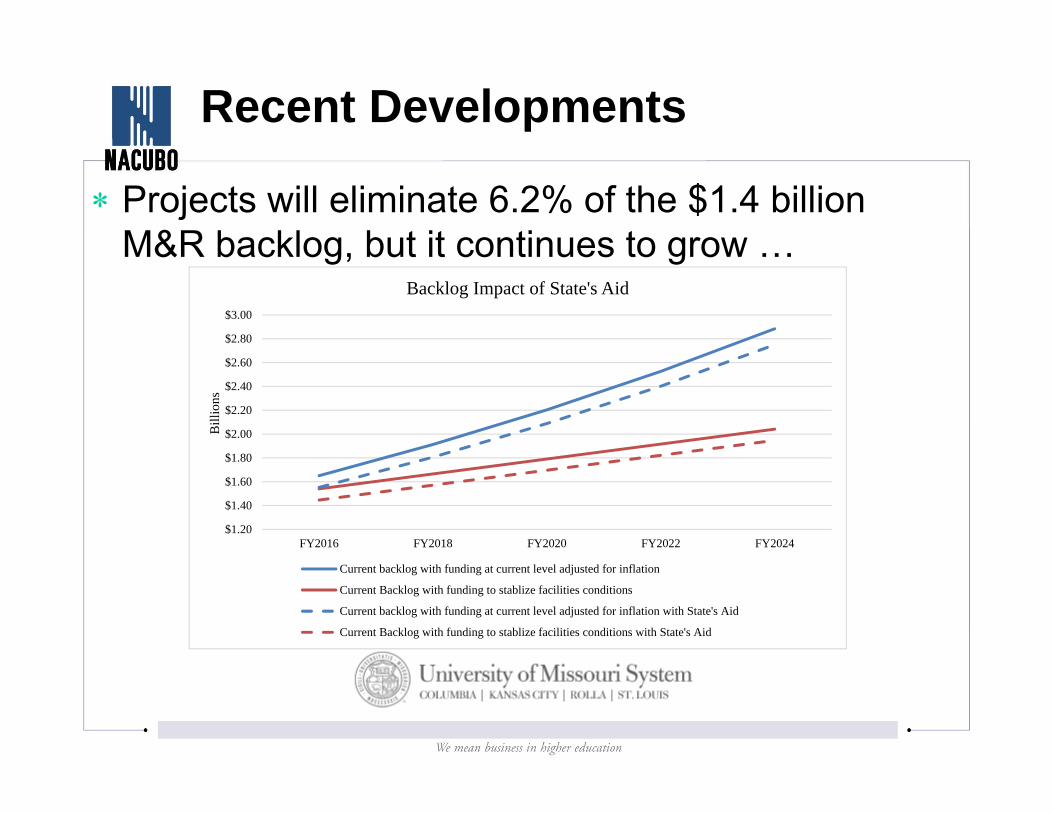
Recent Developments
Projects will eliminate 6.2% of the $1.4 billion M&R backlog, but it continues to grow …
$1.20
$1.40
$1.60
$1.80
$2.00
$2.20
$2.40
$2.60
$2.80
$3.00
FY2016 FY2018 FY2020 FY2022 FY2024
Bill
ions
Backlog Impact of State's Aid
Current backlog with funding at current level adjusted for inflation
Current Backlog with funding to stablize facilities conditions
Current backlog with funding at current level adjusted for inflation with State's Aid
Current Backlog with funding to stablize facilities conditions with State's Aid
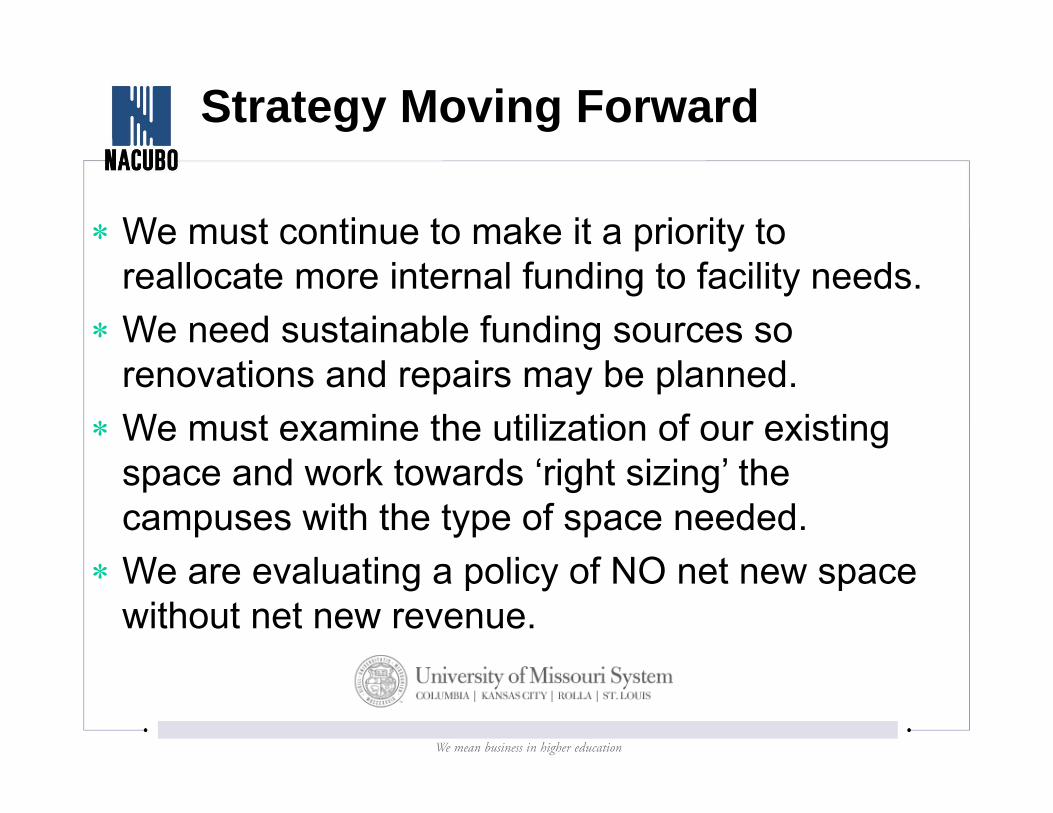
Strategy Moving Forward
We must continue to make it a priority to reallocate more internal funding to facility needs.
We need sustainable funding sources so renovations and repairs may be planned.
We must examine the utilization of our existing space and work towards ‘right sizing’ the campuses with the type of space needed.
We are evaluating a policy of NO net new space without net new revenue.
Speaker:Walter BransonVice Chancellor for Finance and Administration
Missouri University of Science & Technology
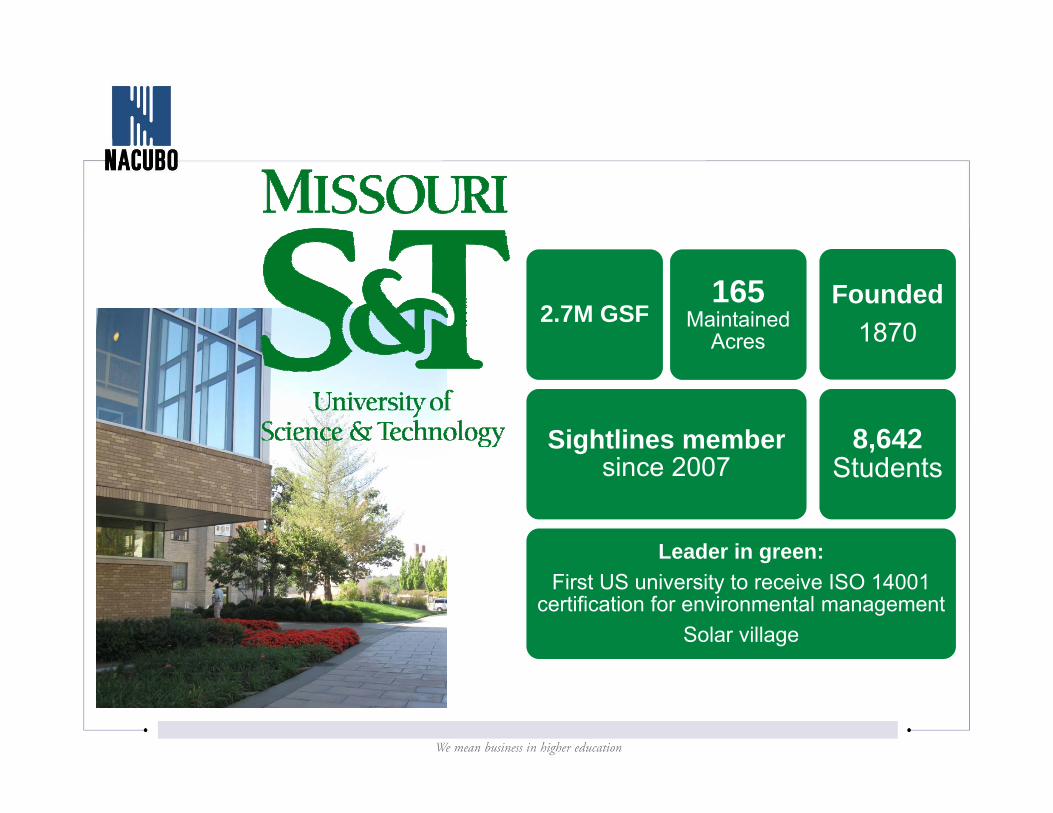
Leader in green:First US university to receive ISO 14001
certification for environmental managementSolar village
Sightlines member since 2007
2.7M GSF165
Maintained Acres
8,642 Students
Founded 1870
Campus Profile
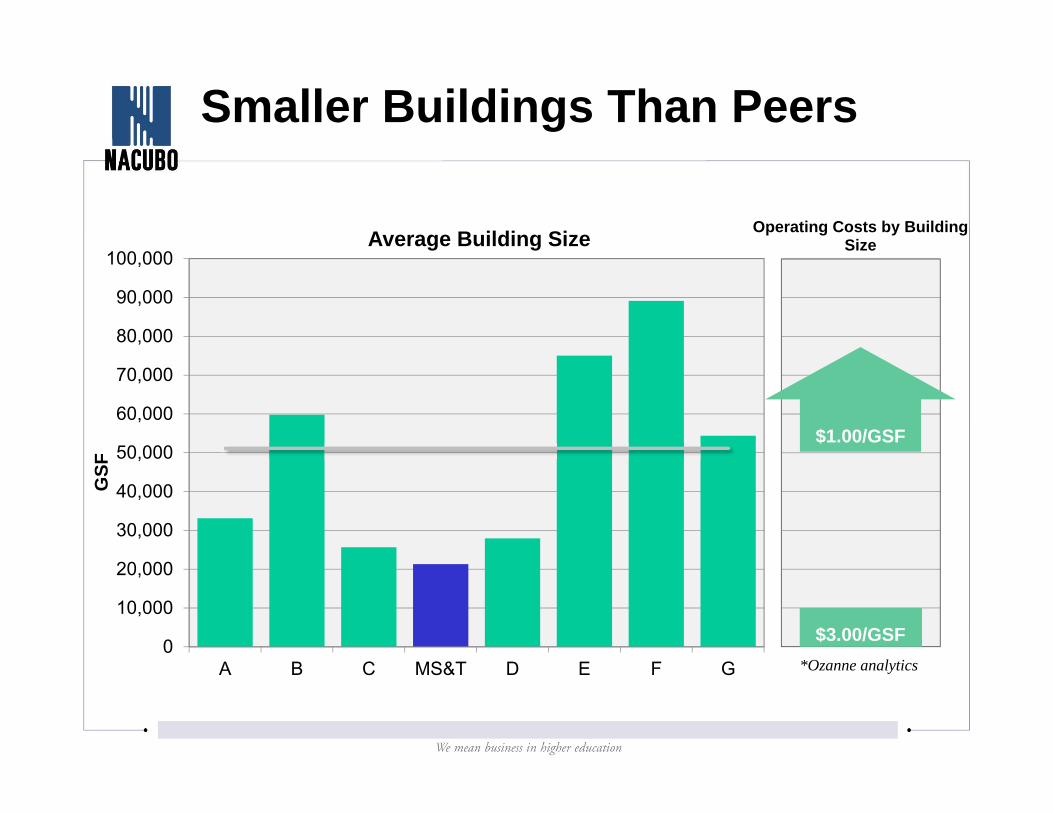
Operating Costs by Building Size
0
10,000
20,000
30,000
40,000
50,000
60,000
70,000
80,000
90,000
100,000
A B C MS&T D E F G
GSF
Average Building Size
*Ozanne analytics
$3.00/GSF
$1.00/GSF
Smaller Buildings Than Peers
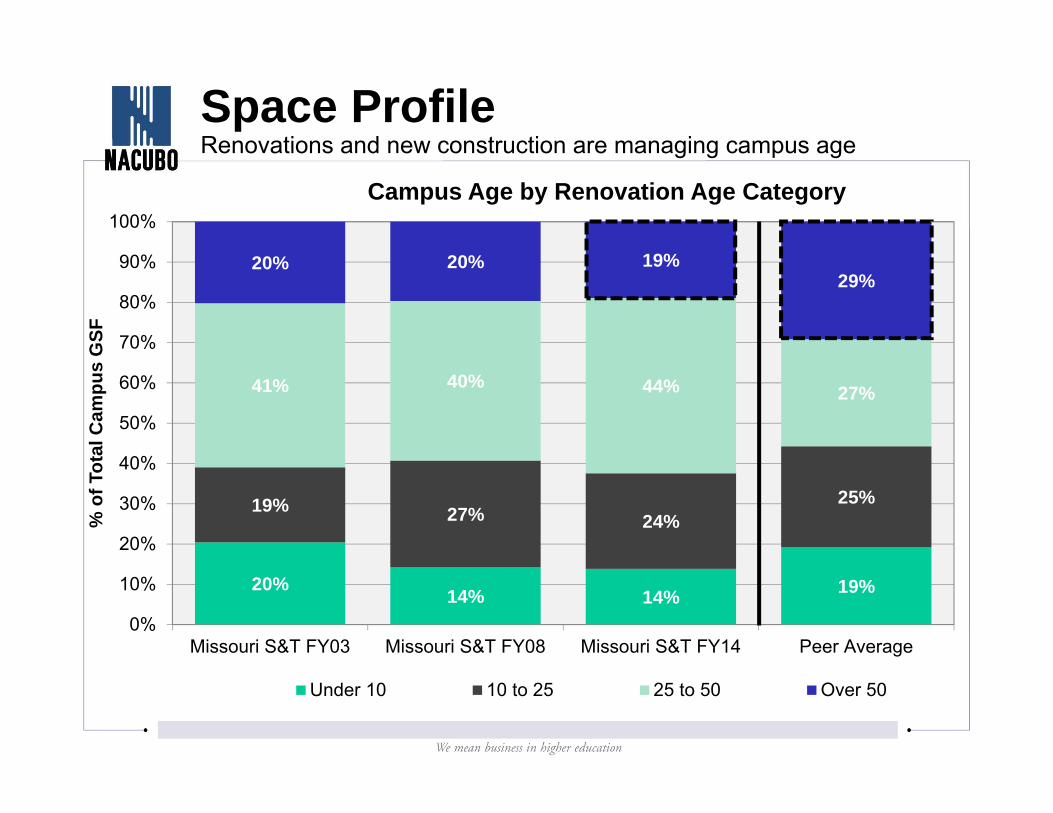
20% 14% 14% 19%
19% 27% 24%25%
41% 40% 44% 27%
20% 20% 19%29%
0%
10%
20%
30%
40%
50%
60%
70%
80%
90%
100%
Missouri S&T FY03 Missouri S&T FY08 Missouri S&T FY14 Peer Average
% o
f Tot
al C
ampu
s G
SF
Campus Age by Renovation Age Category
Under 10 10 to 25 25 to 50 Over 50
Space ProfileRenovations and new construction are managing campus age
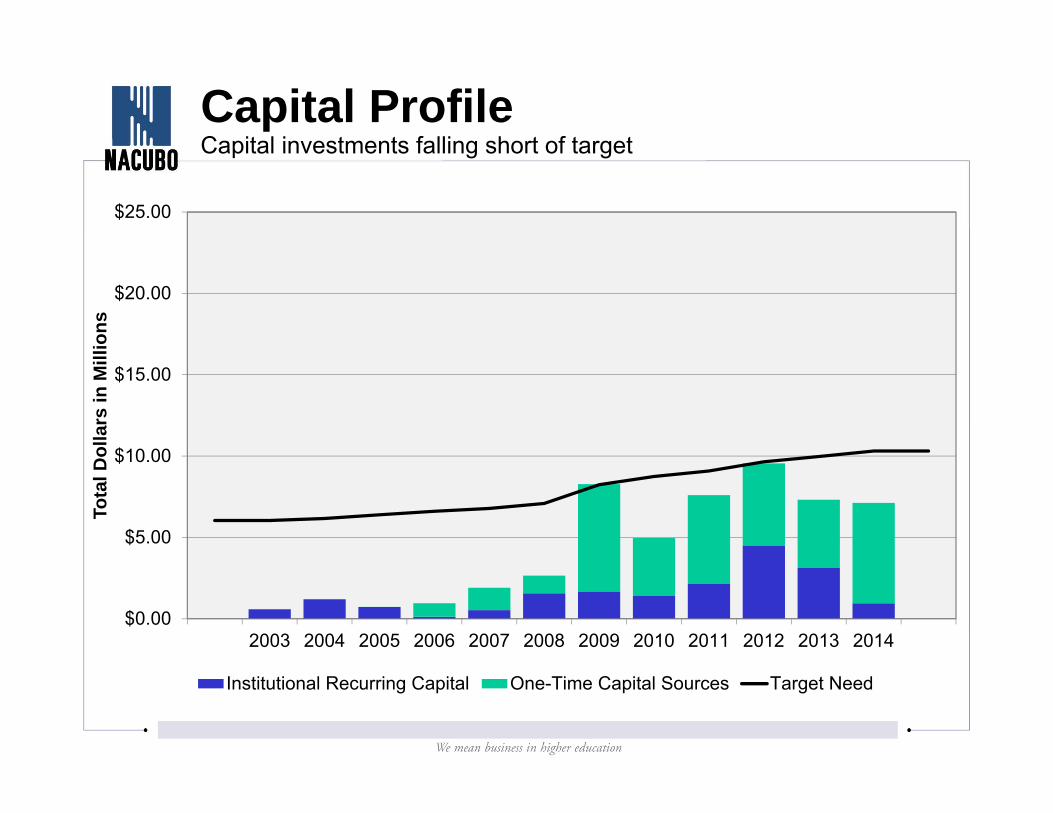
Capital Profile
$0.00
$5.00
$10.00
$15.00
$20.00
$25.00
2003 2004 2005 2006 2007 2008 2009 2010 2011 2012 2013 2014
Tota
l Dol
lars
in M
illio
ns
Institutional Recurring Capital One-Time Capital Sources Target Need
Capital investments falling short of target
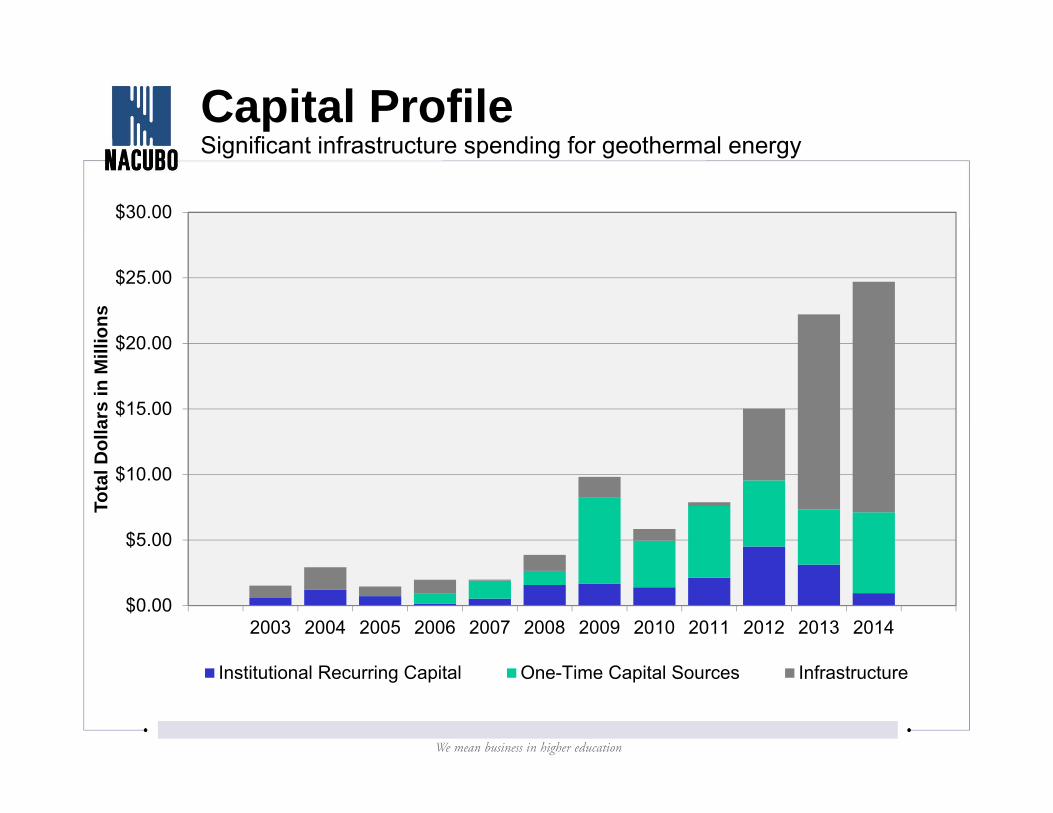
$0.00
$5.00
$10.00
$15.00
$20.00
$25.00
$30.00
2003 2004 2005 2006 2007 2008 2009 2010 2011 2012 2013 2014
Tota
l Dol
lars
in M
illio
ns
Institutional Recurring Capital One-Time Capital Sources Infrastructure
Capital ProfileSignificant infrastructure spending for geothermal energy
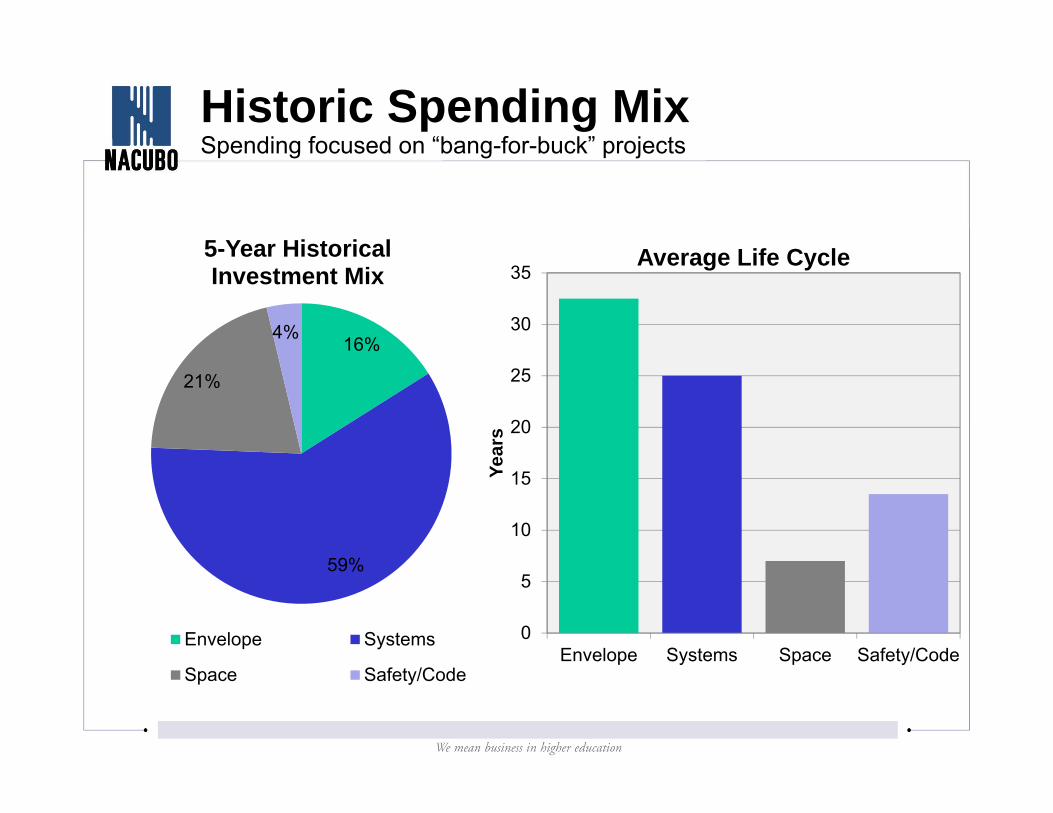
16%
59%
21%
4%
5-Year Historical Investment Mix
Envelope Systems
Space Safety/Code
0
5
10
15
20
25
30
35
Envelope Systems Space Safety/Code
Year
s
Average Life Cycle
Spending focused on “bang-for-buck” projectsHistoric Spending Mix
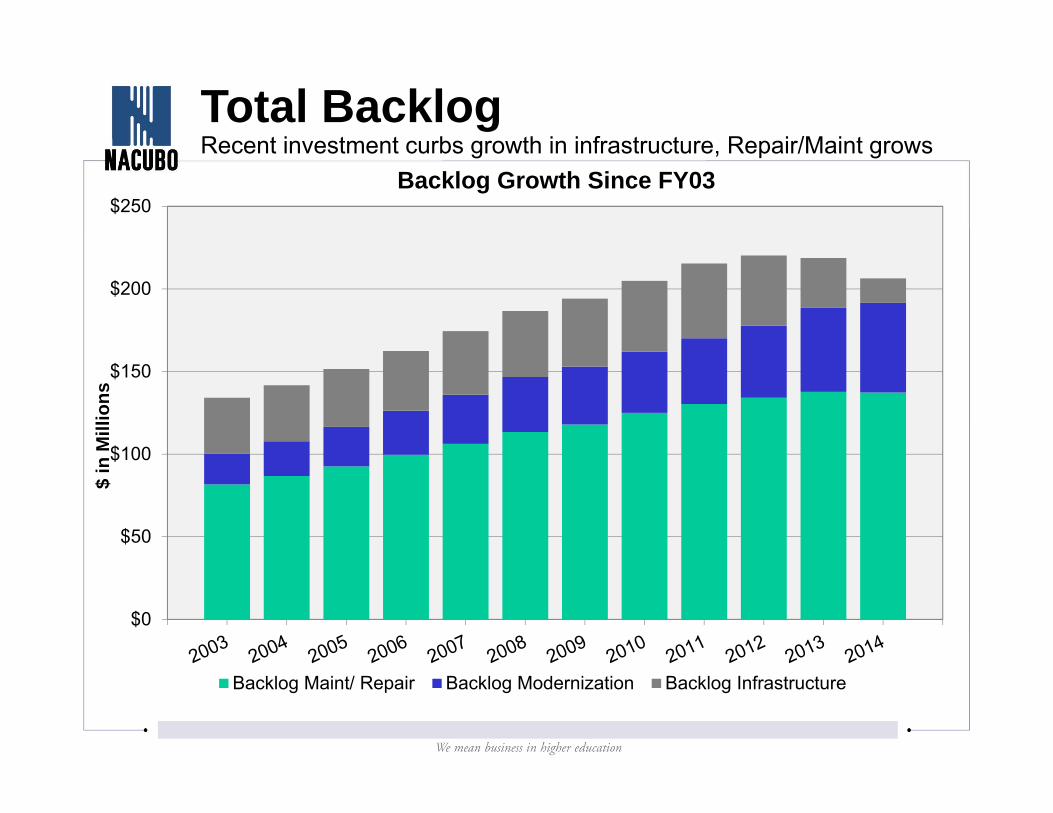
$0
$50
$100
$150
$200
$250
$ in
Mill
ions
Backlog Growth Since FY03
Backlog Maint/ Repair Backlog Modernization Backlog Infrastructure
Recent investment curbs growth in infrastructure, Repair/Maint growsTotal Backlog
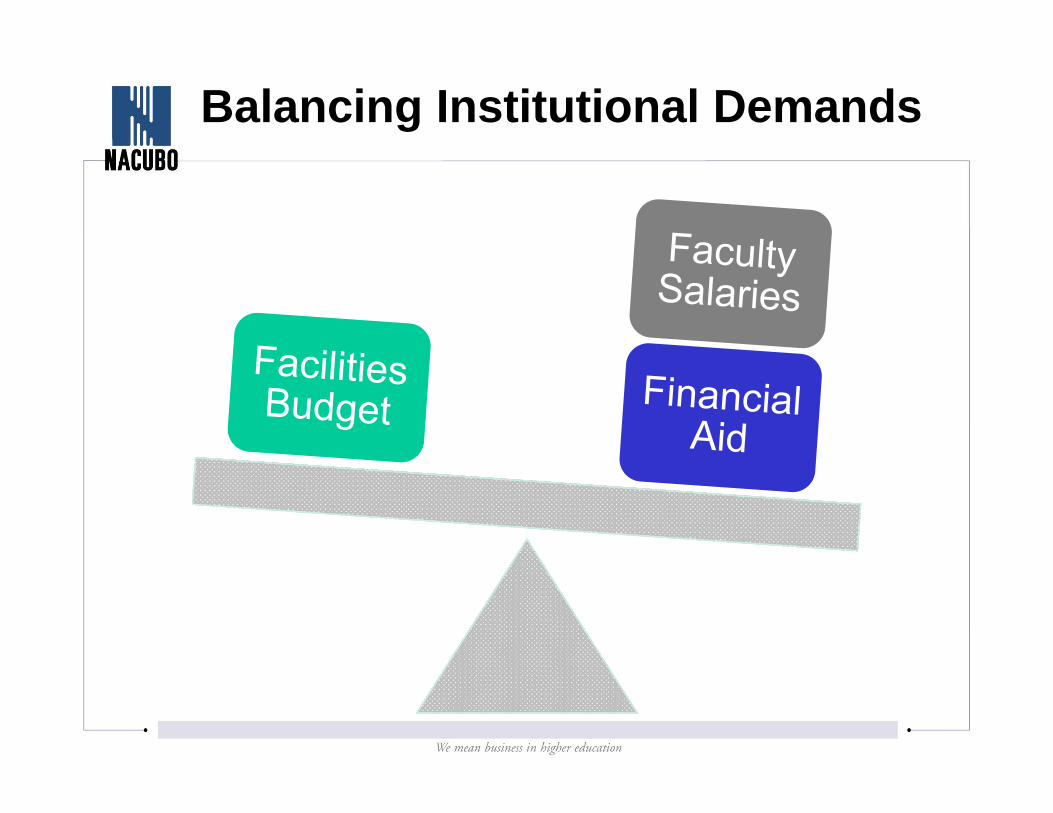
Balancing Institutional Demands
Speaker:Bob SimmonsAssociate Vice Chancellor, Administration
University of Missouri –Kansas City
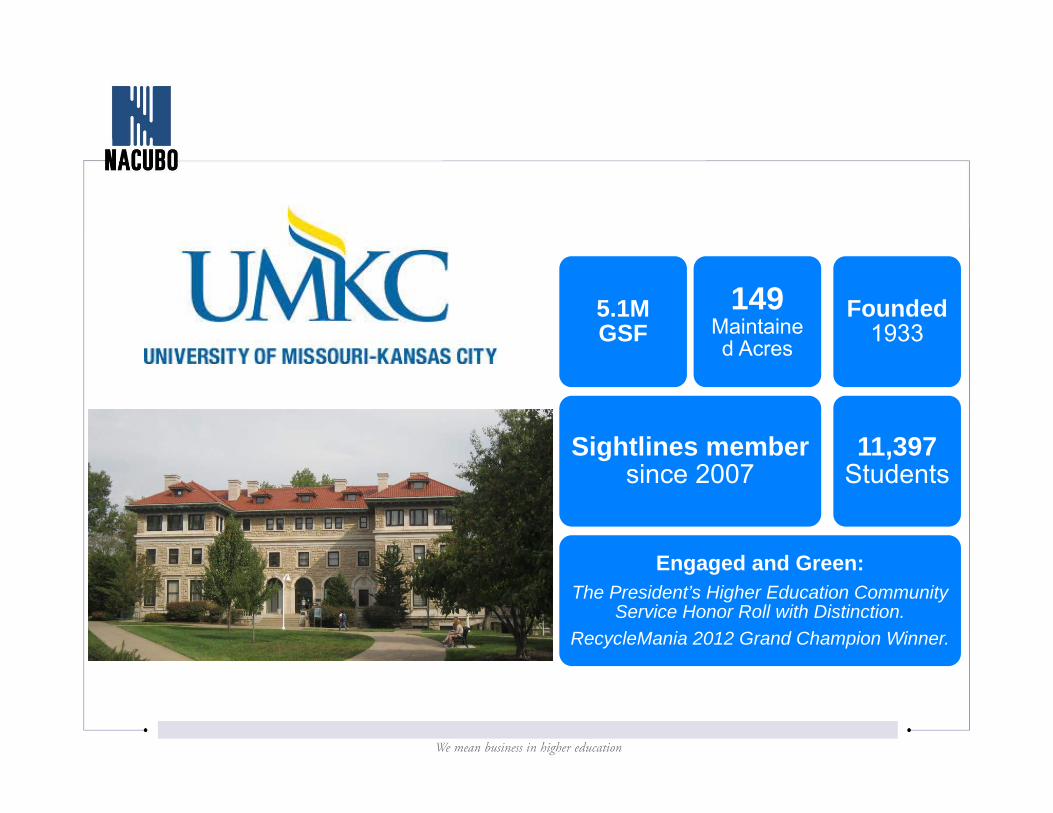
Engaged and Green:The President’s Higher Education Community
Service Honor Roll with Distinction. RecycleMania 2012 Grand Champion Winner.
Sightlines member since 2007
5.1M GSF
149 Maintained Acres
11,397 Students
Founded 1933
University of Missouri – Kansas City
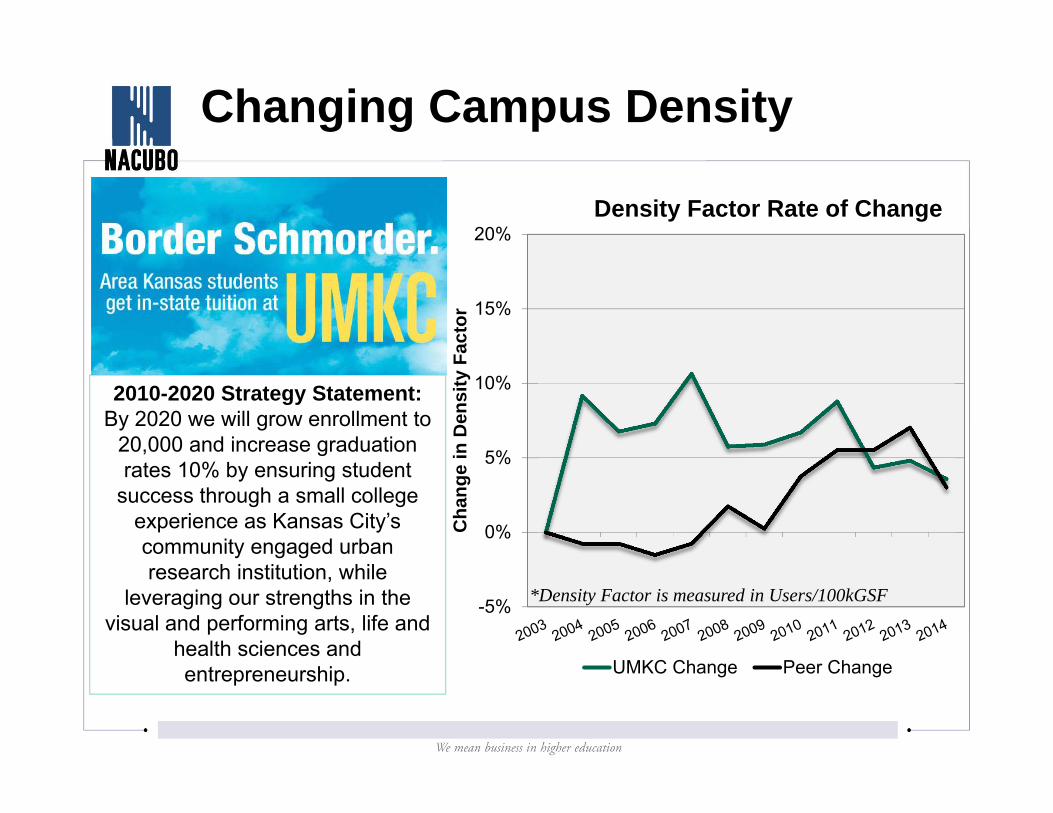
Changing Campus Density
-5%
0%
5%
10%
15%
20%
Cha
nge
in D
ensi
ty F
acto
r
Density Factor Rate of Change
UMKC Change Peer Change
*Density Factor is measured in Users/100kGSF
2010-2020 Strategy Statement:By 2020 we will grow enrollment to
20,000 and increase graduation rates 10% by ensuring student
success through a small college experience as Kansas City’s community engaged urban research institution, while
leveraging our strengths in the visual and performing arts, life and
health sciences and entrepreneurship.
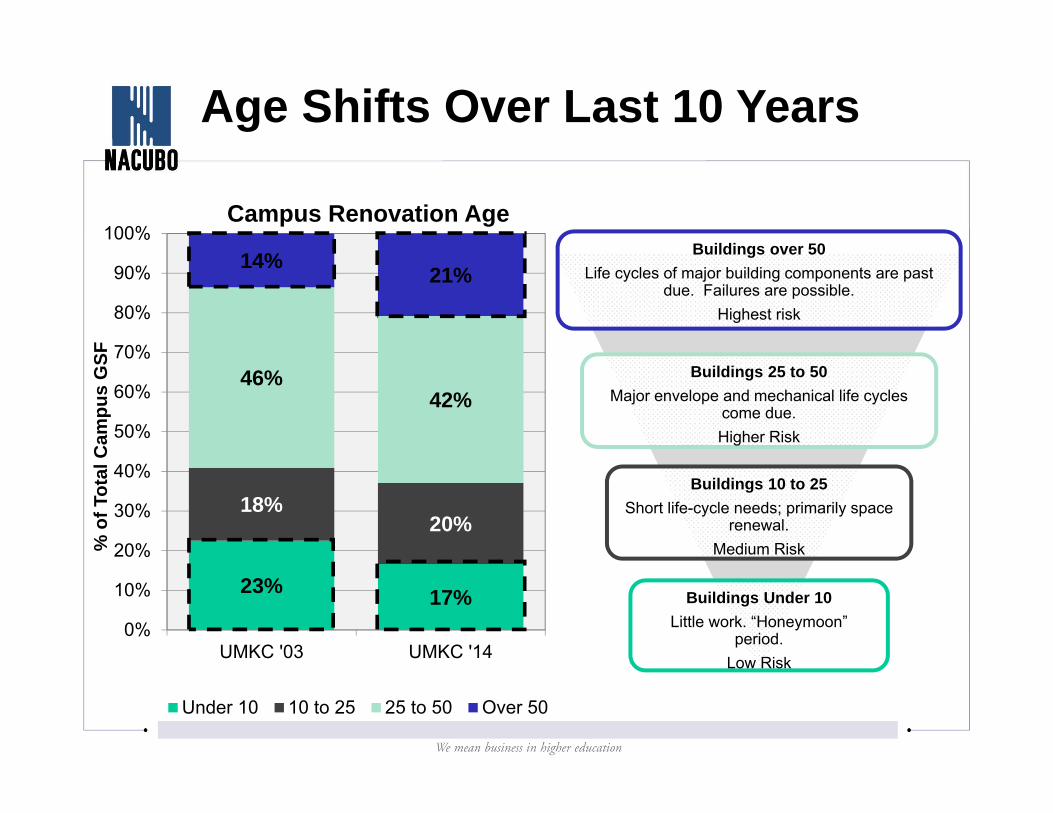
23% 17%
18%20%
46%42%
14% 21%
0%
10%
20%
30%
40%
50%
60%
70%
80%
90%
100%
UMKC '03 UMKC '14
% o
f Tot
al C
ampu
s G
SF
Campus Renovation Age
Under 10 10 to 25 25 to 50 Over 50
Age Shifts Over Last 10 Years
Buildings Under 10Little work. “Honeymoon”
period.Low Risk
Buildings 10 to 25Short life-cycle needs; primarily space
renewal.Medium Risk
Buildings 25 to 50Major envelope and mechanical life cycles
come due.Higher Risk
Buildings over 50Life cycles of major building components are past
due. Failures are possible.Highest risk
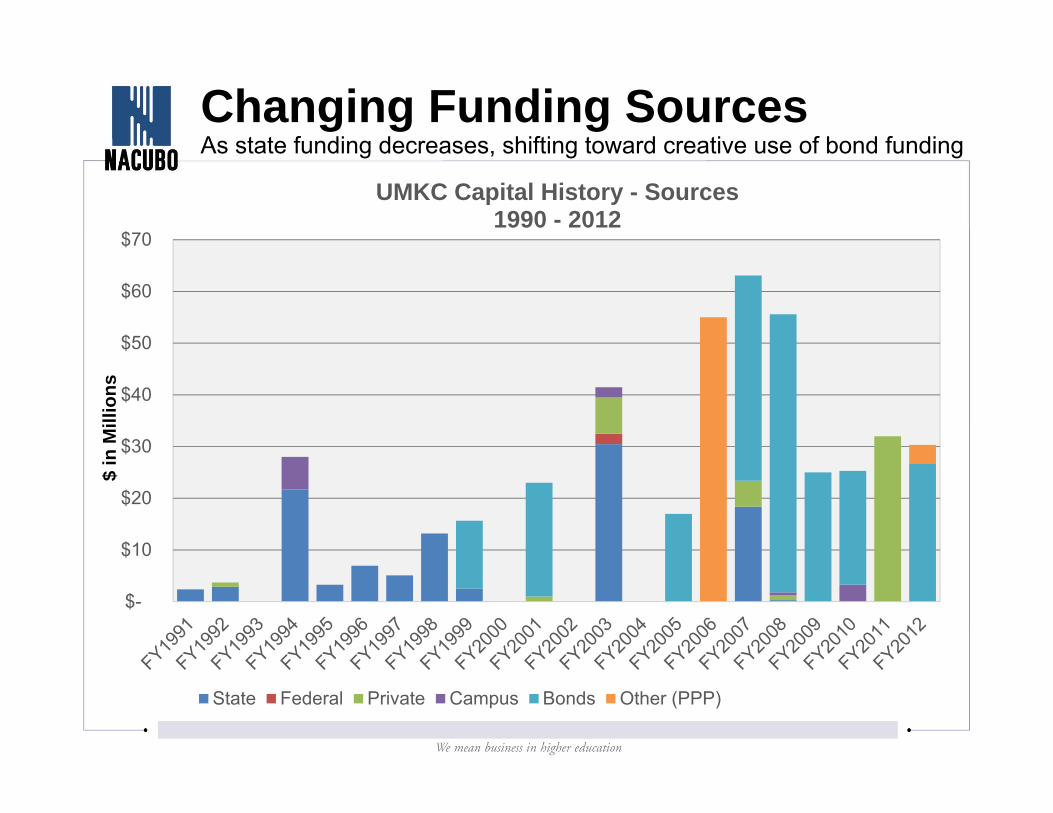
Changing Funding Sources
$-
$10
$20
$30
$40
$50
$60
$70
$ in
Mill
ions
UMKC Capital History - Sources1990 - 2012
State Federal Private Campus Bonds Other (PPP)
As state funding decreases, shifting toward creative use of bond funding
0
2
4
6
8
10
12
14
16
18
20
$0.00
$10.00
$20.00
$30.00
$40.00
$50.00
$60.00
$70.00
$80.00
$90.00
$100.00
$110.00
2003 2004 2005 2006 2007 2008 2009 2010 2011 2012 2013 2014
Cap
ital $
/GSF
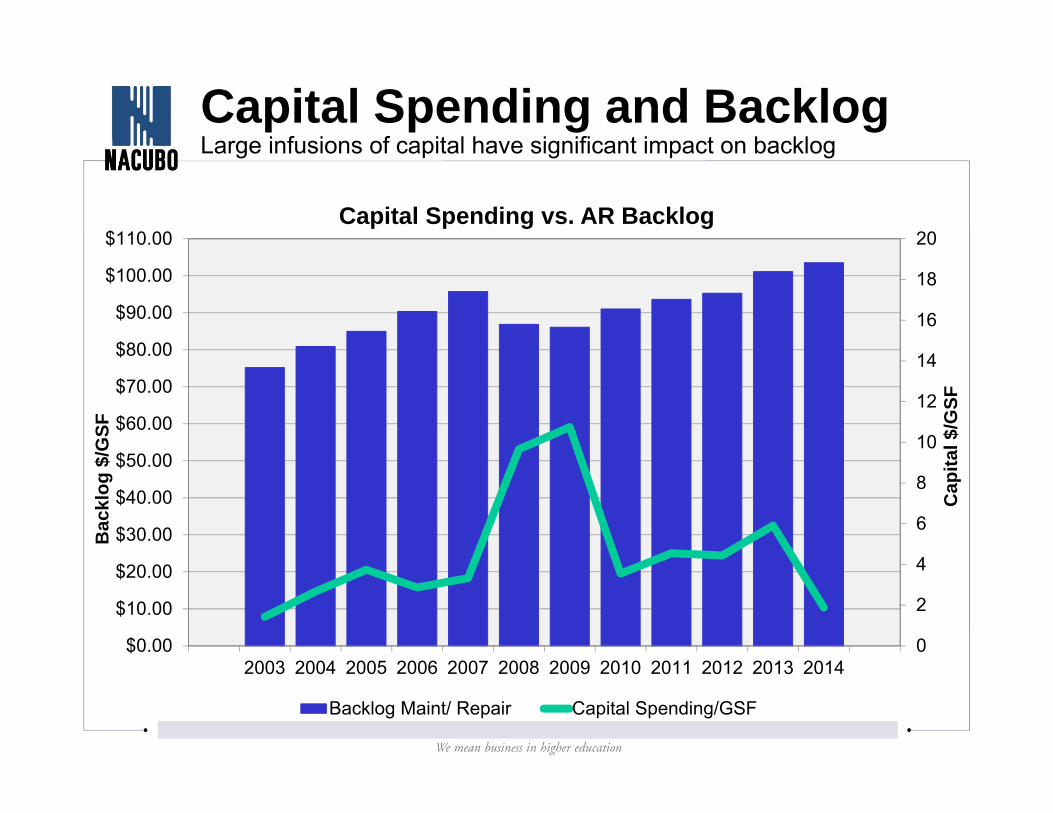
Bac
klog
$/G
SF
Capital Spending vs. AR Backlog
Backlog Maint/ Repair Capital Spending/GSF
Capital Spending and BacklogLarge infusions of capital have significant impact on backlog
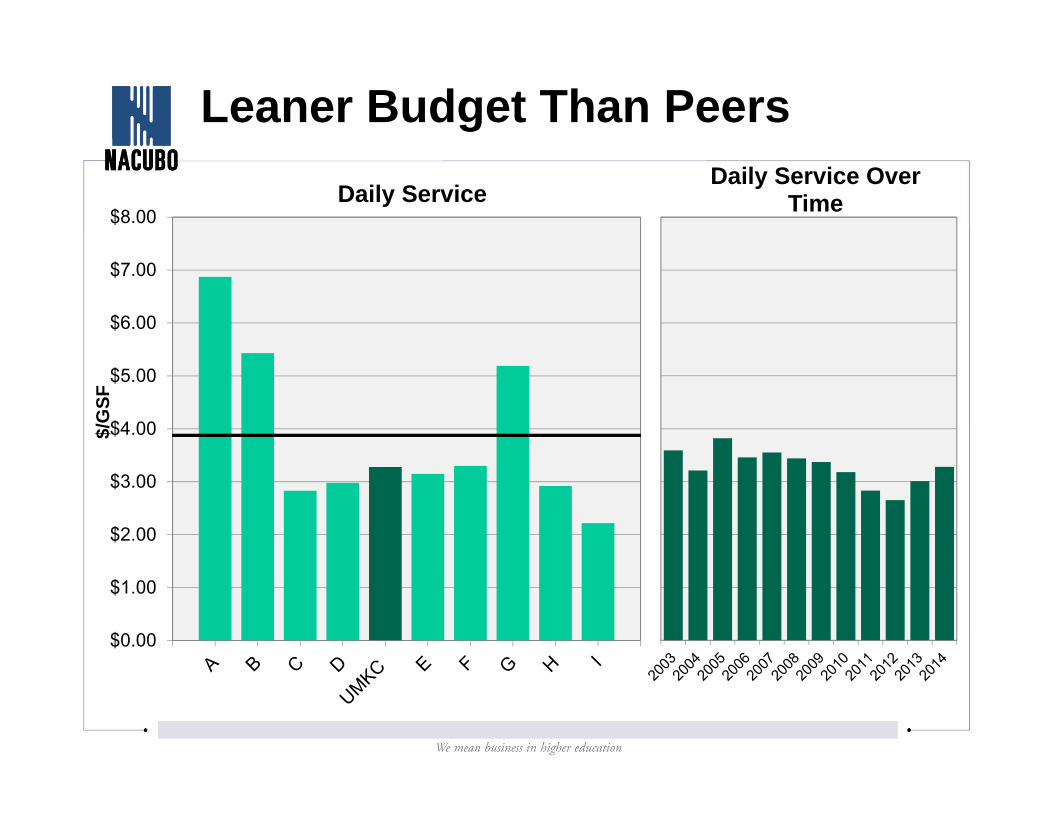
Leaner Budget Than Peers
$0.00
$1.00
$2.00
$3.00
$4.00
$5.00
$6.00
$7.00
$8.00
$/G
SF
Daily ServiceDaily Service Over
Time
$0.00
$0.20
$0.40
$0.60
$0.80
$1.00
$1.20
$1.40
$1.60
$1.80
$ / G
SF
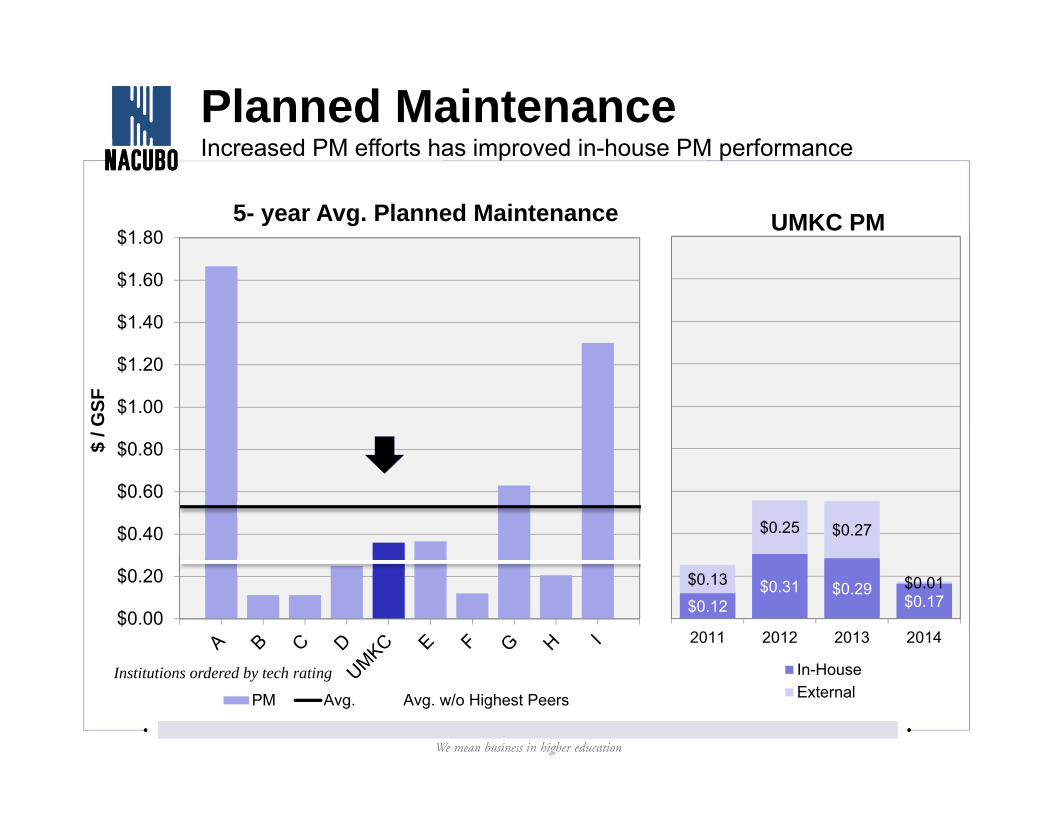
5- year Avg. Planned Maintenance
PM Avg. Avg. w/o Highest Peers
Planned MaintenanceIncreased PM efforts has improved in-house PM performance
Institutions ordered by tech rating
$0.12$0.31 $0.29
$0.17$0.13
$0.25 $0.27
$0.01
2011 2012 2013 2014
UMKC PM
In-HouseExternal
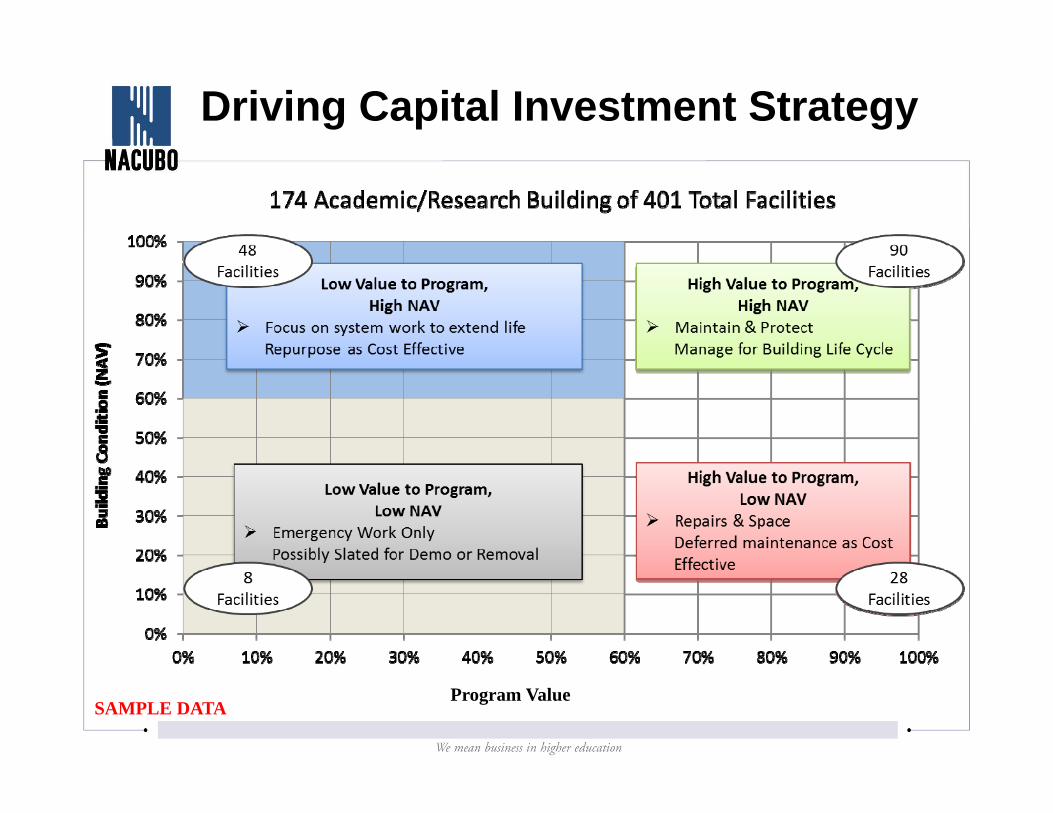
Driving Capital Investment Strategy
Program ValueSAMPLE DATA
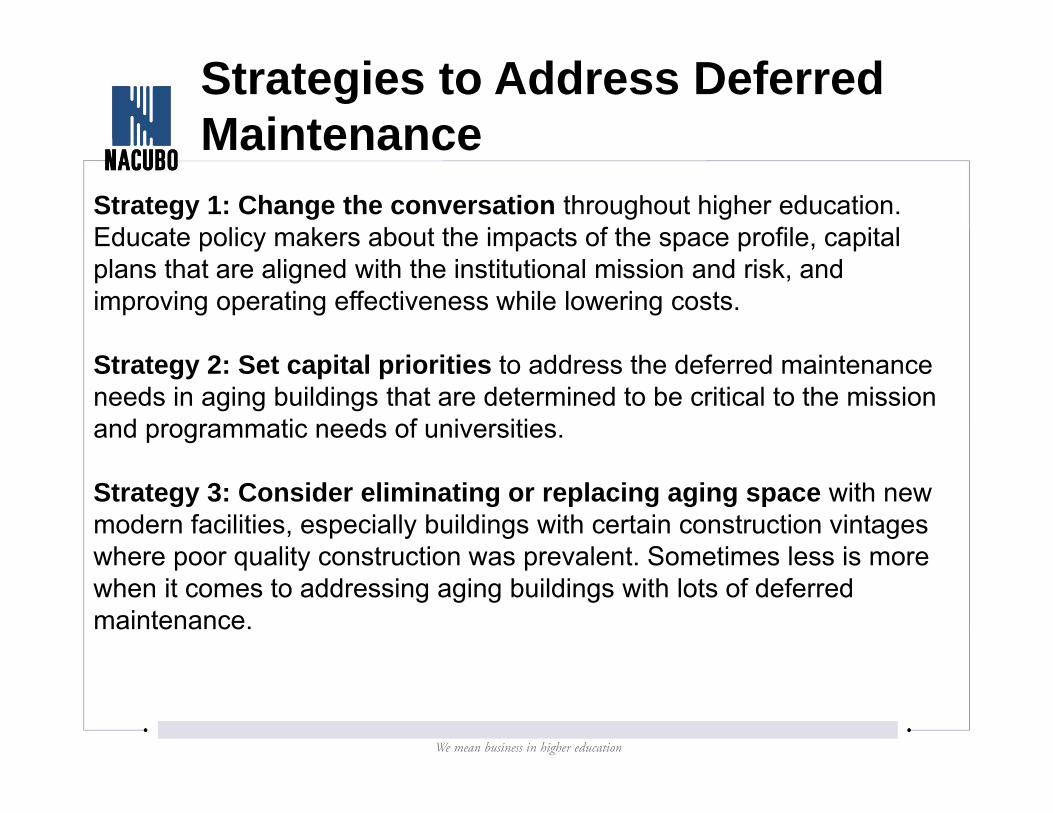
Strategies to Address Deferred Maintenance
Strategy 1: Change the conversation throughout higher education. Educate policy makers about the impacts of the space profile, capital plans that are aligned with the institutional mission and risk, and improving operating effectiveness while lowering costs.
Strategy 2: Set capital priorities to address the deferred maintenance needs in aging buildings that are determined to be critical to the mission and programmatic needs of universities.
Strategy 3: Consider eliminating or replacing aging space with new modern facilities, especially buildings with certain construction vintages where poor quality construction was prevalent. Sometimes less is more when it comes to addressing aging buildings with lots of deferred maintenance.
Strategies to Address Deferred Maintenance
Strategy 4: New construction must support the mission of the university and support the future program needs of each university.
Strategy 5: Make annual stewardship (keep-up) investment that addresses building components as they come due a priority at every campus. The more a campus keeps-up with life cycles as they come due, the less deferred maintenance grows.
Strategy 6: Institute facilities operational practices that are proactive at extending the life cycles of key expensive building components like HVAC, electrical systems and roofs. Proactive maintenance is not only a good idea when it comes to managing university facilities, it will save money in the long-run.


![Changing the Conversation: Making the Case for Funding Deferred Maintenance [APPA 2014]](https://img.pdfslide.us/doc/110x75/557c83b7d8b42a9f578b4d31/changing-the-conversation-making-the-case-for-funding-deferred-maintenance-appa-2014.jpg)