Embed Size (px)
Citation preview

ASIAN DEVELOPMENT
Governance and Public Service Delivery
Update
ASIAN DEVELOPMENT
Governance and public service delivery
Update
© 2013 Asian Development Bank
All rights reserved. Published 2013. Printed in the Philippines.
ISBN 978-92-9254-268-9 (Print), 978-92-9254-269-6 (PDF)ISSN 1655-4809Publication Stock No. FLS136033-3
Cataloging-in-Publication Data
Asian Development Bank.Asian development outlook 2013 update. Governance and public service delivery.
Mandaluyong City, Philippines: Asian Development Bank, 2013.
1. Economics. 2. Finance. 3. Asia. I. Asian Development Bank.
The annual Asian Development Outlook provides a comprehensive economic analysis of 45 economies in developing Asia and the Pacific.
The views expressed in this book are those of the authors and do not necessarily reflect the views and policies of the Asian Development Bank (ADB) or its Board of Governors or the governments they represent.
ADB does not guarantee the accuracy of the data included in this publication and accepts no responsibility for any consequence of their use.
By making any designation of or reference to a particular territory or geographic area, or by using the term “country” in this document, ADB does not intend to make any judgments as to the legal or other status of any territory or area.
ADB encourages printing or copying information exclusively for personal and noncommercial use with proper acknowledgment of ADB. Users are restricted from reselling, redistributing, or creating derivative works for commercial purposes without the express, written consent of ADB.
6 ADB Avenue, Mandaluyong City 1550 Metro Manila, Philippines Tel +63 2 632 4444 Fax +63 2 636 2444 www.adb.org
For orders, please contact: Public Information Center Fax +63 2 636 2584 [email protected]
Printed on recycled paper
iii
Contents
Foreword ivAcknowledgments viDefinitions viiAbbreviations viii
ADO 2013 Update—Highlights ix
Part 1 Time for vigilance and reform 1Developing Asia’s growth—slower than expected 4Regional impact of moderating PRC growth 9Volatile capital flows and financial market vulnerabilities 14The twin challenges of financial stability and sustainable growth 25Annex: Signs of firming recovery 30
Part 2 Governance and public service delivery 39Asia’s governance gap 41How governance and development connect 49Public services as the frontline of governance 58Ways to improve public service delivery 66Moving forward on governance reform 78
Part 3 Economic trends and prospects in developing Asia 91Subregional summaries 92Economic trends and prospects in developing Asia 93Bangladesh 131People’s Republic of China 137India 143Indonesia 149Malaysia 153Pakistan 157Philippines 162Thailand 166Viet Nam 170
Statistical appendix 175Statistical notes and tables 176
iv
Foreword
Six months on since Asian Development Outlook 2013 was published in April, developing Asia continues to consolidate its growth as the region’s two leading economies decelerate somewhat. Growth moderation in the People’s Republic of China reflects the authorities’ efforts to forge a more balanced and sustainable growth path than the familiar one led by exports and investment. In India, poor infrastructure and a lack of structural reforms continue to weigh on industry and investment, hampering growth. Regionally, developing Asia’s pace of growth is expected to ease from 6.1% in 2012 to 6.0% in 2013, before picking up to 6.2% in 2014. Excluding the two regional giants, the rest of developing Asia can expect growth this year equal to the 4.0% recorded in 2012.
Generally strong macroeconomic positions provide some breathing space, as many regional economies run current account surpluses and hold large foreign exchange reserves. The region is well positioned to weather the financial storm expected when Washington begins winding back its quantitative easing program in the coming months. Although the prospect of an end to quantitative easing in the United States has disturbed financial markets in emerging economies, including developing Asia, fears of a meltdown like the 1997 Asian financial crisis are misplaced. Many countries in Asia learned the hard lessons of 1997 and have rightly strengthened macroeconomic management, financial regulation, and corporate governance.
A more economically stable Asia will benefit from a gradual revival in developed markets. Although this is not a time of great optimism, the feeling is palpable that the mature economies have turned the corner. The United States economy is expected to pick up in the coming months, the euro area is showing signs of stabilizing, and Japan is benefiting from the introduction of Abenomics earlier this year. Nevertheless, recovery in the advanced world has yet to translate into revived orders for exports from developing Asia. This lull should be used to further enhance intraregional trade and promote domestic consumption in middle-income developing Asia.
The challenge for the region is to maintain and further consolidate its financial stability while continuing along its solid growth trajectory. The recent turbulence in financial markets underscores the need for continued structural reform to maintain stable growth momentum. Priority areas include financial sector development, industrial diversification, infrastructure and human capital improvement, fiscal consolidation, and social protection.
Foreword v
Strengthening governance is key among reform priorities. The development community has long stressed that open, transparent, and accountable government is critical for sound and sustainable development—a stance supported by countless empirical studies. The global evidence shows that better governance correlates with more reliable growth, higher investment, and accelerated poverty reduction. And Asia is no exception. Yet the region is closing its income gap with advanced economies much more quickly than its governance gap.
Most Asians’ impressions of governance come from their experience with public services. Improving public service delivery is therefore an effective entry point toward wider governance reform. Because public services are particularly important to the poor, ensuring their effective delivery is critical to making growth inclusive. As demonstrated by the increase in anticorruption initiatives in recent years, developing Asia’s leaders recognize this need and are stepping up efforts. The journey is long, and the tasks ahead are challenging, but the payoffs to development will be substantial.
TAKEHIKO NAKAO President Asian Development Bank
vi
Acknowledgments
The Asian Development Outlook 2013 Update was prepared by the staff of the Asian Development Bank (ADB) from the Central and West Asia Department, East Asia Department, Pacific Department, South Asia Department, Southeast Asia Department, Economics and Research Department, as well as the resident missions. Representatives from these departments and the Office of Regional Economic Integration constituted a Regional Economic Outlook Task Force, which met regularly and coordinated closely to develop consistent forecasts for the region.
The authors who contributed the sections are bylined in each chapter. The subregional coordinators were Tatsuji Hayakawa for Central and West Asia; Yolanda Fernandez Lommen for East Asia; Sabyasachi Mitra, Yoko Niimi, and Sarah Carrington for South Asia; Samiuela Tukuafu for Southeast Asia; and Christopher Edmonds for the Pacific.
A team of economists from the Economics and Research Department, led by Joseph E. Zveglich, Jr., Assistant Chief Economist, Macroeconomics and Finance Research Division, assisted by Edith Laviña, coordinated the overall production of the publication. Technical and research support was provided by Arnelyn May Abdon, Jun Ray Bautista, Shiela Camingue-Romance, Cindy Castillejos-Petalcorin, Gemma Esther Estrada, Nedelyn Magtibay-Ramos, John Mercurio, Pilipinas Quising, Aleli Rosario, Lea Sumulong, and Millicent Joy Urgel. Robert Boumphrey, Joshua Greene, Richard Niebuhr, Anthony Patrick, and Reza Vaez-Zadeh as the editorial economic advisors made substantive contributions to the country chapters and regional outlook. Guy Sacerdoti provided editorial advice on the theme chapter.
Peter Fredenburg did the style and manuscript editing. Alvin Tubio was responsible for typesetting, as well as graphics generation in which he was assisted by Maria Susan Torres. Art direction of the cover design was by Anthony Victoria, with artwork from Design Muscle. Critical support for the printing and publishing of the report was provided by the Printing Services Unit of the Office of Administrative Services, and Publishing and Dissemination Unit of the Department of External Relations. Fermirelyn Cruz, Elenita Pura, and Rhia Bautista-Piamonte provided administrative and secretarial support.
The Department of External Relations, led by Omana Nair and Sean Crowley, planned and coordinated the dissemination of the ADO 2013 Update.
Changyong RheeChief EconomistEconomics and Research Department
vii
Definitions
The economies discussed in the Asian Development Outlook 2013 Update (ADO 2013 Update) are classified by major analytic or geographic group. For purposes of this publication, the following apply: Association of Southeast Asian Nations (ASEAN) comprises Brunei
Darussalam, Cambodia, Indonesia, the Lao People’s Democratic Republic, Malaysia, Myanmar, the Philippines, Singapore, Thailand, and Viet Nam.
Developing Asia refers to the 45 developing member countries of the Asian Development Bank.
Central Asia comprises Armenia, Azerbaijan, Georgia, Kazakhstan, the Kyrgyz Republic, Tajikistan, Turkmenistan, and Uzbekistan.
East Asia comprises the People’s Republic of China; Hong Kong, China; the Republic of Korea; Mongolia; and Taipei,China.
South Asia comprises Afghanistan, Bangladesh, Bhutan, India, the Maldives, Nepal, Pakistan, and Sri Lanka.
Southeast Asia comprises Brunei Darussalam, Cambodia, Indonesia, the Lao People’s Democratic Republic, Malaysia, Myanmar, the Philippines, Singapore, Thailand, and Viet Nam.
The Pacific comprises the Cook Islands, Fiji, Kiribati, the Marshall Islands, the Federated States of Micronesia, Nauru, Papua New Guinea, Palau, Samoa, Solomon Islands, Timor-Leste, Tonga, Tuvalu, and Vanuatu.
Unless otherwise specified, the symbol “$” and the word “dollar” refer to US dollars.
ADO 2013 Update is generally based on data available up to 6 September 2013.
viii
Abbreviations
ADB Asian Development BankADO Asian Development OutlookASEAN Association of Southeast Asian NationsEU European UnionFDI foreign direct investmentFY fiscal yearGDP gross domestic productICRG International Country Risk GuideICT information and communication technologyIMF International Monetary FundLao PDR Lao People’s Democratic RepublicOECD Organisation for Economic Co-operation and DevelopmentOPEC Organization of the Petroleum Exporting CountriesPRC People’s Republic of ChinaQE quantitative easingsaar seasonally adjusted annualized rateUS United States of AmericaWGI World Governance Indicators
ADO 2013 Update—Highlights
Developing Asia is challenged to sustain its growth momentum as the pace in its two largest economies moderates. Regional growth is expected to slide marginally from 6.1% in 2012 to 6.0% in 2013, before picking up to 6.2% in 2014. Prospective tapering of quantitative easing in the United States destabilized emerging economy financial markets, including in developing Asia. However, fears of a repeat of the 1997 Asian financial crisis are unwarranted. The region is now in a stronger position to weather the storm, with many economies running current account surpluses and holding large foreign reserve stockpiles. The reforms instituted since 1997 strengthened macroeconomic management, financial regulation, and corporate governance.
Still, developing Asia faces the twin challenges of maintaining financial stability and sustaining growth. The recent financial turmoil has demonstrated all the more clearly the need for structural reform to support growth.
Governance reform is needed to sustain development momentum and ensure that the benefits of growth are widely shared. Improving public service delivery is an effective entry point toward wider governance reform.
x ADO 2013 Update—Highlights
Key messages
Growth in developing Asia is forecast to decline marginally to 6.0% this year from 6.1% in 2012, before picking up to 6.2% in 2014. This Update revises down the Asian Development Outlook 2013 (ADO 2013) forecasts for 2013 by 0.6 percentage points and for 2014 by 0.5 percentage points, as growth moderates in the region’s two largest economies: the People’s Republic of China (PRC) and India.
Resurgence in the United States (US) economy is expected to pick up in the coming months. Signs are emerging that the euro area is turning the corner, and Japan is benefiting from the introduction of Abenomics early this year. Nevertheless, recovery in the advanced economies has yet to translate into revived orders for exports from developing Asia.
In the PRC, growth is expected to moderate to 7.6% in 2013 from 7.7% last year. The authorities there are engineering a medium-term transition to a more sustainable growth path than one led by exports and investment. The shift is evident in recent efforts to tackle a burgeoning shadow banking system. This will affect growth prospects in Asia, especially East and Southeast Asia.
India’s growth is forecast to slow to 4.7% in FY2013 (ending 31 March 2014) from 5.0% in FY2012. Persistent supply-side bottlenecks such as poor infrastructure and long delays in structural reform keep industry and investment lagging. Fiscal and current account deficits also dent business confidence.
Slower growth in Asia’s two giants hampers but does not hobble growth across Asia. With positive signs from advanced economies supporting regional prospects, developing Asia excluding the PRC and India is expected to match its 4.0% growth performance last year.
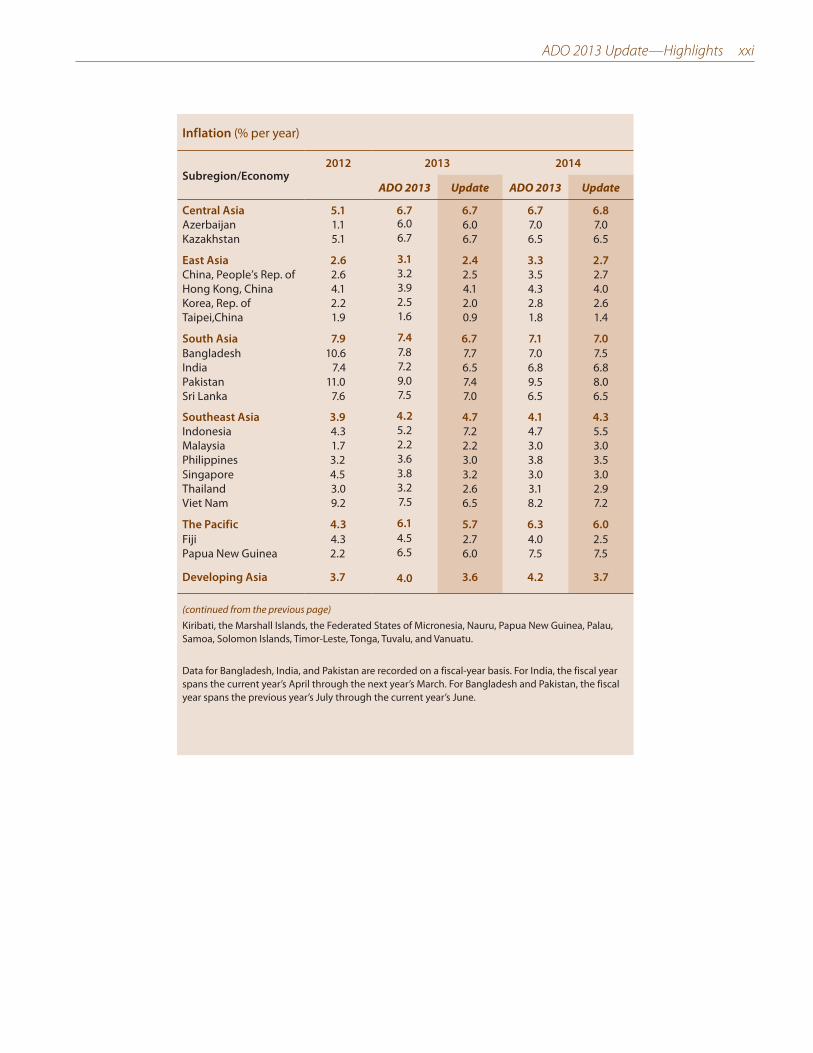
Inflation in developing Asia is projected dipping to 3.6% this year from 3.7% in 2012 as weaker growth and tepid commodity prices keep price pressures in check. Next year, inflation is expected to return to 3.7%.
Prospective tapering of US quantitative easing has destabilized financial markets in developing Asia and other emerging economies, in particular India and Indonesia. Widening current account deficits have made the two economies vulnerable, but their foreign exchange reserves at the end of August remain sufficient to cover imports for 7 months in India and 5 months in Indonesia.
In any case, fears of a crisis recalling 1997 are unwarranted. Many developing Asian economies now have current account surpluses and large foreign exchange reserves. In addition, reforms since 1997 have strengthened macroeconomic management, financial regulation, and corporate governance.
ADO 2013 Update—Highlights xi
Developing Asia faces the twin challenges of maintaining financial stability and sustaining growth. As Asia transitions toward a more sustainable growth path, governments must watch out for volatile capital flows and financial market disruption. They must also continue to pursue sound macroeconomic policies that include building up fiscal space during good times.
The recent turbulence in financial markets underscores the need for structural reform to sustain growth. Priority areas include foreign direct investment, industrial diversification, infrastructure and human capital, fiscal consolidation, and social protection.
Governance is another key area for reform. Asia must make headway toward catching up with the advanced economies and matching their quality of governance. A focus on strengthening public service delivery can provide immediate benefits to make growth more inclusive and create momentum for wider governance reforms.
Time for vigilance and reform
Developing Asia’s outlook Growth will be slower than forecast in April in ADO 2013 before
picking up in 2014. Despite improving growth prospects for the advanced economies, GDP in developing Asia will grow at 6.0% in 2013, marginally down from 6.1% in 2012. Growth in 2014 is now forecast at 6.2%.
» This Update revises down GDP growth projections in ADO 2013. The forecast for 2013 growth is now 0.6 percentage points lower than the 6.6% in ADO 2013, and for 2014 now 0.5 percentage points below the 6.7% forecast in April. Growth across the region is somewhat stymied by the moderation of growth in the two regional giants—the PRC and India—and by instability in financial markets buffeted by volatile capital flows.
» Nascent recovery in advanced economies has yet to lift emerging
markets. Acceleration in the US economy is expected to gather momentum in the months ahead, and recession in the euro area seems to be coming to an end. Japan began 2013 quite strongly following the introduction of Abenomics. However, recovery in the advanced economies has yet to translate into revived orders for exports from developing Asia.
Developing Asia’s slowdown is most manifest in its two giants. Growth this year in India is forecast to decelerate to 4.7% from 5.0% last year and in the PRC to 7.6% from 7.7%. Such growth is much more tepid than the enviable rates both countries enjoyed over the past decade, when India averaged 7.9% growth and the PRC 10.5%.
» Slower growth in the PRC is the price of structural reform for the
long term. The authorities in the PRC seek to engineer a strategic shift away from growth led by exports and investment toward more balanced

xii ADO 2013 Update—Highlights
growth. The shift is most evident in the government’s recent efforts to wrestle down credit bubbles and come to grips with a burgeoning shadow banking system. From this perspective, moderated growth in the PRC over the medium term signals a healthy and welcome transition to a more sustainable growth path.
» Deceleration in India tracks persistent slumps in industry and
investment. Setting aside weak foreign demand, frail industry and investment in India reflect persistent supply-side bottlenecks such as poor infrastructure and delayed structural reform to ease these constraints. India’s current account deficits and volatile capital flows further dent business confidence.
» Slower growth in the giants hampers but does not hobble growth
across Asia. East and Southeast Asia have especially strong links with the PRC in “factory Asia.” The PRC’s influence on economic performance in these subregions has grown in the past decade along with its share of developing Asia’s exports, which rose from 14% to 21%. Even with growth slowing in the PRC and India, projected growth this year in developing Asia excluding these two giants equals the 4.0% recorded in 2012.
Constrained growth and commodity prices hold price pressures in check. Average inflation in developing Asia is expected to moderate to 3.6% in 2013, improving from 3.7% last year. Inflation in 2014 is forecast to pick up to 3.7%. These figures mask great variation country by country. Inflation in India will reach 6.5% in 2013. In Indonesia, inflation is expected to worsen sharply from 4.3% in 2012 to 7.2% in 2013 as the government scales back fuel subsidies.
Asia’s shrinking current account surplus puts a premium on domestic
demand. Developing Asia’s long-standing current account surplus is expected to narrow from 1.8% of GDP in 2012 to 1.6% in both 2013 and 2014.
Volatile capital flows and financial market vulnerability Regional financial markets are rocked by talk of tapering quantitative
easing. The sharp reactions of financial markets in emerging economies, not least in Asia, to key signals from the US Federal Reserve on 22 May and 19 September provide firm evidence of their vulnerability to monetary policy shifts in advanced countries.
» Capital flows reverse as investors pivot away from emerging markets.
This has weighed down currency values and stock prices and pushed up long-term bond yields and risk premiums. Stock markets in several Asian economies suffered double-digit declines from May to the end of August: Indonesia by 21.1%, Thailand by 20.3%, the Philippines by 18.4%, and India by 11.7%.
» Recently spiraling asset prices in Asia start to unwind. Market turmoil has reversed asset price increases that were fuelled by large capital inflows from advanced countries when they responded to the global financial crisis with expansionary monetary policies.
ADO 2013 Update—Highlights xiii
India and Indonesia in particular have felt recent financial market
turmoil. From May to the end of August, the Indian rupee fell by 16.2% against the US dollar, and the Indonesian rupiah by 13.2%. Widening current account deficits have long made both economies more susceptible to shifts in market sentiment, as have fiscal deficits in India. Fortunately, both have sufficient foreign exchange reserves, enough as of August to cover imports to India for 7 months and to Indonesia for 5 months.
Turbulence in Asia does not at this moment warrant fear of a crisis
recalling 1997. Developing Asia is now in a much stronger position to weather the storm. Compared with 1997, most regional economies now have robust current account surpluses and much higher foreign reserves relative to their modest amounts of short-term external debt. In addition, countries in the region have since 1997 significantly strengthened their macroeconomic management, financial regulation and supervision, and corporate governance.
The twin challenges of financial stability and sustainable growth Asia needs to safeguard financial stability now and sustain growth in
the medium term. Highly volatile capital flows that compound the risk of financial instability are occurring at a time when the PRC’s transition to a more moderate growth path may dampen the region’s growth generally.
Confidence rests on the authorities continuing to pursue sound
macroeconomic policies. Recent global financial crises, from the 1997 Asian financial crisis to the ongoing euro area sovereign debt crisis, offer valuable lessons for developing Asia in its quest for financial stability.
» Crisis response cannot rely solely on easier monetary policy. There are limits to monetary policy’s countercyclical support, particularly where interest rates are low or inflation is a chronic problem. Unlike economies whose currencies enjoy international reserve status, emerging market central banks cannot pursue quantitative easing without accelerating inflation.
» Exchange rates should be flexible, balancing inflation and corporate
external debt. Flexible exchange rates help governments to ensure that they hold sufficient reserves that are commensurate with the demands posed by greater volatility in capital flows. Defending unrealistic exchange rates risks depleting foreign exchange reserves.
» Periods of relative calm are times to firm government fiscal positions. Governments need to build up fiscal space when they can, to finance sustainable development and poverty elimination and, in times of economic crisis, countercyclical stimulus.
Generally sound banking sector indicators should not invite complacency.
Capital adequacy and nonperforming loan ratios have improved in developing Asia despite the global financial crisis. But policy makers need to be vigilant to secure the quality of financial data and monitor the rapid growth of shadow
xiv ADO 2013 Update—Highlights
banking. Prudential regulation must be strengthened and, where appropriate, include macroprudential measures.
Current financial turmoil is a timely reminder of the need for structural
reform. Adversity impresses on India, Indonesia, and others in developing Asia the urgency of structural reform to keep them on a strong and sustainable growth path. High priorities are reforms to encourage foreign direct investment, diversify the industrial base, close infrastructure and human capital gaps, consolidate fiscal positions by cutting inefficient subsidies, strengthen social protection, and overcome other constraints on long-term growth.
One important area of structural reform is governance. While developing Asia has outperformed the rest of the world economically over the last few decades, its governance lags. To close the gap with the advanced countries, the region needs to strengthen governance, an issue analyzed in the theme chapter of this Update. Focusing on strengthening public service delivery can provide immediate benefits to make growth more inclusive and create momentum for wider governance reform.
Outlook by subregion Developing Asia is challenged to sustain its growth momentum. Despite
a better outlook for the advanced economies, growth in developing Asia is slowing, mainly on account of weaker prospects for its two giants. Subdued economic activity cuts across most subregions.
East Asia sees growth softer than expected. Growth in East Asia is projected at 6.6% in both 2013 and 2014, below the 7.1% forecast in April for both years. Rather than accelerate, growth is now expected to slow in the PRC to 7.6% in 2013 and 7.4% in 2014, owing to weaker domestic demand. Growth rates in the rest of the subregion are now expected to be generally below April projections because of weaker external demand and, in Mongolia, moderating investment in mining. However, the Republic of Korea growth forecast for 2013 is maintained at 2.8%, as fiscal stimulus has cushioned the impact of weaker external demand. East Asia’s inflation rate is projected at 2.4% in 2013 and 2.7% in 2014, lower than April forecasts, with Mongolia as the outlier recording high inflation at 9.5% in 2013 and 10.0% in 2014.
South Asia is downgraded mainly because of a slowdown in India. The subregional growth forecast is lowered by 1 percentage point, to 4.7% from 5.7% in 2013, and by less in 2014, to 5.5% from 6.2%. Rapid growth in India has steadily slowed over the past 2 years as the county grappled with fiscal imbalances, high inflation, and various impediments to new investment. While substantial progress has been made on the fiscal and inflation fronts, capital outflows from emerging markets added to uncertainty over India’s outlook because of its large current account deficit. Growth in other countries is largely on track to meet forecasts, with growth slightly higher in Afghanistan, Bangladesh, and Nepal and slightly lower in Bhutan. Pakistan
ADO 2013 Update—Highlights xv
has adopted major reforms that should stabilize its economy. The average subregional inflation forecast for 2013 is revised down to 6.7% from 7.4%, and for 2014 to 7.0% from 7.1%.
Southeast Asia is crimped by weakness in its three biggest economies. Lackluster export markets and moderated investment have weighed on growth in Indonesia, Thailand, and Malaysia. By contrast, the Philippines is performing strongly, and its growth result will be higher than expected in April. The subregional growth forecast for this year is lowered by half a percentage point to 4.9%. In 2014, growth will quicken to 5.3% as investment recovers and exports benefit from improved global trade and recent currency depreciation in several economies. While inflation is more subdued in Southeast Asia generally, it has accelerated sharply in Indonesia since June, when the government raised administered fuel prices. That prompts an upward revision in the subregional inflation forecasts to 4.7% from 4.2% this year and to 4.3% from 4.1% in 2014.
Central Asia will grow marginally more slowly in 2013 before recovering
in 2014. Growth is now projected to decelerate to 5.4% in 2013, a bit below the 5.5% forecast in ADO 2013, because slower growth in Kazakhstan and Georgia outweighs more optimistic forecasts for Azerbaijan, the Kyrgyz Republic, and Tajikistan. The April forecast that growth will reach 6.0% in 2014 still stands. Sluggish performance in industry, agriculture, and construction trims the 2013 growth forecast for Kazakhstan from 5.2% to 4.8%. In Georgia, a sharp slowdown in the first 7 months—reflecting investor caution linked to the political transition, delays in public infrastructure projects, and weak domestic demand—lowers the growth projection for 2013 from 5.5% to 3.0%. The Update maintains its subregional inflation projection for 2013 at 6.7% but revises it for 2014 with an uptick to 6.8%.
Pacific economies as a whole are expected to achieve ADO 2013 growth
forecasts. The growth forecasts for the Pacific subregion remain unchanged at 5.2% in 2013 and 5.5% in 2014. Higher growth expectations for the Cook Islands and Fiji in 2013 are offset by lower projections for Kiribati, Nauru, Solomon Islands, and Timor-Leste. Improving consumption and investment indicators in Fiji and unexpectedly large increases in tourism arrivals in the Cook Islands prompt upgrades in their growth forecasts. Downward revisions are led by a modest decline in the 2013 growth forecast for Timor-Leste, where public expenditure is lower than budgeted, and a more significant downgrade in the forecast for Solomon Islands, where production in gold mining, logging, and agriculture are falling short of expectations. The forecast for inflation in 2013 is revised down to 5.7% from 6.1% and in 2014 to 6.0% from 6.3%.
xvi ADO 2013 Update—Highlights
Special theme: Governance and public service delivery
Asia’s governance gap Developing Asia’s phenomenal growth is closing the income gap with
advanced economies. Regional residents’ earnings were less than 6% of those of their counterparts in the developed world in 1980 but today are over 18%. Consequently, some 700 million people have risen out of extreme poverty (defined as living on $1.25 or less per day), near universal primary education has been achieved for both girls (89%) and boys (91%), and almost 86% of households now have access to safe drinking water.
But governance in the region has lagged its economic achievements.
The concept of good governance is difficult to measure in its many facets, which include political stability and absence of violence (political stability for convenience), controlling corruption, and voice and accountability (voice). But disparate measures agree that developing Asia’s progress has been slow.
» The region has seen less progress in narrowing the governance gap
with advanced economies. The region’s performance on International Country Risk Guide indicators shows modest gains since 1993 in the rule of law and bureaucratic quality ratings relative to those of advanced countries. Relative ratings on controlling corruption declined sharply in developing Asia around the 1997–1998 Asian financial crisis and have not fully regained their early 1990s level.
» Developing Asia also trails its developing economy peers. Looking at the 2011 World Governance Index indicators, Asia on average scored below Latin America in all areas covered: controlling corruption, government effectiveness, political stability, regulatory quality, the rule of law, and voice. Factoring in income differences improves developing Asia’s global ranking but still leaves the region lagging Latin America in voice, regulatory quality, and controlling corruption.
» Governance performance within the region is quite diverse. Compared with expected governance ratings for its per capita GDP, East Asia shows strong government effectiveness, regulatory quality, and rule of law but lags in voice. In contrast, political stability and regulatory quality are the key issues in South Asia, which is stronger in voice.
In light of its experience, what is the role of governance in Asia’s
development story? The concept of governance covers a broad range of issues, often without uniform benchmarks to guide policy makers. Moreover, different elements of governance may come into play at different stages of development. These disparate elements must be disentangled to clarify the governance–development nexus.
ADO 2013 Update—Highlights xvii
How governance and development connect
The accumulated global evidence makes it clear: Governance matters for
development. Cross-country empirical studies show that better governance correlates with faster growth, higher investment, and more rapid poverty reduction. And Asia is no exception.
The relationship with development varies across dimensions of
governance. In general, government effectiveness, the rule of law, regulatory quality, and controlling corruption are found to be more closely and positively related to development performance than are voice or political stability. In developing Asia, government effectiveness and regulatory quality are even more strongly associated with growth than the global average.
A country’s stage of development determines the essential elements
of governance. Some elements of governance such as voice become more important later to support growth and social indicators like poverty, income equality, education, and health.
Public services as the frontline of governance People judge the quality of governance by their experience with public
services. Governance is broad, and narrowing the focus to an actionable area can create momentum for broader reform to improve development outcomes. As the quality of social services and infrastructure is a popular yardstick for the general state of governance, improving public service delivery is an effective entry point toward wider governance reform. Because public services are particularly important to the poor, ensuring their effective delivery is critical for making growth inclusive.
Public service shortfalls mirror developing Asia’s lagging governance. Despite significant improvements, essential services in many countries in developing Asia lag in quantity and quality. Shortfalls in public services undermine development outcomes and can, for example, leave primary and secondary students with reading, math, and science skills below par. Large infrastructure deficits plague the region.
Weak governance in turn undermines public service quality. Corruption and the lack of transparency in service delivery are among the more obvious elements of weak governance. For example, corruption is cited as the main cause of poor public services, and social outcomes suffer as chronic absenteeism in many countries deprives health clinics and public schools of their doctors and teachers.
xviii ADO 2013 Update—Highlights
Mechanisms to improve public service delivery A multipronged strategy is needed for better public services. Case
studies and experimental evidence show that service quality improves where recipients have the means to demand it. Complementary mechanisms for improving public services are the “three Es”: Empowering citizens, Engaging local governments and the private sector, and Expanding the use of information and communication technology (ICT).
Empowering citizens generates dynamism for greater accountability. Rights-based approaches, such as India’s “right to employment” and “right to information,” establish legal rights to entitlements (though policy makers need to be mindful of budget impacts). Participatory monitoring and evaluation tools—such as citizen report cards, community score cards, social audits, and grievance redress systems—can make governments more responsive. Directly involving communities in delivering public services gives beneficiaries more information and greater say in how funds are used. One program in Indonesia allowed villagers to prioritize local needs, develop project proposals, and decide which projects to fund.
Engaging local governments and the private sector can expand public
services. Experience shows that devolving powers to local authorities who are able to take on more responsibility improves public service performance. Giving local authorities in Bangladesh and the PRC greater taxing and spending autonomy strengthened incentives to generate revenue and invest more in social infrastructure and poverty programs. Teaming up with non-state providers can expand services to difficult-to-reach areas and conserve limited public funds. Cambodia has experimented successfully with contracting nongovernment organizations to provide public health services.
Expanding use of ICT augments the impact of empowerment and
partnerships. ICT can catalyze citizen empowerment by facilitating participation in local governance and enabling fast access to information. It can also create the feedback channel needed to push for services of better quality, such as through an official blog site where citizens can actively communicate with the executives of government agencies by posting policy comments and questions. Making local government administration more transparent can squelch opportunities for corruption and so address a key governance weakness that goes beyond public services.
Moving forward on governance reform A tailored approach to governance reform is needed to maximize
development impact. As development goals in themselves, all dimensions of governance should be pursued. But the governance–development nexus is complex. Policy makers need to focus their efforts on the particular governance deficiencies that hold their country back from its next stage of development.
ADO 2013 Update—Highlights xix
» Growth-supporting aspects of governance take center stage for
low-income economies. Strengthening government effectiveness, improving regulatory quality and the rule of law, and scaling up anticorruption efforts provide entry points to wider governance reform.
» Middle-income economies must look to advanced economy
experience. At this stage, maintaining an environment supportive of growth is important, but policy must also respond to the rising aspirations of the populace. As their incomes improve and access to technology expands, citizens demand greater say in national affairs. Moving to even higher income entails improving governance quality with respect to participation and accountability.
» All countries should also pursue actionable governance reforms
with benefits up front. Among the “three Es”—Empowering citizens, Engaging local governments and the private sector, and Expanding the use of ICT—expanding ICT should be a priority because it complements the other two mechanisms. ICT not only provides an effective service delivery channel, it can mitigate any unintended consequences of empowerment and decentralization by improving information flow, making transactions more transparent, and thus establishing the means to hold service providers accountable.
Governance reform cannot be delayed. Good governance is needed to sustain development and ensure that the benefits of growth are widely shared. As demonstrated by the increase in anticorruption initiatives in recent years, developing Asia’s leaders recognize this need and are stepping up their efforts. The journey is long and the tasks ahead are challenging, but the development payoffs will be large.
xx ADO 2013 Update—Highlights
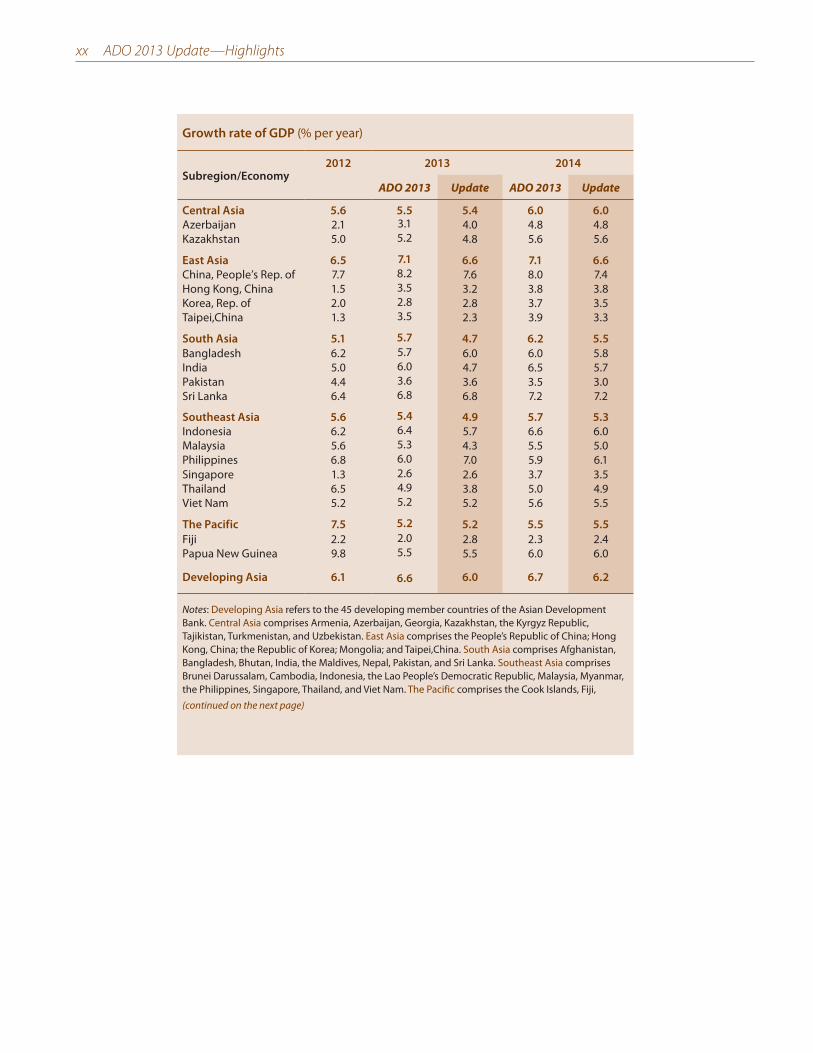
Growth rate of GDP (% per year)
Subregion/Economy2012 2013 2014
ADO 2013 Update ADO 2013 Update
Central Asia 5.6 5.5 5.4 6.0 6.0
Azerbaijan 2.1 3.1 4.0 4.8 4.8Kazakhstan 5.0 5.2 4.8 5.6 5.6
East Asia 6.5 7.1 6.6 7.1 6.6
China, People’s Rep. of 7.7 8.2 7.6 8.0 7.4Hong Kong, China 1.5 3.5 3.2 3.8 3.8Korea, Rep. of 2.0 2.8 2.8 3.7 3.5Taipei,China 1.3 3.5 2.3 3.9 3.3
South Asia 5.1 5.7 4.7 6.2 5.5
Bangladesh 6.2 5.7 6.0 6.0 5.8India 5.0 6.0 4.7 6.5 5.7Pakistan 4.4 3.6 3.6 3.5 3.0Sri Lanka 6.4 6.8 6.8 7.2 7.2
Southeast Asia 5.6 5.4 4.9 5.7 5.3
Indonesia 6.2 6.4 5.7 6.6 6.0Malaysia 5.6 5.3 4.3 5.5 5.0Philippines 6.8 6.0 7.0 5.9 6.1Singapore 1.3 2.6 2.6 3.7 3.5Thailand 6.5 4.9 3.8 5.0 4.9Viet Nam 5.2 5.2 5.2 5.6 5.5
The Pacific 7.5 5.2 5.2 5.5 5.5
Fiji 2.2 2.0 2.8 2.3 2.4Papua New Guinea 9.8 5.5 5.5 6.0 6.0
Developing Asia 6.1 6.6 6.0 6.7 6.2
Notes: Developing Asia refers to the 45 developing member countries of the Asian Development Bank. Central Asia comprises Armenia, Azerbaijan, Georgia, Kazakhstan, the Kyrgyz Republic, Tajikistan, Turkmenistan, and Uzbekistan. East Asia comprises the People’s Republic of China; Hong Kong, China; the Republic of Korea; Mongolia; and Taipei,China. South Asia comprises Afghanistan, Bangladesh, Bhutan, India, the Maldives, Nepal, Pakistan, and Sri Lanka. Southeast Asia comprises Brunei Darussalam, Cambodia, Indonesia, the Lao People’s Democratic Republic, Malaysia, Myanmar, the Philippines, Singapore, Thailand, and Viet Nam. The Pacific comprises the Cook Islands, Fiji,(continued on the next page)
ADO 2013 Update—Highlights xxi
Inflation (% per year)
Subregion/Economy2012 2013 2014
ADO 2013 Update ADO 2013 Update
Central Asia 5.1 6.7 6.7 6.7 6.8
Azerbaijan 1.1 6.0 6.0 7.0 7.0Kazakhstan 5.1 6.7 6.7 6.5 6.5
East Asia 2.6 3.1 2.4 3.3 2.7
China, People’s Rep. of 2.6 3.2 2.5 3.5 2.7Hong Kong, China 4.1 3.9 4.1 4.3 4.0Korea, Rep. of 2.2 2.5 2.0 2.8 2.6Taipei,China 1.9 1.6 0.9 1.8 1.4
South Asia 7.9 7.4 6.7 7.1 7.0
Bangladesh 10.6 7.8 7.7 7.0 7.5India 7.4 7.2 6.5 6.8 6.8Pakistan 11.0 9.0 7.4 9.5 8.0Sri Lanka 7.6 7.5 7.0 6.5 6.5
Southeast Asia 3.9 4.2 4.7 4.1 4.3
Indonesia 4.3 5.2 7.2 4.7 5.5Malaysia 1.7 2.2 2.2 3.0 3.0Philippines 3.2 3.6 3.0 3.8 3.5Singapore 4.5 3.8 3.2 3.0 3.0Thailand 3.0 3.2 2.6 3.1 2.9Viet Nam 9.2 7.5 6.5 8.2 7.2
The Pacific 4.3 6.1 5.7 6.3 6.0
Fiji 4.3 4.5 2.7 4.0 2.5Papua New Guinea 2.2 6.5 6.0 7.5 7.5
Developing Asia 3.7 4.0 3.6 4.2 3.7
(continued from the previous page)Kiribati, the Marshall Islands, the Federated States of Micronesia, Nauru, Papua New Guinea, Palau, Samoa, Solomon Islands, Timor-Leste, Tonga, Tuvalu, and Vanuatu.
Data for Bangladesh, India, and Pakistan are recorded on a fiscal-year basis. For India, the fiscal year spans the current year’s April through the next year’s March. For Bangladesh and Pakistan, the fiscal year spans the previous year’s July through the current year’s June.


1Time for
vigilanceand reform

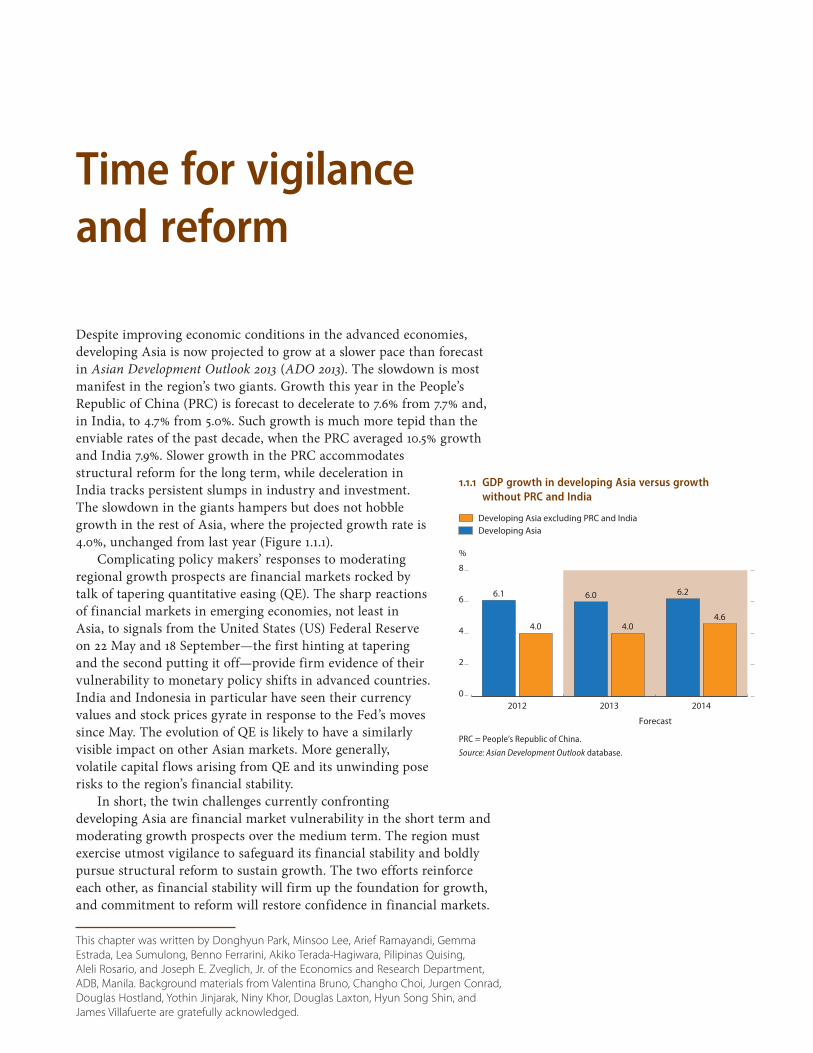
Despite improving economic conditions in the advanced economies, developing Asia is now projected to grow at a slower pace than forecast in Asian Development Outlook 2013 (ADO 2013). The slowdown is most manifest in the region’s two giants. Growth this year in the People’s Republic of China (PRC) is forecast to decelerate to 7.6% from 7.7% and, in India, to 4.7% from 5.0%. Such growth is much more tepid than the enviable rates of the past decade, when the PRC averaged 10.5% growth and India 7.9%. Slower growth in the PRC accommodates structural reform for the long term, while deceleration in India tracks persistent slumps in industry and investment. The slowdown in the giants hampers but does not hobble growth in the rest of Asia, where the projected growth rate is 4.0%, unchanged from last year (Figure 1.1.1).
Complicating policy makers’ responses to moderating regional growth prospects are financial markets rocked by talk of tapering quantitative easing (QE). The sharp reactions of financial markets in emerging economies, not least in Asia, to signals from the United States (US) Federal Reserve on 22 May and 18 September—the first hinting at tapering and the second putting it off—provide firm evidence of their vulnerability to monetary policy shifts in advanced countries. India and Indonesia in particular have seen their currency values and stock prices gyrate in response to the Fed’s moves since May. The evolution of QE is likely to have a similarly visible impact on other Asian markets. More generally, volatile capital flows arising from QE and its unwinding pose risks to the region’s financial stability.
In short, the twin challenges currently confronting developing Asia are financial market vulnerability in the short term and moderating growth prospects over the medium term. The region must exercise utmost vigilance to safeguard its financial stability and boldly pursue structural reform to sustain growth. The two efforts reinforce each other, as financial stability will firm up the foundation for growth, and commitment to reform will restore confidence in financial markets.
Time for vigilance and reform
This chapter was written by Donghyun Park, Minsoo Lee, Arief Ramayandi, Gemma
Estrada, Lea Sumulong, Benno Ferrarini, Akiko Terada-Hagiwara, Pilipinas Quising,
Aleli Rosario, and Joseph E. Zveglich, Jr. of the Economics and Research Department,
ADB, Manila. Background materials from Valentina Bruno, Changho Choi, Jurgen Conrad,
Douglas Hostland, Yothin Jinjarak, Niny Khor, Douglas Laxton, Hyun Song Shin, and
James Villafuerte are gratefully acknowledged.
1.1.1 GDP growth in developing Asia versus growth without PRC and India
0
2
4
6
8
Developing Asia excluding PRC and IndiaDeveloping Asia
201420132012
%
Forecast
6.1
4.6
6.2
4.0
6.0
4.0
PRC = People’s Republic of China.
Source: Asian Development Outlook database.
4 Asian Development Outlook 2013 Update
Developing Asia’s growth– slower than expected
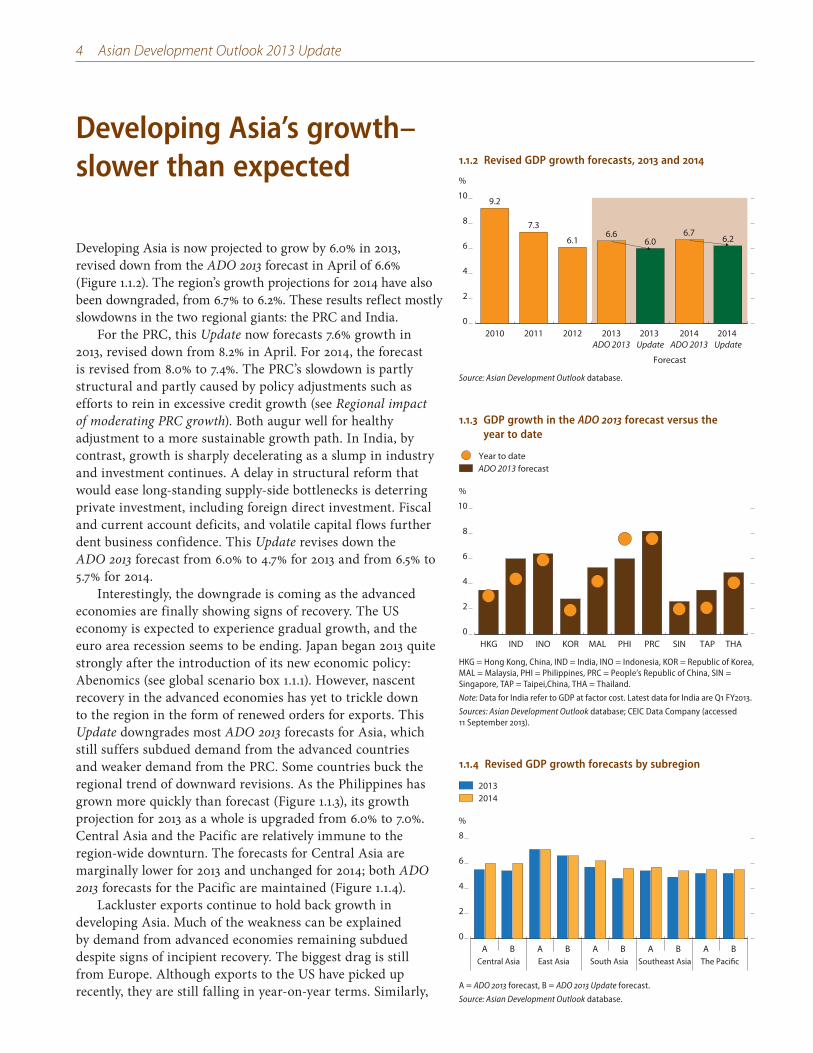
Developing Asia is now projected to grow by 6.0% in 2013, revised down from the ADO 2013 forecast in April of 6.6% (Figure 1.1.2). The region’s growth projections for 2014 have also been downgraded, from 6.7% to 6.2%. These results reflect mostly slowdowns in the two regional giants: the PRC and India.
For the PRC, this Update now forecasts 7.6% growth in 2013, revised down from 8.2% in April. For 2014, the forecast is revised from 8.0% to 7.4%. The PRC’s slowdown is partly structural and partly caused by policy adjustments such as efforts to rein in excessive credit growth (see Regional impact of moderating PRC growth). Both augur well for healthy adjustment to a more sustainable growth path. In India, by contrast, growth is sharply decelerating as a slump in industry and investment continues. A delay in structural reform that would ease long-standing supply-side bottlenecks is deterring private investment, including foreign direct investment. Fiscal and current account deficits, and volatile capital flows further dent business confidence. This Update revises down the ADO 2013 forecast from 6.0% to 4.7% for 2013 and from 6.5% to 5.7% for 2014.
Interestingly, the downgrade is coming as the advanced economies are finally showing signs of recovery. The US economy is expected to experience gradual growth, and the euro area recession seems to be ending. Japan began 2013 quite strongly after the introduction of its new economic policy: Abenomics (see global scenario box 1.1.1). However, nascent recovery in the advanced economies has yet to trickle down to the region in the form of renewed orders for exports. This Update downgrades most ADO 2013 forecasts for Asia, which still suffers subdued demand from the advanced countries and weaker demand from the PRC. Some countries buck the regional trend of downward revisions. As the Philippines has grown more quickly than forecast (Figure 1.1.3), its growth projection for 2013 as a whole is upgraded from 6.0% to 7.0%. Central Asia and the Pacific are relatively immune to the region-wide downturn. The forecasts for Central Asia are marginally lower for 2013 and unchanged for 2014; both ADO 2013 forecasts for the Pacific are maintained (Figure 1.1.4).
Lackluster exports continue to hold back growth in developing Asia. Much of the weakness can be explained by demand from advanced economies remaining subdued despite signs of incipient recovery. The biggest drag is still from Europe. Although exports to the US have picked up recently, they are still falling in year-on-year terms. Similarly,
1.1.2 Revised GDP growth forecasts, 2013 and 2014
0
2
4
6
8
10
2014 Update
2014ADO 2013
2013 Update
2013ADO 2013
201220112010
%
Forecast
9.2
7.3
6.16.6
6.06.7
6.2
Source: Asian Development Outlook database.
1.1.3 GDP growth in the ADO 2013 forecast versus the year to date
Year to dateADO 2013 forecast
0
2
4
6
8
10
THATAP SIN PRCPHIMAL KORINOINDHKG
%
HKG = Hong Kong, China, IND = India, INO = Indonesia, KOR = Republic of Korea, MAL = Malaysia, PHI = Philippines, PRC = People’s Republic of China, SIN = Singapore, TAP = Taipei,China, THA = Thailand.
Note: Data for India refer to GDP at factor cost. Latest data for India are Q1 FY2013.
Sources: Asian Development Outlook database; CEIC Data Company (accessed 11 September 2013).
1.1.4 Revised GDP growth forecasts by subregion
0
2
4
6
8
20142013
BABABABABA
%
Central Asia East Asia South Asia Southeast Asia The Pacific
A = ADO 2013 forecast, B = ADO 2013 Update forecast.
Source: Asian Development Outlook database.
Time for vigilance and reform 5
1.1.1 Industrial economies stir
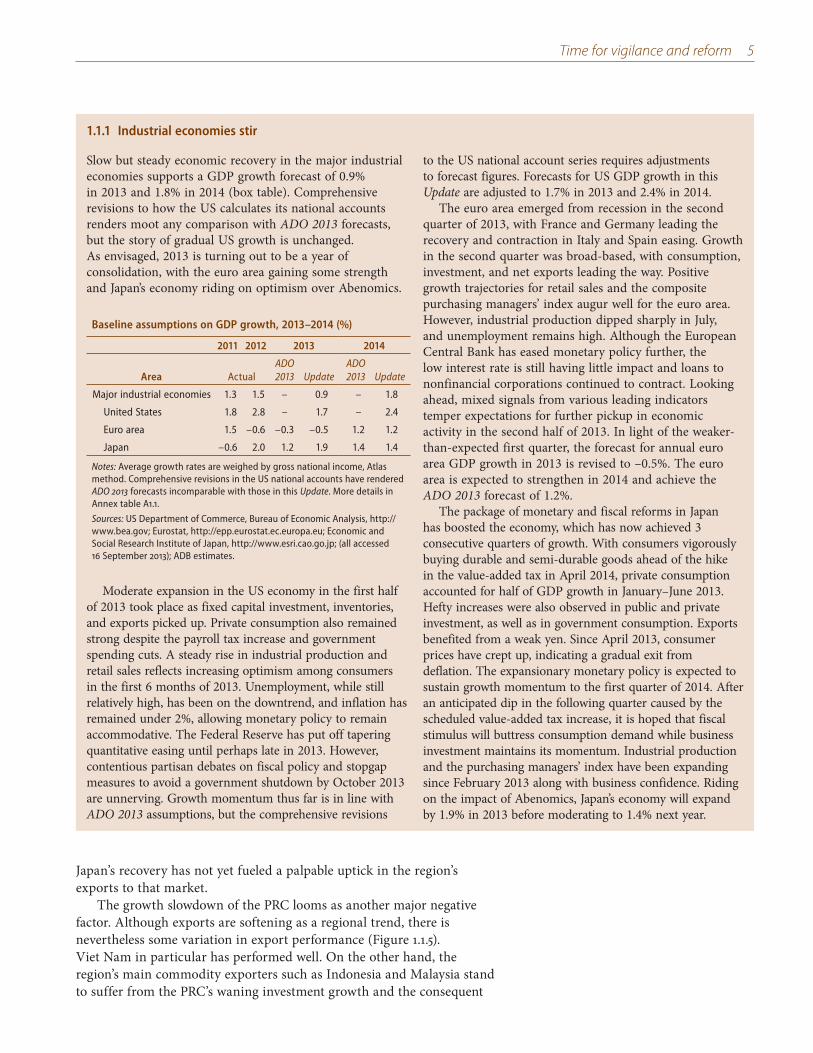
Slow but steady economic recovery in the major industrial economies supports a GDP growth forecast of 0.9% in 2013 and 1.8% in 2014 (box table). Comprehensive revisions to how the US calculates its national accounts renders moot any comparison with ADO 2013 forecasts, but the story of gradual US growth is unchanged. As envisaged, 2013 is turning out to be a year of consolidation, with the euro area gaining some strength and Japan’s economy riding on optimism over Abenomics.
Moderate expansion in the US economy in the first half of 2013 took place as fixed capital investment, inventories, and exports picked up. Private consumption also remained strong despite the payroll tax increase and government spending cuts. A steady rise in industrial production and retail sales reflects increasing optimism among consumers in the first 6 months of 2013. Unemployment, while still relatively high, has been on the downtrend, and inflation has remained under 2%, allowing monetary policy to remain accommodative. The Federal Reserve has put off tapering quantitative easing until perhaps late in 2013. However, contentious partisan debates on fiscal policy and stopgap measures to avoid a government shutdown by October 2013 are unnerving. Growth momentum thus far is in line with ADO 2013 assumptions, but the comprehensive revisions
to the US national account series requires adjustments to forecast figures. Forecasts for US GDP growth in this Update are adjusted to 1.7% in 2013 and 2.4% in 2014.
The euro area emerged from recession in the second quarter of 2013, with France and Germany leading the recovery and contraction in Italy and Spain easing. Growth in the second quarter was broad-based, with consumption, investment, and net exports leading the way. Positive growth trajectories for retail sales and the composite purchasing managers’ index augur well for the euro area. However, industrial production dipped sharply in July, and unemployment remains high. Although the European Central Bank has eased monetary policy further, the low interest rate is still having little impact and loans to nonfinancial corporations continued to contract. Looking ahead, mixed signals from various leading indicators temper expectations for further pickup in economic activity in the second half of 2013. In light of the weaker-than-expected first quarter, the forecast for annual euro area GDP growth in 2013 is revised to –0.5%. The euro area is expected to strengthen in 2014 and achieve the ADO 2013 forecast of 1.2%.
The package of monetary and fiscal reforms in Japan has boosted the economy, which has now achieved 3 consecutive quarters of growth. With consumers vigorously buying durable and semi-durable goods ahead of the hike in the value-added tax in April 2014, private consumption accounted for half of GDP growth in January–June 2013. Hefty increases were also observed in public and private investment, as well as in government consumption. Exports benefited from a weak yen. Since April 2013, consumer prices have crept up, indicating a gradual exit from deflation. The expansionary monetary policy is expected to sustain growth momentum to the first quarter of 2014. After an anticipated dip in the following quarter caused by the scheduled value-added tax increase, it is hoped that fiscal stimulus will buttress consumption demand while business investment maintains its momentum. Industrial production and the purchasing managers’ index have been expanding since February 2013 along with business confidence. Riding on the impact of Abenomics, Japan’s economy will expand by 1.9% in 2013 before moderating to 1.4% next year.
Baseline assumptions on GDP growth, 2013–2014 (%)
2011 2012 2013 2014
Area ActualADO 2013 Update
ADO 2013 Update
Major industrial economies 1.3 1.5 – 0.9 – 1.8
United States 1.8 2.8 – 1.7 – 2.4
Euro area 1.5 –0.6 –0.3 –0.5 1.2 1.2
Japan –0.6 2.0 1.2 1.9 1.4 1.4
Notes: Average growth rates are weighed by gross national income, Atlas method. Comprehensive revisions in the US national accounts have rendered ADO 2013 forecasts incomparable with those in this Update. More details in Annex table A1.1.
Sources: US Department of Commerce, Bureau of Economic Analysis, http://www.bea.gov; Eurostat, http://epp.eurostat.ec.europa.eu; Economic and Social Research Institute of Japan, http://www.esri.cao.go.jp; (all accessed 16 September 2013); ADB estimates.
Japan’s recovery has not yet fueled a palpable uptick in the region’s exports to that market.
The growth slowdown of the PRC looms as another major negative factor. Although exports are softening as a regional trend, there is nevertheless some variation in export performance (Figure 1.1.5). Viet Nam in particular has performed well. On the other hand, the region’s main commodity exporters such as Indonesia and Malaysia stand to suffer from the PRC’s waning investment growth and the consequent
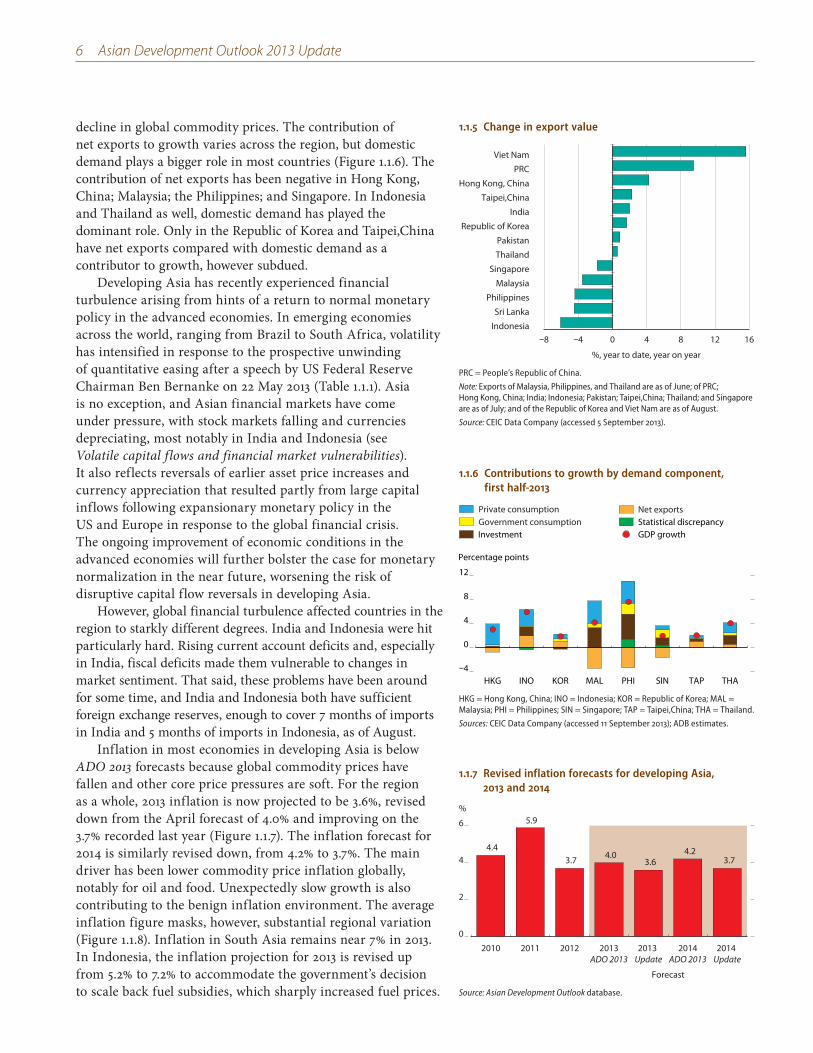
6 Asian Development Outlook 2013 Update
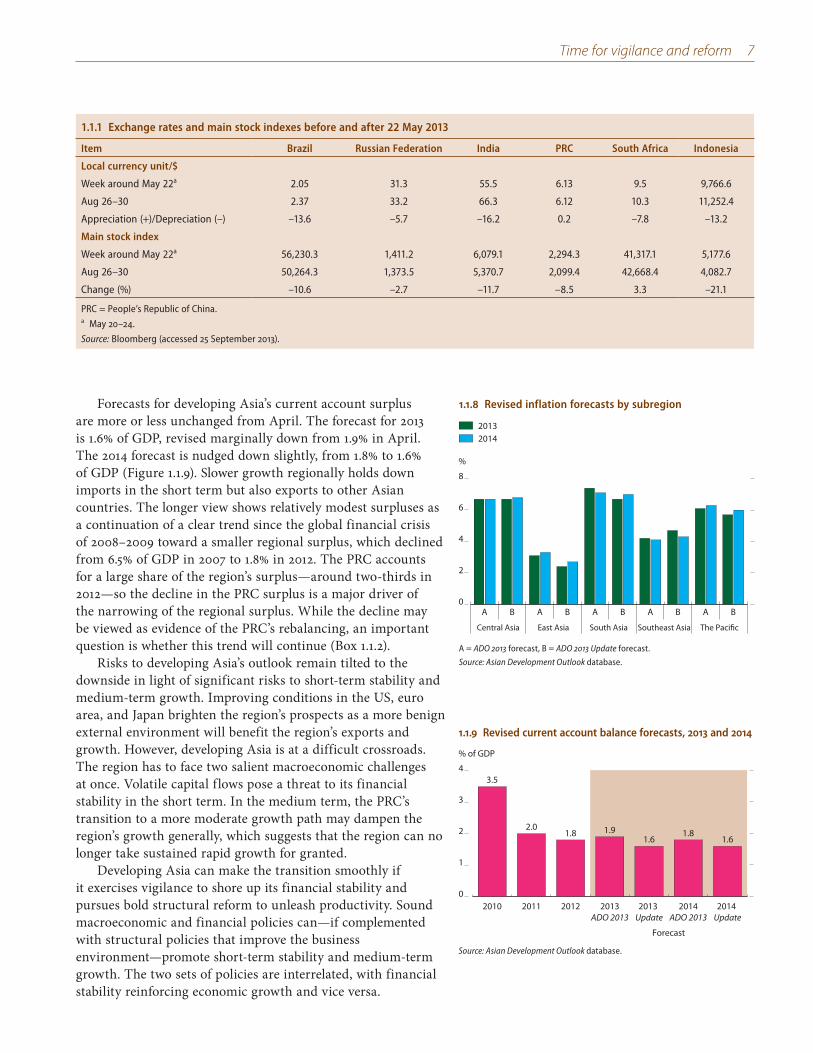
decline in global commodity prices. The contribution of net exports to growth varies across the region, but domestic demand plays a bigger role in most countries (Figure 1.1.6). The contribution of net exports has been negative in Hong Kong, China; Malaysia; the Philippines; and Singapore. In Indonesia and Thailand as well, domestic demand has played the dominant role. Only in the Republic of Korea and Taipei,China have net exports compared with domestic demand as a contributor to growth, however subdued.
Developing Asia has recently experienced financial turbulence arising from hints of a return to normal monetary policy in the advanced economies. In emerging economies across the world, ranging from Brazil to South Africa, volatility has intensified in response to the prospective unwinding of quantitative easing after a speech by US Federal Reserve Chairman Ben Bernanke on 22 May 2013 (Table 1.1.1). Asia is no exception, and Asian financial markets have come under pressure, with stock markets falling and currencies depreciating, most notably in India and Indonesia (see Volatile capital flows and financial market vulnerabilities). It also reflects reversals of earlier asset price increases and currency appreciation that resulted partly from large capital inflows following expansionary monetary policy in the US and Europe in response to the global financial crisis. The ongoing improvement of economic conditions in the advanced economies will further bolster the case for monetary normalization in the near future, worsening the risk of disruptive capital flow reversals in developing Asia.
However, global financial turbulence affected countries in the region to starkly different degrees. India and Indonesia were hit particularly hard. Rising current account deficits and, especially in India, fiscal deficits made them vulnerable to changes in market sentiment. That said, these problems have been around for some time, and India and Indonesia both have sufficient foreign exchange reserves, enough to cover 7 months of imports in India and 5 months of imports in Indonesia, as of August.
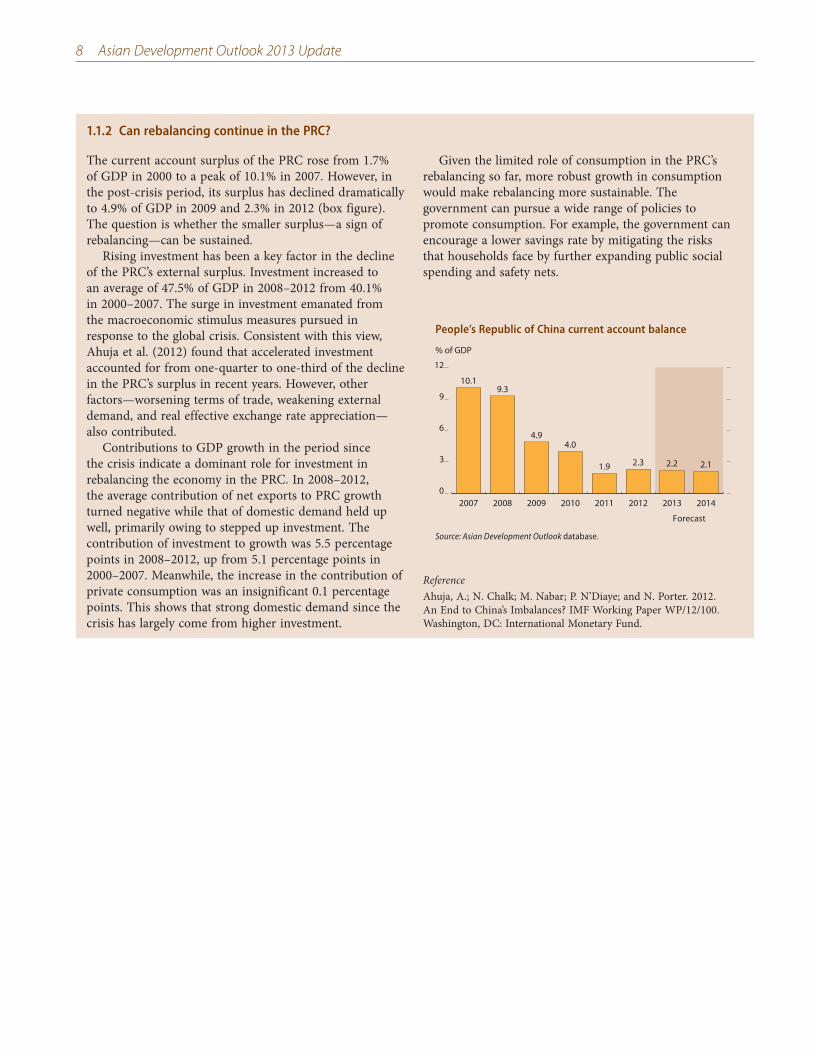
Inflation in most economies in developing Asia is below ADO 2013 forecasts because global commodity prices have fallen and other core price pressures are soft. For the region as a whole, 2013 inflation is now projected to be 3.6%, revised down from the April forecast of 4.0% and improving on the 3.7% recorded last year (Figure 1.1.7). The inflation forecast for 2014 is similarly revised down, from 4.2% to 3.7%. The main driver has been lower commodity price inflation globally, notably for oil and food. Unexpectedly slow growth is also contributing to the benign inflation environment. The average inflation figure masks, however, substantial regional variation (Figure 1.1.8). Inflation in South Asia remains near 7% in 2013. In Indonesia, the inflation projection for 2013 is revised up from 5.2% to 7.2% to accommodate the government’s decision to scale back fuel subsidies, which sharply increased fuel prices.
1.1.5 Change in export value
–8 –4 0 4 8 12 16Indonesia
Sri Lanka
Philippines
Malaysia
Singapore
Thailand
Pakistan
Republic of Korea
India
Taipei,China
Hong Kong, China
PRC
Viet Nam
%, year to date, year on year
PRC = People’s Republic of China.
Note: Exports of Malaysia, Philippines, and Thailand are as of June; of PRC; Hong Kong, China; India; Indonesia; Pakistan; Taipei,China; Thailand; and Singapore are as of July; and of the Republic of Korea and Viet Nam are as of August.
Source: CEIC Data Company (accessed 5 September 2013).
1.1.6 Contributions to growth by demand component, first half-2013
–4
0
4
8
12
HKG INO KOR MAL PHI SIN TAP THA
Percentage points
Government consumptionInvestment
Net exportsStatistical discrepancyGDP growth
Private consumption
HKG = Hong Kong, China; INO = Indonesia; KOR = Republic of Korea; MAL = Malaysia; PHI = Philippines; SIN = Singapore; TAP = Taipei,China; THA = Thailand.
Sources: CEIC Data Company (accessed 11 September 2013); ADB estimates.
1.1.7 Revised inflation forecasts for developing Asia, 2013 and 2014
0
2
4
6
2014 Update
2014ADO 2013
2013 Update
2013ADO 2013
201220112010
%
Forecast
4.4
5.9
3.7 4.03.6
4.23.7
Source: Asian Development Outlook database.
Time for vigilance and reform 7
1.1.1 Exchange rates and main stock indexes before and after 22 May 2013
Item Brazil Russian Federation India PRC South Africa Indonesia
Local currency unit/$
Week around May 22a 2.05 31.3 55.5 6.13 9.5 9,766.6
Aug 26–30 2.37 33.2 66.3 6.12 10.3 11,252.4
Appreciation (+)/Depreciation (–) –13.6 –5.7 –16.2 0.2 –7.8 –13.2
Main stock index
Week around May 22a 56,230.3 1,411.2 6,079.1 2,294.3 41,317.1 5,177.6
Aug 26–30 50,264.3 1,373.5 5,370.7 2,099.4 42,668.4 4,082.7
Change (%) –10.6 –2.7 –11.7 –8.5 3.3 –21.1
PRC = People’s Republic of China.a May 20–24.
Source: Bloomberg (accessed 25 September 2013).
Forecasts for developing Asia’s current account surplus are more or less unchanged from April. The forecast for 2013 is 1.6% of GDP, revised marginally down from 1.9% in April. The 2014 forecast is nudged down slightly, from 1.8% to 1.6% of GDP (Figure 1.1.9). Slower growth regionally holds down imports in the short term but also exports to other Asian countries. The longer view shows relatively modest surpluses as a continuation of a clear trend since the global financial crisis of 2008–2009 toward a smaller regional surplus, which declined from 6.5% of GDP in 2007 to 1.8% in 2012. The PRC accounts for a large share of the region’s surplus—around two-thirds in 2012—so the decline in the PRC surplus is a major driver of the narrowing of the regional surplus. While the decline may be viewed as evidence of the PRC’s rebalancing, an important question is whether this trend will continue (Box 1.1.2).
Risks to developing Asia’s outlook remain tilted to the downside in light of significant risks to short-term stability and medium-term growth. Improving conditions in the US, euro area, and Japan brighten the region’s prospects as a more benign external environment will benefit the region’s exports and growth. However, developing Asia is at a difficult crossroads. The region has to face two salient macroeconomic challenges at once. Volatile capital flows pose a threat to its financial stability in the short term. In the medium term, the PRC’s transition to a more moderate growth path may dampen the region’s growth generally, which suggests that the region can no longer take sustained rapid growth for granted.
Developing Asia can make the transition smoothly if it exercises vigilance to shore up its financial stability and pursues bold structural reform to unleash productivity. Sound macroeconomic and financial policies can—if complemented with structural policies that improve the business environment—promote short-term stability and medium-term growth. The two sets of policies are interrelated, with financial stability reinforcing economic growth and vice versa.
1.1.8 Revised inflation forecasts by subregion
0
2
4
6
8
BABABABABA
%
Central Asia East Asia South Asia Southeast Asia The Pacific
20142013
A = ADO 2013 forecast, B = ADO 2013 Update forecast.
Source: Asian Development Outlook database.
1.1.9 Revised current account balance forecasts, 2013 and 2014
0
1
2
3
4
2014 Update
2014ADO 2013
2013 Update
2013ADO 2013
201220112010
% of GDP
Forecast
3.5
1.91.6
1.81.6
1.82.0
Source: Asian Development Outlook database.
8 Asian Development Outlook 2013 Update
1.1.2 Can rebalancing continue in the PRC?
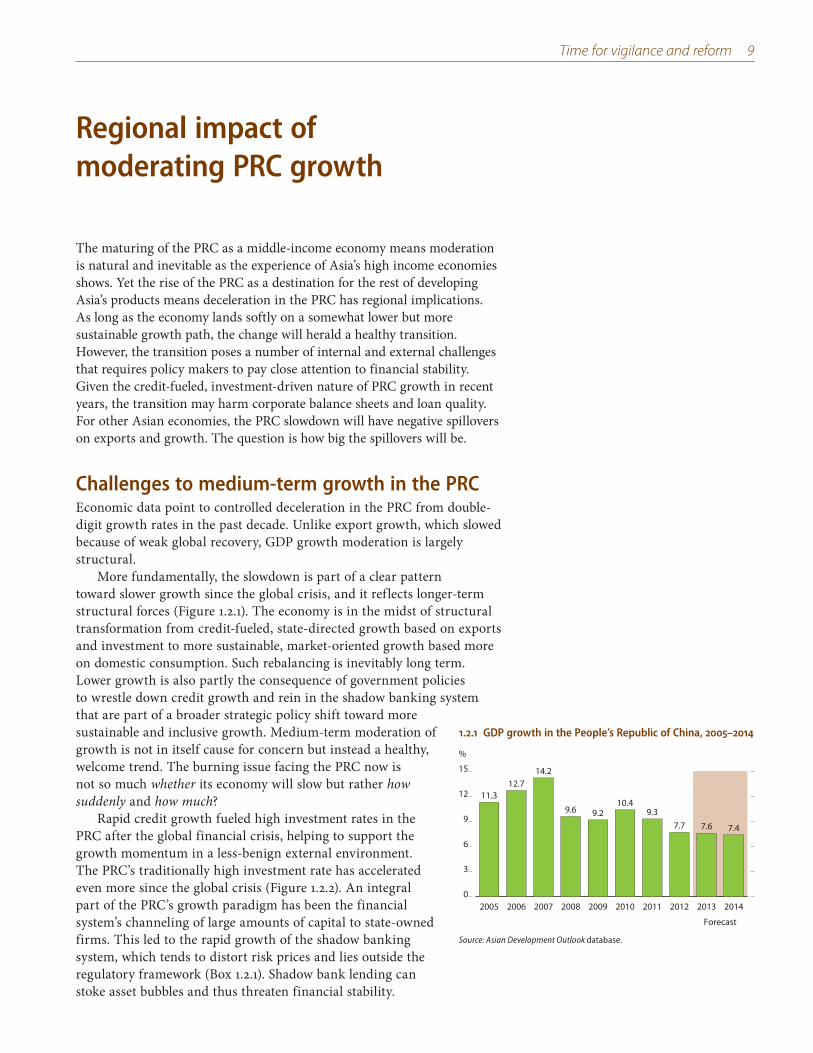
The current account surplus of the PRC rose from 1.7% of GDP in 2000 to a peak of 10.1% in 2007. However, in the post-crisis period, its surplus has declined dramatically to 4.9% of GDP in 2009 and 2.3% in 2012 (box figure). The question is whether the smaller surplus—a sign of rebalancing—can be sustained.
Rising investment has been a key factor in the decline of the PRC’s external surplus. Investment increased to an average of 47.5% of GDP in 2008–2012 from 40.1% in 2000–2007. The surge in investment emanated from the macroeconomic stimulus measures pursued in response to the global crisis. Consistent with this view, Ahuja et al. (2012) found that accelerated investment accounted for from one-quarter to one-third of the decline in the PRC’s surplus in recent years. However, other factors—worsening terms of trade, weakening external demand, and real effective exchange rate appreciation—also contributed.
Contributions to GDP growth in the period since the crisis indicate a dominant role for investment in rebalancing the economy in the PRC. In 2008–2012, the average contribution of net exports to PRC growth turned negative while that of domestic demand held up well, primarily owing to stepped up investment. The contribution of investment to growth was 5.5 percentage points in 2008–2012, up from 5.1 percentage points in 2000–2007. Meanwhile, the increase in the contribution of private consumption was an insignificant 0.1 percentage points. This shows that strong domestic demand since the crisis has largely come from higher investment.
Given the limited role of consumption in the PRC’s rebalancing so far, more robust growth in consumption would make rebalancing more sustainable. The government can pursue a wide range of policies to promote consumption. For example, the government can encourage a lower savings rate by mitigating the risks that households face by further expanding public social spending and safety nets.
ReferenceAhuja, A.; N. Chalk; M. Nabar; P. N’Diaye; and N. Porter. 2012. An End to China’s Imbalances? IMF Working Paper WP/12/100. Washington, DC: International Monetary Fund.
People’s Republic of China current account balance
0
3
6
9
12
20142013201220112010200920082007
% of GDP
Forecast
10.19.3
2.12.22.31.9
4.04.9
Source: Asian Development Outlook database.
Time for vigilance and reform 9
Regional impact of moderating PRC growth
The maturing of the PRC as a middle-income economy means moderation is natural and inevitable as the experience of Asia’s high income economies shows. Yet the rise of the PRC as a destination for the rest of developing Asia’s products means deceleration in the PRC has regional implications. As long as the economy lands softly on a somewhat lower but more sustainable growth path, the change will herald a healthy transition. However, the transition poses a number of internal and external challenges that requires policy makers to pay close attention to financial stability. Given the credit-fueled, investment-driven nature of PRC growth in recent years, the transition may harm corporate balance sheets and loan quality. For other Asian economies, the PRC slowdown will have negative spillovers on exports and growth. The question is how big the spillovers will be.
Challenges to medium-term growth in the PRCEconomic data point to controlled deceleration in the PRC from double-digit growth rates in the past decade. Unlike export growth, which slowed because of weak global recovery, GDP growth moderation is largely structural.
More fundamentally, the slowdown is part of a clear pattern toward slower growth since the global crisis, and it reflects longer-term structural forces (Figure 1.2.1). The economy is in the midst of structural transformation from credit-fueled, state-directed growth based on exports and investment to more sustainable, market-oriented growth based more on domestic consumption. Such rebalancing is inevitably long term. Lower growth is also partly the consequence of government policies to wrestle down credit growth and rein in the shadow banking system that are part of a broader strategic policy shift toward more sustainable and inclusive growth. Medium-term moderation of growth is not in itself cause for concern but instead a healthy, welcome trend. The burning issue facing the PRC now is not so much whether its economy will slow but rather how suddenly and how much?
Rapid credit growth fueled high investment rates in the PRC after the global financial crisis, helping to support the growth momentum in a less-benign external environment. The PRC’s traditionally high investment rate has accelerated even more since the global crisis (Figure 1.2.2). An integral part of the PRC’s growth paradigm has been the financial system’s channeling of large amounts of capital to state-owned firms. This led to the rapid growth of the shadow banking system, which tends to distort risk prices and lies outside the regulatory framework (Box 1.2.1). Shadow bank lending can stoke asset bubbles and thus threaten financial stability.
1.2.1 GDP growth in the People’s Republic of China, 2005–2014
0
3
6
9
12
15
2014201320122011201020092008200720062005
%
Forecast
11.3
7.47.67.79.3
10.49.29.6
14.212.7
Source: Asian Development Outlook database.
10 Asian Development Outlook 2013 Update
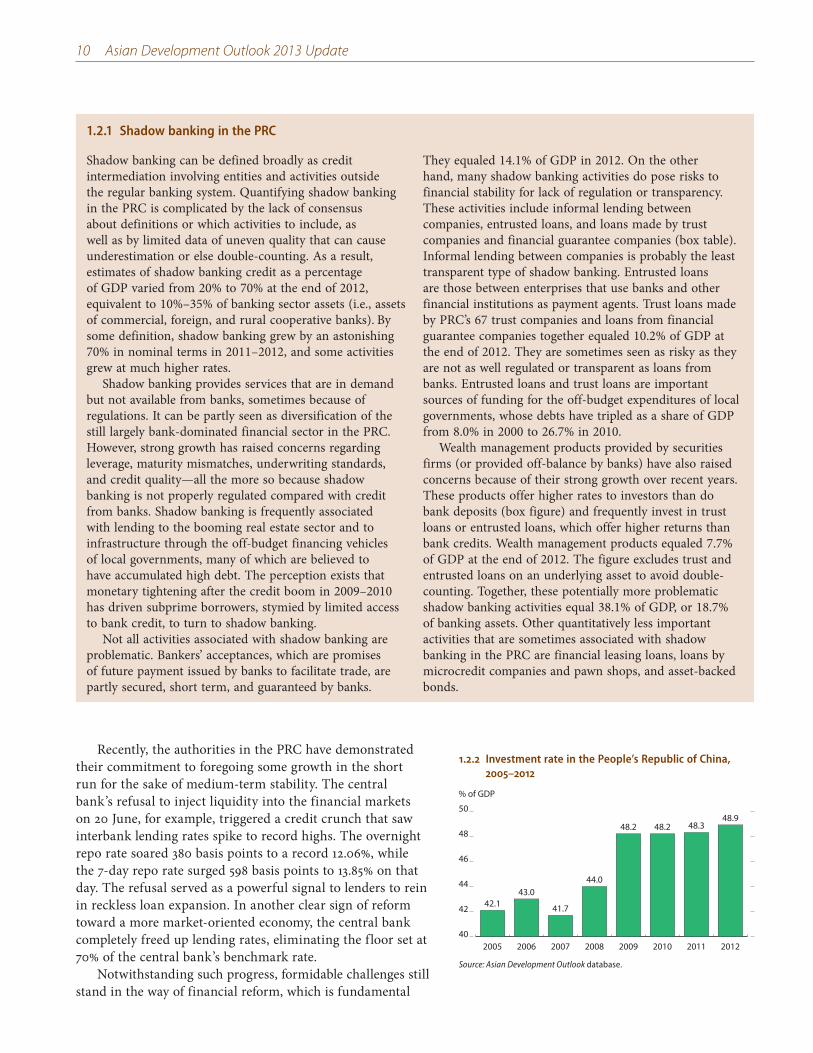
Recently, the authorities in the PRC have demonstrated their commitment to foregoing some growth in the short run for the sake of medium-term stability. The central bank’s refusal to inject liquidity into the financial markets on 20 June, for example, triggered a credit crunch that saw interbank lending rates spike to record highs. The overnight repo rate soared 380 basis points to a record 12.06%, while the 7-day repo rate surged 598 basis points to 13.85% on that day. The refusal served as a powerful signal to lenders to rein in reckless loan expansion. In another clear sign of reform toward a more market-oriented economy, the central bank completely freed up lending rates, eliminating the floor set at 70% of the central bank’s benchmark rate.
Notwithstanding such progress, formidable challenges still stand in the way of financial reform, which is fundamental
1.2.2 Investment rate in the People’s Republic of China, 2005–2012
40
42
44
46
48
50
20122011201020092008200720062005
% of GDP
42.1
48.948.348.248.2
44.0
41.7
43.0
Source: Asian Development Outlook database.
1.2.1 Shadow banking in the PRC
Shadow banking can be defined broadly as credit intermediation involving entities and activities outside the regular banking system. Quantifying shadow banking in the PRC is complicated by the lack of consensus about definitions or which activities to include, as well as by limited data of uneven quality that can cause underestimation or else double-counting. As a result, estimates of shadow banking credit as a percentage of GDP varied from 20% to 70% at the end of 2012, equivalent to 10%–35% of banking sector assets (i.e., assets of commercial, foreign, and rural cooperative banks). By some definition, shadow banking grew by an astonishing 70% in nominal terms in 2011–2012, and some activities grew at much higher rates.
Shadow banking provides services that are in demand but not available from banks, sometimes because of regulations. It can be partly seen as diversification of the still largely bank-dominated financial sector in the PRC. However, strong growth has raised concerns regarding leverage, maturity mismatches, underwriting standards, and credit quality—all the more so because shadow banking is not properly regulated compared with credit from banks. Shadow banking is frequently associated with lending to the booming real estate sector and to infrastructure through the off-budget financing vehicles of local governments, many of which are believed to have accumulated high debt. The perception exists that monetary tightening after the credit boom in 2009–2010 has driven subprime borrowers, stymied by limited access to bank credit, to turn to shadow banking.
Not all activities associated with shadow banking are problematic. Bankers’ acceptances, which are promises of future payment issued by banks to facilitate trade, are partly secured, short term, and guaranteed by banks.
They equaled 14.1% of GDP in 2012. On the other hand, many shadow banking activities do pose risks to financial stability for lack of regulation or transparency. These activities include informal lending between companies, entrusted loans, and loans made by trust companies and financial guarantee companies (box table). Informal lending between companies is probably the least transparent type of shadow banking. Entrusted loans are those between enterprises that use banks and other financial institutions as payment agents. Trust loans made by PRC’s 67 trust companies and loans from financial guarantee companies together equaled 10.2% of GDP at the end of 2012. They are sometimes seen as risky as they are not as well regulated or transparent as loans from banks. Entrusted loans and trust loans are important sources of funding for the off-budget expenditures of local governments, whose debts have tripled as a share of GDP from 8.0% in 2000 to 26.7% in 2010.
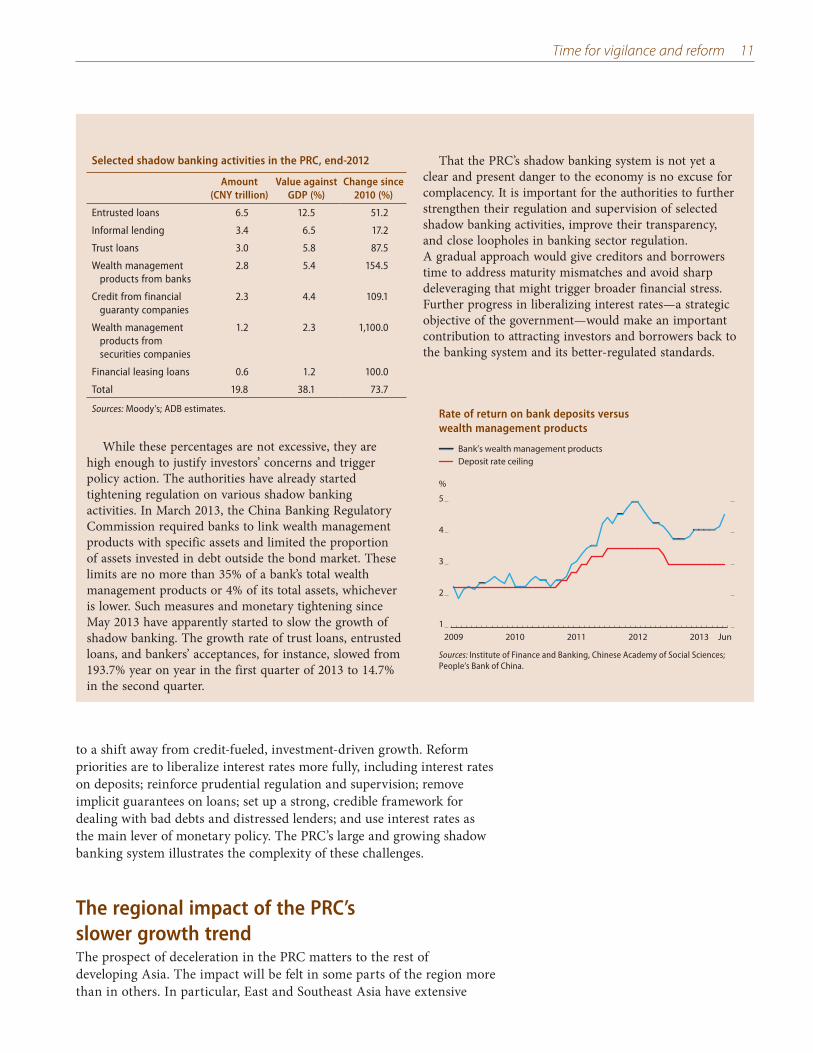
Wealth management products provided by securities firms (or provided off-balance by banks) have also raised concerns because of their strong growth over recent years. These products offer higher rates to investors than do bank deposits (box figure) and frequently invest in trust loans or entrusted loans, which offer higher returns than bank credits. Wealth management products equaled 7.7% of GDP at the end of 2012. The figure excludes trust and entrusted loans on an underlying asset to avoid double-counting. Together, these potentially more problematic shadow banking activities equal 38.1% of GDP, or 18.7% of banking assets. Other quantitatively less important activities that are sometimes associated with shadow banking in the PRC are financial leasing loans, loans by microcredit companies and pawn shops, and asset-backed bonds.
Time for vigilance and reform 11
While these percentages are not excessive, they are high enough to justify investors’ concerns and trigger policy action. The authorities have already started tightening regulation on various shadow banking activities. In March 2013, the China Banking Regulatory Commission required banks to link wealth management products with specific assets and limited the proportion of assets invested in debt outside the bond market. These limits are no more than 35% of a bank’s total wealth management products or 4% of its total assets, whichever is lower. Such measures and monetary tightening since May 2013 have apparently started to slow the growth of shadow banking. The growth rate of trust loans, entrusted loans, and bankers’ acceptances, for instance, slowed from 193.7% year on year in the first quarter of 2013 to 14.7% in the second quarter.
Rate of return on bank deposits versus wealth management products
1
2
3
4
5
Jun20132012201120102009
%
Deposit rate ceilingBank’s wealth management products
Sources: Institute of Finance and Banking, Chinese Academy of Social Sciences; People’s Bank of China.
That the PRC’s shadow banking system is not yet a clear and present danger to the economy is no excuse for complacency. It is important for the authorities to further strengthen their regulation and supervision of selected shadow banking activities, improve their transparency, and close loopholes in banking sector regulation. A gradual approach would give creditors and borrowers time to address maturity mismatches and avoid sharp deleveraging that might trigger broader financial stress. Further progress in liberalizing interest rates—a strategic objective of the government—would make an important contribution to attracting investors and borrowers back to the banking system and its better-regulated standards.
Selected shadow banking activities in the PRC, end-2012
Amount(CNY trillion)
Value against GDP (%)
Change since 2010 (%)
Entrusted loans 6.5 12.5 51.2
Informal lending 3.4 6.5 17.2
Trust loans 3.0 5.8 87.5
Wealth management products from banks
2.8 5.4 154.5
Credit from financial guaranty companies
2.3 4.4 109.1
Wealth management products from securities companies
1.2 2.3 1,100.0
Financial leasing loans 0.6 1.2 100.0
Total 19.8 38.1 73.7
Sources: Moody’s; ADB estimates.
to a shift away from credit-fueled, investment-driven growth. Reform priorities are to liberalize interest rates more fully, including interest rates on deposits; reinforce prudential regulation and supervision; remove implicit guarantees on loans; set up a strong, credible framework for dealing with bad debts and distressed lenders; and use interest rates as the main lever of monetary policy. The PRC’s large and growing shadow banking system illustrates the complexity of these challenges.
The regional impact of the PRC’s slower growth trendThe prospect of deceleration in the PRC matters to the rest of developing Asia. The impact will be felt in some parts of the region more than in others. In particular, East and Southeast Asia have extensive
12 Asian Development Outlook 2013 Update
economic links with the PRC, while South Asia’s links are much more limited. Following sustained fast growth over the past 3 decades, the PRC has emerged as a potential engine of growth for the region. There is plenty of anecdotal evidence and some econometric evidence that a robust PRC helped to cushion the blow of a weakened global environment (Park and Shin 2009).
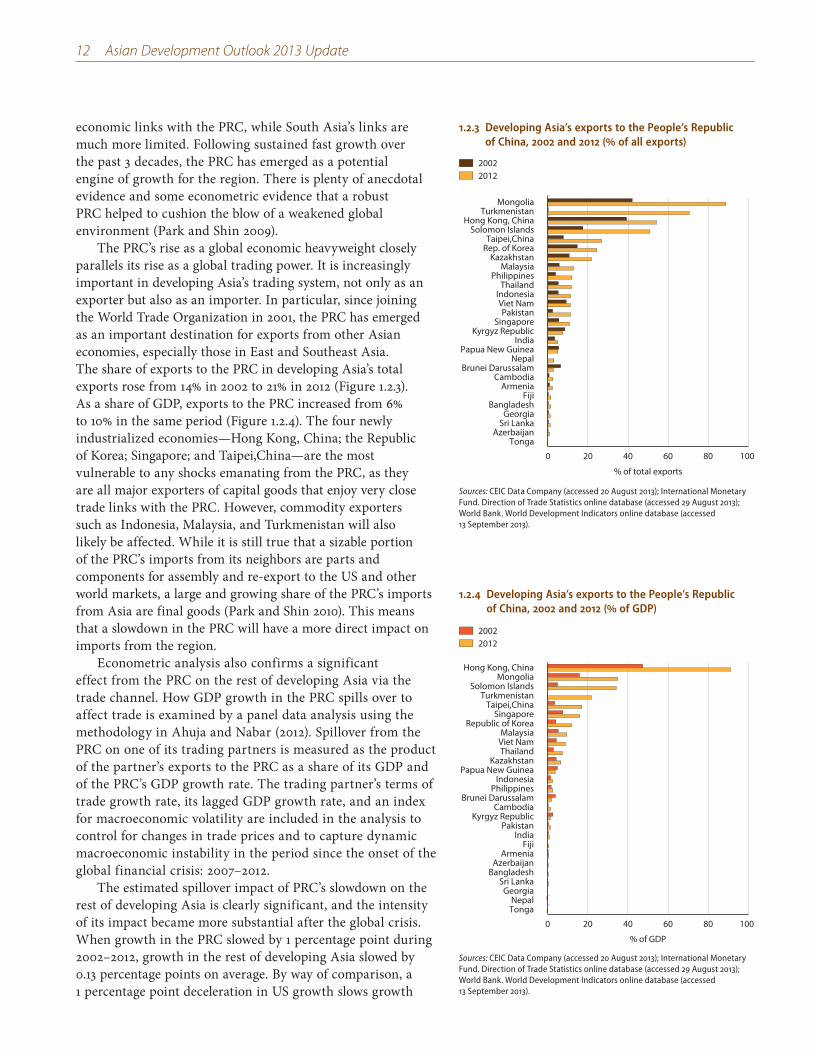
The PRC’s rise as a global economic heavyweight closely parallels its rise as a global trading power. It is increasingly important in developing Asia’s trading system, not only as an exporter but also as an importer. In particular, since joining the World Trade Organization in 2001, the PRC has emerged as an important destination for exports from other Asian economies, especially those in East and Southeast Asia. The share of exports to the PRC in developing Asia’s total exports rose from 14% in 2002 to 21% in 2012 (Figure 1.2.3). As a share of GDP, exports to the PRC increased from 6% to 10% in the same period (Figure 1.2.4). The four newly industrialized economies—Hong Kong, China; the Republic of Korea; Singapore; and Taipei,China—are the most vulnerable to any shocks emanating from the PRC, as they are all major exporters of capital goods that enjoy very close trade links with the PRC. However, commodity exporters such as Indonesia, Malaysia, and Turkmenistan will also likely be affected. While it is still true that a sizable portion of the PRC’s imports from its neighbors are parts and components for assembly and re-export to the US and other world markets, a large and growing share of the PRC’s imports from Asia are final goods (Park and Shin 2010). This means that a slowdown in the PRC will have a more direct impact on imports from the region.
Econometric analysis also confirms a significant effect from the PRC on the rest of developing Asia via the trade channel. How GDP growth in the PRC spills over to affect trade is examined by a panel data analysis using the methodology in Ahuja and Nabar (2012). Spillover from the PRC on one of its trading partners is measured as the product of the partner’s exports to the PRC as a share of its GDP and of the PRC’s GDP growth rate. The trading partner’s terms of trade growth rate, its lagged GDP growth rate, and an index for macroeconomic volatility are included in the analysis to control for changes in trade prices and to capture dynamic macroeconomic instability in the period since the onset of the global financial crisis: 2007–2012.
The estimated spillover impact of PRC’s slowdown on the rest of developing Asia is clearly significant, and the intensity of its impact became more substantial after the global crisis. When growth in the PRC slowed by 1 percentage point during 2002–2012, growth in the rest of developing Asia slowed by 0.13 percentage points on average. By way of comparison, a 1 percentage point deceleration in US growth slows growth
1.2.3 Developing Asia’s exports to the People’s Republic of China, 2002 and 2012 ( of all exports)
0 20 40 60 80 100
TongaAzerbaijan
Sri LankaGeorgia
BangladeshFiji
ArmeniaCambodia
Brunei DarussalamNepal
Papua New GuineaIndia
Kyrgyz RepublicSingapore
PakistanViet Nam
IndonesiaThailand
PhilippinesMalaysia
KazakhstanRep. of KoreaTaipei,China
Solomon IslandsHong Kong, China
TurkmenistanMongolia
% of total exports
20122002
Sources: CEIC Data Company (accessed 20 August 2013); International Monetary Fund. Direction of Trade Statistics online database (accessed 29 August 2013); World Bank. World Development Indicators online database (accessed 13 September 2013).
1.2.4 Developing Asia’s exports to the People’s Republic of China, 2002 and 2012 ( of GDP)
20122002
0 20 40 60 80 100
TongaNepal
GeorgiaSri Lanka
BangladeshAzerbaijan
ArmeniaFiji
IndiaPakistan
Kyrgyz RepublicCambodia
Brunei DarussalamPhilippines
IndonesiaPapua New Guinea
KazakhstanThailandViet NamMalaysia
Republic of KoreaSingapore
Taipei,ChinaTurkmenistan
Solomon IslandsMongolia
Hong Kong, China
% of GDP
Sources: CEIC Data Company (accessed 20 August 2013); International Monetary Fund. Direction of Trade Statistics online database (accessed 29 August 2013); World Bank. World Development Indicators online database (accessed 13 September 2013).
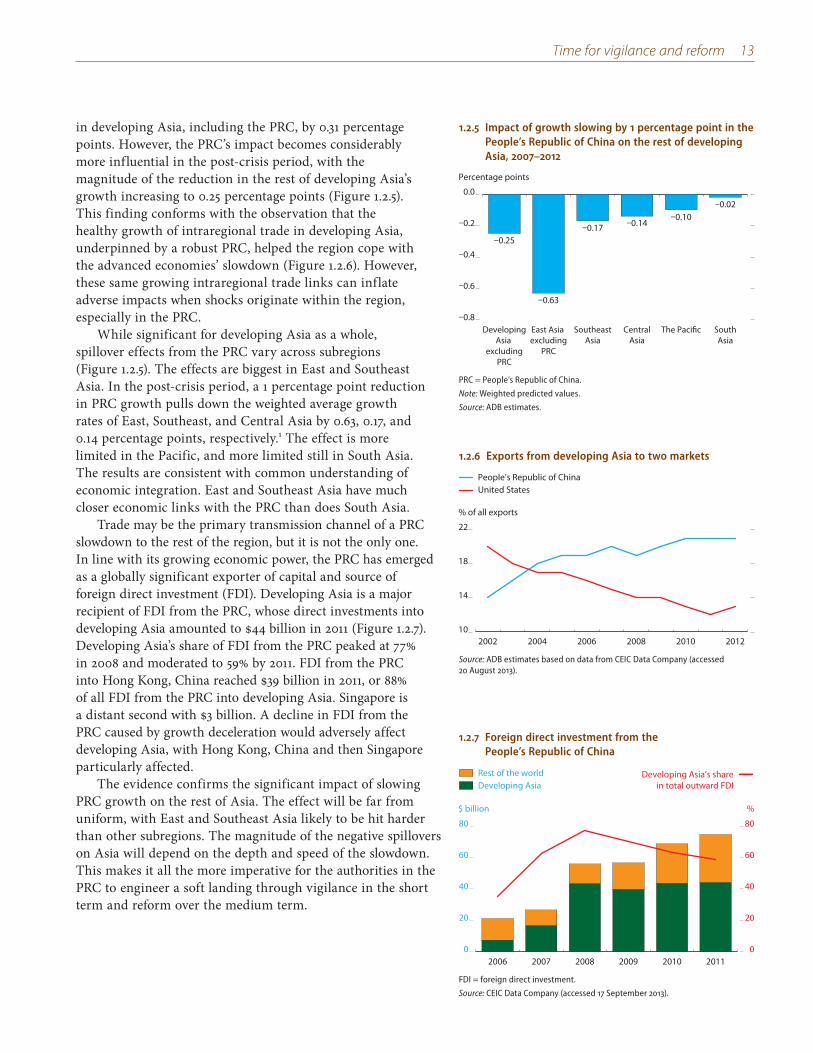
Time for vigilance and reform 13
in developing Asia, including the PRC, by 0.31 percentage points. However, the PRC’s impact becomes considerably more influential in the post-crisis period, with the magnitude of the reduction in the rest of developing Asia’s growth increasing to 0.25 percentage points (Figure 1.2.5). This finding conforms with the observation that the healthy growth of intraregional trade in developing Asia, underpinned by a robust PRC, helped the region cope with the advanced economies’ slowdown (Figure 1.2.6). However, these same growing intraregional trade links can inflate adverse impacts when shocks originate within the region, especially in the PRC.
While significant for developing Asia as a whole, spillover effects from the PRC vary across subregions (Figure 1.2.5). The effects are biggest in East and Southeast Asia. In the post-crisis period, a 1 percentage point reduction in PRC growth pulls down the weighted average growth rates of East, Southeast, and Central Asia by 0.63, 0.17, and 0.14 percentage points, respectively.1 The effect is more limited in the Pacific, and more limited still in South Asia. The results are consistent with common understanding of economic integration. East and Southeast Asia have much closer economic links with the PRC than does South Asia.
Trade may be the primary transmission channel of a PRC slowdown to the rest of the region, but it is not the only one. In line with its growing economic power, the PRC has emerged as a globally significant exporter of capital and source of foreign direct investment (FDI). Developing Asia is a major recipient of FDI from the PRC, whose direct investments into developing Asia amounted to $44 billion in 2011 (Figure 1.2.7). Developing Asia’s share of FDI from the PRC peaked at 77% in 2008 and moderated to 59% by 2011. FDI from the PRC into Hong Kong, China reached $39 billion in 2011, or 88% of all FDI from the PRC into developing Asia. Singapore is a distant second with $3 billion. A decline in FDI from the PRC caused by growth deceleration would adversely affect developing Asia, with Hong Kong, China and then Singapore particularly affected.
The evidence confirms the significant impact of slowing PRC growth on the rest of Asia. The effect will be far from uniform, with East and Southeast Asia likely to be hit harder than other subregions. The magnitude of the negative spillovers on Asia will depend on the depth and speed of the slowdown. This makes it all the more imperative for the authorities in the PRC to engineer a soft landing through vigilance in the short term and reform over the medium term.
1.2.5 Impact of growth slowing by 1 percentage point in the People’s Republic of China on the rest of developing Asia, 2007–2012
–0.8
–0.6
–0.4
–0.2
0.0
SouthAsia
The PacificCentralAsia
SoutheastAsia
East Asia excluding
PRC
DevelopingAsia
excludingPRC
Percentage points
–0.25
–0.02–0.10
–0.14–0.17
–0.63
PRC = People’s Republic of China.
Note: Weighted predicted values.
Source: ADB estimates.
1.2.6 Exports from developing Asia to two markets
United StatesPeople’s Republic of China
10
14
18
22
201220102008200620042002
% of all exports
Source: ADB estimates based on data from CEIC Data Company (accessed 20 August 2013).
1.2.7 Foreign direct investment from the People’s Republic of China
0
20
40
60
80
0
20
40
60
80
201120102009200820072006
$ billion %
Rest of the worldDeveloping Asia
Developing Asia’s sharein total outward FDI
FDI = foreign direct investment.
Source: CEIC Data Company (accessed 17 September 2013).
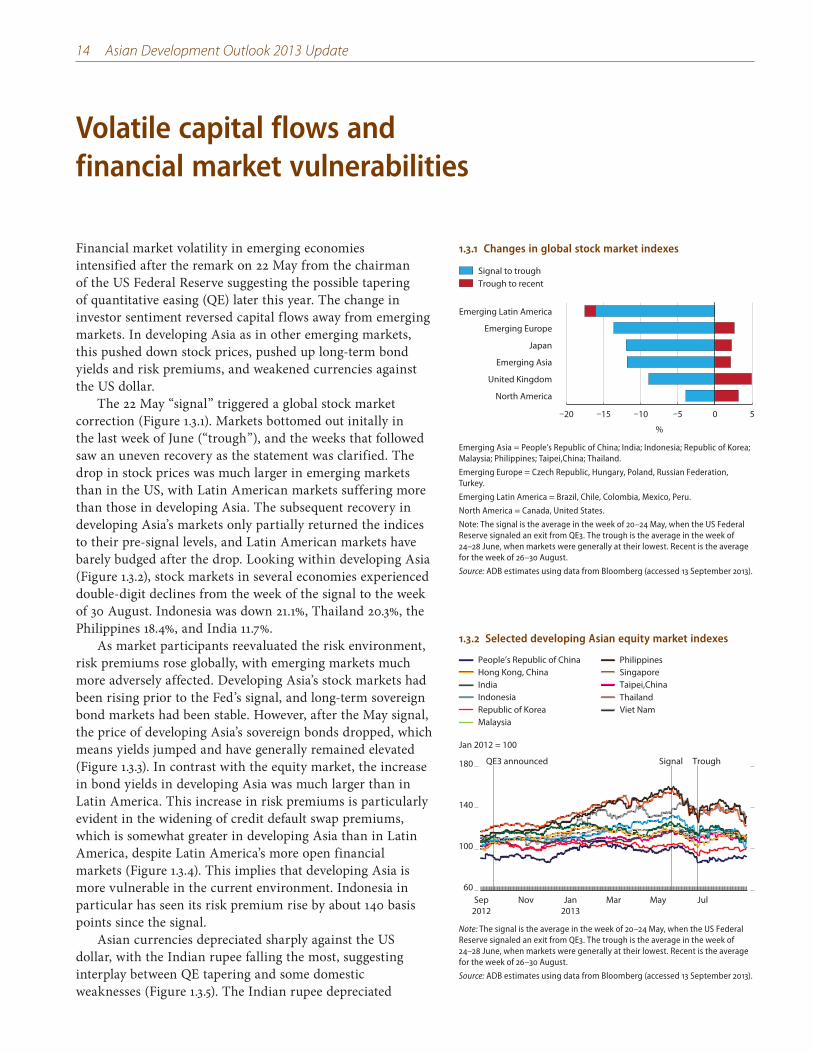
14 Asian Development Outlook 2013 Update
Volatile capital flows and financial market vulnerabilities
Financial market volatility in emerging economies intensified after the remark on 22 May from the chairman of the US Federal Reserve suggesting the possible tapering of quantitative easing (QE) later this year. The change in investor sentiment reversed capital flows away from emerging markets. In developing Asia as in other emerging markets, this pushed down stock prices, pushed up long-term bond yields and risk premiums, and weakened currencies against the US dollar.
The 22 May “signal” triggered a global stock market correction (Figure 1.3.1). Markets bottomed out initally in the last week of June (“trough”), and the weeks that followed saw an uneven recovery as the statement was clarified. The drop in stock prices was much larger in emerging markets than in the US, with Latin American markets suffering more than those in developing Asia. The subsequent recovery in developing Asia’s markets only partially returned the indices to their pre-signal levels, and Latin American markets have barely budged after the drop. Looking within developing Asia (Figure 1.3.2), stock markets in several economies experienced double-digit declines from the week of the signal to the week of 30 August. Indonesia was down 21.1%, Thailand 20.3%, the Philippines 18.4%, and India 11.7%.
As market participants reevaluated the risk environment, risk premiums rose globally, with emerging markets much more adversely affected. Developing Asia’s stock markets had been rising prior to the Fed’s signal, and long-term sovereign bond markets had been stable. However, after the May signal, the price of developing Asia’s sovereign bonds dropped, which means yields jumped and have generally remained elevated (Figure 1.3.3). In contrast with the equity market, the increase in bond yields in developing Asia was much larger than in Latin America. This increase in risk premiums is particularly evident in the widening of credit default swap premiums, which is somewhat greater in developing Asia than in Latin America, despite Latin America’s more open financial markets (Figure 1.3.4). This implies that developing Asia is more vulnerable in the current environment. Indonesia in particular has seen its risk premium rise by about 140 basis points since the signal.
Asian currencies depreciated sharply against the US dollar, with the Indian rupee falling the most, suggesting interplay between QE tapering and some domestic weaknesses (Figure 1.3.5). The Indian rupee depreciated
1.3.1 Changes in global stock market indexes
Trough to recentSignal to trough
–20 –15 –10 –5 0 5
North America
United Kingdom
Emerging Asia
Japan
Emerging Europe
Emerging Latin America
%
Emerging Asia = People’s Republic of China; India; Indonesia; Republic of Korea; Malaysia; Philippines; Taipei,China; Thailand.
Emerging Europe = Czech Republic, Hungary, Poland, Russian Federation, Turkey.
Emerging Latin America = Brazil, Chile, Colombia, Mexico, Peru.
North America = Canada, United States.
Note: The signal is the average in the week of 20–24 May, when the US Federal Reserve signaled an exit from QE3. The trough is the average in the week of 24–28 June, when markets were generally at their lowest. Recent is the average for the week of 26–30 August.
Source: ADB estimates using data from Bloomberg (accessed 13 September 2013).
1.3.2 Selected developing Asian equity market indexes
Republic of KoreaIndonesiaIndiaHong Kong, ChinaPeople’s Republic of China
ThailandViet Nam
Taipei,ChinaSingaporePhilippines
Malaysia
60
100
140
180
JulMayMarJan2013
NovSep2012
QE3 announced Signal Trough
Jan 2012 = 100
Note: The signal is the average in the week of 20–24 May, when the US Federal Reserve signaled an exit from QE3. The trough is the average in the week of 24–28 June, when markets were generally at their lowest. Recent is the average for the week of 26–30 August.
Source: ADB estimates using data from Bloomberg (accessed 13 September 2013).
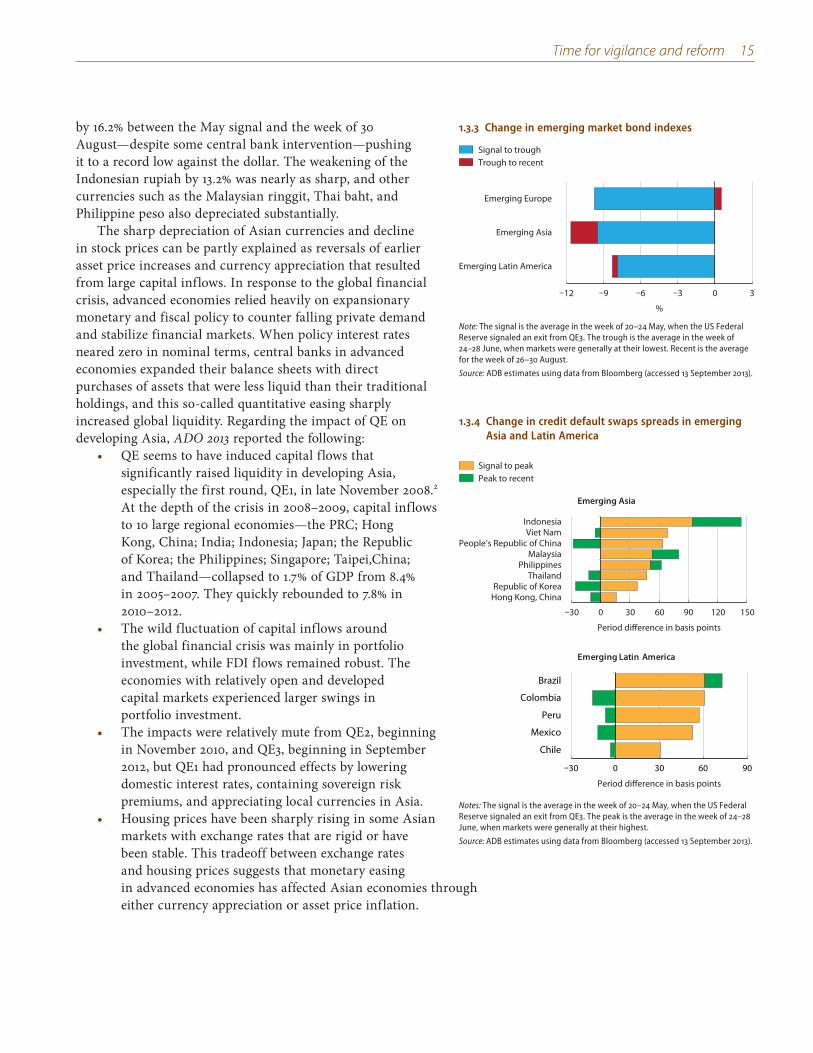
Time for vigilance and reform 15
by 16.2% between the May signal and the week of 30 August—despite some central bank intervention—pushing it to a record low against the dollar. The weakening of the Indonesian rupiah by 13.2% was nearly as sharp, and other currencies such as the Malaysian ringgit, Thai baht, and Philippine peso also depreciated substantially.
The sharp depreciation of Asian currencies and decline in stock prices can be partly explained as reversals of earlier asset price increases and currency appreciation that resulted from large capital inflows. In response to the global financial crisis, advanced economies relied heavily on expansionary monetary and fiscal policy to counter falling private demand and stabilize financial markets. When policy interest rates neared zero in nominal terms, central banks in advanced economies expanded their balance sheets with direct purchases of assets that were less liquid than their traditional holdings, and this so-called quantitative easing sharply increased global liquidity. Regarding the impact of QE on developing Asia, ADO 2013 reported the following:
QE seems to have induced capital flows that significantly raised liquidity in developing Asia, especially the first round, QE1, in late November 2008.2 At the depth of the crisis in 2008–2009, capital inflows to 10 large regional economies—the PRC; Hong Kong, China; India; Indonesia; Japan; the Republic of Korea; the Philippines; Singapore; Taipei,China; and Thailand—collapsed to 1.7% of GDP from 8.4% in 2005–2007. They quickly rebounded to 7.8% in 2010–2012.The wild fluctuation of capital inflows around the global financial crisis was mainly in portfolio investment, while FDI flows remained robust. The economies with relatively open and developed capital markets experienced larger swings in portfolio investment.The impacts were relatively mute from QE2, beginning in November 2010, and QE3, beginning in September 2012, but QE1 had pronounced effects by lowering domestic interest rates, containing sovereign risk premiums, and appreciating local currencies in Asia.Housing prices have been sharply rising in some Asian markets with exchange rates that are rigid or have been stable. This tradeoff between exchange rates and housing prices suggests that monetary easing in advanced economies has affected Asian economies through either currency appreciation or asset price inflation.
1.3.3 Change in emerging market bond indexes
Trough to recentSignal to trough
–12 –9 –6 –3 0 3
%
Emerging Latin America
Emerging Asia
Emerging Europe
Note: The signal is the average in the week of 20–24 May, when the US Federal Reserve signaled an exit from QE3. The trough is the average in the week of 24–28 June, when markets were generally at their lowest. Recent is the average for the week of 26–30 August.
Source: ADB estimates using data from Bloomberg (accessed 13 September 2013).
1.3.4 Change in credit default swaps spreads in emerging Asia and Latin America
Peak to recentSignal to peak
–30 0 30 60 90 120 150
Hong Kong, ChinaRepublic of Korea
ThailandPhilippines
MalaysiaPeople’s Republic of China
Viet NamIndonesia
Period difference in basis points
Emerging Asia
Period difference in basis points
Emerging Latin America
–30 0 30 60 90
Chile
Mexico
Peru
Colombia
Brazil
Notes: The signal is the average in the week of 20–24 May, when the US Federal Reserve signaled an exit from QE3. The peak is the average in the week of 24–28 June, when markets were generally at their highest.
Source: ADB estimates using data from Bloomberg (accessed 13 September 2013).
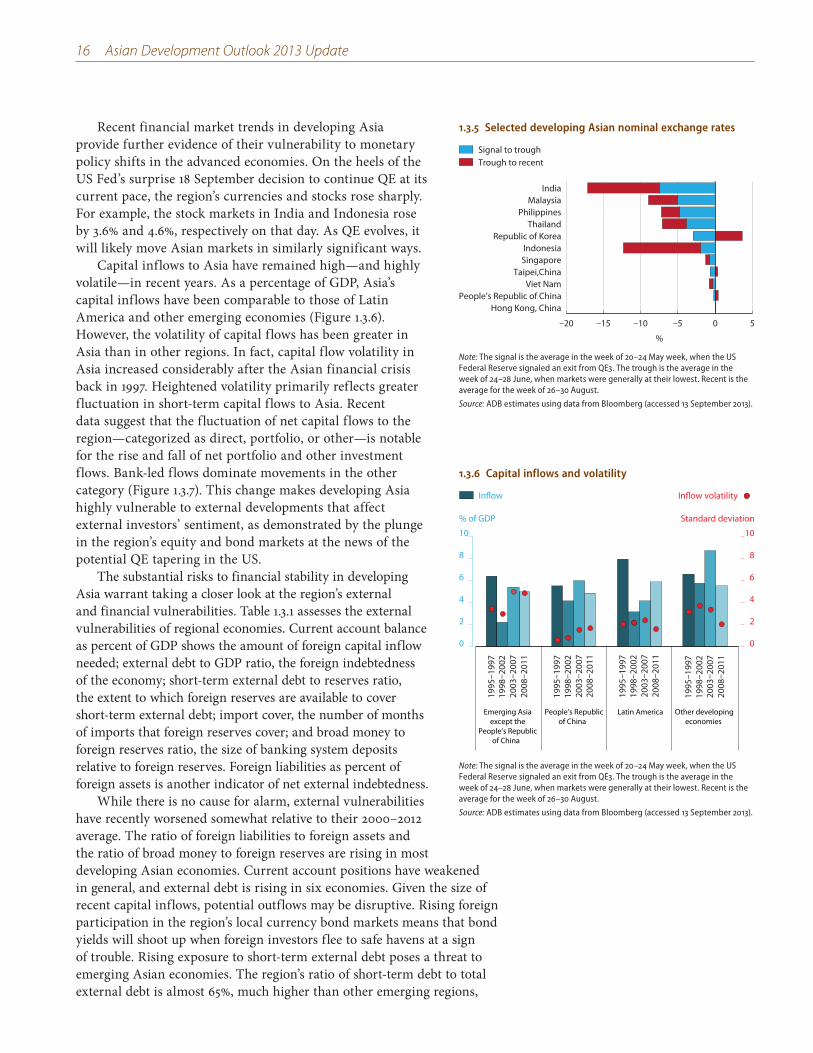
16 Asian Development Outlook 2013 Update
Recent financial market trends in developing Asia provide further evidence of their vulnerability to monetary policy shifts in the advanced economies. On the heels of the US Fed’s surprise 18 September decision to continue QE at its current pace, the region’s currencies and stocks rose sharply. For example, the stock markets in India and Indonesia rose by 3.6% and 4.6%, respectively on that day. As QE evolves, it will likely move Asian markets in similarly significant ways.
Capital inflows to Asia have remained high—and highly volatile—in recent years. As a percentage of GDP, Asia’s capital inflows have been comparable to those of Latin America and other emerging economies (Figure 1.3.6). However, the volatility of capital flows has been greater in Asia than in other regions. In fact, capital flow volatility in Asia increased considerably after the Asian financial crisis back in 1997. Heightened volatility primarily reflects greater fluctuation in short-term capital flows to Asia. Recent data suggest that the fluctuation of net capital flows to the region—categorized as direct, portfolio, or other—is notable for the rise and fall of net portfolio and other investment flows. Bank-led flows dominate movements in the other category (Figure 1.3.7). This change makes developing Asia highly vulnerable to external developments that affect external investors’ sentiment, as demonstrated by the plunge in the region’s equity and bond markets at the news of the potential QE tapering in the US.
The substantial risks to financial stability in developing Asia warrant taking a closer look at the region’s external and financial vulnerabilities. Table 1.3.1 assesses the external vulnerabilities of regional economies. Current account balance as percent of GDP shows the amount of foreign capital inflow needed; external debt to GDP ratio, the foreign indebtedness of the economy; short-term external debt to reserves ratio, the extent to which foreign reserves are available to cover short-term external debt; import cover, the number of months of imports that foreign reserves cover; and broad money to foreign reserves ratio, the size of banking system deposits relative to foreign reserves. Foreign liabilities as percent of foreign assets is another indicator of net external indebtedness.
While there is no cause for alarm, external vulnerabilities have recently worsened somewhat relative to their 2000–2012 average. The ratio of foreign liabilities to foreign assets and the ratio of broad money to foreign reserves are rising in most developing Asian economies. Current account positions have weakened in general, and external debt is rising in six economies. Given the size of recent capital inflows, potential outflows may be disruptive. Rising foreign participation in the region’s local currency bond markets means that bond yields will shoot up when foreign investors flee to safe havens at a sign of trouble. Rising exposure to short-term external debt poses a threat to emerging Asian economies. The region’s ratio of short-term debt to total external debt is almost 65%, much higher than other emerging regions,
1.3.5 Selected developing Asian nominal exchange rates
Trough to recentSignal to trough
–20 –15 –10 –5 0 5
Hong Kong, ChinaPeople’s Republic of China
Viet NamTaipei,China
SingaporeIndonesia
Republic of KoreaThailand
PhilippinesMalaysia
India
%
Note: The signal is the average in the week of 20–24 May week, when the US Federal Reserve signaled an exit from QE3. The trough is the average in the week of 24–28 June, when markets were generally at their lowest. Recent is the average for the week of 26–30 August.
Source: ADB estimates using data from Bloomberg (accessed 13 September 2013).
1.3.6 Capital inflows and volatility
Inflow
0
2
4
6
8
10
0
2
4
6
8
10
Emerging Asiaexcept the
People’s Republicof China
People’s Republicof China
Latin America Other developingeconomies
Standard deviation% of GDP
1995
–199
719
98–2
002
2003
–200
720
08–2
011
1995
–199
719
98–2
002
2003
–200
720
08–2
011
1995
–199
719
98–2
002
2003
–200
720
08–2
011
1995
–199
719
98–2
002
2003
–200
720
08–2
011
Inflow volatility
Note: The signal is the average in the week of 20–24 May week, when the US Federal Reserve signaled an exit from QE3. The trough is the average in the week of 24–28 June, when markets were generally at their lowest. Recent is the average for the week of 26–30 August.
Source: ADB estimates using data from Bloomberg (accessed 13 September 2013).
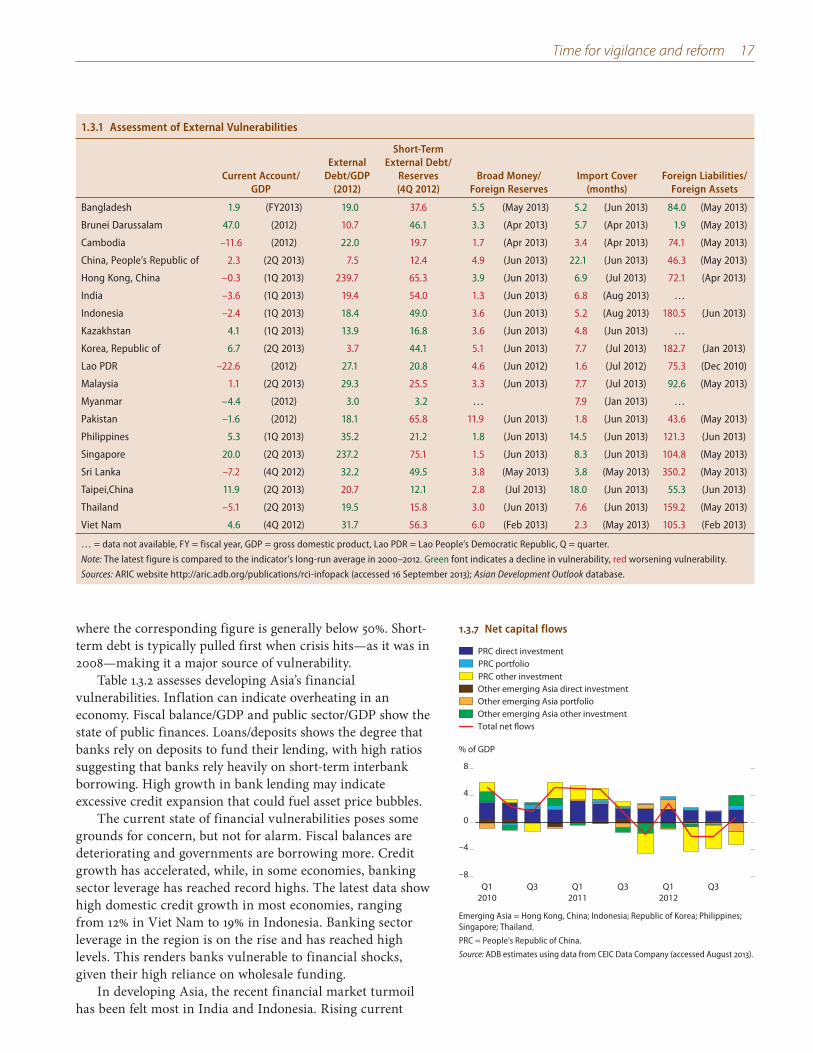
Time for vigilance and reform 17
1.3.1 Assessment of External Vulnerabilities
Current Account/ GDP
External Debt/GDP
(2012)
Short-Term External Debt/
Reserves (4Q 2012)
Broad Money/Foreign Reserves
Import Cover (months)
Foreign Liabilities/Foreign Assets
Bangladesh 1.9 (FY2013) 19.0 37.6 5.5 (May 2013) 5.2 (Jun 2013) 84.0 (May 2013)
Brunei Darussalam 47.0 (2012) 10.7 46.1 3.3 (Apr 2013) 5.7 (Apr 2013) 1.9 (May 2013)
Cambodia –11.6 (2012) 22.0 19.7 1.7 (Apr 2013) 3.4 (Apr 2013) 74.1 (May 2013)
China, People’s Republic of 2.3 (2Q 2013) 7.5 12.4 4.9 (Jun 2013) 22.1 (Jun 2013) 46.3 (May 2013)
Hong Kong, China –0.3 (1Q 2013) 239.7 65.3 3.9 (Jun 2013) 6.9 (Jul 2013) 72.1 (Apr 2013)
India –3.6 (1Q 2013) 19.4 54.0 1.3 (Jun 2013) 6.8 (Aug 2013) …
Indonesia –2.4 (1Q 2013) 18.4 49.0 3.6 (Jun 2013) 5.2 (Aug 2013) 180.5 (Jun 2013)
Kazakhstan 4.1 (1Q 2013) 13.9 16.8 3.6 (Jun 2013) 4.8 (Jun 2013) …
Korea, Republic of 6.7 (2Q 2013) 3.7 44.1 5.1 (Jun 2013) 7.7 (Jul 2013) 182.7 (Jan 2013)
Lao PDR –22.6 (2012) 27.1 20.8 4.6 (Jun 2012) 1.6 (Jul 2012) 75.3 (Dec 2010)
Malaysia 1.1 (2Q 2013) 29.3 25.5 3.3 (Jun 2013) 7.7 (Jul 2013) 92.6 (May 2013)
Myanmar –4.4 (2012) 3.0 3.2 … 7.9 (Jan 2013) …
Pakistan –1.6 (2012) 18.1 65.8 11.9 (Jun 2013) 1.8 (Jun 2013) 43.6 (May 2013)
Philippines 5.3 (1Q 2013) 35.2 21.2 1.8 (Jun 2013) 14.5 (Jun 2013) 121.3 (Jun 2013)
Singapore 20.0 (2Q 2013) 237.2 75.1 1.5 (Jun 2013) 8.3 (Jun 2013) 104.8 (May 2013)
Sri Lanka –7.2 (4Q 2012) 32.2 49.5 3.8 (May 2013) 3.8 (May 2013) 350.2 (May 2013)
Taipei,China 11.9 (2Q 2013) 20.7 12.1 2.8 (Jul 2013) 18.0 (Jun 2013) 55.3 (Jun 2013)
Thailand –5.1 (2Q 2013) 19.5 15.8 3.0 (Jun 2013) 7.6 (Jun 2013) 159.2 (May 2013)
Viet Nam 4.6 (4Q 2012) 31.7 56.3 6.0 (Feb 2013) 2.3 (May 2013) 105.3 (Feb 2013)
… = data not available, FY = fiscal year, GDP = gross domestic product, Lao PDR = Lao People’s Democratic Republic, Q = quarter.
Note: The latest figure is compared to the indicator’s long-run average in 2000–2012. Green font indicates a decline in vulnerability, red worsening vulnerability.
Sources: ARIC website http://aric.adb.org/publications/rci-infopack (accessed 16 September 2013); Asian Development Outlook database.
1.3.7 Net capital flows
PRC other investmentOther emerging Asia direct investmentOther emerging Asia portfolioOther emerging Asia other investmentTotal net flows
PRC portfolioPRC direct investment
–8
–4
0
4
8
Q12010
Q3 Q12011
Q3 Q12012
Q3
% of GDP
Emerging Asia = Hong Kong, China; Indonesia; Republic of Korea; Philippines; Singapore; Thailand.
PRC = People’s Republic of China.
Source: ADB estimates using data from CEIC Data Company (accessed August 2013).
where the corresponding figure is generally below 50%. Short-term debt is typically pulled first when crisis hits—as it was in 2008—making it a major source of vulnerability.
Table 1.3.2 assesses developing Asia’s financial vulnerabilities. Inflation can indicate overheating in an economy. Fiscal balance/GDP and public sector/GDP show the state of public finances. Loans/deposits shows the degree that banks rely on deposits to fund their lending, with high ratios suggesting that banks rely heavily on short-term interbank borrowing. High growth in bank lending may indicate excessive credit expansion that could fuel asset price bubbles.
The current state of financial vulnerabilities poses some grounds for concern, but not for alarm. Fiscal balances are deteriorating and governments are borrowing more. Credit growth has accelerated, while, in some economies, banking sector leverage has reached record highs. The latest data show high domestic credit growth in most economies, ranging from 12% in Viet Nam to 19% in Indonesia. Banking sector leverage in the region is on the rise and has reached high levels. This renders banks vulnerable to financial shocks, given their high reliance on wholesale funding.
In developing Asia, the recent financial market turmoil has been felt most in India and Indonesia. Rising current
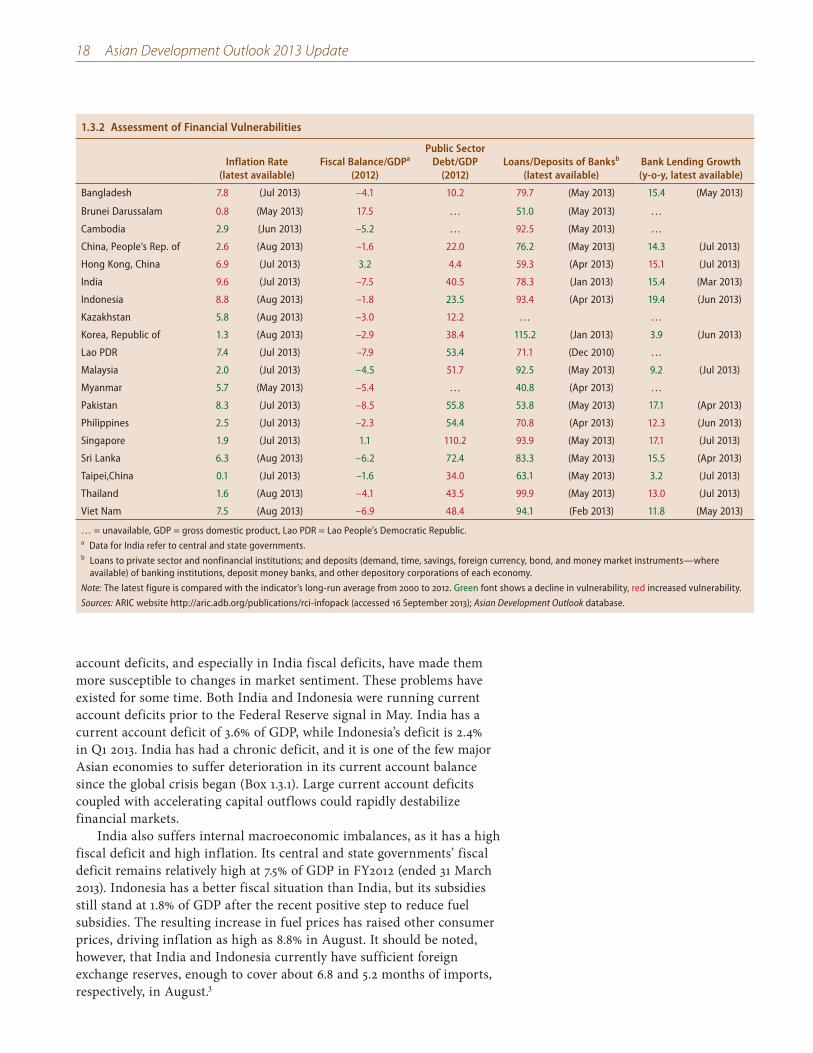
18 Asian Development Outlook 2013 Update
1.3.2 Assessment of Financial Vulnerabilities
Inflation Rate(latest available)
Fiscal Balance/GDPa
(2012)
Public Sector Debt/GDP
(2012)Loans/Deposits of Banksb
(latest available)Bank Lending Growth(y-o-y, latest available)
Bangladesh 7.8 (Jul 2013) –4.1 10.2 79.7 (May 2013) 15.4 (May 2013)
Brunei Darussalam 0.8 (May 2013) 17.5 … 51.0 (May 2013) …
Cambodia 2.9 (Jun 2013) –5.2 … 92.5 (May 2013) …
China, People’s Rep. of 2.6 (Aug 2013) –1.6 22.0 76.2 (May 2013) 14.3 (Jul 2013)
Hong Kong, China 6.9 (Jul 2013) 3.2 4.4 59.3 (Apr 2013) 15.1 (Jul 2013)
India 9.6 (Jul 2013) –7.5 40.5 78.3 (Jan 2013) 15.4 (Mar 2013)
Indonesia 8.8 (Aug 2013) –1.8 23.5 93.4 (Apr 2013) 19.4 (Jun 2013)
Kazakhstan 5.8 (Aug 2013) –3.0 12.2 … …
Korea, Republic of 1.3 (Aug 2013) –2.9 38.4 115.2 (Jan 2013) 3.9 (Jun 2013)
Lao PDR 7.4 (Jul 2013) –7.9 53.4 71.1 (Dec 2010) …
Malaysia 2.0 (Jul 2013) –4.5 51.7 92.5 (May 2013) 9.2 (Jul 2013)
Myanmar 5.7 (May 2013) –5.4 … 40.8 (Apr 2013) …
Pakistan 8.3 (Jul 2013) –8.5 55.8 53.8 (May 2013) 17.1 (Apr 2013)
Philippines 2.5 (Jul 2013) –2.3 54.4 70.8 (Apr 2013) 12.3 (Jun 2013)
Singapore 1.9 (Jul 2013) 1.1 110.2 93.9 (May 2013) 17.1 (Jul 2013)
Sri Lanka 6.3 (Aug 2013) –6.2 72.4 83.3 (May 2013) 15.5 (Apr 2013)
Taipei,China 0.1 (Jul 2013) –1.6 34.0 63.1 (May 2013) 3.2 (Jul 2013)
Thailand 1.6 (Aug 2013) –4.1 43.5 99.9 (May 2013) 13.0 (Jul 2013)
Viet Nam 7.5 (Aug 2013) –6.9 48.4 94.1 (Feb 2013) 11.8 (May 2013)
… = unavailable, GDP = gross domestic product, Lao PDR = Lao People’s Democratic Republic.a Data for India refer to central and state governments.b Loans to private sector and nonfinancial institutions; and deposits (demand, time, savings, foreign currency, bond, and money market instruments—where
available) of banking institutions, deposit money banks, and other depository corporations of each economy.
Note: The latest figure is compared with the indicator’s long-run average from 2000 to 2012. Green font shows a decline in vulnerability, red increased vulnerability.
Sources: ARIC website http://aric.adb.org/publications/rci-infopack (accessed 16 September 2013); Asian Development Outlook database.
account deficits, and especially in India fiscal deficits, have made them more susceptible to changes in market sentiment. These problems have existed for some time. Both India and Indonesia were running current account deficits prior to the Federal Reserve signal in May. India has a current account deficit of 3.6% of GDP, while Indonesia’s deficit is 2.4% in Q1 2013. India has had a chronic deficit, and it is one of the few major Asian economies to suffer deterioration in its current account balance since the global crisis began (Box 1.3.1). Large current account deficits coupled with accelerating capital outflows could rapidly destabilize financial markets.
India also suffers internal macroeconomic imbalances, as it has a high fiscal deficit and high inflation. Its central and state governments’ fiscal deficit remains relatively high at 7.5% of GDP in FY2012 (ended 31 March 2013). Indonesia has a better fiscal situation than India, but its subsidies still stand at 1.8% of GDP after the recent positive step to reduce fuel subsidies. The resulting increase in fuel prices has raised other consumer prices, driving inflation as high as 8.8% in August. It should be noted, however, that India and Indonesia currently have sufficient foreign exchange reserves, enough to cover about 6.8 and 5.2 months of imports, respectively, in August.3
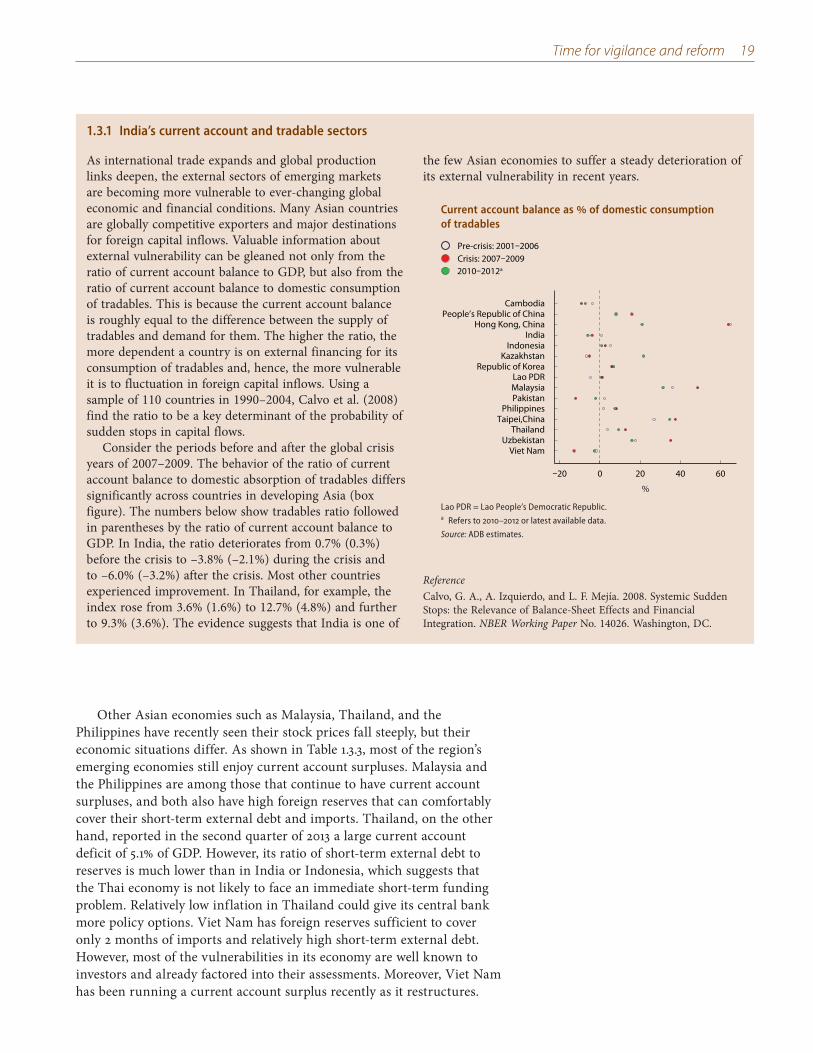
Time for vigilance and reform 19
1.3.1 India’s current account and tradable sectors
As international trade expands and global production links deepen, the external sectors of emerging markets are becoming more vulnerable to ever-changing global economic and financial conditions. Many Asian countries are globally competitive exporters and major destinations for foreign capital inflows. Valuable information about external vulnerability can be gleaned not only from the ratio of current account balance to GDP, but also from the ratio of current account balance to domestic consumption of tradables. This is because the current account balance is roughly equal to the difference between the supply of tradables and demand for them. The higher the ratio, the more dependent a country is on external financing for its consumption of tradables and, hence, the more vulnerable it is to fluctuation in foreign capital inflows. Using a sample of 110 countries in 1990–2004, Calvo et al. (2008) find the ratio to be a key determinant of the probability of sudden stops in capital flows.
Consider the periods before and after the global crisis years of 2007–2009. The behavior of the ratio of current account balance to domestic absorption of tradables differs significantly across countries in developing Asia (box figure). The numbers below show tradables ratio followed in parentheses by the ratio of current account balance to GDP. In India, the ratio deteriorates from 0.7% (0.3%) before the crisis to –3.8% (–2.1%) during the crisis and to –6.0% (–3.2%) after the crisis. Most other countries experienced improvement. In Thailand, for example, the index rose from 3.6% (1.6%) to 12.7% (4.8%) and further to 9.3% (3.6%). The evidence suggests that India is one of
the few Asian economies to suffer a steady deterioration of its external vulnerability in recent years.
ReferenceCalvo, G. A., A. Izquierdo, and L. F. Mejía. 2008. Systemic Sudden Stops: the Relevance of Balance-Sheet Effects and Financial Integration. NBER Working Paper No. 14026. Washington, DC.
Current account balance as of domestic consumption of tradables
Crisis: 2007–20092010–2012a
Pre-crisis: 2001–2006
–20 0 20 40 60
Viet NamUzbekistan
ThailandTaipei,China
PhilippinesPakistanMalaysiaLao PDR
Republic of KoreaKazakhstan
IndonesiaIndia
Hong Kong, ChinaPeople’s Republic of China
Cambodia
%
Lao PDR = Lao People’s Democratic Republic.a Refers to 2010–2012 or latest available data.
Source: ADB estimates.
Other Asian economies such as Malaysia, Thailand, and the Philippines have recently seen their stock prices fall steeply, but their economic situations differ. As shown in Table 1.3.3, most of the region’s emerging economies still enjoy current account surpluses. Malaysia and the Philippines are among those that continue to have current account surpluses, and both also have high foreign reserves that can comfortably cover their short-term external debt and imports. Thailand, on the other hand, reported in the second quarter of 2013 a large current account deficit of 5.1% of GDP. However, its ratio of short-term external debt to reserves is much lower than in India or Indonesia, which suggests that the Thai economy is not likely to face an immediate short-term funding problem. Relatively low inflation in Thailand could give its central bank more policy options. Viet Nam has foreign reserves sufficient to cover only 2 months of imports and relatively high short-term external debt. However, most of the vulnerabilities in its economy are well known to investors and already factored into their assessments. Moreover, Viet Nam has been running a current account surplus recently as it restructures.
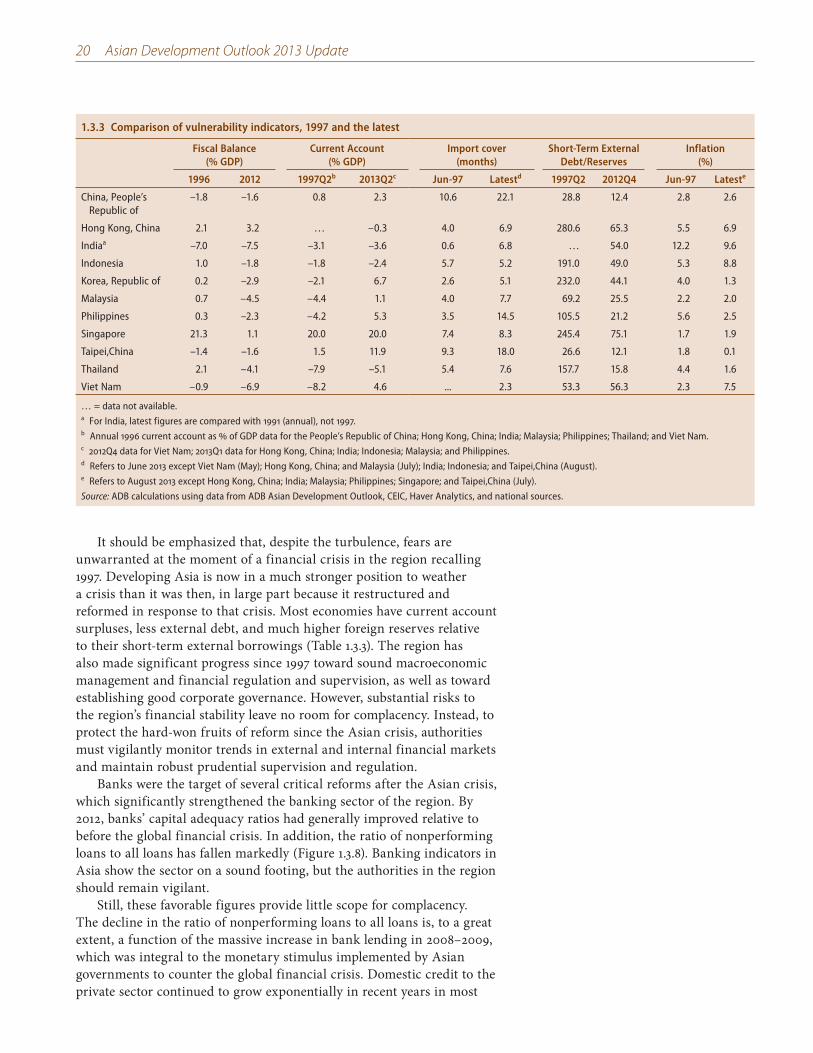
20 Asian Development Outlook 2013 Update
It should be emphasized that, despite the turbulence, fears are unwarranted at the moment of a financial crisis in the region recalling 1997. Developing Asia is now in a much stronger position to weather a crisis than it was then, in large part because it restructured and reformed in response to that crisis. Most economies have current account surpluses, less external debt, and much higher foreign reserves relative to their short-term external borrowings (Table 1.3.3). The region has also made significant progress since 1997 toward sound macroeconomic management and financial regulation and supervision, as well as toward establishing good corporate governance. However, substantial risks to the region’s financial stability leave no room for complacency. Instead, to protect the hard-won fruits of reform since the Asian crisis, authorities must vigilantly monitor trends in external and internal financial markets and maintain robust prudential supervision and regulation.
Banks were the target of several critical reforms after the Asian crisis, which significantly strengthened the banking sector of the region. By 2012, banks’ capital adequacy ratios had generally improved relative to before the global financial crisis. In addition, the ratio of nonperforming loans to all loans has fallen markedly (Figure 1.3.8). Banking indicators in Asia show the sector on a sound footing, but the authorities in the region should remain vigilant.
Still, these favorable figures provide little scope for complacency. The decline in the ratio of nonperforming loans to all loans is, to a great extent, a function of the massive increase in bank lending in 2008–2009, which was integral to the monetary stimulus implemented by Asian governments to counter the global financial crisis. Domestic credit to the private sector continued to grow exponentially in recent years in most
1.3.3 Comparison of vulnerability indicators, 1997 and the latest
Fiscal Balance (% GDP)
Current Account (% GDP)
Import cover(months)
Short-Term External Debt/Reserves
Inflation (%)
1996 2012 1997Q2b 2013Q2c Jun-97 Latestd 1997Q2 2012Q4 Jun-97 Lateste
China, People’s Republic of
–1.8 –1.6 0.8 2.3 10.6 22.1 28.8 12.4 2.8 2.6
Hong Kong, China 2.1 3.2 … –0.3 4.0 6.9 280.6 65.3 5.5 6.9
Indiaa –7.0 –7.5 –3.1 –3.6 0.6 6.8 … 54.0 12.2 9.6
Indonesia 1.0 –1.8 –1.8 –2.4 5.7 5.2 191.0 49.0 5.3 8.8
Korea, Republic of 0.2 –2.9 –2.1 6.7 2.6 5.1 232.0 44.1 4.0 1.3
Malaysia 0.7 –4.5 –4.4 1.1 4.0 7.7 69.2 25.5 2.2 2.0
Philippines 0.3 –2.3 –4.2 5.3 3.5 14.5 105.5 21.2 5.6 2.5
Singapore 21.3 1.1 20.0 20.0 7.4 8.3 245.4 75.1 1.7 1.9
Taipei,China –1.4 –1.6 1.5 11.9 9.3 18.0 26.6 12.1 1.8 0.1
Thailand 2.1 –4.1 –7.9 –5.1 5.4 7.6 157.7 15.8 4.4 1.6
Viet Nam –0.9 –6.9 –8.2 4.6 ... 2.3 53.3 56.3 2.3 7.5
… = data not available.a For India, latest figures are compared with 1991 (annual), not 1997.b Annual 1996 current account as of GDP data for the People’s Republic of China; Hong Kong, China; India; Malaysia; Philippines; Thailand; and Viet Nam.c 2012Q4 data for Viet Nam; 2013Q1 data for Hong Kong, China; India; Indonesia; Malaysia; and Philippines.d Refers to June 2013 except Viet Nam (May); Hong Kong, China; and Malaysia (July); India; Indonesia; and Taipei,China (August). e Refers to August 2013 except Hong Kong, China; India; Malaysia; Philippines; Singapore; and Taipei,China (July).
Source: ADB calculations using data from ADB Asian Development Outlook, CEIC, Haver Analytics, and national sources.
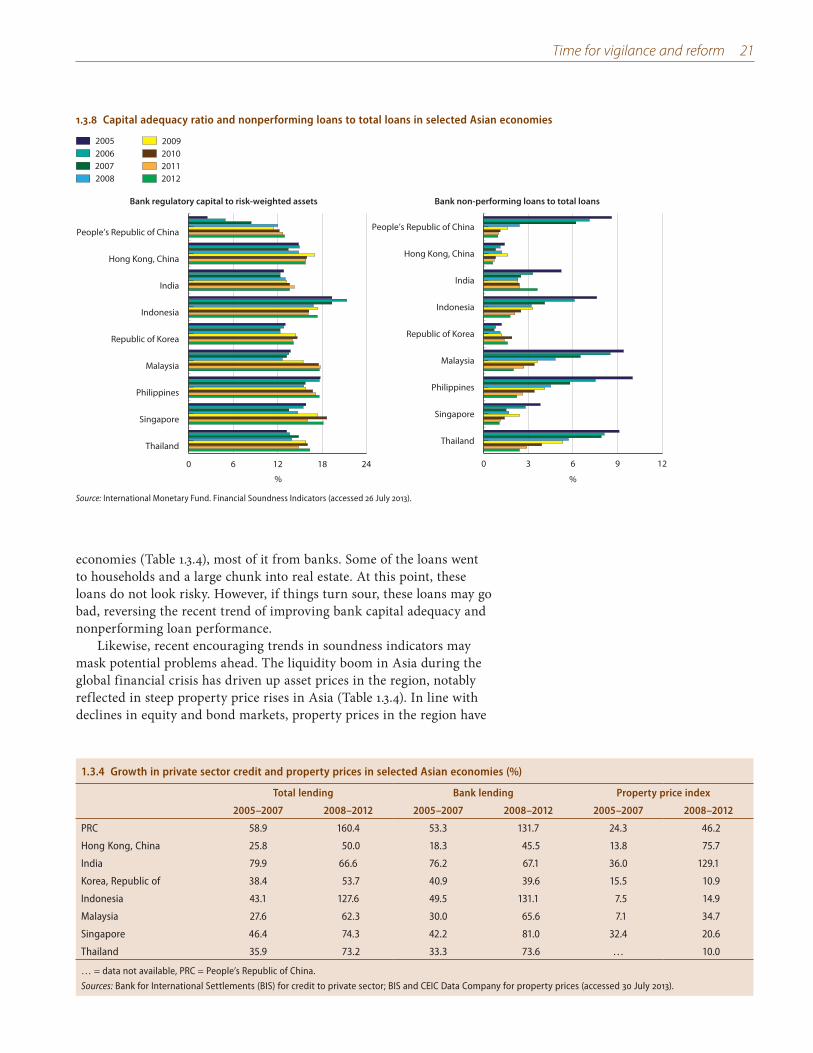
Time for vigilance and reform 21
economies (Table 1.3.4), most of it from banks. Some of the loans went to households and a large chunk into real estate. At this point, these loans do not look risky. However, if things turn sour, these loans may go bad, reversing the recent trend of improving bank capital adequacy and nonperforming loan performance.
Likewise, recent encouraging trends in soundness indicators may mask potential problems ahead. The liquidity boom in Asia during the global financial crisis has driven up asset prices in the region, notably reflected in steep property price rises in Asia (Table 1.3.4). In line with declines in equity and bond markets, property prices in the region have
1.3.8 Capital adequacy ratio and nonperforming loans to total loans in selected Asian economies
20092010201120122008
20062007
2005
Bank regulatory capital to risk-weighted assets
0 6 12 18 24
Thailand
Singapore
Philippines
Malaysia
Republic of Korea
Indonesia
India
Hong Kong, China
People’s Republic of China
%
Bank non-performing loans to total loans
0 3 6 9 12
Thailand
Singapore
Philippines
Malaysia
Republic of Korea
Indonesia
India
Hong Kong, China
People’s Republic of China
%
Source: International Monetary Fund. Financial Soundness Indicators (accessed 26 July 2013).
1.3.4 Growth in private sector credit and property prices in selected Asian economies (%)
Total lending Bank lending Property price index
2005–2007 2008–2012 2005–2007 2008–2012 2005–2007 2008–2012
PRC 58.9 160.4 53.3 131.7 24.3 46.2
Hong Kong, China 25.8 50.0 18.3 45.5 13.8 75.7
India 79.9 66.6 76.2 67.1 36.0 129.1
Korea, Republic of 38.4 53.7 40.9 39.6 15.5 10.9
Indonesia 43.1 127.6 49.5 131.1 7.5 14.9
Malaysia 27.6 62.3 30.0 65.6 7.1 34.7
Singapore 46.4 74.3 42.2 81.0 32.4 20.6
Thailand 35.9 73.2 33.3 73.6 … 10.0
… = data not available, PRC = People’s Republic of China.
Sources: Bank for International Settlements (BIS) for credit to private sector; BIS and CEIC Data Company for property prices (accessed 30 July 2013).
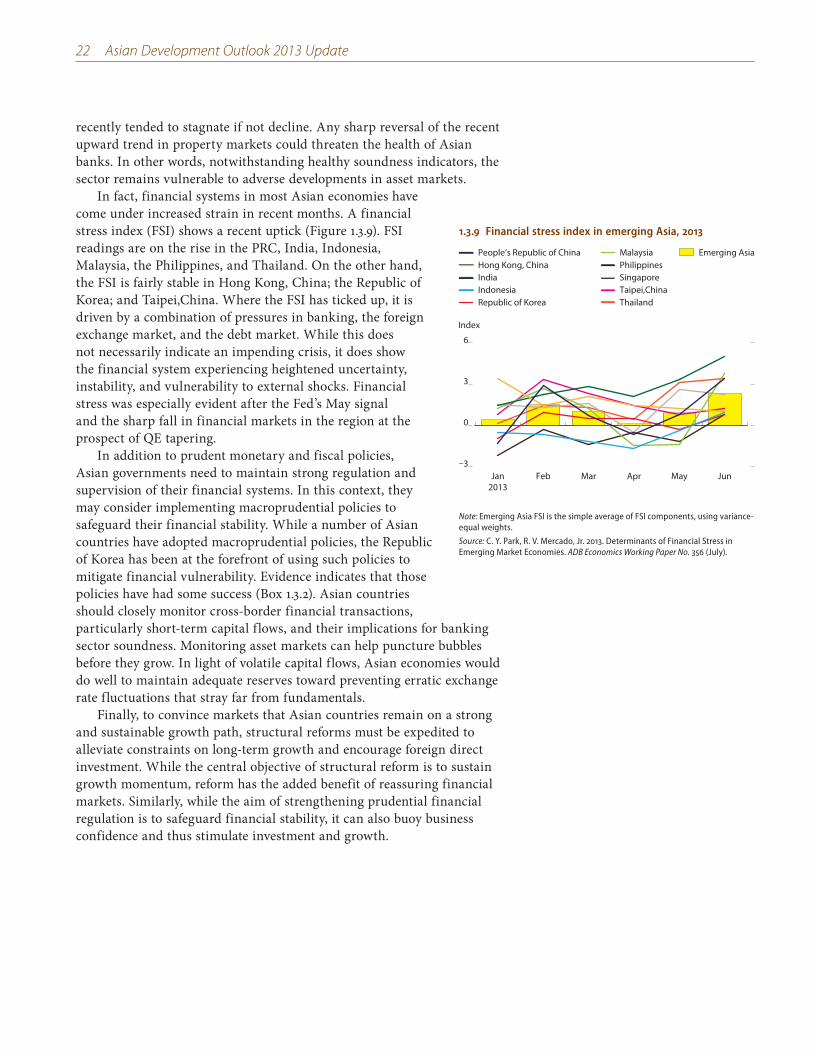
22 Asian Development Outlook 2013 Update
recently tended to stagnate if not decline. Any sharp reversal of the recent upward trend in property markets could threaten the health of Asian banks. In other words, notwithstanding healthy soundness indicators, the sector remains vulnerable to adverse developments in asset markets.
In fact, financial systems in most Asian economies have come under increased strain in recent months. A financial stress index (FSI) shows a recent uptick (Figure 1.3.9). FSI readings are on the rise in the PRC, India, Indonesia, Malaysia, the Philippines, and Thailand. On the other hand, the FSI is fairly stable in Hong Kong, China; the Republic of Korea; and Taipei,China. Where the FSI has ticked up, it is driven by a combination of pressures in banking, the foreign exchange market, and the debt market. While this does not necessarily indicate an impending crisis, it does show the financial system experiencing heightened uncertainty, instability, and vulnerability to external shocks. Financial stress was especially evident after the Fed’s May signal and the sharp fall in financial markets in the region at the prospect of QE tapering.
In addition to prudent monetary and fiscal policies, Asian governments need to maintain strong regulation and supervision of their financial systems. In this context, they may consider implementing macroprudential policies to safeguard their financial stability. While a number of Asian countries have adopted macroprudential policies, the Republic of Korea has been at the forefront of using such policies to mitigate financial vulnerability. Evidence indicates that those policies have had some success (Box 1.3.2). Asian countries should closely monitor cross-border financial transactions, particularly short-term capital flows, and their implications for banking sector soundness. Monitoring asset markets can help puncture bubbles before they grow. In light of volatile capital flows, Asian economies would do well to maintain adequate reserves toward preventing erratic exchange rate fluctuations that stray far from fundamentals.
Finally, to convince markets that Asian countries remain on a strong and sustainable growth path, structural reforms must be expedited to alleviate constraints on long-term growth and encourage foreign direct investment. While the central objective of structural reform is to sustain growth momentum, reform has the added benefit of reassuring financial markets. Similarly, while the aim of strengthening prudential financial regulation is to safeguard financial stability, it can also buoy business confidence and thus stimulate investment and growth.
1.3.9 Financial stress index in emerging Asia, 2013
Emerging Asia
–3
0
3
6
JunMayAprMarFebJan2013
Index
Republic of KoreaIndonesiaIndiaHong Kong, ChinaPeople’s Republic of China
ThailandTaipei,ChinaSingaporePhilippinesMalaysia
Note: Emerging Asia FSI is the simple average of FSI components, using variance-equal weights.
Source: C. Y. Park, R. V. Mercado, Jr. 2013. Determinants of Financial Stress in Emerging Market Economies. ADB Economics Working Paper No. 356 (July).
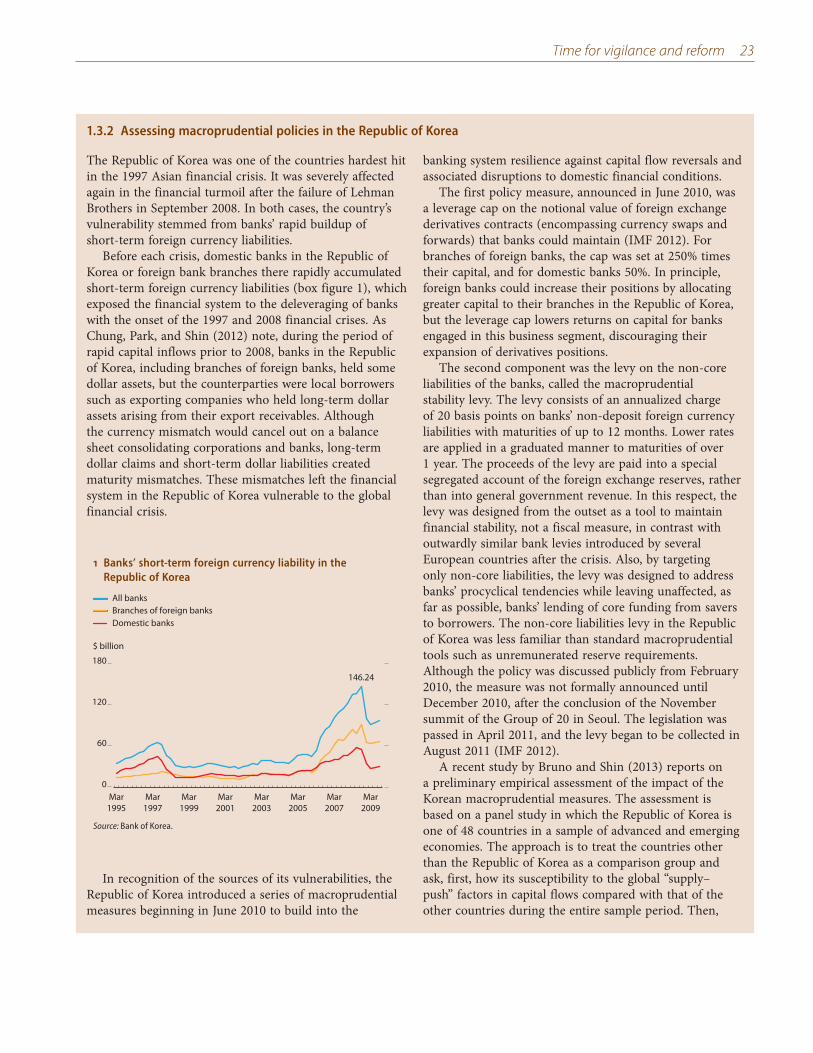
Time for vigilance and reform 23
1.3.2 Assessing macroprudential policies in the Republic of Korea
The Republic of Korea was one of the countries hardest hit in the 1997 Asian financial crisis. It was severely affected again in the financial turmoil after the failure of Lehman Brothers in September 2008. In both cases, the country’s vulnerability stemmed from banks’ rapid buildup of short-term foreign currency liabilities.
Before each crisis, domestic banks in the Republic of Korea or foreign bank branches there rapidly accumulated short-term foreign currency liabilities (box figure 1), which exposed the financial system to the deleveraging of banks with the onset of the 1997 and 2008 financial crises. As Chung, Park, and Shin (2012) note, during the period of rapid capital inflows prior to 2008, banks in the Republic of Korea, including branches of foreign banks, held some dollar assets, but the counterparties were local borrowers such as exporting companies who held long-term dollar assets arising from their export receivables. Although the currency mismatch would cancel out on a balance sheet consolidating corporations and banks, long-term dollar claims and short-term dollar liabilities created maturity mismatches. These mismatches left the financial system in the Republic of Korea vulnerable to the global financial crisis.
In recognition of the sources of its vulnerabilities, the Republic of Korea introduced a series of macroprudential measures beginning in June 2010 to build into the
banking system resilience against capital flow reversals and associated disruptions to domestic financial conditions.
The first policy measure, announced in June 2010, was a leverage cap on the notional value of foreign exchange derivatives contracts (encompassing currency swaps and forwards) that banks could maintain (IMF 2012). For branches of foreign banks, the cap was set at 250% times their capital, and for domestic banks 50%. In principle, foreign banks could increase their positions by allocating greater capital to their branches in the Republic of Korea, but the leverage cap lowers returns on capital for banks engaged in this business segment, discouraging their expansion of derivatives positions.
The second component was the levy on the non-core liabilities of the banks, called the macroprudential stability levy. The levy consists of an annualized charge of 20 basis points on banks’ non-deposit foreign currency liabilities with maturities of up to 12 months. Lower rates are applied in a graduated manner to maturities of over 1 year. The proceeds of the levy are paid into a special segregated account of the foreign exchange reserves, rather than into general government revenue. In this respect, the levy was designed from the outset as a tool to maintain financial stability, not a fiscal measure, in contrast with outwardly similar bank levies introduced by several European countries after the crisis. Also, by targeting only non-core liabilities, the levy was designed to address banks’ procyclical tendencies while leaving unaffected, as far as possible, banks’ lending of core funding from savers to borrowers. The non-core liabilities levy in the Republic of Korea was less familiar than standard macroprudential tools such as unremunerated reserve requirements. Although the policy was discussed publicly from February 2010, the measure was not formally announced until December 2010, after the conclusion of the November summit of the Group of 20 in Seoul. The legislation was passed in April 2011, and the levy began to be collected in August 2011 (IMF 2012).
A recent study by Bruno and Shin (2013) reports on a preliminary empirical assessment of the impact of the Korean macroprudential measures. The assessment is based on a panel study in which the Republic of Korea is one of 48 countries in a sample of advanced and emerging economies. The approach is to treat the countries other than the Republic of Korea as a comparison group and ask, first, how its susceptibility to the global “supply–push” factors in capital flows compared with that of the other countries during the entire sample period. Then,
1 Banks’ short-term foreign currency liability in the Republic of Korea
0
60
120
180
Mar2009
Mar2007
Mar2005
Mar2003
Mar2001
Mar1999
Mar1997
Mar1995
$ billion
146.24
Domestic banksBranches of foreign banksAll banks
Source: Bank of Korea.
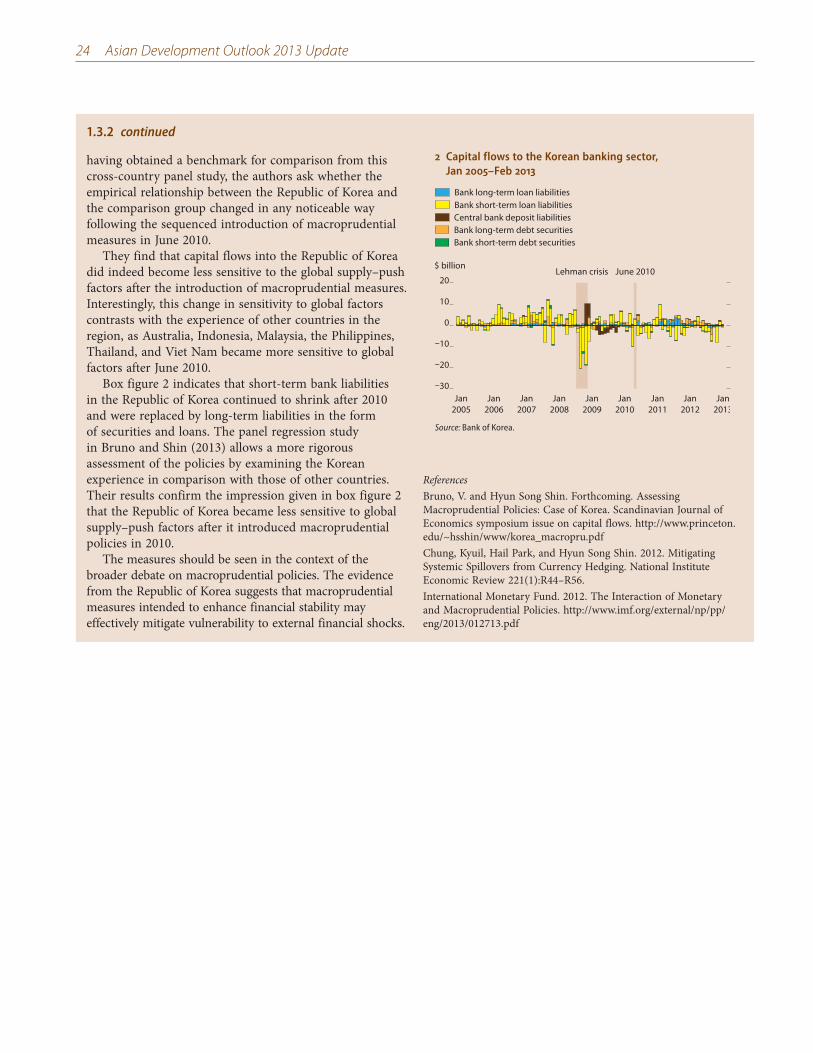
24 Asian Development Outlook 2013 Update
having obtained a benchmark for comparison from this cross-country panel study, the authors ask whether the empirical relationship between the Republic of Korea and the comparison group changed in any noticeable way following the sequenced introduction of macroprudential measures in June 2010.
They find that capital flows into the Republic of Korea did indeed become less sensitive to the global supply–push factors after the introduction of macroprudential measures. Interestingly, this change in sensitivity to global factors contrasts with the experience of other countries in the region, as Australia, Indonesia, Malaysia, the Philippines, Thailand, and Viet Nam became more sensitive to global factors after June 2010.
Box figure 2 indicates that short-term bank liabilities in the Republic of Korea continued to shrink after 2010 and were replaced by long-term liabilities in the form of securities and loans. The panel regression study in Bruno and Shin (2013) allows a more rigorous assessment of the policies by examining the Korean experience in comparison with those of other countries. Their results confirm the impression given in box figure 2 that the Republic of Korea became less sensitive to global supply–push factors after it introduced macroprudential policies in 2010.
The measures should be seen in the context of the broader debate on macroprudential policies. The evidence from the Republic of Korea suggests that macroprudential measures intended to enhance financial stability may effectively mitigate vulnerability to external financial shocks.
ReferencesBruno, V. and Hyun Song Shin. Forthcoming. Assessing Macroprudential Policies: Case of Korea. Scandinavian Journal of Economics symposium issue on capital flows. http://www.princeton.edu/~hsshin/www/korea_macropru.pdfChung, Kyuil, Hail Park, and Hyun Song Shin. 2012. Mitigating Systemic Spillovers from Currency Hedging. National Institute Economic Review 221(1):R44–R56.International Monetary Fund. 2012. The Interaction of Monetary and Macroprudential Policies. http://www.imf.org/external/np/pp/eng/2013/012713.pdf
2 Capital flows to the Korean banking sector, Jan 2005–Feb 2013
Bank short-term loan liabilitiesCentral bank deposit liabilitiesBank long-term debt securitiesBank short-term debt securities
Bank long-term loan liabilities
$ billion June 2010Lehman crisis
–30
–20
–10
0
10
20
Jan2005
Jan2006
Jan2007
Jan2008
Jan2009
Jan2010
Jan2011
Jan2012
Jan2013
Source: Bank of Korea.
1.3.2 continued
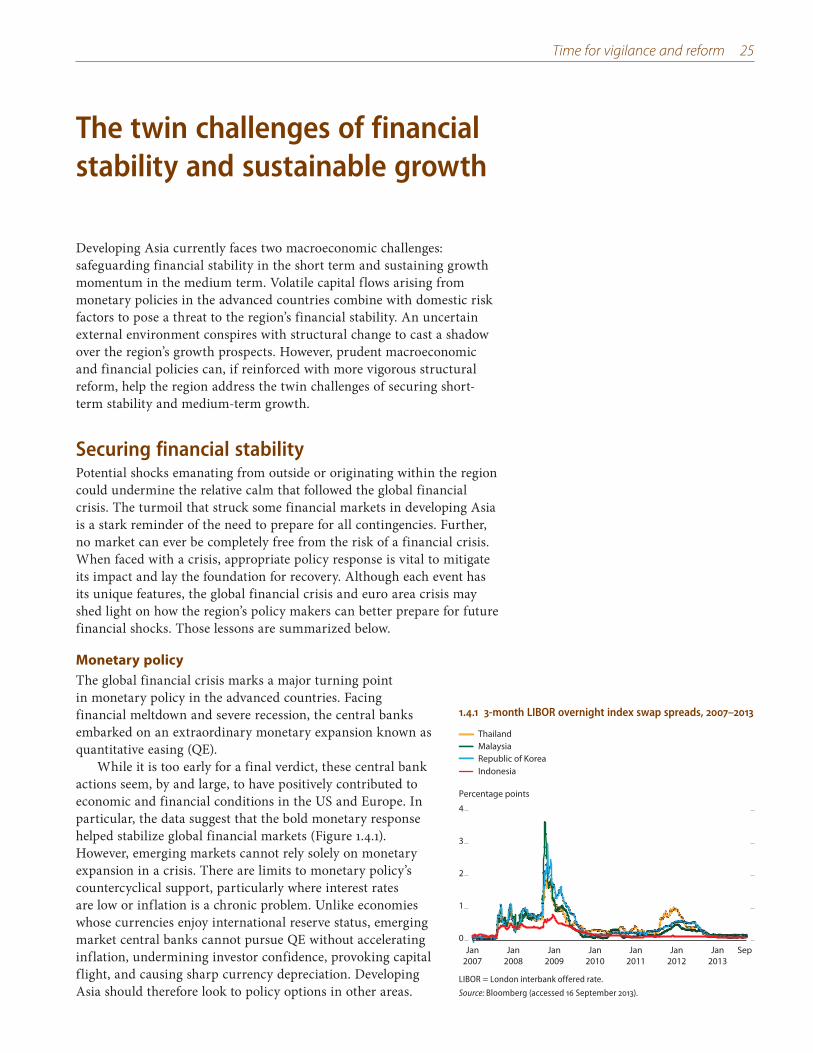
Time for vigilance and reform 25
The twin challenges of financial stability and sustainable growth
Developing Asia currently faces two macroeconomic challenges: safeguarding financial stability in the short term and sustaining growth momentum in the medium term. Volatile capital flows arising from monetary policies in the advanced countries combine with domestic risk factors to pose a threat to the region’s financial stability. An uncertain external environment conspires with structural change to cast a shadow over the region’s growth prospects. However, prudent macroeconomic and financial policies can, if reinforced with more vigorous structural reform, help the region address the twin challenges of securing short-term stability and medium-term growth.
Securing financial stabilityPotential shocks emanating from outside or originating within the region could undermine the relative calm that followed the global financial crisis. The turmoil that struck some financial markets in developing Asia is a stark reminder of the need to prepare for all contingencies. Further, no market can ever be completely free from the risk of a financial crisis. When faced with a crisis, appropriate policy response is vital to mitigate its impact and lay the foundation for recovery. Although each event has its unique features, the global financial crisis and euro area crisis may shed light on how the region’s policy makers can better prepare for future financial shocks. Those lessons are summarized below.
Monetary policy The global financial crisis marks a major turning point in monetary policy in the advanced countries. Facing financial meltdown and severe recession, the central banks embarked on an extraordinary monetary expansion known as quantitative easing (QE).
While it is too early for a final verdict, these central bank actions seem, by and large, to have positively contributed to economic and financial conditions in the US and Europe. In particular, the data suggest that the bold monetary response helped stabilize global financial markets (Figure 1.4.1). However, emerging markets cannot rely solely on monetary expansion in a crisis. There are limits to monetary policy’s countercyclical support, particularly where interest rates are low or inflation is a chronic problem. Unlike economies whose currencies enjoy international reserve status, emerging market central banks cannot pursue QE without accelerating inflation, undermining investor confidence, provoking capital flight, and causing sharp currency depreciation. Developing Asia should therefore look to policy options in other areas.
1.4.1 3-month LIBOR overnight index swap spreads, 2007–2013
0
1
2
3
4
SepJan2013
Jan2012
Jan2011
Jan2010
Jan2009
Jan2008
Jan2007
Percentage points
IndonesiaRepublic of KoreaMalaysiaThailand
LIBOR = London interbank offered rate.
Source: Bloomberg (accessed 16 September 2013).
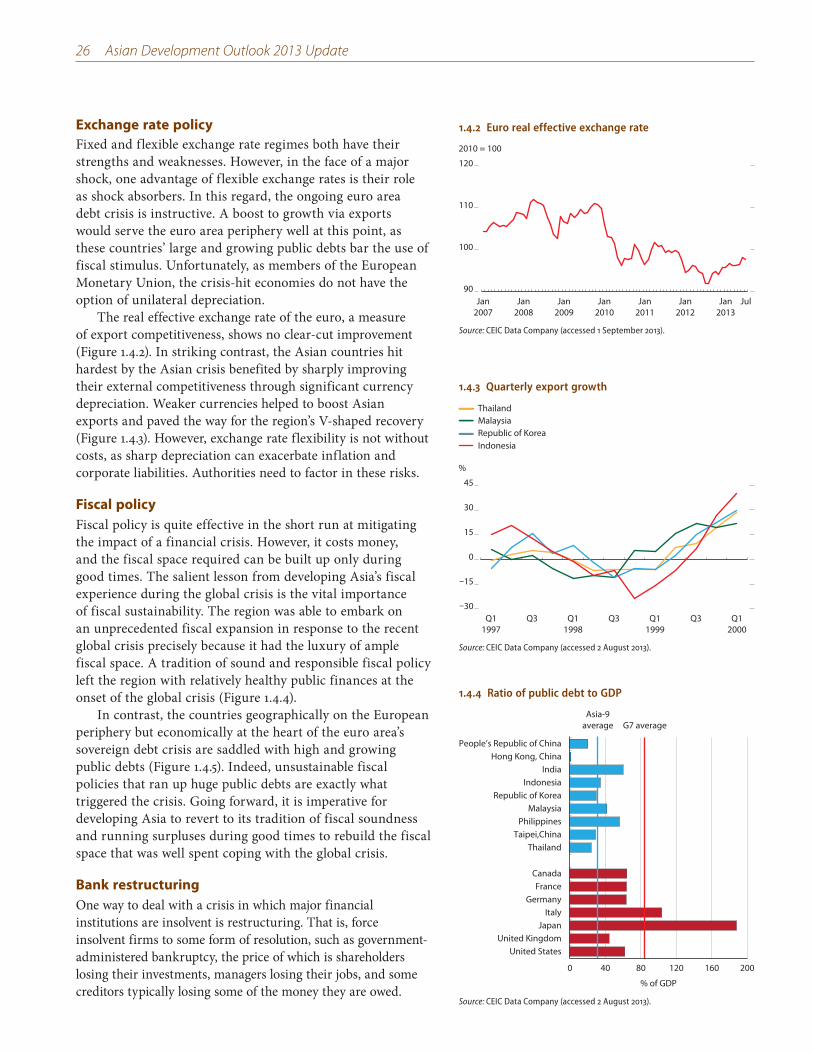
26 Asian Development Outlook 2013 Update
Exchange rate policy Fixed and flexible exchange rate regimes both have their strengths and weaknesses. However, in the face of a major shock, one advantage of flexible exchange rates is their role as shock absorbers. In this regard, the ongoing euro area debt crisis is instructive. A boost to growth via exports would serve the euro area periphery well at this point, as these countries’ large and growing public debts bar the use of fiscal stimulus. Unfortunately, as members of the European Monetary Union, the crisis-hit economies do not have the option of unilateral depreciation.
The real effective exchange rate of the euro, a measure of export competitiveness, shows no clear-cut improvement (Figure 1.4.2). In striking contrast, the Asian countries hit hardest by the Asian crisis benefited by sharply improving their external competitiveness through significant currency depreciation. Weaker currencies helped to boost Asian exports and paved the way for the region’s V-shaped recovery (Figure 1.4.3). However, exchange rate flexibility is not without costs, as sharp depreciation can exacerbate inflation and corporate liabilities. Authorities need to factor in these risks.
Fiscal policy Fiscal policy is quite effective in the short run at mitigating the impact of a financial crisis. However, it costs money, and the fiscal space required can be built up only during good times. The salient lesson from developing Asia’s fiscal experience during the global crisis is the vital importance of fiscal sustainability. The region was able to embark on an unprecedented fiscal expansion in response to the recent global crisis precisely because it had the luxury of ample fiscal space. A tradition of sound and responsible fiscal policy left the region with relatively healthy public finances at the onset of the global crisis (Figure 1.4.4).
In contrast, the countries geographically on the European periphery but economically at the heart of the euro area’s sovereign debt crisis are saddled with high and growing public debts (Figure 1.4.5). Indeed, unsustainable fiscal policies that ran up huge public debts are exactly what triggered the crisis. Going forward, it is imperative for developing Asia to revert to its tradition of fiscal soundness and running surpluses during good times to rebuild the fiscal space that was well spent coping with the global crisis.
Bank restructuring
One way to deal with a crisis in which major financial institutions are insolvent is restructuring. That is, force insolvent firms to some form of resolution, such as government-administered bankruptcy, the price of which is shareholders losing their investments, managers losing their jobs, and some creditors typically losing some of the money they are owed.
1.4.2 Euro real effective exchange rate
90
100
110
120
JulJan2013
Jan2012
Jan2011
Jan2010
Jan2009
Jan2008
Jan2007
2010 = 100
Source: CEIC Data Company (accessed 1 September 2013).
1.4.3 Quarterly export growth
–30
–15
0
15
30
45
Q12000
Q3Q11999
Q3Q11998
Q3Q11997
%
IndonesiaRepublic of KoreaMalaysiaThailand
Source: CEIC Data Company (accessed 2 August 2013).
1.4.4 Ratio of public debt to GDP
0 40 80 120 160 200
United StatesUnited Kingdom
JapanItaly
GermanyFrance
Canada
ThailandTaipei,China
PhilippinesMalaysia
Republic of KoreaIndonesia
IndiaHong Kong, China
People’s Republic of China
% of GDP
Asia-9average G7 average
Source: CEIC Data Company (accessed 2 August 2013).
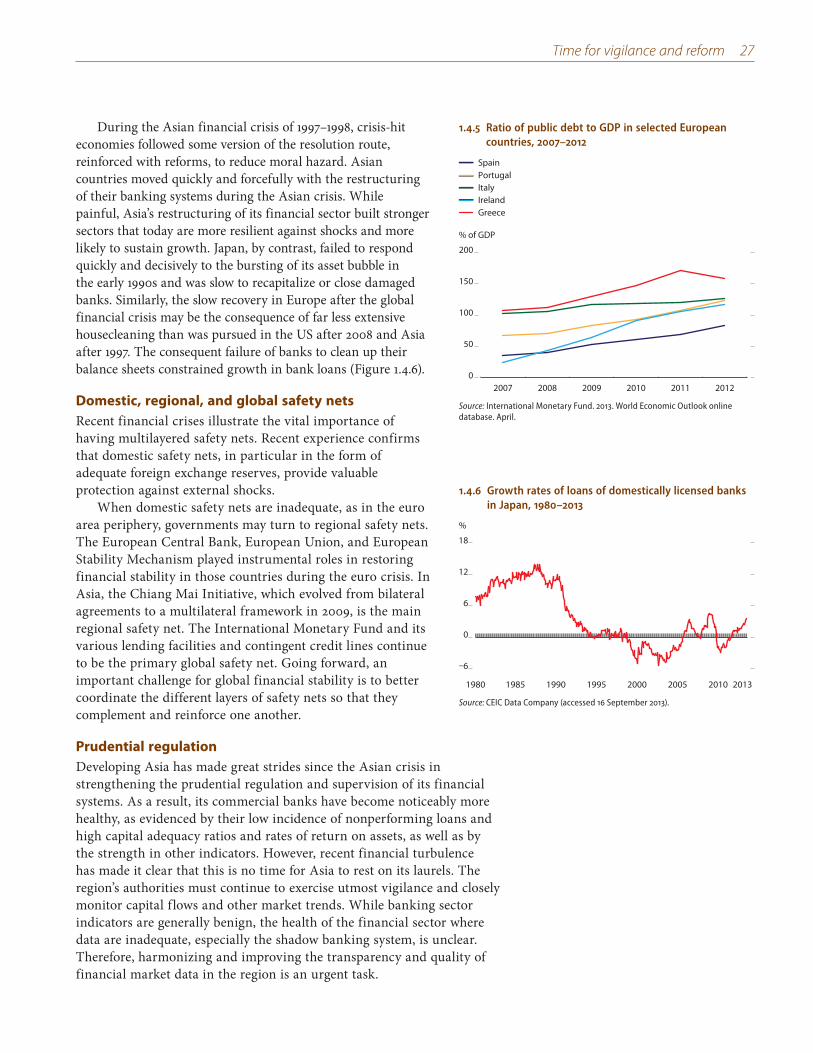
Time for vigilance and reform 27
During the Asian financial crisis of 1997–1998, crisis-hit economies followed some version of the resolution route, reinforced with reforms, to reduce moral hazard. Asian countries moved quickly and forcefully with the restructuring of their banking systems during the Asian crisis. While painful, Asia’s restructuring of its financial sector built stronger sectors that today are more resilient against shocks and more likely to sustain growth. Japan, by contrast, failed to respond quickly and decisively to the bursting of its asset bubble in the early 1990s and was slow to recapitalize or close damaged banks. Similarly, the slow recovery in Europe after the global financial crisis may be the consequence of far less extensive housecleaning than was pursued in the US after 2008 and Asia after 1997. The consequent failure of banks to clean up their balance sheets constrained growth in bank loans (Figure 1.4.6).
Domestic, regional, and global safety nets Recent financial crises illustrate the vital importance of having multilayered safety nets. Recent experience confirms that domestic safety nets, in particular in the form of adequate foreign exchange reserves, provide valuable protection against external shocks.
When domestic safety nets are inadequate, as in the euro area periphery, governments may turn to regional safety nets. The European Central Bank, European Union, and European Stability Mechanism played instrumental roles in restoring financial stability in those countries during the euro crisis. In Asia, the Chiang Mai Initiative, which evolved from bilateral agreements to a multilateral framework in 2009, is the main regional safety net. The International Monetary Fund and its various lending facilities and contingent credit lines continue to be the primary global safety net. Going forward, an important challenge for global financial stability is to better coordinate the different layers of safety nets so that they complement and reinforce one another.
Prudential regulation
Developing Asia has made great strides since the Asian crisis in strengthening the prudential regulation and supervision of its financial systems. As a result, its commercial banks have become noticeably more healthy, as evidenced by their low incidence of nonperforming loans and high capital adequacy ratios and rates of return on assets, as well as by the strength in other indicators. However, recent financial turbulence has made it clear that this is no time for Asia to rest on its laurels. The region’s authorities must continue to exercise utmost vigilance and closely monitor capital flows and other market trends. While banking sector indicators are generally benign, the health of the financial sector where data are inadequate, especially the shadow banking system, is unclear. Therefore, harmonizing and improving the transparency and quality of financial market data in the region is an urgent task.
1.4.5 Ratio of public debt to GDP in selected European countries, 2007–2012
0
50
100
150
200
201220112010200920082007
% of GDP
GreeceIrelandItalyPortugalSpain
Source: International Monetary Fund. 2013. World Economic Outlook online database. April.
1.4.6 Growth rates of loans of domestically licensed banks in Japan, 1980–2013
–6
0
6
12
18
20132010200520001995199019851980
%
Source: CEIC Data Company (accessed 16 September 2013).
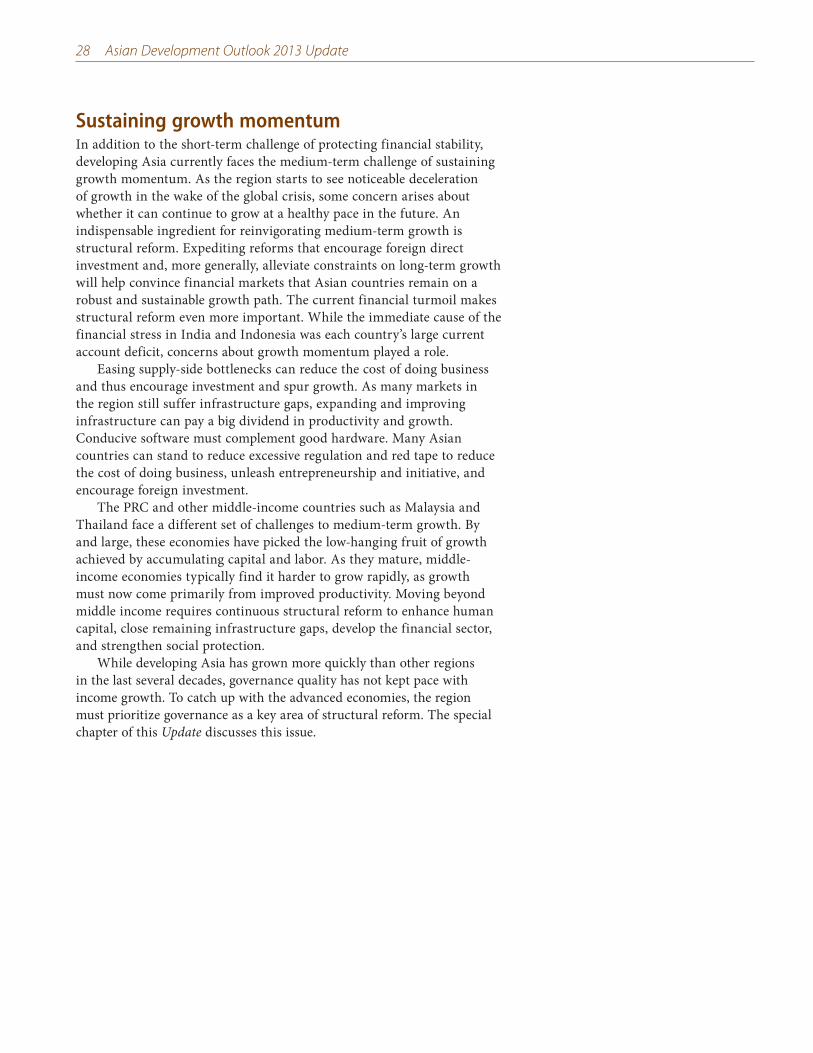
28 Asian Development Outlook 2013 Update
Sustaining growth momentumIn addition to the short-term challenge of protecting financial stability, developing Asia currently faces the medium-term challenge of sustaining growth momentum. As the region starts to see noticeable deceleration of growth in the wake of the global crisis, some concern arises about whether it can continue to grow at a healthy pace in the future. An indispensable ingredient for reinvigorating medium-term growth is structural reform. Expediting reforms that encourage foreign direct investment and, more generally, alleviate constraints on long-term growth will help convince financial markets that Asian countries remain on a robust and sustainable growth path. The current financial turmoil makes structural reform even more important. While the immediate cause of the financial stress in India and Indonesia was each country’s large current account deficit, concerns about growth momentum played a role.
Easing supply-side bottlenecks can reduce the cost of doing business and thus encourage investment and spur growth. As many markets in the region still suffer infrastructure gaps, expanding and improving infrastructure can pay a big dividend in productivity and growth. Conducive software must complement good hardware. Many Asian countries can stand to reduce excessive regulation and red tape to reduce the cost of doing business, unleash entrepreneurship and initiative, and encourage foreign investment.
The PRC and other middle-income countries such as Malaysia and Thailand face a different set of challenges to medium-term growth. By and large, these economies have picked the low-hanging fruit of growth achieved by accumulating capital and labor. As they mature, middle-income economies typically find it harder to grow rapidly, as growth must now come primarily from improved productivity. Moving beyond middle income requires continuous structural reform to enhance human capital, close remaining infrastructure gaps, develop the financial sector, and strengthen social protection.
While developing Asia has grown more quickly than other regions in the last several decades, governance quality has not kept pace with income growth. To catch up with the advanced economies, the region must prioritize governance as a key area of structural reform. The special chapter of this Update discusses this issue.
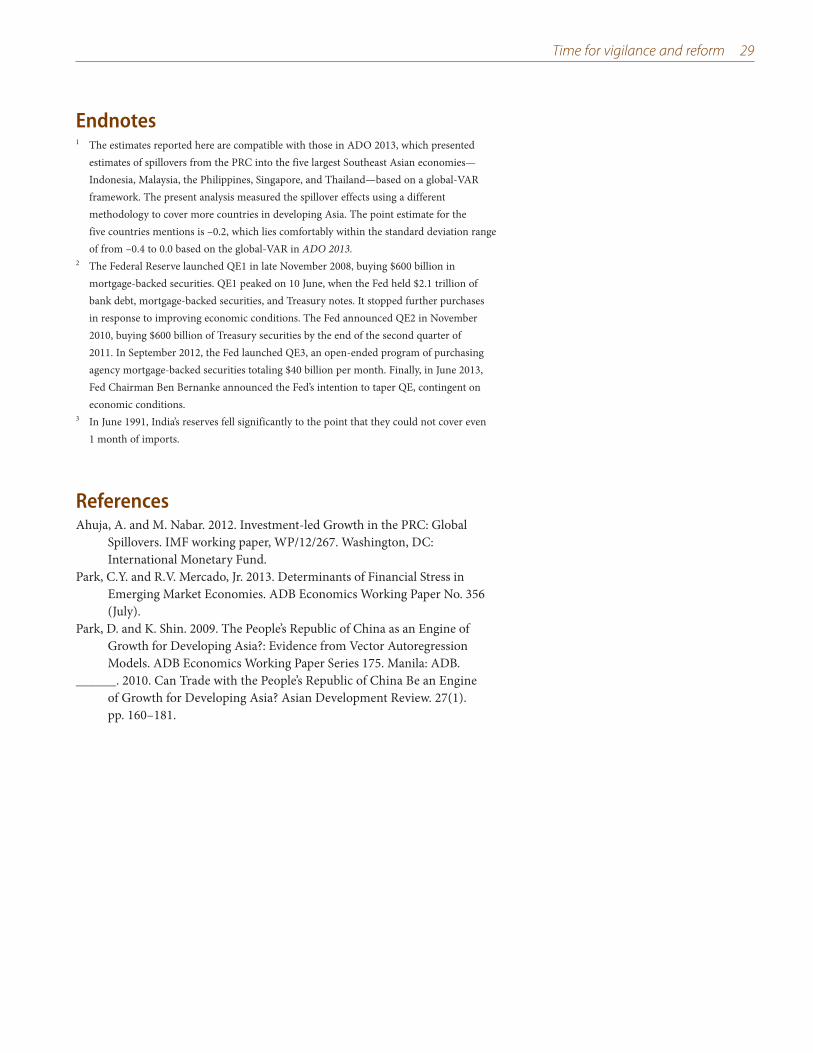
Time for vigilance and reform 29
Endnotes1 The estimates reported here are compatible with those in ADO 2013, which presented
estimates of spillovers from the PRC into the five largest Southeast Asian economies—Indonesia, Malaysia, the Philippines, Singapore, and Thailand—based on a global-VAR framework. The present analysis measured the spillover effects using a different methodology to cover more countries in developing Asia. The point estimate for the five countries mentions is –0.2, which lies comfortably within the standard deviation range of from –0.4 to 0.0 based on the global-VAR in ADO 2013.
2 The Federal Reserve launched QE1 in late November 2008, buying $600 billion in mortgage-backed securities. QE1 peaked on 10 June, when the Fed held $2.1 trillion of bank debt, mortgage-backed securities, and Treasury notes. It stopped further purchases in response to improving economic conditions. The Fed announced QE2 in November 2010, buying $600 billion of Treasury securities by the end of the second quarter of 2011. In September 2012, the Fed launched QE3, an open-ended program of purchasing agency mortgage-backed securities totaling $40 billion per month. Finally, in June 2013, Fed Chairman Ben Bernanke announced the Fed’s intention to taper QE, contingent on economic conditions.
3 In June 1991, India’s reserves fell significantly to the point that they could not cover even 1 month of imports.
ReferencesAhuja, A. and M. Nabar. 2012. Investment-led Growth in the PRC: Global
Spillovers. IMF working paper, WP/12/267. Washington, DC: International Monetary Fund.
Park, C.Y. and R.V. Mercado, Jr. 2013. Determinants of Financial Stress in Emerging Market Economies. ADB Economics Working Paper No. 356 (July).
Park, D. and K. Shin. 2009. The People’s Republic of China as an Engine of Growth for Developing Asia?: Evidence from Vector Autoregression Models. ADB Economics Working Paper Series 175. Manila: ADB.
______. 2010. Can Trade with the People’s Republic of China Be an Engine of Growth for Developing Asia? Asian Development Review. 27(1). pp. 160–181.
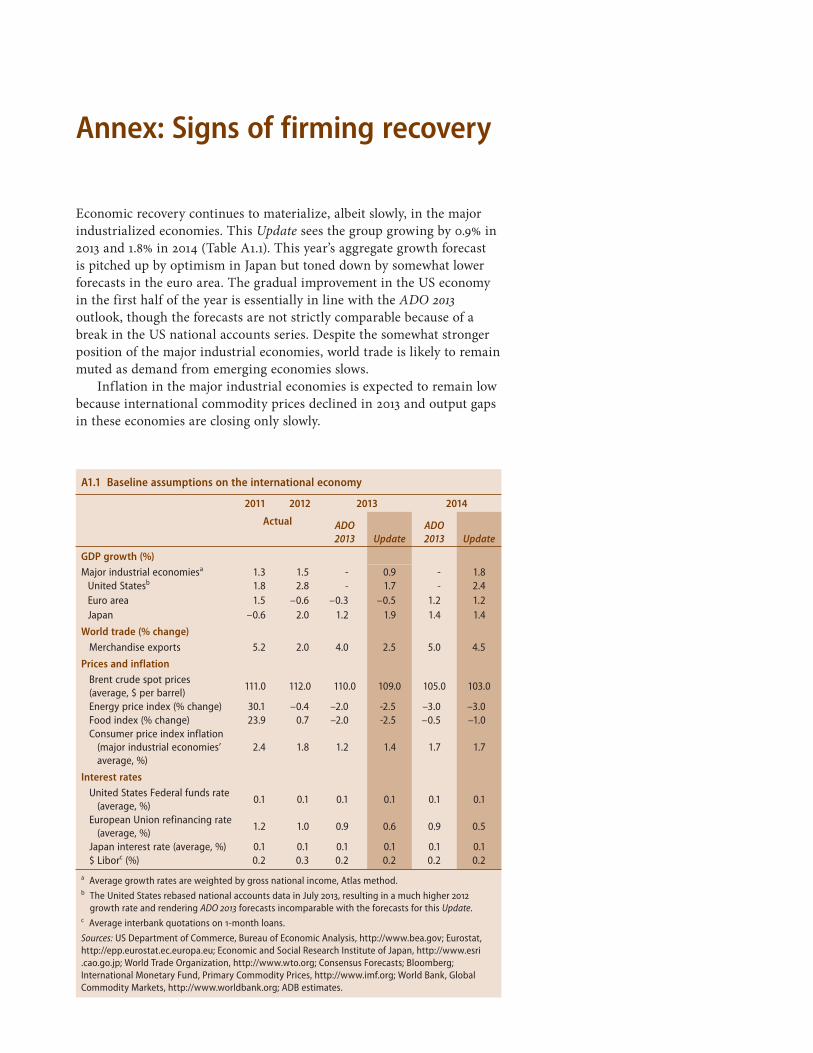
Annex: Signs of firming recovery
Economic recovery continues to materialize, albeit slowly, in the major industrialized economies. This Update sees the group growing by 0.9% in 2013 and 1.8% in 2014 (Table A1.1). This year’s aggregate growth forecast is pitched up by optimism in Japan but toned down by somewhat lower forecasts in the euro area. The gradual improvement in the US economy in the first half of the year is essentially in line with the ADO 2013 outlook, though the forecasts are not strictly comparable because of a break in the US national accounts series. Despite the somewhat stronger position of the major industrial economies, world trade is likely to remain muted as demand from emerging economies slows.
Inflation in the major industrial economies is expected to remain low because international commodity prices declined in 2013 and output gaps in these economies are closing only slowly.
A1.1 Baseline assumptions on the international economy
2011 2012 2013 2014
Actual ADO 2013 Update
ADO 2013 Update
GDP growth (%)Major industrial economiesa 1.3 1.5 - 0.9 - 1.8
United Statesb 1.8 2.8 - 1.7 - 2.4Euro area 1.5 –0.6 –0.3 –0.5 1.2 1.2Japan –0.6 2.0 1.2 1.9 1.4 1.4
World trade (% change)Merchandise exports 5.2 2.0 4.0 2.5 5.0 4.5
Prices and inflationBrent crude spot prices (average, $ per barrel)
111.0 112.0 110.0 109.0 105.0 103.0
Energy price index (% change) 30.1 –0.4 –2.0 -2.5 –3.0 –3.0Food index (% change) 23.9 0.7 –2.0 -2.5 –0.5 –1.0Consumer price index inflation
(major industrial economies’ average, %)
2.4 1.8 1.2 1.4 1.7 1.7
Interest ratesUnited States Federal funds rate
(average, %)0.1 0.1 0.1 0.1 0.1 0.1
European Union refinancing rate (average, %)
1.2 1.0 0.9 0.6 0.9 0.5
Japan interest rate (average, %) 0.1 0.1 0.1 0.1 0.1 0.1$ Liborc (%) 0.2 0.3 0.2 0.2 0.2 0.2
a Average growth rates are weighted by gross national income, Atlas method.b The United States rebased national accounts data in July 2013, resulting in a much higher 2012
growth rate and rendering ADO 2013 forecasts incomparable with the forecasts for this Update.c Average interbank quotations on 1-month loans.
Sources: US Department of Commerce, Bureau of Economic Analysis, http://www.bea.gov; Eurostat, http://epp.eurostat.ec.europa.eu; Economic and Social Research Institute of Japan, http://www.esri .cao.go.jp; World Trade Organization, http://www.wto.org; Consensus Forecasts; Bloomberg; International Monetary Fund, Primary Commodity Prices, http://www.imf.org; World Bank, Global Commodity Markets, http://www.worldbank.org; ADB estimates.
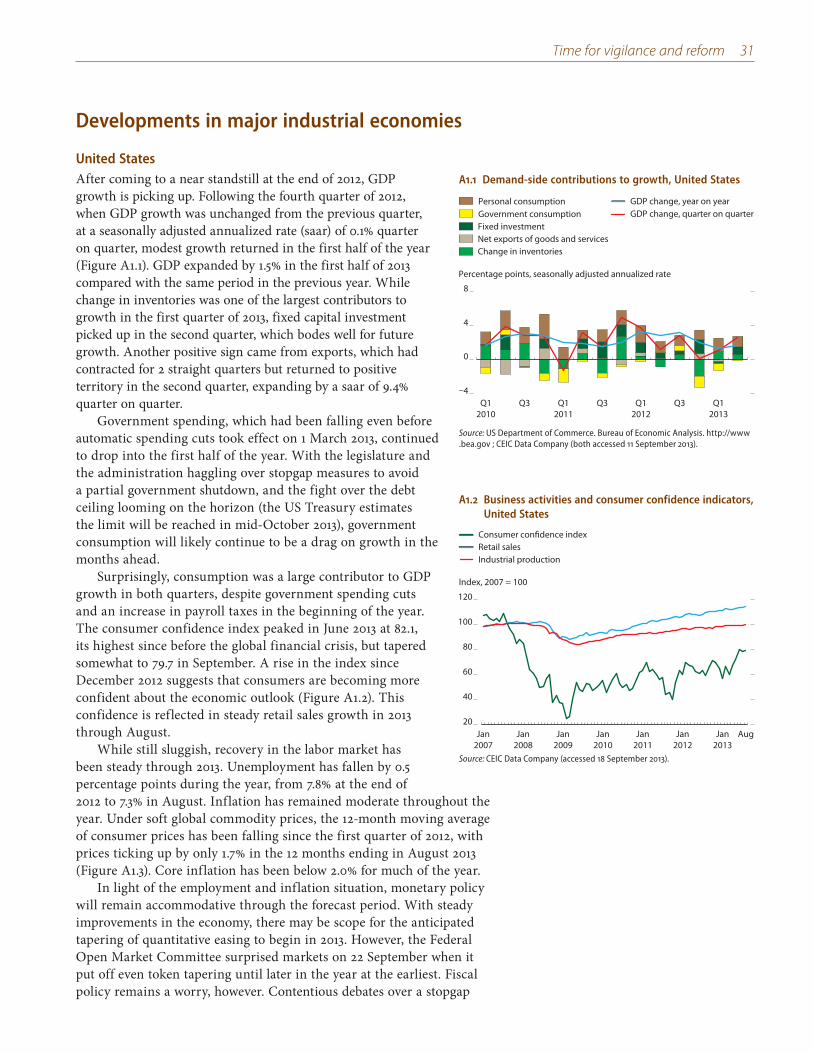
Time for vigilance and reform 31
Developments in major industrial economies
United StatesAfter coming to a near standstill at the end of 2012, GDP growth is picking up. Following the fourth quarter of 2012, when GDP growth was unchanged from the previous quarter, at a seasonally adjusted annualized rate (saar) of 0.1% quarter on quarter, modest growth returned in the first half of the year (Figure A1.1). GDP expanded by 1.5% in the first half of 2013 compared with the same period in the previous year. While change in inventories was one of the largest contributors to growth in the first quarter of 2013, fixed capital investment picked up in the second quarter, which bodes well for future growth. Another positive sign came from exports, which had contracted for 2 straight quarters but returned to positive territory in the second quarter, expanding by a saar of 9.4% quarter on quarter.
Government spending, which had been falling even before automatic spending cuts took effect on 1 March 2013, continued to drop into the first half of the year. With the legislature and the administration haggling over stopgap measures to avoid a partial government shutdown, and the fight over the debt ceiling looming on the horizon (the US Treasury estimates the limit will be reached in mid-October 2013), government consumption will likely continue to be a drag on growth in the months ahead.
Surprisingly, consumption was a large contributor to GDP growth in both quarters, despite government spending cuts and an increase in payroll taxes in the beginning of the year. The consumer confidence index peaked in June 2013 at 82.1, its highest since before the global financial crisis, but tapered somewhat to 79.7 in September. A rise in the index since December 2012 suggests that consumers are becoming more confident about the economic outlook (Figure A1.2). This confidence is reflected in steady retail sales growth in 2013 through August.
While still sluggish, recovery in the labor market has been steady through 2013. Unemployment has fallen by 0.5 percentage points during the year, from 7.8% at the end of 2012 to 7.3% in August. Inflation has remained moderate throughout the year. Under soft global commodity prices, the 12-month moving average of consumer prices has been falling since the first quarter of 2012, with prices ticking up by only 1.7% in the 12 months ending in August 2013 (Figure A1.3). Core inflation has been below 2.0% for much of the year.
In light of the employment and inflation situation, monetary policy will remain accommodative through the forecast period. With steady improvements in the economy, there may be scope for the anticipated tapering of quantitative easing to begin in 2013. However, the Federal Open Market Committee surprised markets on 22 September when it put off even token tapering until later in the year at the earliest. Fiscal policy remains a worry, however. Contentious debates over a stopgap
A1.2 Business activities and consumer confidence indicators, United States
20
40
60
80
100
120
AugJan2013
Jan2012
Jan2011
Jan2010
Jan2009
Jan2008
Jan2007
Index, 2007 = 100
Industrial productionRetail sales Consumer confidence index
Source: CEIC Data Company (accessed 18 September 2013).
A1.1 Demand-side contributions to growth, United States
Government consumption Fixed investmentNet exports of goods and servicesChange in inventories
Personal consumptionGDP change, quarter on quarterGDP change, year on year
–4
0
4
8
Q12010
Q3 Q12011
Q3 Q12012
Q3 Q12013
Percentage points, seasonally adjusted annualized rate
Source: US Department of Commerce. Bureau of Economic Analysis. http://www .bea.gov ; CEIC Data Company (both accessed 11 September 2013).
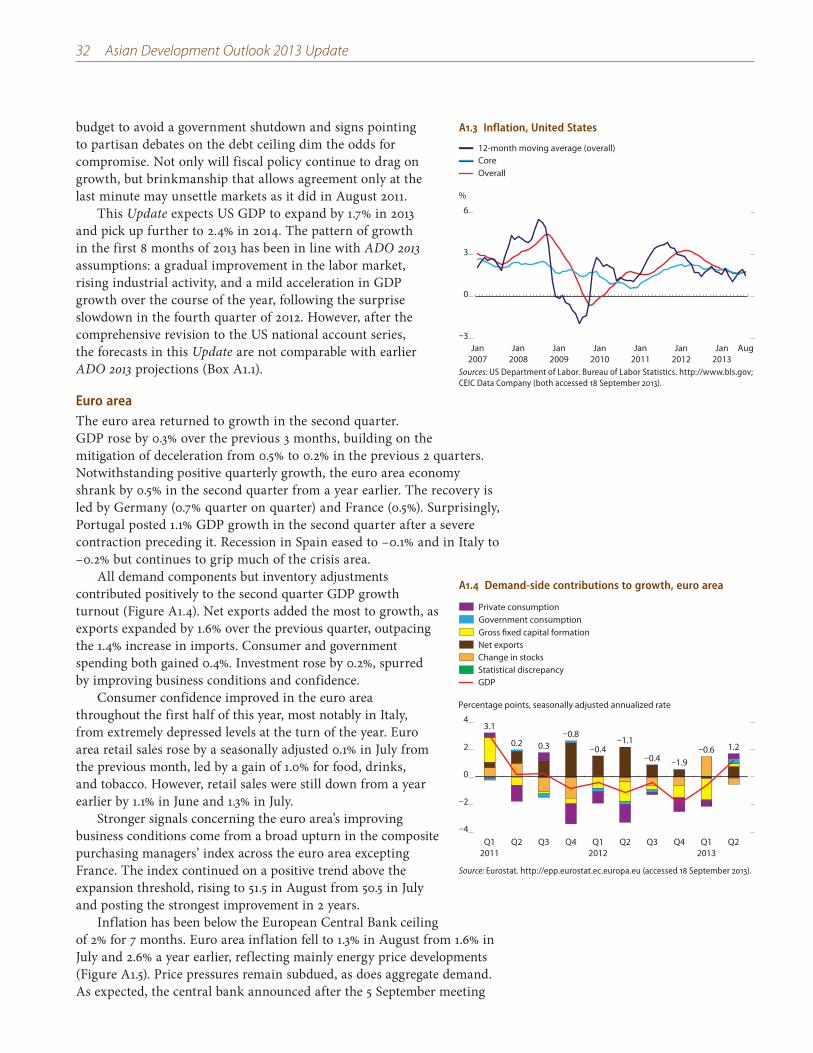
32 Asian Development Outlook 2013 Update
budget to avoid a government shutdown and signs pointing to partisan debates on the debt ceiling dim the odds for compromise. Not only will fiscal policy continue to drag on growth, but brinkmanship that allows agreement only at the last minute may unsettle markets as it did in August 2011.
This Update expects US GDP to expand by 1.7% in 2013 and pick up further to 2.4% in 2014. The pattern of growth in the first 8 months of 2013 has been in line with ADO 2013 assumptions: a gradual improvement in the labor market, rising industrial activity, and a mild acceleration in GDP growth over the course of the year, following the surprise slowdown in the fourth quarter of 2012. However, after the comprehensive revision to the US national account series, the forecasts in this Update are not comparable with earlier ADO 2013 projections (Box A1.1).
Euro areaThe euro area returned to growth in the second quarter. GDP rose by 0.3% over the previous 3 months, building on the mitigation of deceleration from 0.5% to 0.2% in the previous 2 quarters. Notwithstanding positive quarterly growth, the euro area economy shrank by 0.5% in the second quarter from a year earlier. The recovery is led by Germany (0.7% quarter on quarter) and France (0.5%). Surprisingly, Portugal posted 1.1% GDP growth in the second quarter after a severe contraction preceding it. Recession in Spain eased to –0.1% and in Italy to –0.2% but continues to grip much of the crisis area.
All demand components but inventory adjustments contributed positively to the second quarter GDP growth turnout (Figure A1.4). Net exports added the most to growth, as exports expanded by 1.6% over the previous quarter, outpacing the 1.4% increase in imports. Consumer and government spending both gained 0.4%. Investment rose by 0.2%, spurred by improving business conditions and confidence.
Consumer confidence improved in the euro area throughout the first half of this year, most notably in Italy, from extremely depressed levels at the turn of the year. Euro area retail sales rose by a seasonally adjusted 0.1% in July from the previous month, led by a gain of 1.0% for food, drinks, and tobacco. However, retail sales were still down from a year earlier by 1.1% in June and 1.3% in July.
Stronger signals concerning the euro area’s improving business conditions come from a broad upturn in the composite purchasing managers’ index across the euro area excepting France. The index continued on a positive trend above the expansion threshold, rising to 51.5 in August from 50.5 in July and posting the strongest improvement in 2 years.
Inflation has been below the European Central Bank ceiling of 2% for 7 months. Euro area inflation fell to 1.3% in August from 1.6% in July and 2.6% a year earlier, reflecting mainly energy price developments (Figure A1.5). Price pressures remain subdued, as does aggregate demand. As expected, the central bank announced after the 5 September meeting
A1.3 Inflation, United States
–3
0
3
6
AugJan2013
Jan2012
Jan2011
Jan2010
Jan2009
Jan2008
Jan2007
%
OverallCore12-month moving average (overall)
Sources: US Department of Labor. Bureau of Labor Statistics. http://www.bls.gov; CEIC Data Company (both accessed 18 September 2013).
A1.4 Demand-side contributions to growth, euro area
3.1
0.2 0.3–0.8
–0.4–1.1
–0.4 –1.9–0.6 1.2
–4
–2
0
2
4
Q12011
Q2 Q3 Q4 Q12012
Q2 Q3 Q4 Q12013
Q2
Percentage points, seasonally adjusted annualized rate
Gross fixed capital formationNet exportsChange in stocksStatistical discrepancyGDP
Government consumptionPrivate consumption
Source: Eurostat. http://epp.eurostat.ec.europa.eu (accessed 18 September 2013).
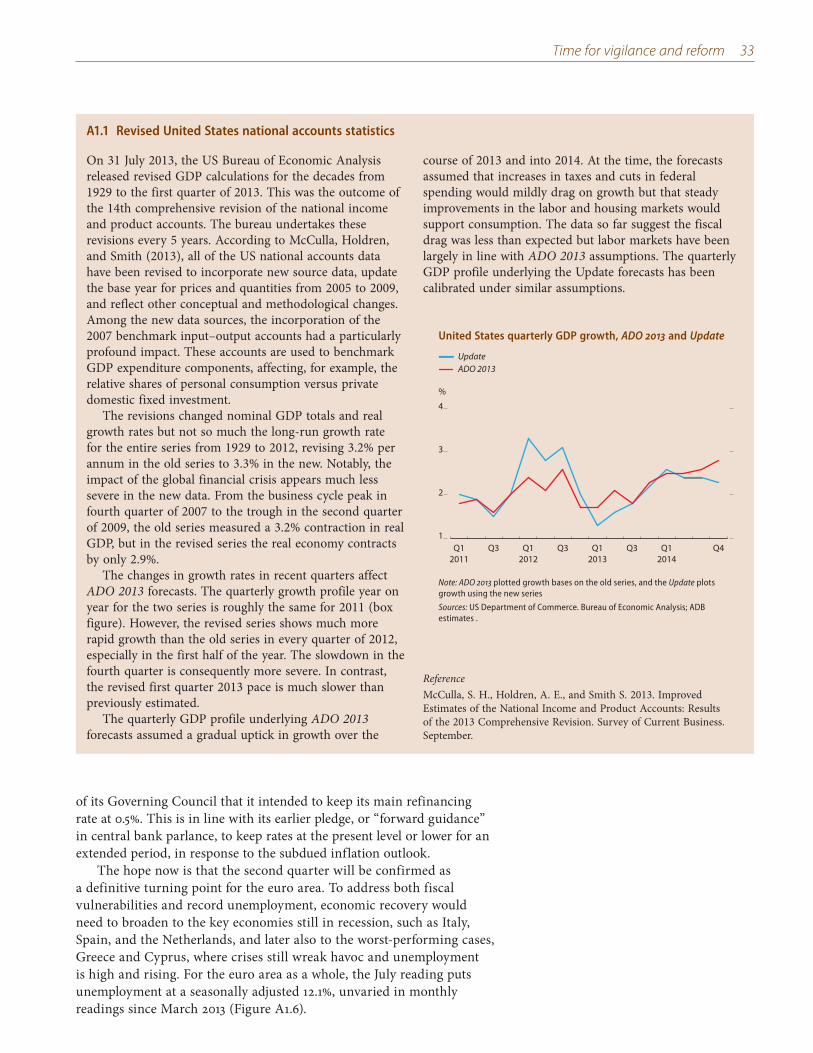
Time for vigilance and reform 33
of its Governing Council that it intended to keep its main refinancing rate at 0.5%. This is in line with its earlier pledge, or “forward guidance” in central bank parlance, to keep rates at the present level or lower for an extended period, in response to the subdued inflation outlook.
The hope now is that the second quarter will be confirmed as a definitive turning point for the euro area. To address both fiscal vulnerabilities and record unemployment, economic recovery would need to broaden to the key economies still in recession, such as Italy, Spain, and the Netherlands, and later also to the worst-performing cases, Greece and Cyprus, where crises still wreak havoc and unemployment is high and rising. For the euro area as a whole, the July reading puts unemployment at a seasonally adjusted 12.1%, unvaried in monthly readings since March 2013 (Figure A1.6).
A1.1 Revised United States national accounts statistics
On 31 July 2013, the US Bureau of Economic Analysis released revised GDP calculations for the decades from 1929 to the first quarter of 2013. This was the outcome of the 14th comprehensive revision of the national income and product accounts. The bureau undertakes these revisions every 5 years. According to McCulla, Holdren, and Smith (2013), all of the US national accounts data have been revised to incorporate new source data, update the base year for prices and quantities from 2005 to 2009, and reflect other conceptual and methodological changes. Among the new data sources, the incorporation of the 2007 benchmark input–output accounts had a particularly profound impact. These accounts are used to benchmark GDP expenditure components, affecting, for example, the relative shares of personal consumption versus private domestic fixed investment.
The revisions changed nominal GDP totals and real growth rates but not so much the long-run growth rate for the entire series from 1929 to 2012, revising 3.2% per annum in the old series to 3.3% in the new. Notably, the impact of the global financial crisis appears much less severe in the new data. From the business cycle peak in fourth quarter of 2007 to the trough in the second quarter of 2009, the old series measured a 3.2% contraction in real GDP, but in the revised series the real economy contracts by only 2.9%.
The changes in growth rates in recent quarters affect ADO 2013 forecasts. The quarterly growth profile year on year for the two series is roughly the same for 2011 (box figure). However, the revised series shows much more rapid growth than the old series in every quarter of 2012, especially in the first half of the year. The slowdown in the fourth quarter is consequently more severe. In contrast, the revised first quarter 2013 pace is much slower than previously estimated.
The quarterly GDP profile underlying ADO 2013 forecasts assumed a gradual uptick in growth over the
course of 2013 and into 2014. At the time, the forecasts assumed that increases in taxes and cuts in federal spending would mildly drag on growth but that steady improvements in the labor and housing markets would support consumption. The data so far suggest the fiscal drag was less than expected but labor markets have been largely in line with ADO 2013 assumptions. The quarterly GDP profile underlying the Update forecasts has been calibrated under similar assumptions.
ReferenceMcCulla, S. H., Holdren, A. E., and Smith S. 2013. Improved Estimates of the National Income and Product Accounts: Results of the 2013 Comprehensive Revision. Survey of Current Business. September.
United States quarterly GDP growth, ADO 2013 and Update
1
2
3
4
Q4Q12014
Q3Q12013
Q3Q12012
Q3Q12011
%
ADO 2013Update
Note: ADO 2013 plotted growth bases on the old series, and the Update plots growth using the new series
Sources: US Department of Commerce. Bureau of Economic Analysis; ADB estimates .
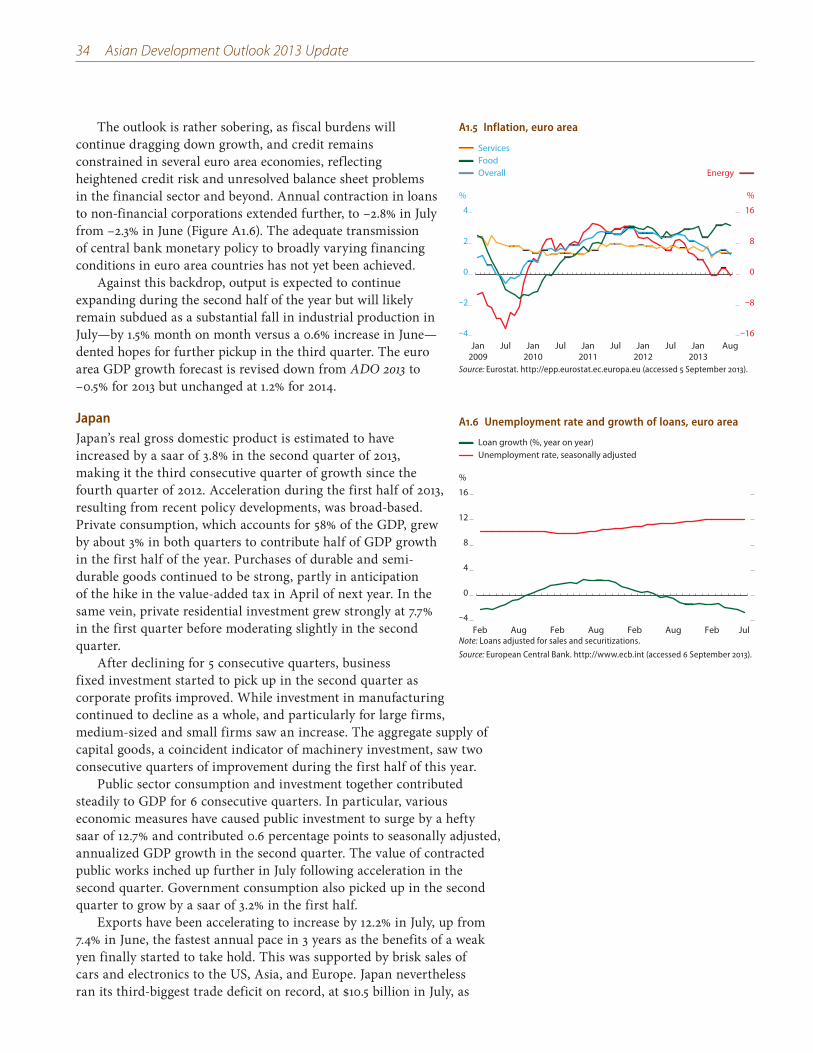
34 Asian Development Outlook 2013 Update
The outlook is rather sobering, as fiscal burdens will continue dragging down growth, and credit remains constrained in several euro area economies, reflecting heightened credit risk and unresolved balance sheet problems in the financial sector and beyond. Annual contraction in loans to non-financial corporations extended further, to –2.8% in July from –2.3% in June (Figure A1.6). The adequate transmission of central bank monetary policy to broadly varying financing conditions in euro area countries has not yet been achieved.
Against this backdrop, output is expected to continue expanding during the second half of the year but will likely remain subdued as a substantial fall in industrial production in July—by 1.5% month on month versus a 0.6% increase in June—dented hopes for further pickup in the third quarter. The euro area GDP growth forecast is revised down from ADO 2013 to –0.5% for 2013 but unchanged at 1.2% for 2014.
JapanJapan’s real gross domestic product is estimated to have increased by a saar of 3.8% in the second quarter of 2013, making it the third consecutive quarter of growth since the fourth quarter of 2012. Acceleration during the first half of 2013, resulting from recent policy developments, was broad-based. Private consumption, which accounts for 58% of the GDP, grew by about 3% in both quarters to contribute half of GDP growth in the first half of the year. Purchases of durable and semi-durable goods continued to be strong, partly in anticipation of the hike in the value-added tax in April of next year. In the same vein, private residential investment grew strongly at 7.7% in the first quarter before moderating slightly in the second quarter.
After declining for 5 consecutive quarters, business fixed investment started to pick up in the second quarter as corporate profits improved. While investment in manufacturing continued to decline as a whole, and particularly for large firms, medium-sized and small firms saw an increase. The aggregate supply of capital goods, a coincident indicator of machinery investment, saw two consecutive quarters of improvement during the first half of this year.
Public sector consumption and investment together contributed steadily to GDP for 6 consecutive quarters. In particular, various economic measures have caused public investment to surge by a hefty saar of 12.7% and contributed 0.6 percentage points to seasonally adjusted, annualized GDP growth in the second quarter. The value of contracted public works inched up further in July following acceleration in the second quarter. Government consumption also picked up in the second quarter to grow by a saar of 3.2% in the first half.
Exports have been accelerating to increase by 12.2% in July, up from 7.4% in June, the fastest annual pace in 3 years as the benefits of a weak yen finally started to take hold. This was supported by brisk sales of cars and electronics to the US, Asia, and Europe. Japan nevertheless ran its third-biggest trade deficit on record, at $10.5 billion in July, as
A1.5 Inflation, euro area
OverallFood Services
–4
–2
0
2
4
–16
–8
0
8
16
Aug Jan2013
JulJan2012
JulJan2011
JulJan2010
JulJan2009
% %
Energy
Source: Eurostat. http://epp.eurostat.ec.europa.eu (accessed 5 September 2013).
A1.6 Unemployment rate and growth of loans, euro area
–4
0
4
8
12
16
JulFebAugFebAugFebAugFeb
%
Unemployment rate, seasonally adjustedLoan growth (%, year on year)
Note: Loans adjusted for sales and securitizations.
Source: European Central Bank. http://www.ecb.int (accessed 6 September 2013).
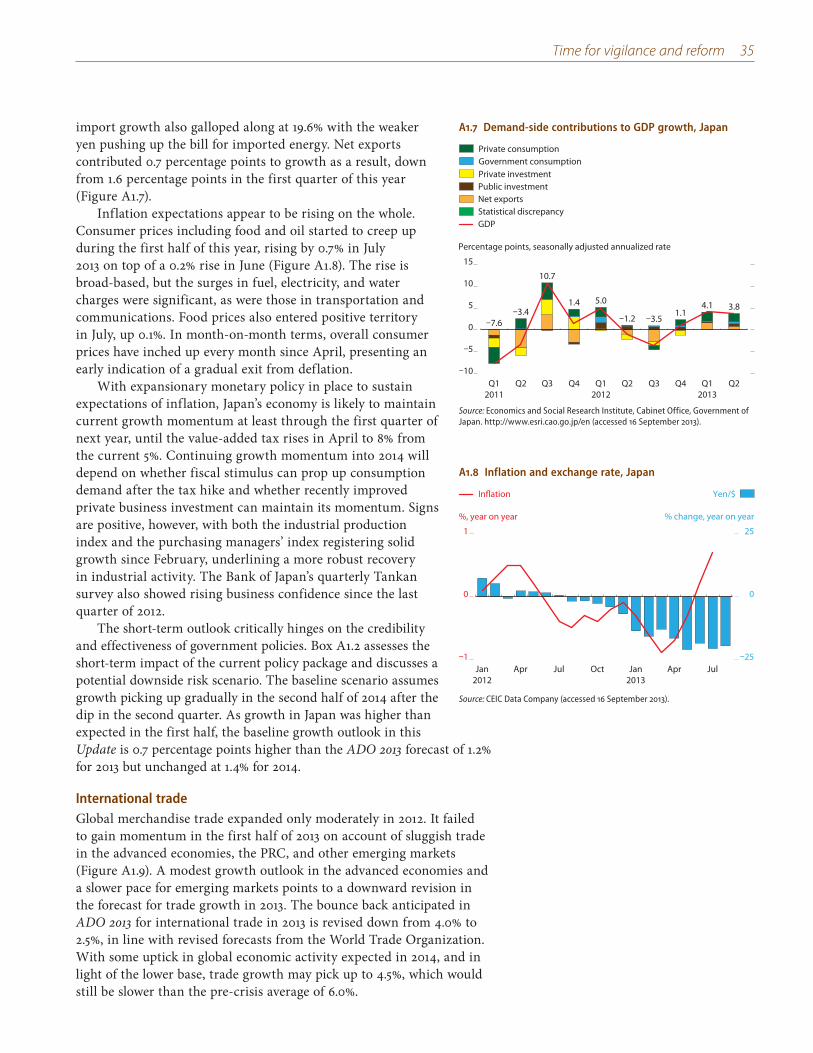
Time for vigilance and reform 35
import growth also galloped along at 19.6% with the weaker yen pushing up the bill for imported energy. Net exports contributed 0.7 percentage points to growth as a result, down from 1.6 percentage points in the first quarter of this year (Figure A1.7).
Inflation expectations appear to be rising on the whole. Consumer prices including food and oil started to creep up during the first half of this year, rising by 0.7% in July 2013 on top of a 0.2% rise in June (Figure A1.8). The rise is broad-based, but the surges in fuel, electricity, and water charges were significant, as were those in transportation and communications. Food prices also entered positive territory in July, up 0.1%. In month-on-month terms, overall consumer prices have inched up every month since April, presenting an early indication of a gradual exit from deflation.
With expansionary monetary policy in place to sustain expectations of inflation, Japan’s economy is likely to maintain current growth momentum at least through the first quarter of next year, until the value-added tax rises in April to 8% from the current 5%. Continuing growth momentum into 2014 will depend on whether fiscal stimulus can prop up consumption demand after the tax hike and whether recently improved private business investment can maintain its momentum. Signs are positive, however, with both the industrial production index and the purchasing managers’ index registering solid growth since February, underlining a more robust recovery in industrial activity. The Bank of Japan’s quarterly Tankan survey also showed rising business confidence since the last quarter of 2012.
The short-term outlook critically hinges on the credibility and effectiveness of government policies. Box A1.2 assesses the short-term impact of the current policy package and discusses a potential downside risk scenario. The baseline scenario assumes growth picking up gradually in the second half of 2014 after the dip in the second quarter. As growth in Japan was higher than expected in the first half, the baseline growth outlook in this Update is 0.7 percentage points higher than the ADO 2013 forecast of 1.2% for 2013 but unchanged at 1.4% for 2014.
International tradeGlobal merchandise trade expanded only moderately in 2012. It failed to gain momentum in the first half of 2013 on account of sluggish trade in the advanced economies, the PRC, and other emerging markets (Figure A1.9). A modest growth outlook in the advanced economies and a slower pace for emerging markets points to a downward revision in the forecast for trade growth in 2013. The bounce back anticipated in ADO 2013 for international trade in 2013 is revised down from 4.0% to 2.5%, in line with revised forecasts from the World Trade Organization. With some uptick in global economic activity expected in 2014, and in light of the lower base, trade growth may pick up to 4.5%, which would still be slower than the pre-crisis average of 6.0%.
A1.7 Demand-side contributions to GDP growth, Japan
Private investmentPublic investmentNet exportsStatistical discrepancyGDP
Government consumptionPrivate consumption
–7.6–3.4
10.7
1.4 5.0
–1.2 –3.51.1
4.1 3.8
–10
–5
0
5
10
15
Q12011
Q2 Q3 Q4 Q12012
Q2 Q3 Q4 Q12013
Q2
Percentage points, seasonally adjusted annualized rate
Source: Economics and Social Research Institute, Cabinet Office, Government of Japan. http://www.esri.cao.go.jp/en (accessed 16 September 2013).
A1.8 Inflation and exchange rate, Japan
Yen/$Inflation
–1
0
1
–25
0
25
JulAprJan2013
OctJulAprJan2012
%, year on year % change, year on year
Source: CEIC Data Company (accessed 16 September 2013).
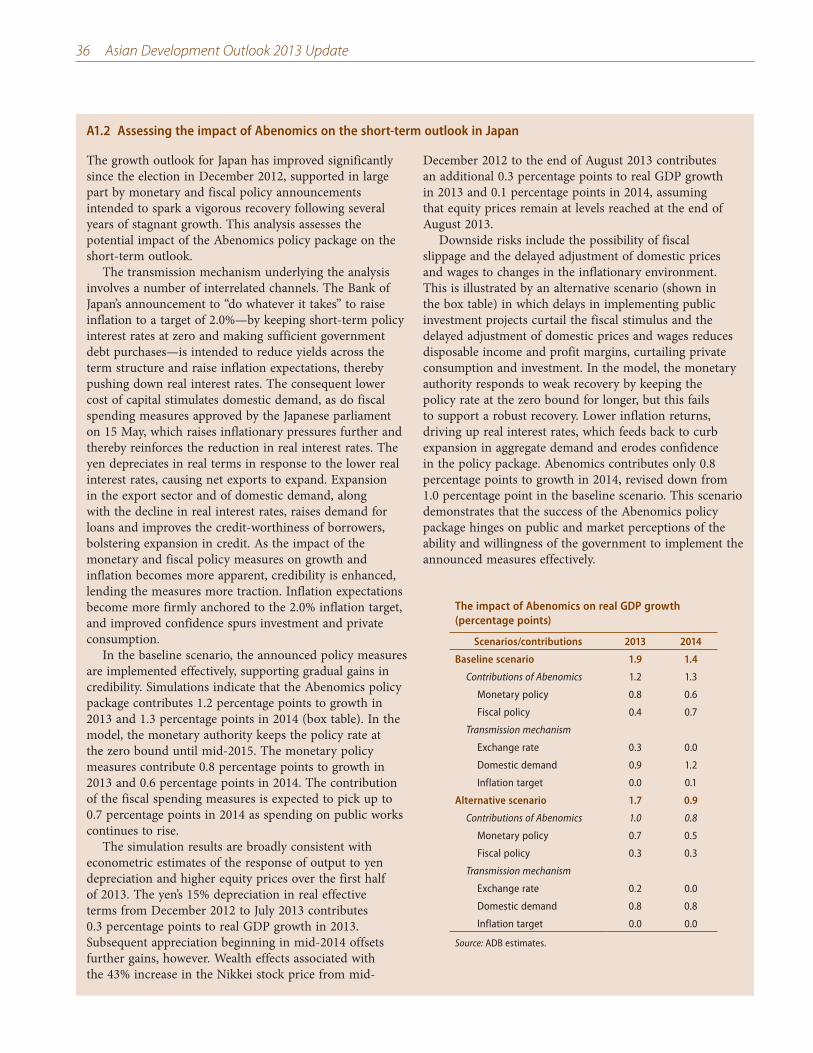
36 Asian Development Outlook 2013 Update
A1.2 Assessing the impact of Abenomics on the short-term outlook in Japan
The growth outlook for Japan has improved significantly since the election in December 2012, supported in large part by monetary and fiscal policy announcements intended to spark a vigorous recovery following several years of stagnant growth. This analysis assesses the potential impact of the Abenomics policy package on the short-term outlook.
The transmission mechanism underlying the analysis involves a number of interrelated channels. The Bank of Japan’s announcement to “do whatever it takes” to raise inflation to a target of 2.0%—by keeping short-term policy interest rates at zero and making sufficient government debt purchases—is intended to reduce yields across the term structure and raise inflation expectations, thereby pushing down real interest rates. The consequent lower cost of capital stimulates domestic demand, as do fiscal spending measures approved by the Japanese parliament on 15 May, which raises inflationary pressures further and thereby reinforces the reduction in real interest rates. The yen depreciates in real terms in response to the lower real interest rates, causing net exports to expand. Expansion in the export sector and of domestic demand, along with the decline in real interest rates, raises demand for loans and improves the credit-worthiness of borrowers, bolstering expansion in credit. As the impact of the monetary and fiscal policy measures on growth and inflation becomes more apparent, credibility is enhanced, lending the measures more traction. Inflation expectations become more firmly anchored to the 2.0% inflation target, and improved confidence spurs investment and private consumption.
In the baseline scenario, the announced policy measures are implemented effectively, supporting gradual gains in credibility. Simulations indicate that the Abenomics policy package contributes 1.2 percentage points to growth in 2013 and 1.3 percentage points in 2014 (box table). In the model, the monetary authority keeps the policy rate at the zero bound until mid-2015. The monetary policy measures contribute 0.8 percentage points to growth in 2013 and 0.6 percentage points in 2014. The contribution of the fiscal spending measures is expected to pick up to 0.7 percentage points in 2014 as spending on public works continues to rise.
The simulation results are broadly consistent with econometric estimates of the response of output to yen depreciation and higher equity prices over the first half of 2013. The yen’s 15% depreciation in real effective terms from December 2012 to July 2013 contributes 0.3 percentage points to real GDP growth in 2013. Subsequent appreciation beginning in mid-2014 offsets further gains, however. Wealth effects associated with the 43% increase in the Nikkei stock price from mid-
December 2012 to the end of August 2013 contributes an additional 0.3 percentage points to real GDP growth in 2013 and 0.1 percentage points in 2014, assuming that equity prices remain at levels reached at the end of August 2013.
Downside risks include the possibility of fiscal slippage and the delayed adjustment of domestic prices and wages to changes in the inflationary environment. This is illustrated by an alternative scenario (shown in the box table) in which delays in implementing public investment projects curtail the fiscal stimulus and the delayed adjustment of domestic prices and wages reduces disposable income and profit margins, curtailing private consumption and investment. In the model, the monetary authority responds to weak recovery by keeping the policy rate at the zero bound for longer, but this fails to support a robust recovery. Lower inflation returns, driving up real interest rates, which feeds back to curb expansion in aggregate demand and erodes confidence in the policy package. Abenomics contributes only 0.8 percentage points to growth in 2014, revised down from 1.0 percentage point in the baseline scenario. This scenario demonstrates that the success of the Abenomics policy package hinges on public and market perceptions of the ability and willingness of the government to implement the announced measures effectively.
The impact of Abenomics on real GDP growth (percentage points)
Scenarios/contributions 2013 2014
Baseline scenario 1.9 1.4
Contributions of Abenomics 1.2 1.3
Monetary policy 0.8 0.6
Fiscal policy 0.4 0.7
Transmission mechanism
Exchange rate 0.3 0.0
Domestic demand 0.9 1.2
Inflation target 0.0 0.1
Alternative scenario 1.7 0.9
Contributions of Abenomics 1.0 0.8
Monetary policy 0.7 0.5
Fiscal policy 0.3 0.3
Transmission mechanism
Exchange rate 0.2 0.0
Domestic demand 0.8 0.8
Inflation target 0.0 0.0
Source: ADB estimates.
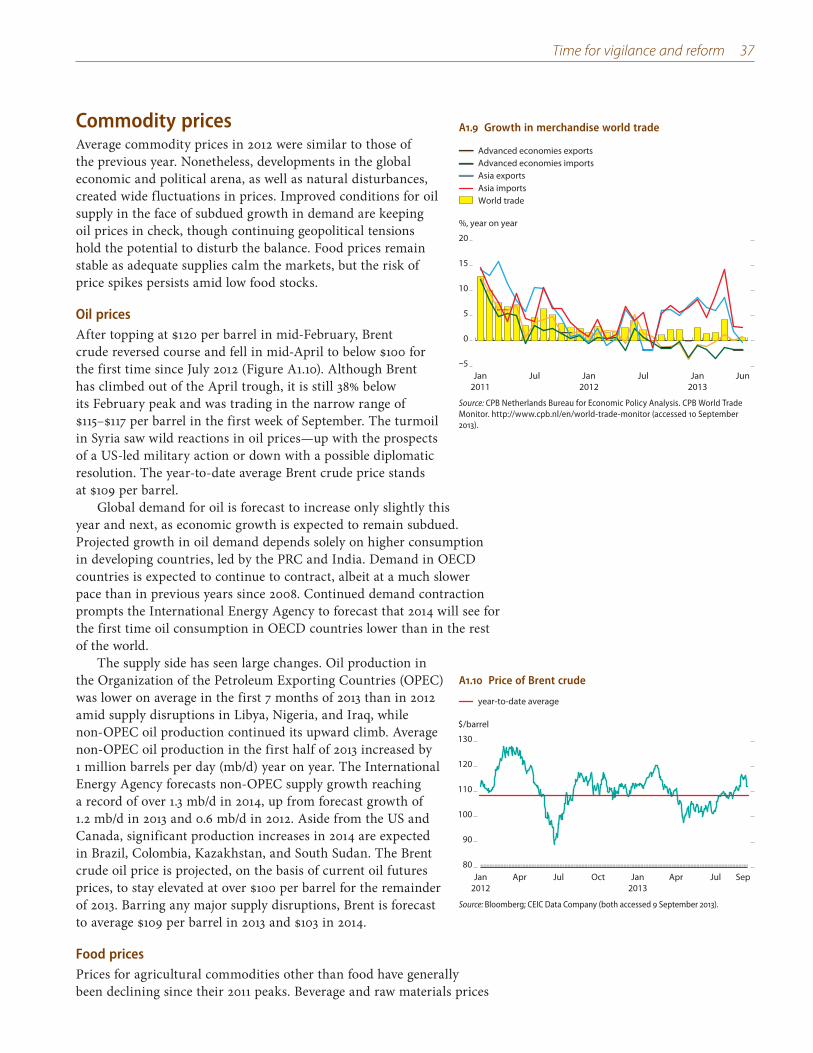
Time for vigilance and reform 37
Commodity pricesAverage commodity prices in 2012 were similar to those of the previous year. Nonetheless, developments in the global economic and political arena, as well as natural disturbances, created wide fluctuations in prices. Improved conditions for oil supply in the face of subdued growth in demand are keeping oil prices in check, though continuing geopolitical tensions hold the potential to disturb the balance. Food prices remain stable as adequate supplies calm the markets, but the risk of price spikes persists amid low food stocks.
Oil pricesAfter topping at $120 per barrel in mid-February, Brent crude reversed course and fell in mid-April to below $100 for the first time since July 2012 (Figure A1.10). Although Brent has climbed out of the April trough, it is still 38% below its February peak and was trading in the narrow range of $115–$117 per barrel in the first week of September. The turmoil in Syria saw wild reactions in oil prices—up with the prospects of a US-led military action or down with a possible diplomatic resolution. The year-to-date average Brent crude price stands at $109 per barrel.
Global demand for oil is forecast to increase only slightly this year and next, as economic growth is expected to remain subdued. Projected growth in oil demand depends solely on higher consumption in developing countries, led by the PRC and India. Demand in OECD countries is expected to continue to contract, albeit at a much slower pace than in previous years since 2008. Continued demand contraction prompts the International Energy Agency to forecast that 2014 will see for the first time oil consumption in OECD countries lower than in the rest of the world.
The supply side has seen large changes. Oil production in the Organization of the Petroleum Exporting Countries (OPEC) was lower on average in the first 7 months of 2013 than in 2012 amid supply disruptions in Libya, Nigeria, and Iraq, while non-OPEC oil production continued its upward climb. Average non-OPEC oil production in the first half of 2013 increased by 1 million barrels per day (mb/d) year on year. The International Energy Agency forecasts non-OPEC supply growth reaching a record of over 1.3 mb/d in 2014, up from forecast growth of 1.2 mb/d in 2013 and 0.6 mb/d in 2012. Aside from the US and Canada, significant production increases in 2014 are expected in Brazil, Colombia, Kazakhstan, and South Sudan. The Brent crude oil price is projected, on the basis of current oil futures prices, to stay elevated at over $100 per barrel for the remainder of 2013. Barring any major supply disruptions, Brent is forecast to average $109 per barrel in 2013 and $103 in 2014.
Food pricesPrices for agricultural commodities other than food have generally been declining since their 2011 peaks. Beverage and raw materials prices
A1.9 Growth in merchandise world trade
World tradeAsia importsAsia exportsAdvanced economies importsAdvanced economies exports
–5
0
5
10
15
20
JunJan2013
JulJan2012
JulJan2011
%, year on year
Source: CPB Netherlands Bureau for Economic Policy Analysis. CPB World Trade Monitor. http://www.cpb.nl/en/world-trade-monitor (accessed 10 September 2013).
A1.10 Price of Brent crude
80
90
100
110
120
130
SepJulAprJan2013
OctJulAprJan2012
$/barrel
year-to-date average
Source: Bloomberg; CEIC Data Company (both accessed 9 September 2013).
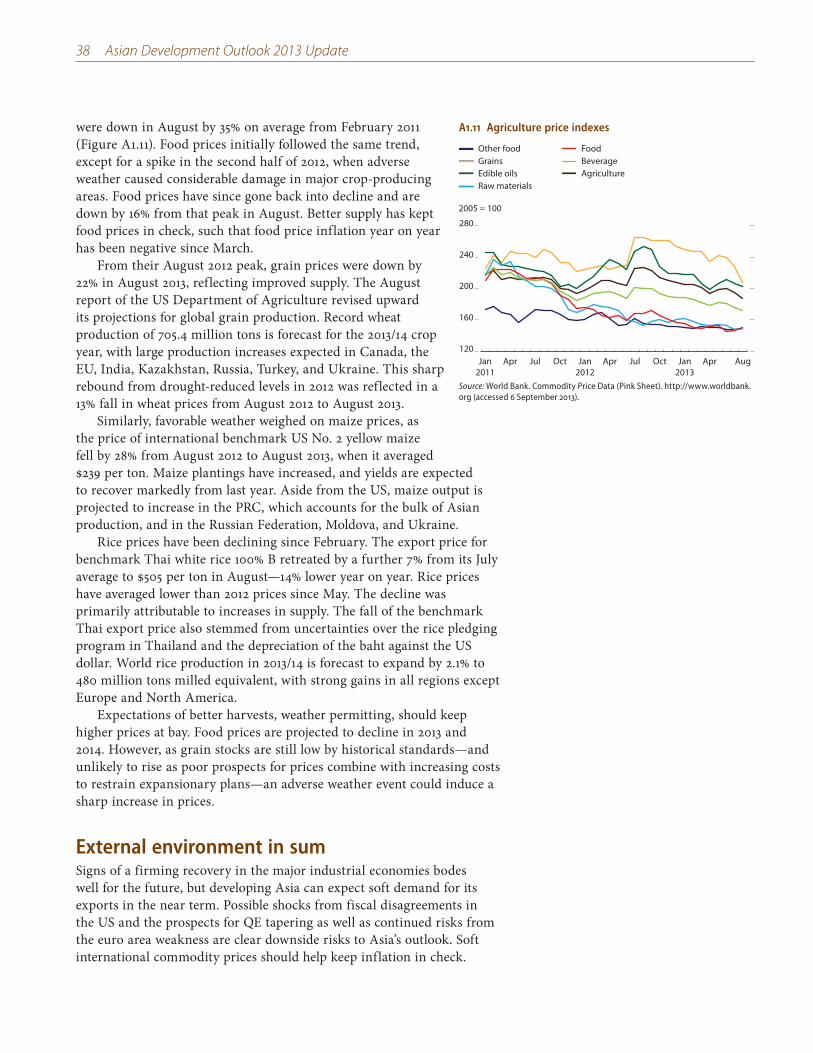
38 Asian Development Outlook 2013 Update
were down in August by 35% on average from February 2011 (Figure A1.11). Food prices initially followed the same trend, except for a spike in the second half of 2012, when adverse weather caused considerable damage in major crop-producing areas. Food prices have since gone back into decline and are down by 16% from that peak in August. Better supply has kept food prices in check, such that food price inflation year on year has been negative since March.
From their August 2012 peak, grain prices were down by 22% in August 2013, reflecting improved supply. The August report of the US Department of Agriculture revised upward its projections for global grain production. Record wheat production of 705.4 million tons is forecast for the 2013/14 crop year, with large production increases expected in Canada, the EU, India, Kazakhstan, Russia, Turkey, and Ukraine. This sharp rebound from drought-reduced levels in 2012 was reflected in a 13% fall in wheat prices from August 2012 to August 2013.
Similarly, favorable weather weighed on maize prices, as the price of international benchmark US No. 2 yellow maize fell by 28% from August 2012 to August 2013, when it averaged $239 per ton. Maize plantings have increased, and yields are expected to recover markedly from last year. Aside from the US, maize output is projected to increase in the PRC, which accounts for the bulk of Asian production, and in the Russian Federation, Moldova, and Ukraine.
Rice prices have been declining since February. The export price for benchmark Thai white rice 100% B retreated by a further 7% from its July average to $505 per ton in August—14% lower year on year. Rice prices have averaged lower than 2012 prices since May. The decline was primarily attributable to increases in supply. The fall of the benchmark Thai export price also stemmed from uncertainties over the rice pledging program in Thailand and the depreciation of the baht against the US dollar. World rice production in 2013/14 is forecast to expand by 2.1% to 480 million tons milled equivalent, with strong gains in all regions except Europe and North America.
Expectations of better harvests, weather permitting, should keep higher prices at bay. Food prices are projected to decline in 2013 and 2014. However, as grain stocks are still low by historical standards—and unlikely to rise as poor prospects for prices combine with increasing costs to restrain expansionary plans—an adverse weather event could induce a sharp increase in prices.
External environment in sumSigns of a firming recovery in the major industrial economies bodes well for the future, but developing Asia can expect soft demand for its exports in the near term. Possible shocks from fiscal disagreements in the US and the prospects for QE tapering as well as continued risks from the euro area weakness are clear downside risks to Asia’s outlook. Soft international commodity prices should help keep inflation in check.
A1.11 Agriculture price indexes
120
160
200
240
280
AugAprJan2013
OctJulAprJan2012
OctJulAprJan2011
2005 = 100
Food
Raw materialsEdible oilsGrainsOther food
AgricultureBeverage
Source: World Bank. Commodity Price Data (Pink Sheet). http://www.worldbank.org (accessed 6 September 2013).

2Governance and
public service delivery

Asia’s governance gap
Over several decades, good governance has come to be a watchword for the development community. The concept itself is quite broad. When applied to the state, governance involves the political system; executive decision-making; the legal process of establishing, amending, and enforcing laws and regulations; institutions providing public services; and even how citizens interact with political and legal institutions.
Development practitioners often warn that anything less than good governance is an economy’s Achilles’ heel—a vulnerable point that can hobble growth in an otherwise vibrant system. This view is manifest in the weight that development institutions like the Asian Development Bank (ADB) and the World Bank place on governance when allocating concessional funds.1 The emphasis on governance is likely to intensify. One high-level panel recommends that “good governance and effective institutions” be included among the universal goals for the post-2015 global development agenda (United Nations 2013).
Yet, despite all the attention on good governance, it does not appear to have played a central role in the economic transformation of developing Asia. The region’s economic advance is well known. Following Japan’s rapid recovery from world war and expanding economic influence regionally, the economies of Hong Kong, China; the Republic of Korea; Singapore; and Taipei,China became “newly industrialized”—rising from poverty to high-income status within a generation. Then market reforms in the People’s Republic of China (PRC) opened the way for its sustained rapid economic growth. More recently, India and the larger members of the Association of Southeast Asian Nations have become Asia’s newest tigers.
Governance and public service delivery
This chapter was written by Shikha Jha, Pilipinas Quising, and Juzhong Zhuang of the
Economics and Research Department, and Guo Xu of London School of Economics.
Anil Deolalikar of University of California, Riverside provided substantive inputs. It draws
on the background papers listed at the end of the chapter. Changyong Rhee, chief
economist, provided guidance at various stages.
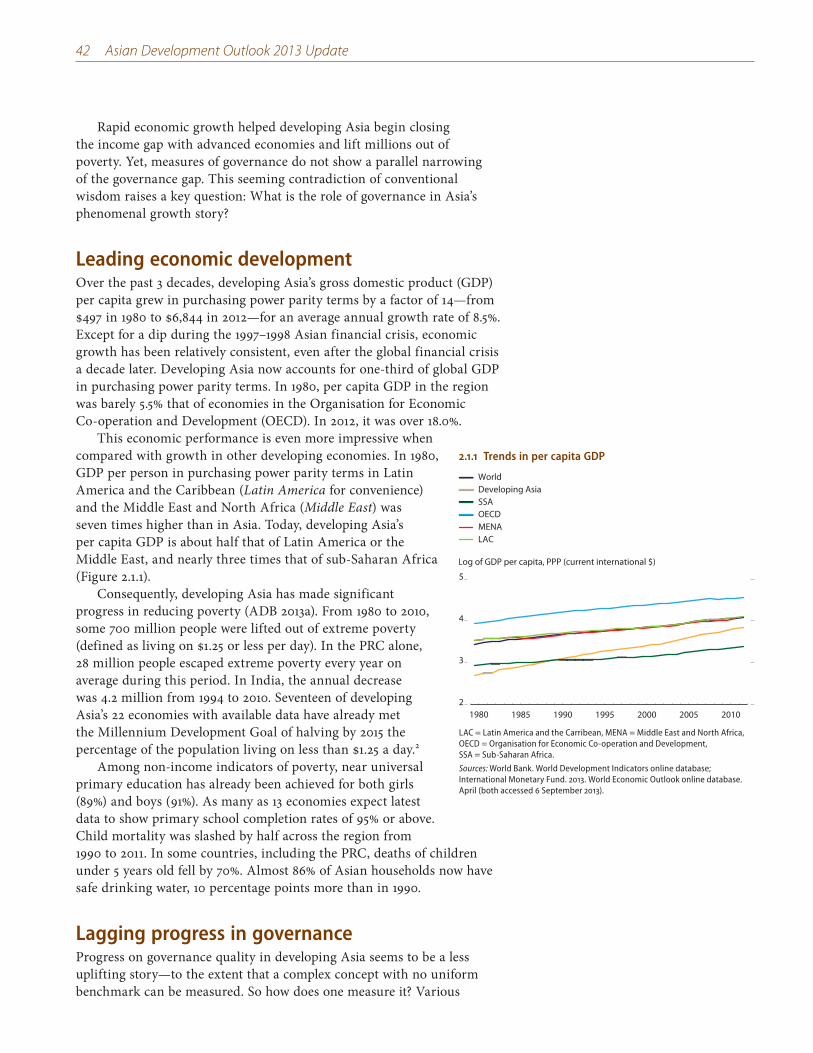
42 Asian Development Outlook 2013 Update
Rapid economic growth helped developing Asia begin closing the income gap with advanced economies and lift millions out of poverty. Yet, measures of governance do not show a parallel narrowing of the governance gap. This seeming contradiction of conventional wisdom raises a key question: What is the role of governance in Asia’s phenomenal growth story?
Leading economic developmentOver the past 3 decades, developing Asia’s gross domestic product (GDP) per capita grew in purchasing power parity terms by a factor of 14—from $497 in 1980 to $6,844 in 2012—for an average annual growth rate of 8.5%. Except for a dip during the 1997–1998 Asian financial crisis, economic growth has been relatively consistent, even after the global financial crisis a decade later. Developing Asia now accounts for one-third of global GDP in purchasing power parity terms. In 1980, per capita GDP in the region was barely 5.5% that of economies in the Organisation for Economic Co-operation and Development (OECD). In 2012, it was over 18.0%.
This economic performance is even more impressive when compared with growth in other developing economies. In 1980, GDP per person in purchasing power parity terms in Latin America and the Caribbean (Latin America for convenience) and the Middle East and North Africa (Middle East) was seven times higher than in Asia. Today, developing Asia’s per capita GDP is about half that of Latin America or the Middle East, and nearly three times that of sub-Saharan Africa (Figure 2.1.1).
Consequently, developing Asia has made significant progress in reducing poverty (ADB 2013a). From 1980 to 2010, some 700 million people were lifted out of extreme poverty (defined as living on $1.25 or less per day). In the PRC alone, 28 million people escaped extreme poverty every year on average during this period. In India, the annual decrease was 4.2 million from 1994 to 2010. Seventeen of developing Asia’s 22 economies with available data have already met the Millennium Development Goal of halving by 2015 the percentage of the population living on less than $1.25 a day.2
Among non-income indicators of poverty, near universal primary education has already been achieved for both girls (89%) and boys (91%). As many as 13 economies expect latest data to show primary school completion rates of 95% or above. Child mortality was slashed by half across the region from 1990 to 2011. In some countries, including the PRC, deaths of children under 5 years old fell by 70%. Almost 86% of Asian households now have safe drinking water, 10 percentage points more than in 1990.
Lagging progress in governanceProgress on governance quality in developing Asia seems to be a less uplifting story—to the extent that a complex concept with no uniform benchmark can be measured. So how does one measure it? Various
2.1.1 Trends in per capita GDP
2
3
4
5
2010200520001995199019851980
Log of GDP per capita, PPP (current international $)
MENAOECDSSADeveloping AsiaWorld
LAC
LAC = Latin America and the Carribean, MENA = Middle East and North Africa, OECD = Organisation for Economic Co-operation and Development, SSA = Sub-Saharan Africa.
Sources: World Bank. World Development Indicators online database; International Monetary Fund. 2013. World Economic Outlook online database. April (both accessed 6 September 2013).
Governance and public service delivery 43
sets of indicators use widely different approaches to quantify aspects of governance (Box 2.1.1). The critiques of commonly used governance measures emphasize issues concerning comparability over time and across countries, biases in expert assessments, correlated perception errors, definitional problems, and the limitations of subjective and perception-based data (Kaufmann and Kraay 2008). Yet looking across several different indicators teases out a coherent story.
2.1.1 Measuring governance
If defining governance is a challenge, measuring it is even harder. In line with the ever-widening array of governance measures, indicators tend to differ in both quality and coverage, geographical as well as temporal. Governance indicators can be distinguished in two crosscutting ways: While some measure perceptions, others gather facts, and while some consider de jure indicators of governance, others prefer de facto indicators.
Perception-based measures such as the World Governance Indicators (WGI) or the Corruption Perception Index are largely derived from the subjective assessments, opinions, and perceptions of experts, policy makers, or citizens. Although subject to sampling and reporting biases, perception-based measures such as the WGI and International Country Risk Guide (ICRG) are among the most frequently used. The WGI is based on a combination of surveys and expert assessments. The ICRG relies on expert assessments only.
Fact-based indicators are constructed from acknowledged facts such as the existence of pertinent procurement and anticorruption laws and the creation of oversight bodies. An example is the World Bank’s Doing Business indicators for measuring business regulations. They examine well-defined outcomes that proxy for specific dimensions of regulatory quality. While objective measurement is appealing from a methodological standpoint, data constraints make it difficult.
Individual perceptions often influence any understanding of good governance. Classical, perception-based indicators are prone to subjective biases from “halo effects.” Experts may, for example, expect poor countries to have poor governance. Even a country with good institutions may be perceived as having poor institutions simply because it lags on many other, more visible dimensions such as corruption in providing health care and education. Similarly, fact-based “hard” governance indicators may be a poor reflection of actual governance in a developing country that is conditioned by informal rules, customs, or conventions.
This raises the distinction based on the often large gap between de jure rules and regulations and de facto realities. Fact-based indicators are typically based only on formal de jure data. They do not reflect de facto realities, which
often arise through informal and unwritten conventions and practices but nevertheless come to shape the true quality of governance in a country. Thus, for example, having strict anticorruption laws or an anticorruption bureau means lower de facto corruption only if laws are effectively implemented and the bureau actually prosecutes corruption. Given the prevalence of informal institutions across much of Asia—where formal institutions are imperfect—the gap between de jure and de facto indicators will likely remain.
These limitations on measuring governance are perhaps best illustrated in the stark contrast between the popular Doing Business indicators and the Enterprise Surveys (Hallward-Driemeier and Pritchett 2011). The surveys use different approaches to understand the governance constraints private companies face. Doing Business indicators use measures of regulatory compliance, while the Enterprise Surveys reflect firms’ reported experiences under these regulations and other conditions determining the investment climate. Hallward-Driemeier and Pritchett (2011) note, for example, that Doing Business and Enterprise Survey results in the 80 countries that they both cover show glaringly different results for the average number of days required to obtain a construction permit. Enterprise Surveys find it taking 177 days, almost three times longer than the Doing Business result of 64 days.
Finally, most governance indicators are aggregated across sub-dimensions. While aggregation may reduce measurement errors by balancing positive and negative extremes, it masks the effect of the component elements of governance. The constituent parts of the aggregate are generally easier to interpret and relate to specific policy interventions (OECD 2008). Constituent parts can thus include actionable indicators such as physical measures of performance; the costs of, for example, construction or energy supply; and measures of service quality, such as the time taken to get goods through ports. Actionable indicators can help improve understanding of the impact of development efforts on the ground.
Sources: M. Hallward-Driemeier and L. Pritchett (2011); OECD (2008); Quibria (forthcoming); Sen (forthcoming); Guo Xu (forthcoming).
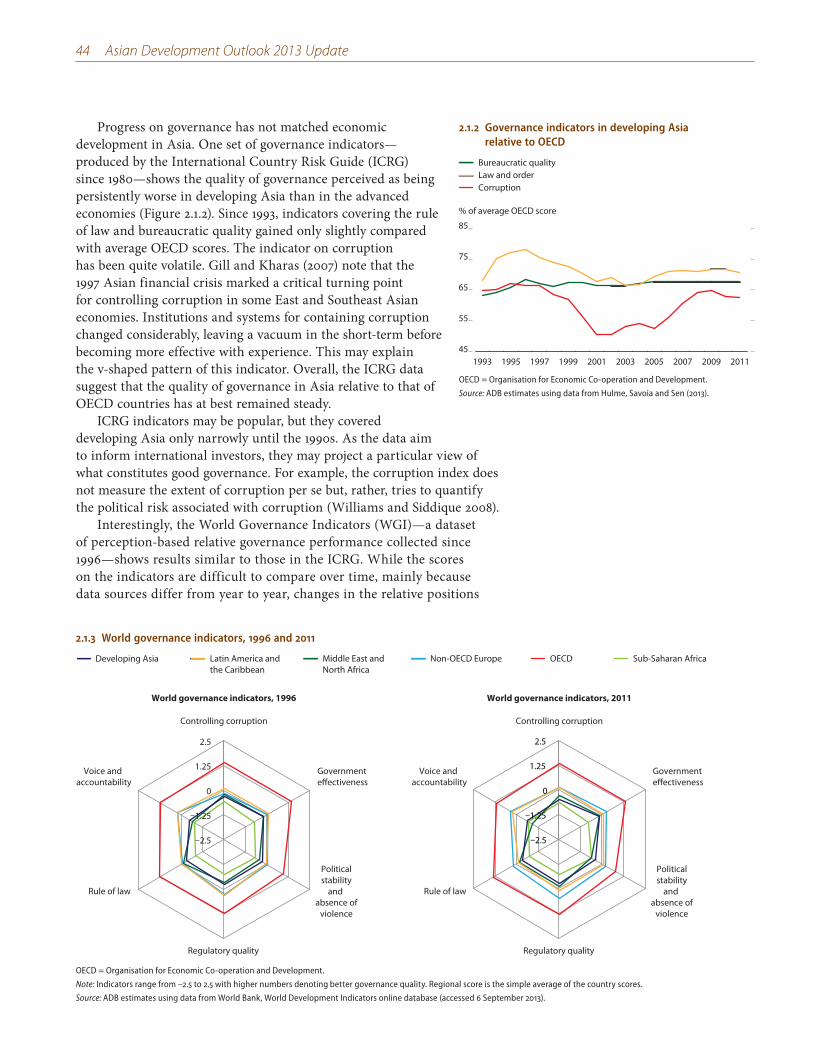
44 Asian Development Outlook 2013 Update
Progress on governance has not matched economic development in Asia. One set of governance indicators—produced by the International Country Risk Guide (ICRG) since 1980—shows the quality of governance perceived as being persistently worse in developing Asia than in the advanced economies (Figure 2.1.2). Since 1993, indicators covering the rule of law and bureaucratic quality gained only slightly compared with average OECD scores. The indicator on corruption has been quite volatile. Gill and Kharas (2007) note that the 1997 Asian financial crisis marked a critical turning point for controlling corruption in some East and Southeast Asian economies. Institutions and systems for containing corruption changed considerably, leaving a vacuum in the short-term before becoming more effective with experience. This may explain the v-shaped pattern of this indicator. Overall, the ICRG data suggest that the quality of governance in Asia relative to that of OECD countries has at best remained steady.
ICRG indicators may be popular, but they covered developing Asia only narrowly until the 1990s. As the data aim to inform international investors, they may project a particular view of what constitutes good governance. For example, the corruption index does not measure the extent of corruption per se but, rather, tries to quantify the political risk associated with corruption (Williams and Siddique 2008).
Interestingly, the World Governance Indicators (WGI)—a dataset of perception-based relative governance performance collected since 1996—shows results similar to those in the ICRG. While the scores on the indicators are difficult to compare over time, mainly because data sources differ from year to year, changes in the relative positions
2.1.2 Governance indicators in developing Asia relative to OECD
CorruptionLaw and orderBureaucratic quality
45
55
65
75
85
2011200920072005200320011999199719951993
% of average OECD score
OECD = Organisation for Economic Co-operation and Development.
Source: ADB estimates using data from Hulme, Savoia and Sen (2013).
2.1.3 World governance indicators, 1996 and 2011
Government effectiveness
Regulatory quality
Rule of law
Voice and accountability
World governance indicators, 2011
Controlling corruption
–2.5
–1.25
0
1.25
2.5
Politicalstability
and absence of
violence
–2.5
–1.25
0
1.25
2.5
Government effectiveness
Politicalstability
and absence of
violence
Regulatory quality
Rule of law
Voice and accountability
World governance indicators, 1996
OECDNon-OECD EuropeMiddle East andNorth Africa
Latin America andthe Caribbean
Developing Asia Sub-Saharan Africa
Controlling corruption
OECD = Organisation for Economic Co-operation and Development.
Note: Indicators range from –2.5 to 2.5 with higher numbers denoting better governance quality. Regional score is the simple average of the country scores.
Source: ADB estimates using data from World Bank, World Development Indicators online database (accessed 6 September 2013).
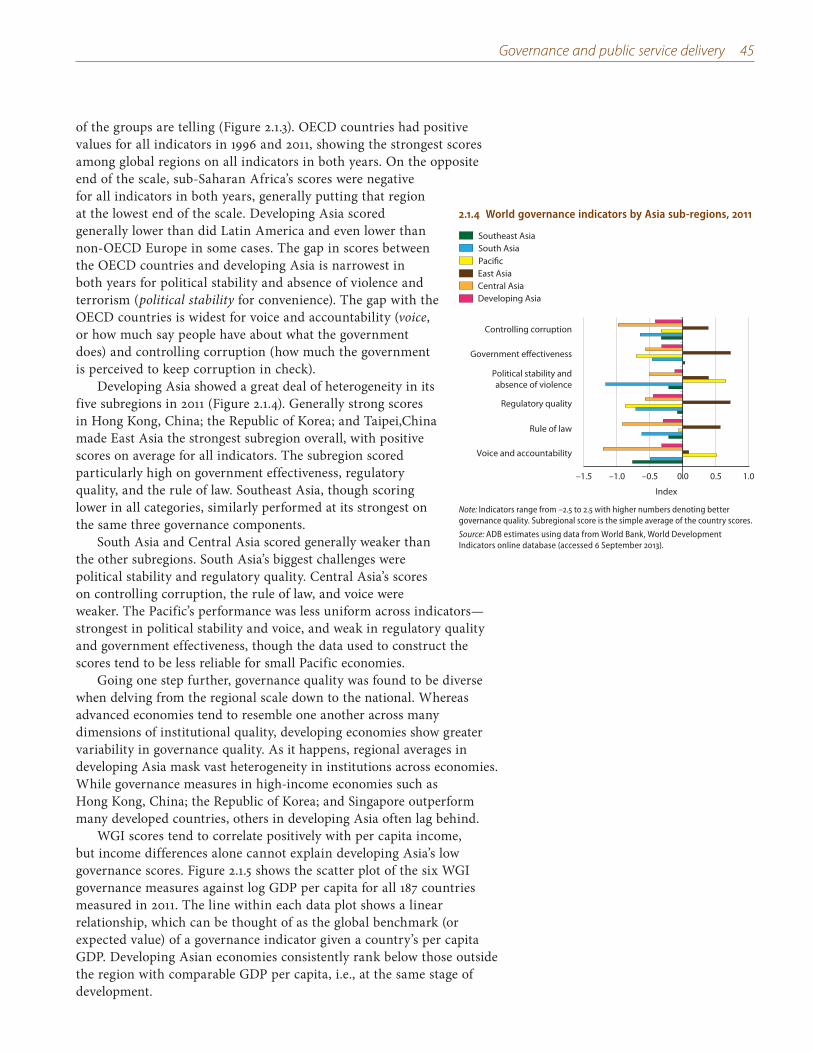
Governance and public service delivery 45
2.1.4 World governance indicators by Asia sub-regions, 2011
PacificEast AsiaCentral AsiaDeveloping Asia
South AsiaSoutheast Asia
–1.5 –1.0 –0.5 0.0 0.5 1.0
Voice and accountability
Rule of law
Regulatory quality
Political stability andabsence of violence
Government effectiveness
Controlling corruption
Index
Note: Indicators range from –2.5 to 2.5 with higher numbers denoting better governance quality. Subregional score is the simple average of the country scores.
Source: ADB estimates using data from World Bank, World Development Indicators online database (accessed 6 September 2013).
of the groups are telling (Figure 2.1.3). OECD countries had positive values for all indicators in 1996 and 2011, showing the strongest scores among global regions on all indicators in both years. On the opposite end of the scale, sub-Saharan Africa’s scores were negative for all indicators in both years, generally putting that region at the lowest end of the scale. Developing Asia scored generally lower than did Latin America and even lower than non-OECD Europe in some cases. The gap in scores between the OECD countries and developing Asia is narrowest in both years for political stability and absence of violence and terrorism (political stability for convenience). The gap with the OECD countries is widest for voice and accountability (voice, or how much say people have about what the government does) and controlling corruption (how much the government is perceived to keep corruption in check).
Developing Asia showed a great deal of heterogeneity in its five subregions in 2011 (Figure 2.1.4). Generally strong scores in Hong Kong, China; the Republic of Korea; and Taipei,China made East Asia the strongest subregion overall, with positive scores on average for all indicators. The subregion scored particularly high on government effectiveness, regulatory quality, and the rule of law. Southeast Asia, though scoring lower in all categories, similarly performed at its strongest on the same three governance components.
South Asia and Central Asia scored generally weaker than the other subregions. South Asia’s biggest challenges were political stability and regulatory quality. Central Asia’s scores on controlling corruption, the rule of law, and voice were weaker. The Pacific’s performance was less uniform across indicators—strongest in political stability and voice, and weak in regulatory quality and government effectiveness, though the data used to construct the scores tend to be less reliable for small Pacific economies.
Going one step further, governance quality was found to be diverse when delving from the regional scale down to the national. Whereas advanced economies tend to resemble one another across many dimensions of institutional quality, developing economies show greater variability in governance quality. As it happens, regional averages in developing Asia mask vast heterogeneity in institutions across economies. While governance measures in high-income economies such as Hong Kong, China; the Republic of Korea; and Singapore outperform many developed countries, others in developing Asia often lag behind.
WGI scores tend to correlate positively with per capita income, but income differences alone cannot explain developing Asia’s low governance scores. Figure 2.1.5 shows the scatter plot of the six WGI governance measures against log GDP per capita for all 187 countries measured in 2011. The line within each data plot shows a linear relationship, which can be thought of as the global benchmark (or expected value) of a governance indicator given a country’s per capita GDP. Developing Asian economies consistently rank below those outside the region with comparable GDP per capita, i.e., at the same stage of development.
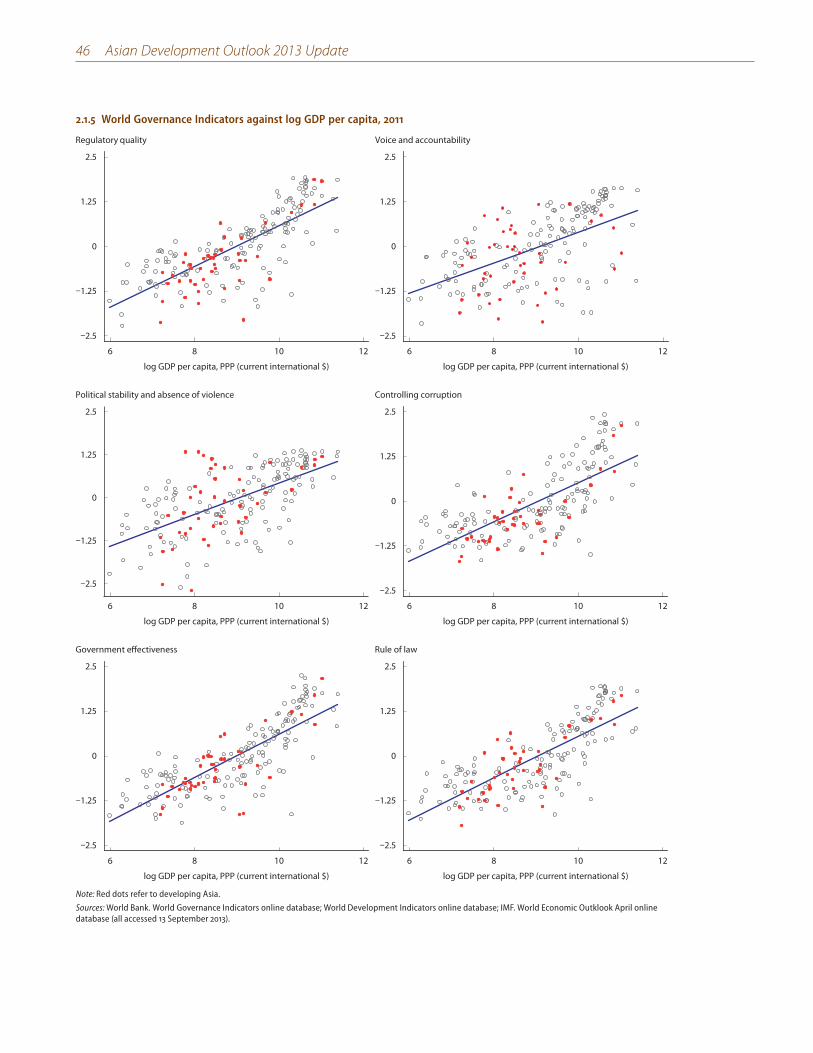
46 Asian Development Outlook 2013 Update
2.1.5 World Governance Indicators against log GDP per capita, 2011
–2.5
–1.25
0
1.25
2.5
6 8 10 12
log GDP per capita, PPP (current international $)
Regulatory quality
–2.5
–1.25
0
1.25
2.5
6 8 10 12
log GDP per capita, PPP (current international $)
Voice and accountability
log GDP per capita, PPP (current international $)
Political stability and absence of violence
–2.5
–1.25
0
1.25
2.5
6 8 10 12
–2.5
–1.25
0
1.25
2.5
6 8 10 12
log GDP per capita, PPP (current international $)
Controlling corruption
–2.5
–1.25
0
1.25
2.5
6 8 10 12
log GDP per capita, PPP (current international $)
Government effectiveness
–2.5
–1.25
0
1.25
2.5
6 8 10 12
log GDP per capita, PPP (current international $)
Rule of law
Note: Red dots refer to developing Asia.
Sources: World Bank. World Governance Indicators online database; World Development Indicators online database; IMF. World Economic Outklook April online database (all accessed 13 September 2013).
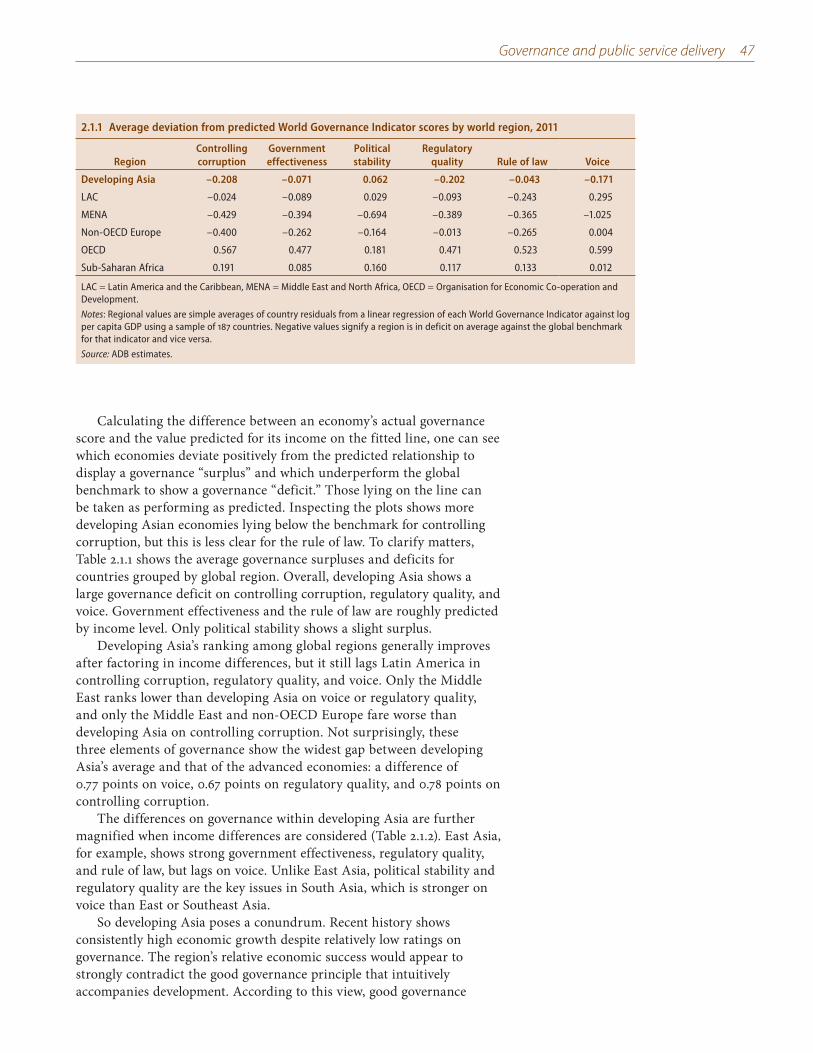
Governance and public service delivery 47
Calculating the difference between an economy’s actual governance score and the value predicted for its income on the fitted line, one can see which economies deviate positively from the predicted relationship to display a governance “surplus” and which underperform the global benchmark to show a governance “deficit.” Those lying on the line can be taken as performing as predicted. Inspecting the plots shows more developing Asian economies lying below the benchmark for controlling corruption, but this is less clear for the rule of law. To clarify matters, Table 2.1.1 shows the average governance surpluses and deficits for countries grouped by global region. Overall, developing Asia shows a large governance deficit on controlling corruption, regulatory quality, and voice. Government effectiveness and the rule of law are roughly predicted by income level. Only political stability shows a slight surplus.
Developing Asia’s ranking among global regions generally improves after factoring in income differences, but it still lags Latin America in controlling corruption, regulatory quality, and voice. Only the Middle East ranks lower than developing Asia on voice or regulatory quality, and only the Middle East and non-OECD Europe fare worse than developing Asia on controlling corruption. Not surprisingly, these three elements of governance show the widest gap between developing Asia’s average and that of the advanced economies: a difference of 0.77 points on voice, 0.67 points on regulatory quality, and 0.78 points on controlling corruption.
The differences on governance within developing Asia are further magnified when income differences are considered (Table 2.1.2). East Asia, for example, shows strong government effectiveness, regulatory quality, and rule of law, but lags on voice. Unlike East Asia, political stability and regulatory quality are the key issues in South Asia, which is stronger on voice than East or Southeast Asia.
So developing Asia poses a conundrum. Recent history shows consistently high economic growth despite relatively low ratings on governance. The region’s relative economic success would appear to strongly contradict the good governance principle that intuitively accompanies development. According to this view, good governance
2.1.1 Average deviation from predicted World Governance Indicator scores by world region, 2011
RegionControlling corruption
Government effectiveness
Political stability
Regulatory quality Rule of law Voice
Developing Asia –0.208 –0.071 0.062 –0.202 –0.043 –0.171
LAC –0.024 –0.089 0.029 –0.093 –0.243 0.295
MENA –0.429 –0.394 –0.694 –0.389 –0.365 –1.025
Non-OECD Europe –0.400 –0.262 –0.164 –0.013 –0.265 0.004
OECD 0.567 0.477 0.181 0.471 0.523 0.599
Sub-Saharan Africa 0.191 0.085 0.160 0.117 0.133 0.012
LAC = Latin America and the Caribbean, MENA = Middle East and North Africa, OECD = Organisation for Economic Co-operation and Development.
Notes: Regional values are simple averages of country residuals from a linear regression of each World Governance Indicator against log per capita GDP using a sample of 187 countries. Negative values signify a region is in deficit on average against the global benchmark for that indicator and vice versa.
Source: ADB estimates.
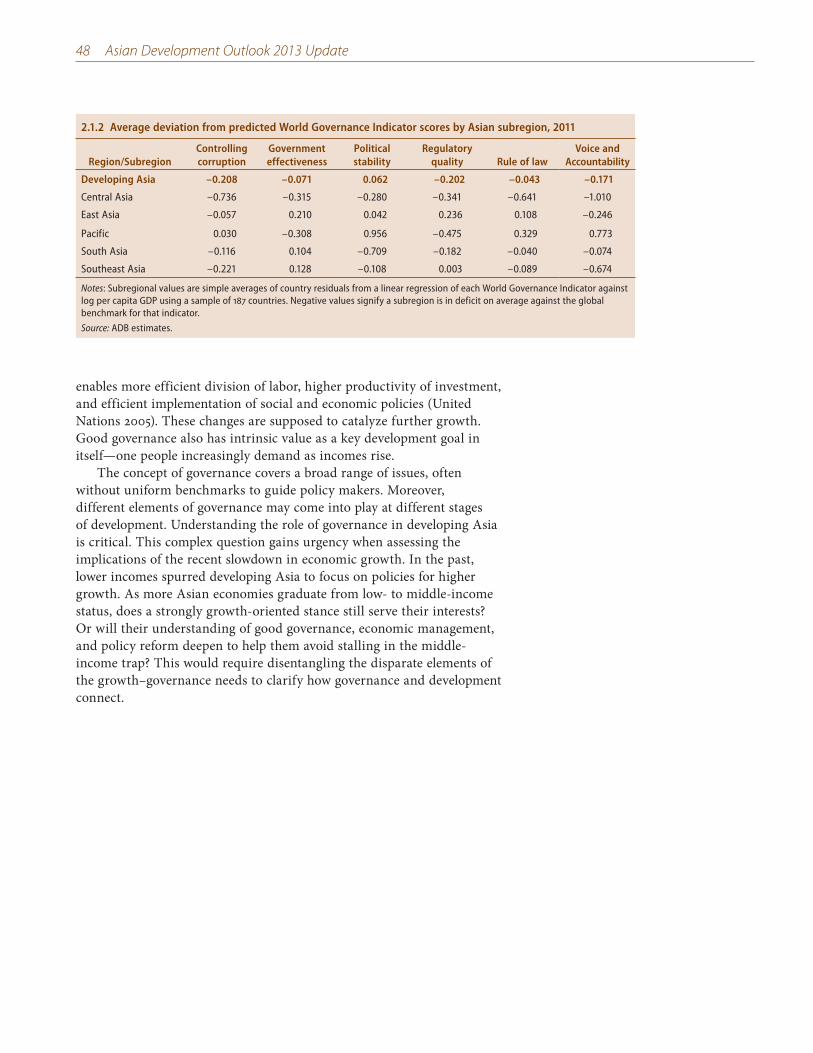
48 Asian Development Outlook 2013 Update
enables more efficient division of labor, higher productivity of investment, and efficient implementation of social and economic policies (United Nations 2005). These changes are supposed to catalyze further growth. Good governance also has intrinsic value as a key development goal in itself—one people increasingly demand as incomes rise.
The concept of governance covers a broad range of issues, often without uniform benchmarks to guide policy makers. Moreover, different elements of governance may come into play at different stages of development. Understanding the role of governance in developing Asia is critical. This complex question gains urgency when assessing the implications of the recent slowdown in economic growth. In the past, lower incomes spurred developing Asia to focus on policies for higher growth. As more Asian economies graduate from low- to middle-income status, does a strongly growth-oriented stance still serve their interests? Or will their understanding of good governance, economic management, and policy reform deepen to help them avoid stalling in the middle-income trap? This would require disentangling the disparate elements of the growth–governance needs to clarify how governance and development connect.
2.1.2 Average deviation from predicted World Governance Indicator scores by Asian subregion, 2011
Region/SubregionControlling corruption
Government effectiveness
Political stability
Regulatory quality Rule of law
Voice and Accountability
Developing Asia –0.208 –0.071 0.062 –0.202 –0.043 –0.171
Central Asia –0.736 –0.315 –0.280 –0.341 –0.641 –1.010
East Asia –0.057 0.210 0.042 0.236 0.108 –0.246
Pacific 0.030 –0.308 0.956 –0.475 0.329 0.773
South Asia –0.116 0.104 –0.709 –0.182 –0.040 –0.074
Southeast Asia –0.221 0.128 –0.108 0.003 –0.089 –0.674
Notes: Subregional values are simple averages of country residuals from a linear regression of each World Governance Indicator against log per capita GDP using a sample of 187 countries. Negative values signify a subregion is in deficit on average against the global benchmark for that indicator.
Source: ADB estimates.
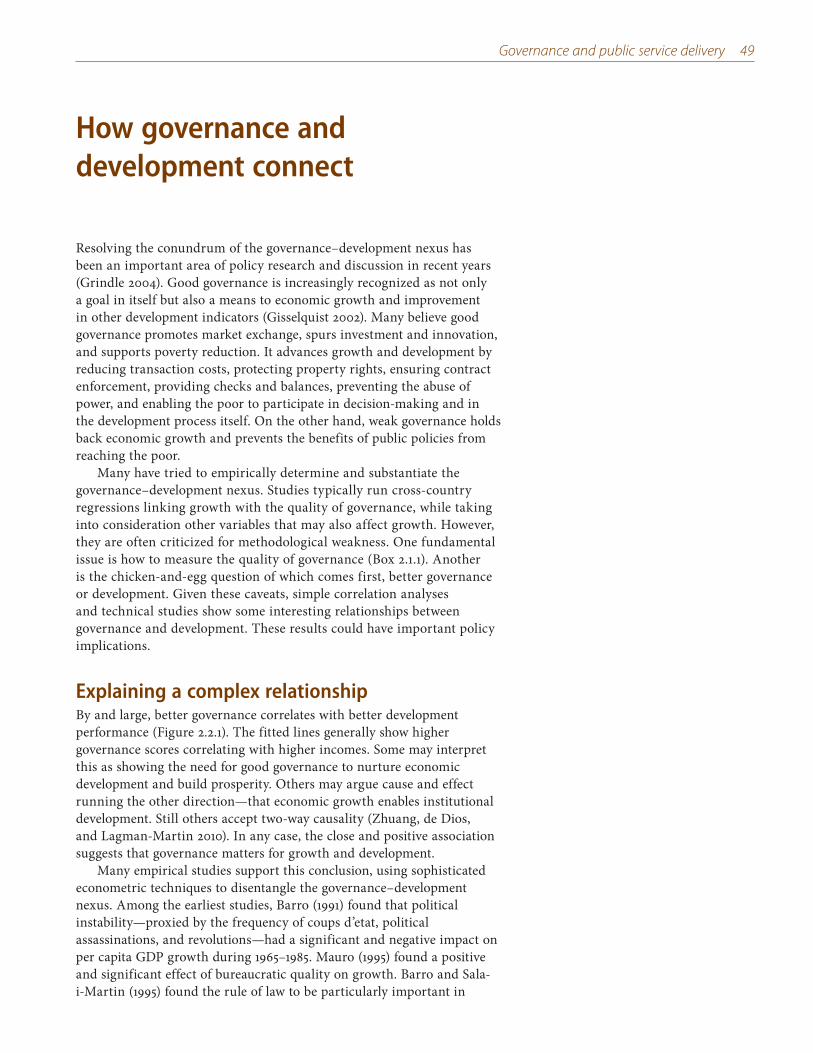
Governance and public service delivery 49
How governance and development connect
Resolving the conundrum of the governance–development nexus has been an important area of policy research and discussion in recent years (Grindle 2004). Good governance is increasingly recognized as not only a goal in itself but also a means to economic growth and improvement in other development indicators (Gisselquist 2002). Many believe good governance promotes market exchange, spurs investment and innovation, and supports poverty reduction. It advances growth and development by reducing transaction costs, protecting property rights, ensuring contract enforcement, providing checks and balances, preventing the abuse of power, and enabling the poor to participate in decision-making and in the development process itself. On the other hand, weak governance holds back economic growth and prevents the benefits of public policies from reaching the poor.
Many have tried to empirically determine and substantiate the governance–development nexus. Studies typically run cross-country regressions linking growth with the quality of governance, while taking into consideration other variables that may also affect growth. However, they are often criticized for methodological weakness. One fundamental issue is how to measure the quality of governance (Box 2.1.1). Another is the chicken-and-egg question of which comes first, better governance or development. Given these caveats, simple correlation analyses and technical studies show some interesting relationships between governance and development. These results could have important policy implications.
Explaining a complex relationship By and large, better governance correlates with better development performance (Figure 2.2.1). The fitted lines generally show higher governance scores correlating with higher incomes. Some may interpret this as showing the need for good governance to nurture economic development and build prosperity. Others may argue cause and effect running the other direction—that economic growth enables institutional development. Still others accept two-way causality (Zhuang, de Dios, and Lagman-Martin 2010). In any case, the close and positive association suggests that governance matters for growth and development.
Many empirical studies support this conclusion, using sophisticated econometric techniques to disentangle the governance–development nexus. Among the earliest studies, Barro (1991) found that political instability—proxied by the frequency of coups d’etat, political assassinations, and revolutions—had a significant and negative impact on per capita GDP growth during 1965–1985. Mauro (1995) found a positive and significant effect of bureaucratic quality on growth. Barro and Sala-i-Martin (1995) found the rule of law to be particularly important in
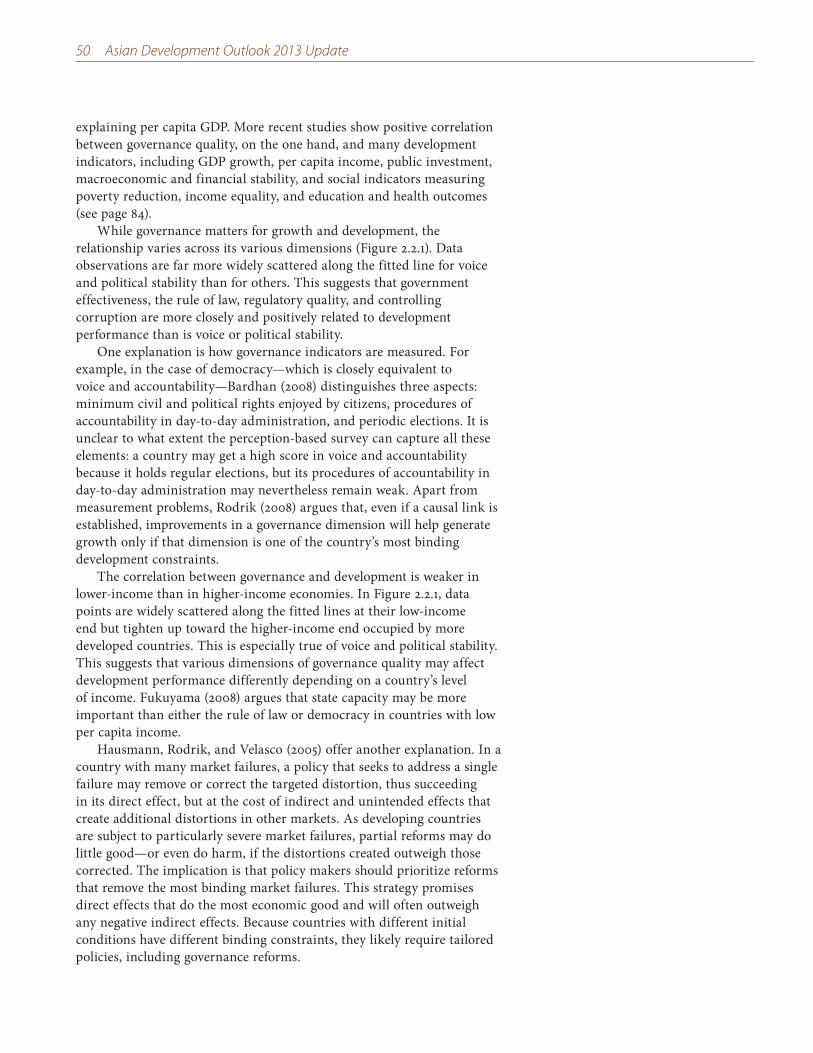
50 Asian Development Outlook 2013 Update
explaining per capita GDP. More recent studies show positive correlation between governance quality, on the one hand, and many development indicators, including GDP growth, per capita income, public investment, macroeconomic and financial stability, and social indicators measuring poverty reduction, income equality, and education and health outcomes (see page 84).
While governance matters for growth and development, the relationship varies across its various dimensions (Figure 2.2.1). Data observations are far more widely scattered along the fitted line for voice and political stability than for others. This suggests that government effectiveness, the rule of law, regulatory quality, and controlling corruption are more closely and positively related to development performance than is voice or political stability.
One explanation is how governance indicators are measured. For example, in the case of democracy—which is closely equivalent to voice and accountability—Bardhan (2008) distinguishes three aspects: minimum civil and political rights enjoyed by citizens, procedures of accountability in day-to-day administration, and periodic elections. It is unclear to what extent the perception-based survey can capture all these elements: a country may get a high score in voice and accountability because it holds regular elections, but its procedures of accountability in day-to-day administration may nevertheless remain weak. Apart from measurement problems, Rodrik (2008) argues that, even if a causal link is established, improvements in a governance dimension will help generate growth only if that dimension is one of the country’s most binding development constraints.
The correlation between governance and development is weaker in lower-income than in higher-income economies. In Figure 2.2.1, data points are widely scattered along the fitted lines at their low-income end but tighten up toward the higher-income end occupied by more developed countries. This is especially true of voice and political stability. This suggests that various dimensions of governance quality may affect development performance differently depending on a country’s level of income. Fukuyama (2008) argues that state capacity may be more important than either the rule of law or democracy in countries with low per capita income.
Hausmann, Rodrik, and Velasco (2005) offer another explanation. In a country with many market failures, a policy that seeks to address a single failure may remove or correct the targeted distortion, thus succeeding in its direct effect, but at the cost of indirect and unintended effects that create additional distortions in other markets. As developing countries are subject to particularly severe market failures, partial reforms may do little good—or even do harm, if the distortions created outweigh those corrected. The implication is that policy makers should prioritize reforms that remove the most binding market failures. This strategy promises direct effects that do the most economic good and will often outweigh any negative indirect effects. Because countries with different initial conditions have different binding constraints, they likely require tailored policies, including governance reforms.
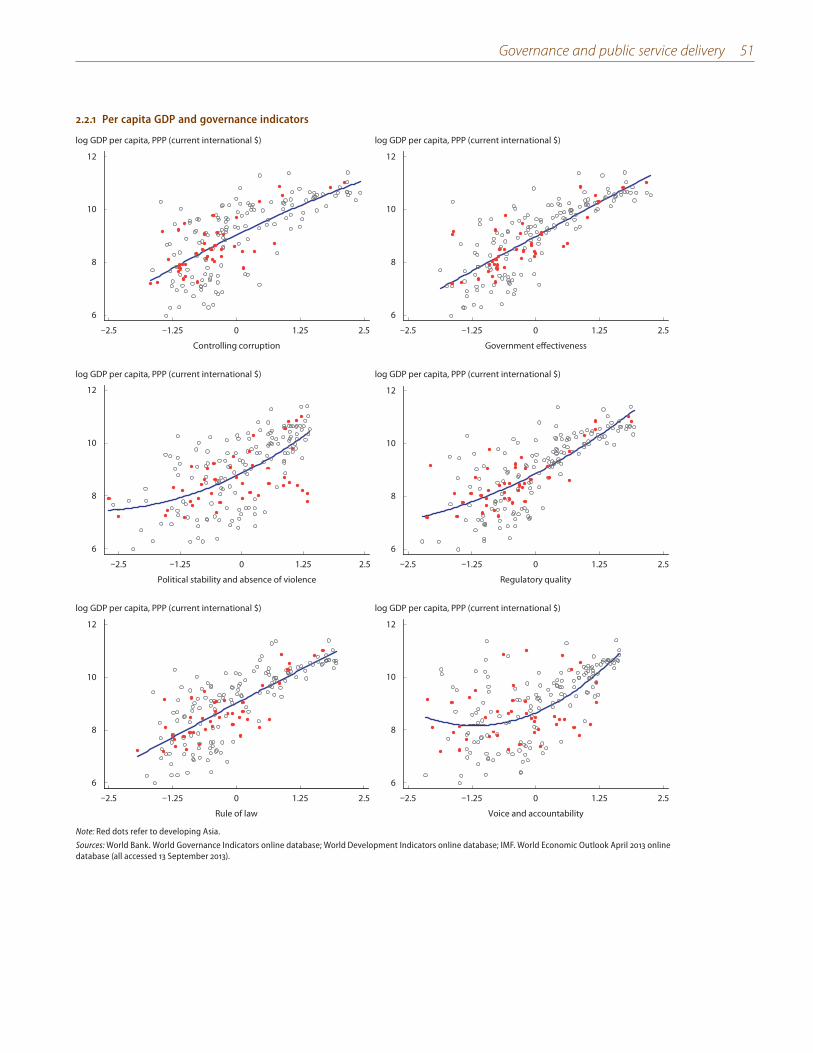
Governance and public service delivery 51
2.2.1 Per capita GDP and governance indicators
Controlling corruption
log GDP per capita, PPP (current international $)
6
8
10
12
–2.5 –1.25 0 1.25 2.5
Government effectiveness
log GDP per capita, PPP (current international $)
6
8
10
12
–2.5 –1.25 0 1.25 2.5
Political stability and absence of violence
log GDP per capita, PPP (current international $)
6
8
10
12
–2.5 –1.25 0 1.25 2.5
Regulatory quality
log GDP per capita, PPP (current international $)
6
8
10
12
–2.5 –1.25 0 1.25 2.5
Rule of law
log GDP per capita, PPP (current international $)
6
8
10
12
–2.5 –1.25 0 1.25 2.5
Voice and accountability
log GDP per capita, PPP (current international $)
6
8
10
12
–2.5 –1.25 0 1.25 2.5
Note: Red dots refer to developing Asia.
Sources: World Bank. World Governance Indicators online database; World Development Indicators online database; IMF. World Economic Outlook April 2013 online database (all accessed 13 September 2013).
52 Asian Development Outlook 2013 Update
Asia’s Conundrum—or is it?The disconnect between Asia’s rapid, sustained growth and its tardy improvement of governance is often viewed as a paradox that calls into question the conventional wisdom that good governance is a critical driver of growth. Particularly provocative is the exceptional development in several East Asian economies that lack textbook standards of good governance (Rodrik 2008, Gill and Kharas 2007). A popular way to explain away Asia’s growth–governance conundrum is to simply describe Asia as different from the rest of the world. Empirical evidence here suggests, though, that Asia shares a broadly similar relationship between governance quality and development performance, with the difference being that the relationship is stronger on government effectiveness and regulatory quality than on voice.
Governance and growthAsian countries that score high in government effectiveness, regulatory quality, and controlling corruption have grown more quickly than others. Han, Khan, and Zhuang (forthcoming) use a global dataset from 1998 to 2010 to empirically estimate the relationship between GDP growth and governance quality, explicitly testing whether the governance–growth relationship in Asia is different (Box 2.2.1). Their results show that all governance indicators—voice, political stability, government effectiveness, regulatory quality, the rule of law, and controlling corruption—have a positive and significant relationship with growth performance in the global sample of countries. More critically, their results show this relationship holds for Asian countries as well. However, government effectiveness and regulatory quality correlate much more strongly with growth in Asia than in the global sample.
To estimate what numerical difference good governance can have on growth performance, Han, Khan, and Zhuang (forthcoming) divide the sample countries into two groups: those with a governance score for a particular dimension in surplus (above the expected value for countries at a similar stage of development) and those with a score in deficit (below the expected value). The expected values are determined by a fitted regression line between the governance score as the dependent variable and per capita real income as the explanatory variable, estimated using cross-country data from 1998. The results show that countries in developing Asia with a surplus on government effectiveness, regulatory quality, and controlling corruption in 1998 grew annually during 1998–2011 by about 1.5 percentage points more quickly than those with deficits on those indicators (Table 2.2.1).
Government effectiveness and regulatory quality appear to be governance indicators particularly important for middle-income countries. In Latin America, countries with regulatory quality in surplus grew annually 0.8 percentage points more quickly than those in deficit; in the Middle East, countries with government effectiveness in surplus grew annually 1.8 percentage points more quickly than those in deficit. In these two middle-income regions, most countries with surpluses on other governance indicators also grew more quickly than countries with deficits, though the difference was not statistically significant. Among high-income OECD countries, those with surpluses on voice and
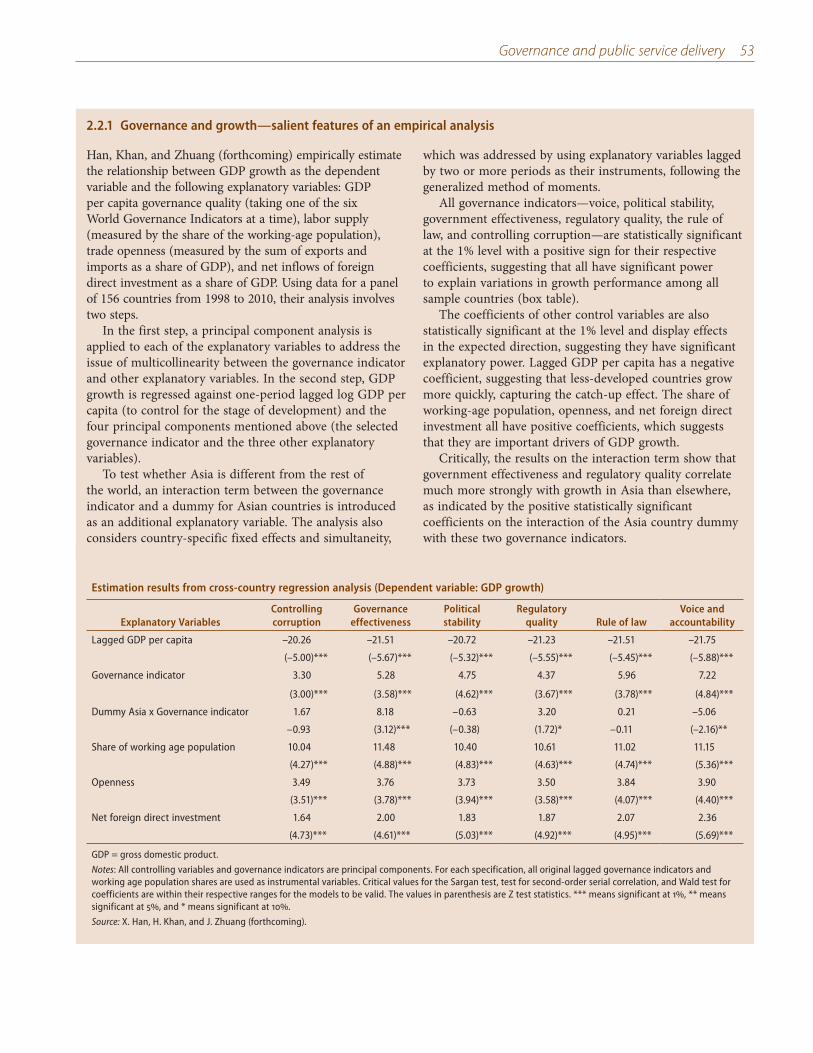
Governance and public service delivery 53
2.2.1 Governance and growth—salient features of an empirical analysis
Han, Khan, and Zhuang (forthcoming) empirically estimate the relationship between GDP growth as the dependent variable and the following explanatory variables: GDP per capita governance quality (taking one of the six World Governance Indicators at a time), labor supply (measured by the share of the working-age population), trade openness (measured by the sum of exports and imports as a share of GDP), and net inflows of foreign direct investment as a share of GDP. Using data for a panel of 156 countries from 1998 to 2010, their analysis involves two steps.
In the first step, a principal component analysis is applied to each of the explanatory variables to address the issue of multicollinearity between the governance indicator and other explanatory variables. In the second step, GDP growth is regressed against one-period lagged log GDP per capita (to control for the stage of development) and the four principal components mentioned above (the selected governance indicator and the three other explanatory variables).
To test whether Asia is different from the rest of the world, an interaction term between the governance indicator and a dummy for Asian countries is introduced as an additional explanatory variable. The analysis also considers country-specific fixed effects and simultaneity,
which was addressed by using explanatory variables lagged by two or more periods as their instruments, following the generalized method of moments.
All governance indicators—voice, political stability, government effectiveness, regulatory quality, the rule of law, and controlling corruption—are statistically significant at the 1% level with a positive sign for their respective coefficients, suggesting that all have significant power to explain variations in growth performance among all sample countries (box table).
The coefficients of other control variables are also statistically significant at the 1% level and display effects in the expected direction, suggesting they have significant explanatory power. Lagged GDP per capita has a negative coefficient, suggesting that less-developed countries grow more quickly, capturing the catch-up effect. The share of working-age population, openness, and net foreign direct investment all have positive coefficients, which suggests that they are important drivers of GDP growth.
Critically, the results on the interaction term show that government effectiveness and regulatory quality correlate much more strongly with growth in Asia than elsewhere, as indicated by the positive statistically significant coefficients on the interaction of the Asia country dummy with these two governance indicators.
Estimation results from cross-country regression analysis (Dependent variable: GDP growth)
Explanatory VariablesControlling corruption
Governance effectiveness
Political stability
Regulatory quality Rule of law
Voice and accountability
Lagged GDP per capita –20.26 –21.51 –20.72 –21.23 –21.51 –21.75
(–5.00)*** (–5.67)*** (–5.32)*** (–5.55)*** (–5.45)*** (–5.88)***
Governance indicator 3.30 5.28 4.75 4.37 5.96 7.22
(3.00)*** (3.58)*** (4.62)*** (3.67)*** (3.78)*** (4.84)***
Dummy Asia x Governance indicator 1.67 8.18 –0.63 3.20 0.21 –5.06
–0.93 (3.12)*** (–0.38) (1.72)* –0.11 (–2.16)**
Share of working age population 10.04 11.48 10.40 10.61 11.02 11.15
(4.27)*** (4.88)*** (4.83)*** (4.63)*** (4.74)*** (5.36)***
Openness 3.49 3.76 3.73 3.50 3.84 3.90
(3.51)*** (3.78)*** (3.94)*** (3.58)*** (4.07)*** (4.40)***
Net foreign direct investment 1.64 2.00 1.83 1.87 2.07 2.36
(4.73)*** (4.61)*** (5.03)*** (4.92)*** (4.95)*** (5.69)***
GDP = gross domestic product.
Notes: All controlling variables and governance indicators are principal components. For each specification, all original lagged governance indicators and working age population shares are used as instrumental variables. Critical values for the Sargan test, test for second-order serial correlation, and Wald test for coefficients are within their respective ranges for the models to be valid. The values in parenthesis are Z test statistics. *** means significant at 1, ** means significant at 5, and * means significant at 10.
Source: X. Han, H. Khan, and J. Zhuang (forthcoming).
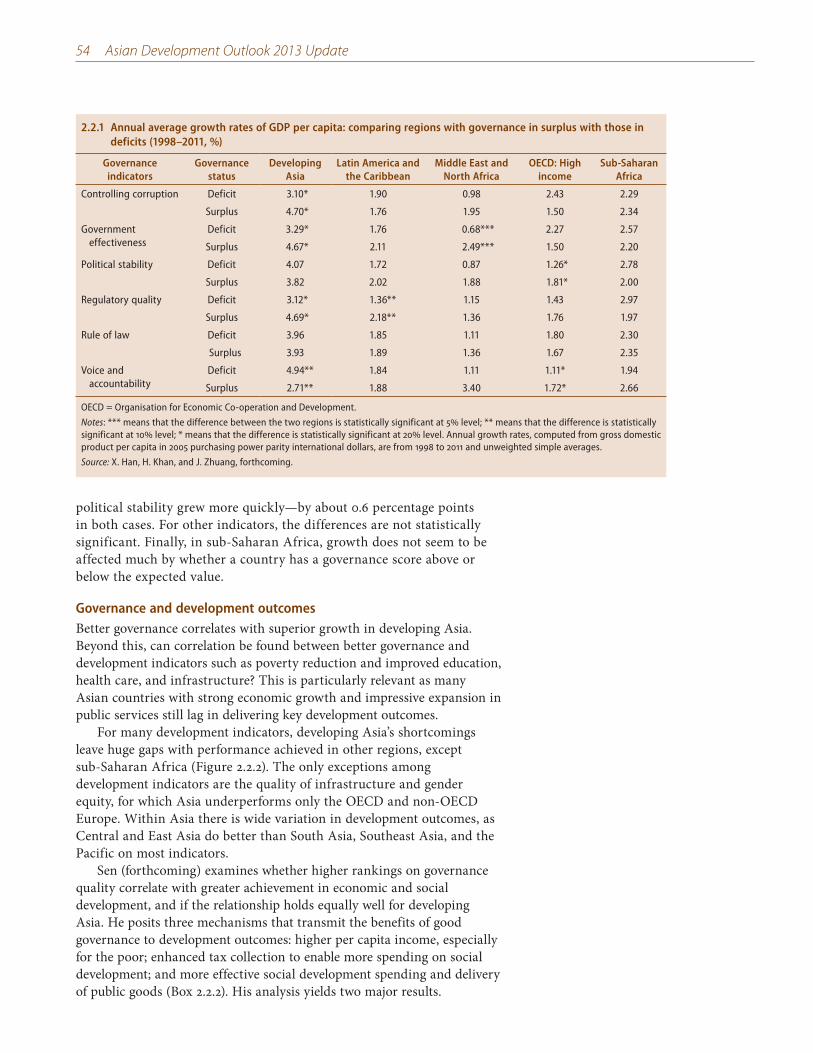
54 Asian Development Outlook 2013 Update
2.2.1 Annual average growth rates of GDP per capita: comparing regions with governance in surplus with those in deficits (1998–2011, %)
Governance indicators
Governance status
Developing Asia
Latin America and the Caribbean
Middle East and North Africa
OECD: High income
Sub-Saharan Africa
Controlling corruption Deficit 3.10* 1.90 0.98 2.43 2.29
Surplus 4.70* 1.76 1.95 1.50 2.34
Government effectiveness
Deficit 3.29* 1.76 0.68*** 2.27 2.57
Surplus 4.67* 2.11 2.49*** 1.50 2.20
Political stability Deficit 4.07 1.72 0.87 1.26* 2.78
Surplus 3.82 2.02 1.88 1.81* 2.00
Regulatory quality Deficit 3.12* 1.36** 1.15 1.43 2.97
Surplus 4.69* 2.18** 1.36 1.76 1.97
Rule of law Deficit 3.96 1.85 1.11 1.80 2.30
Surplus 3.93 1.89 1.36 1.67 2.35
Voice and accountability
Deficit 4.94** 1.84 1.11 1.11* 1.94
Surplus 2.71** 1.88 3.40 1.72* 2.66
OECD = Organisation for Economic Co-operation and Development.
Notes: *** means that the difference between the two regions is statistically significant at 5 level; ** means that the difference is statistically significant at 10 level; * means that the difference is statistically significant at 20 level. Annual growth rates, computed from gross domestic product per capita in 2005 purchasing power parity international dollars, are from 1998 to 2011 and unweighted simple averages.
Source: X. Han, H. Khan, and J. Zhuang, forthcoming.
political stability grew more quickly—by about 0.6 percentage points in both cases. For other indicators, the differences are not statistically significant. Finally, in sub-Saharan Africa, growth does not seem to be affected much by whether a country has a governance score above or below the expected value.
Governance and development outcomesBetter governance correlates with superior growth in developing Asia. Beyond this, can correlation be found between better governance and development indicators such as poverty reduction and improved education, health care, and infrastructure? This is particularly relevant as many Asian countries with strong economic growth and impressive expansion in public services still lag in delivering key development outcomes.
For many development indicators, developing Asia’s shortcomings leave huge gaps with performance achieved in other regions, except sub-Saharan Africa (Figure 2.2.2). The only exceptions among development indicators are the quality of infrastructure and gender equity, for which Asia underperforms only the OECD and non-OECD Europe. Within Asia there is wide variation in development outcomes, as Central and East Asia do better than South Asia, Southeast Asia, and the Pacific on most indicators.
Sen (forthcoming) examines whether higher rankings on governance quality correlate with greater achievement in economic and social development, and if the relationship holds equally well for developing Asia. He posits three mechanisms that transmit the benefits of good governance to development outcomes: higher per capita income, especially for the poor; enhanced tax collection to enable more spending on social development; and more effective social development spending and delivery of public goods (Box 2.2.2). His analysis yields two major results.
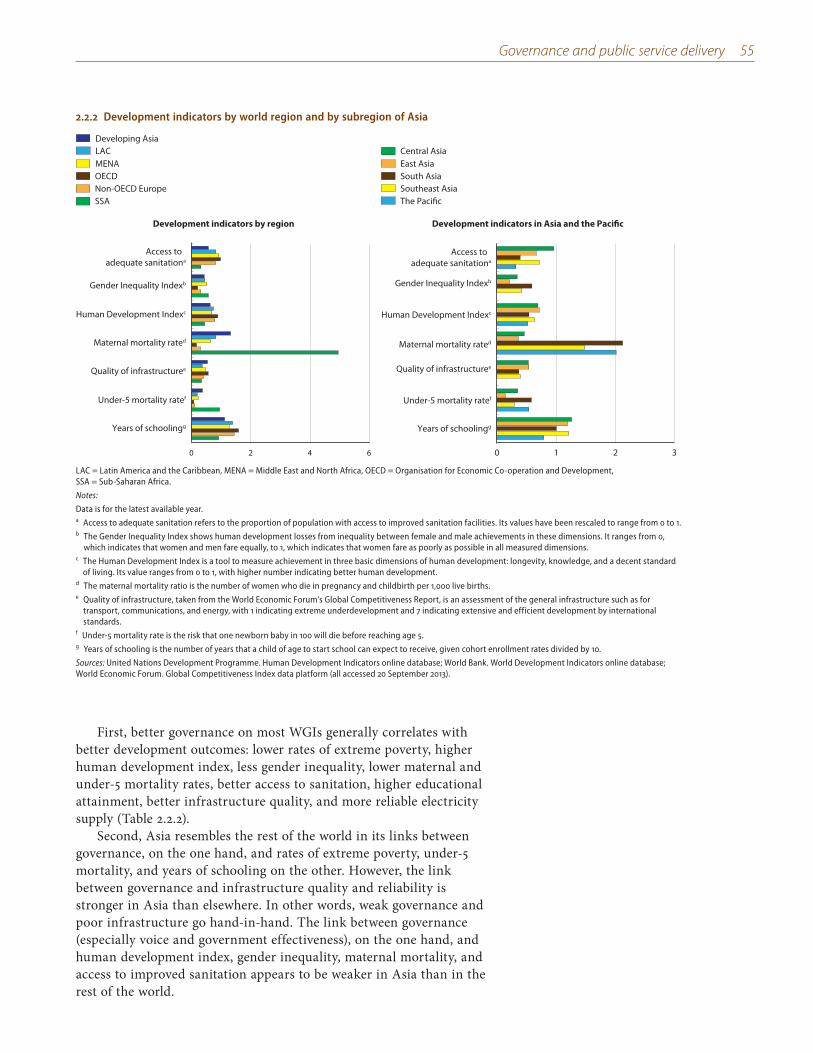
Governance and public service delivery 55
First, better governance on most WGIs generally correlates with better development outcomes: lower rates of extreme poverty, higher human development index, less gender inequality, lower maternal and under-5 mortality rates, better access to sanitation, higher educational attainment, better infrastructure quality, and more reliable electricity supply (Table 2.2.2).
Second, Asia resembles the rest of the world in its links between governance, on the one hand, and rates of extreme poverty, under-5 mortality, and years of schooling on the other. However, the link between governance and infrastructure quality and reliability is stronger in Asia than elsewhere. In other words, weak governance and poor infrastructure go hand-in-hand. The link between governance (especially voice and government effectiveness), on the one hand, and human development index, gender inequality, maternal mortality, and access to improved sanitation appears to be weaker in Asia than in the rest of the world.
2.2.2 Development indicators by world region and by subregion of Asia
MENAOECDNon-OECD EuropeSSA
LACDeveloping Asia
Development indicators by region
0 2 4 6
Years of schoolingg
Under-5 mortality ratef
Quality of infrastructuree
Maternal mortality rated
Human Development Indexc
Gender Inequality Indexb
Access to adequate sanitationa
Southeast AsiaSouth AsiaEast AsiaCentral Asia
The Pacific
Development indicators in Asia and the Pacific
0 1 2 3
Years of schoolingg
Under-5 mortality ratef
Quality of infrastructuree
Maternal mortality rated
Human Development Indexc
Gender Inequality Indexb
Access to adequate sanitationa
LAC = Latin America and the Caribbean, MENA = Middle East and North Africa, OECD = Organisation for Economic Co-operation and Development, SSA = Sub-Saharan Africa.
Notes:
Data is for the latest available year. a Access to adequate sanitation refers to the proportion of population with access to improved sanitation facilities. Its values have been rescaled to range from 0 to 1.b The Gender Inequality Index shows human development losses from inequality between female and male achievements in these dimensions. It ranges from 0,
which indicates that women and men fare equally, to 1, which indicates that women fare as poorly as possible in all measured dimensions.c The Human Development Index is a tool to measure achievement in three basic dimensions of human development: longevity, knowledge, and a decent standard
of living. Its value ranges from 0 to 1, with higher number indicating better human development. d The maternal mortality ratio is the number of women who die in pregnancy and childbirth per 1,000 live births. e Quality of infrastructure, taken from the World Economic Forum’s Global Competitiveness Report, is an assessment of the general infrastructure such as for
transport, communications, and energy, with 1 indicating extreme underdevelopment and 7 indicating extensive and efficient development by international standards.
f Under-5 mortality rate is the risk that one newborn baby in 100 will die before reaching age 5. g Years of schooling is the number of years that a child of age to start school can expect to receive, given cohort enrollment rates divided by 10.
Sources: United Nations Development Programme. Human Development Indicators online database; World Bank. World Development Indicators online database; World Economic Forum. Global Competitiveness Index data platform (all accessed 20 September 2013).
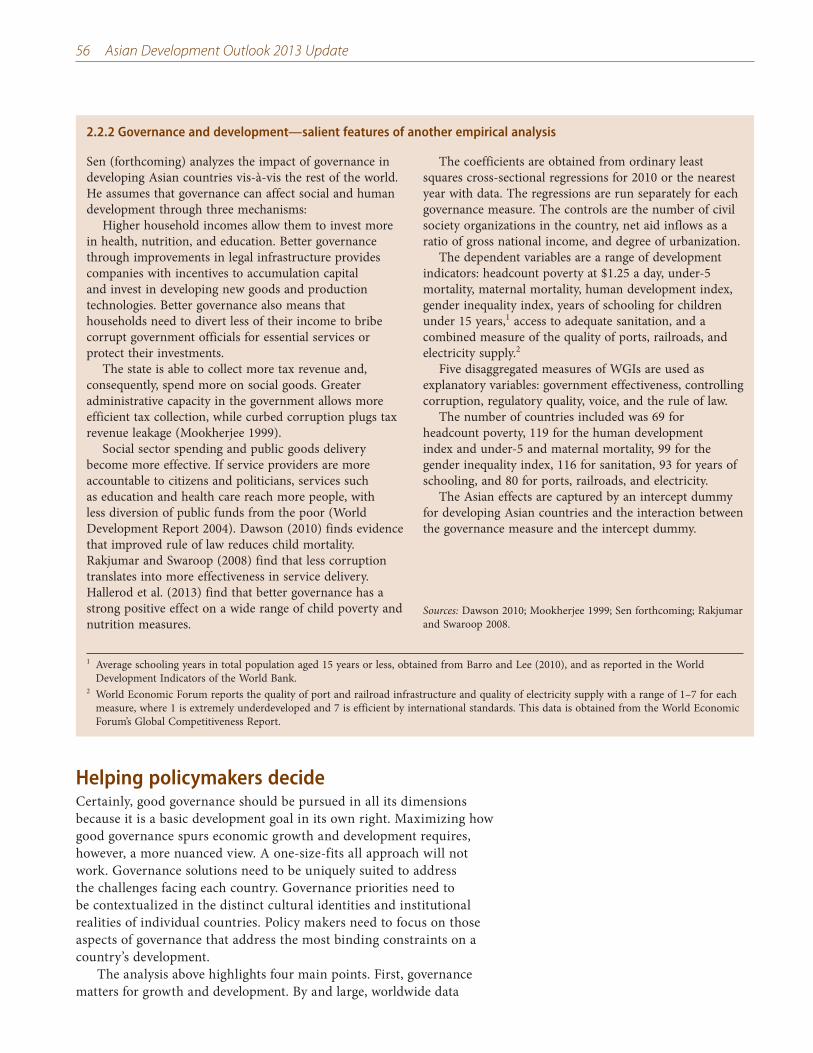
56 Asian Development Outlook 2013 Update
2.2.2 Governance and development—salient features of another empirical analysis
Sen (forthcoming) analyzes the impact of governance in developing Asian countries vis-à-vis the rest of the world. He assumes that governance can affect social and human development through three mechanisms:
Higher household incomes allow them to invest more in health, nutrition, and education. Better governance through improvements in legal infrastructure provides companies with incentives to accumulation capital and invest in developing new goods and production technologies. Better governance also means that households need to divert less of their income to bribe corrupt government officials for essential services or protect their investments.
The state is able to collect more tax revenue and, consequently, spend more on social goods. Greater administrative capacity in the government allows more efficient tax collection, while curbed corruption plugs tax revenue leakage (Mookherjee 1999).
Social sector spending and public goods delivery become more effective. If service providers are more accountable to citizens and politicians, services such as education and health care reach more people, with less diversion of public funds from the poor (World Development Report 2004). Dawson (2010) finds evidence that improved rule of law reduces child mortality. Rakjumar and Swaroop (2008) find that less corruption translates into more effectiveness in service delivery. Hallerod et al. (2013) find that better governance has a strong positive effect on a wide range of child poverty and nutrition measures.
The coefficients are obtained from ordinary least squares cross-sectional regressions for 2010 or the nearest year with data. The regressions are run separately for each governance measure. The controls are the number of civil society organizations in the country, net aid inflows as a ratio of gross national income, and degree of urbanization.
The dependent variables are a range of development indicators: headcount poverty at $1.25 a day, under-5 mortality, maternal mortality, human development index, gender inequality index, years of schooling for children under 15 years,1 access to adequate sanitation, and a combined measure of the quality of ports, railroads, and electricity supply.2
Five disaggregated measures of WGIs are used as explanatory variables: government effectiveness, controlling corruption, regulatory quality, voice, and the rule of law.
The number of countries included was 69 for headcount poverty, 119 for the human development index and under-5 and maternal mortality, 99 for the gender inequality index, 116 for sanitation, 93 for years of schooling, and 80 for ports, railroads, and electricity.
The Asian effects are captured by an intercept dummy for developing Asian countries and the interaction between the governance measure and the intercept dummy.
Sources: Dawson 2010; Mookherjee 1999; Sen forthcoming; Rakjumar and Swaroop 2008.
Helping policymakers decide Certainly, good governance should be pursued in all its dimensions because it is a basic development goal in its own right. Maximizing how good governance spurs economic growth and development requires, however, a more nuanced view. A one-size-fits all approach will not work. Governance solutions need to be uniquely suited to address the challenges facing each country. Governance priorities need to be contextualized in the distinct cultural identities and institutional realities of individual countries. Policy makers need to focus on those aspects of governance that address the most binding constraints on a country’s development.
The analysis above highlights four main points. First, governance matters for growth and development. By and large, worldwide data
1 Average schooling years in total population aged 15 years or less, obtained from Barro and Lee (2010), and as reported in the World Development Indicators of the World Bank.
2 World Economic Forum reports the quality of port and railroad infrastructure and quality of electricity supply with a range of 1–7 for each measure, where 1 is extremely underdeveloped and 7 is efficient by international standards. This data is obtained from the World Economic Forum’s Global Competitiveness Report.
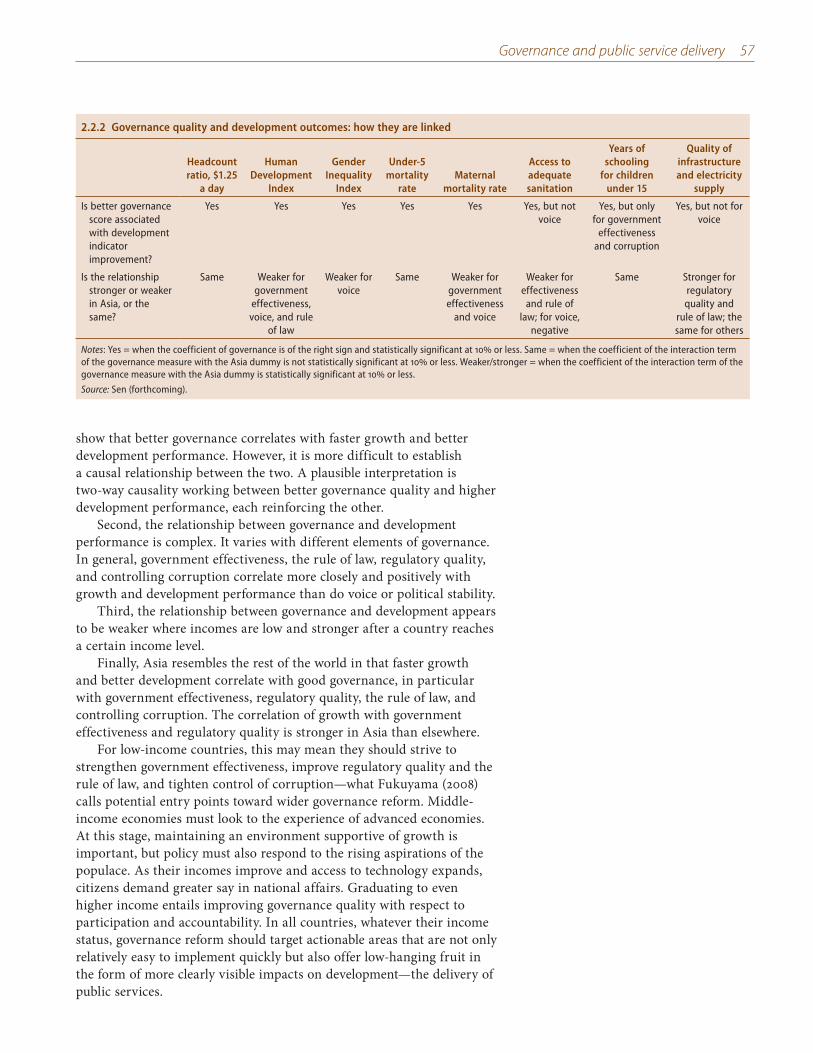
Governance and public service delivery 57
2.2.2 Governance quality and development outcomes: how they are linked
Headcount ratio, $1.25
a day
Human Development
Index
Gender Inequality
Index
Under-5 mortality
rateMaternal
mortality rate
Access to adequate sanitation
Years of schooling
for children under 15
Quality of infrastructure and electricity
supply
Is better governance score associated with development indicator improvement?
Yes Yes Yes Yes Yes Yes, but not voice
Yes, but only for government
effectiveness and corruption
Yes, but not for voice
Is the relationship stronger or weaker in Asia, or the same?
Same Weaker for government
effectiveness, voice, and rule
of law
Weaker for voice
Same Weaker for government effectiveness
and voice
Weaker for effectiveness
and rule of law; for voice,
negative
Same Stronger for regulatory quality and
rule of law; the same for others
Notes: Yes = when the coefficient of governance is of the right sign and statistically significant at 10 or less. Same = when the coefficient of the interaction term of the governance measure with the Asia dummy is not statistically significant at 10 or less. Weaker/stronger = when the coefficient of the interaction term of the governance measure with the Asia dummy is statistically significant at 10 or less.
Source: Sen (forthcoming).
show that better governance correlates with faster growth and better development performance. However, it is more difficult to establish a causal relationship between the two. A plausible interpretation is two-way causality working between better governance quality and higher development performance, each reinforcing the other.
Second, the relationship between governance and development performance is complex. It varies with different elements of governance. In general, government effectiveness, the rule of law, regulatory quality, and controlling corruption correlate more closely and positively with growth and development performance than do voice or political stability.
Third, the relationship between governance and development appears to be weaker where incomes are low and stronger after a country reaches a certain income level.
Finally, Asia resembles the rest of the world in that faster growth and better development correlate with good governance, in particular with government effectiveness, regulatory quality, the rule of law, and controlling corruption. The correlation of growth with government effectiveness and regulatory quality is stronger in Asia than elsewhere.
For low-income countries, this may mean they should strive to strengthen government effectiveness, improve regulatory quality and the rule of law, and tighten control of corruption—what Fukuyama (2008) calls potential entry points toward wider governance reform. Middle-income economies must look to the experience of advanced economies. At this stage, maintaining an environment supportive of growth is important, but policy must also respond to the rising aspirations of the populace. As their incomes improve and access to technology expands, citizens demand greater say in national affairs. Graduating to even higher income entails improving governance quality with respect to participation and accountability. In all countries, whatever their income status, governance reform should target actionable areas that are not only relatively easy to implement quickly but also offer low-hanging fruit in the form of more clearly visible impacts on development—the delivery of public services.
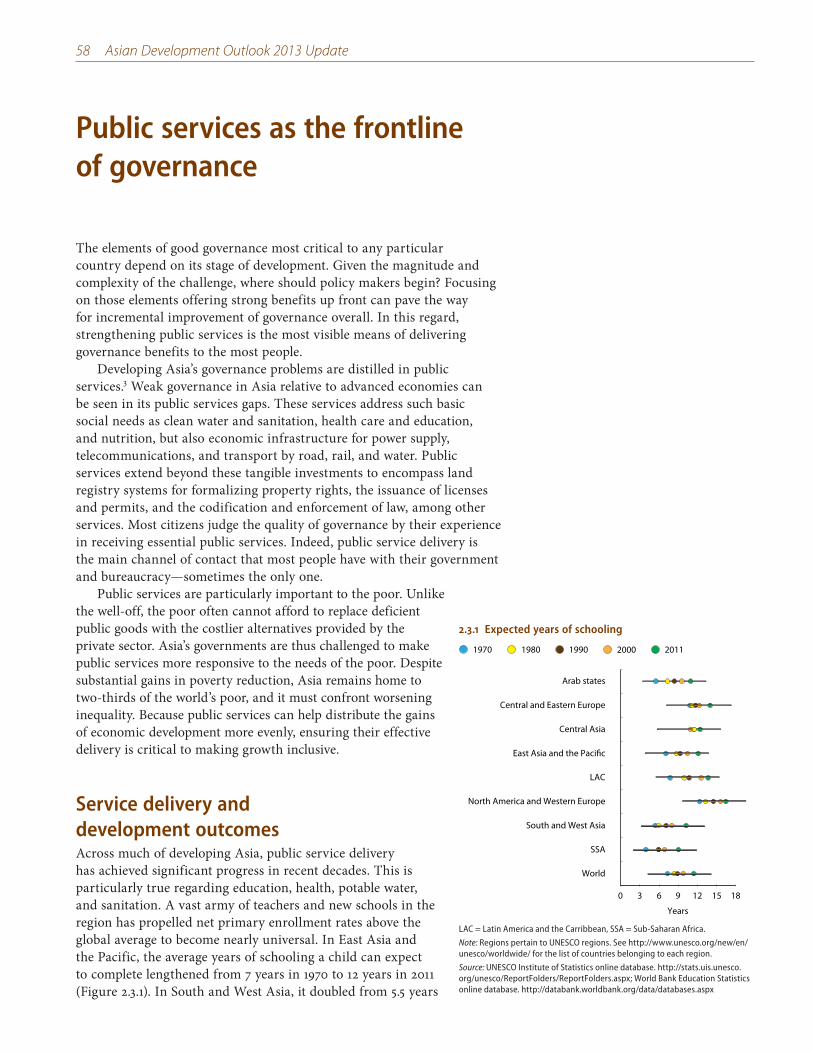
58 Asian Development Outlook 2013 Update
Public services as the frontline of governance
The elements of good governance most critical to any particular country depend on its stage of development. Given the magnitude and complexity of the challenge, where should policy makers begin? Focusing on those elements offering strong benefits up front can pave the way for incremental improvement of governance overall. In this regard, strengthening public services is the most visible means of delivering governance benefits to the most people.
Developing Asia’s governance problems are distilled in public services.3 Weak governance in Asia relative to advanced economies can be seen in its public services gaps. These services address such basic social needs as clean water and sanitation, health care and education, and nutrition, but also economic infrastructure for power supply, telecommunications, and transport by road, rail, and water. Public services extend beyond these tangible investments to encompass land registry systems for formalizing property rights, the issuance of licenses and permits, and the codification and enforcement of law, among other services. Most citizens judge the quality of governance by their experience in receiving essential public services. Indeed, public service delivery is the main channel of contact that most people have with their government and bureaucracy—sometimes the only one.
Public services are particularly important to the poor. Unlike the well-off, the poor often cannot afford to replace deficient public goods with the costlier alternatives provided by the private sector. Asia’s governments are thus challenged to make public services more responsive to the needs of the poor. Despite substantial gains in poverty reduction, Asia remains home to two-thirds of the world’s poor, and it must confront worsening inequality. Because public services can help distribute the gains of economic development more evenly, ensuring their effective delivery is critical to making growth inclusive.
Service delivery and development outcomesAcross much of developing Asia, public service delivery has achieved significant progress in recent decades. This is particularly true regarding education, health, potable water, and sanitation. A vast army of teachers and new schools in the region has propelled net primary enrollment rates above the global average to become nearly universal. In East Asia and the Pacific, the average years of schooling a child can expect to complete lengthened from 7 years in 1970 to 12 years in 2011 (Figure 2.3.1). In South and West Asia, it doubled from 5.5 years
2.3.1 Expected years of schooling
1980 1990 2000 20111970
0 3 6 9 12 15 18
Arab states
Central and Eastern Europe
Central Asia
East Asia and the Pacific
LAC
North America and Western Europe
South and West Asia
SSA
World
Years
LAC = Latin America and the Carribbean, SSA = Sub-Saharan Africa.
Note: Regions pertain to UNESCO regions. See http://www.unesco.org/new/en/unesco/worldwide/ for the list of countries belonging to each region.
Source: UNESCO Institute of Statistics online database. http://stats.uis.unesco.org/unesco/ReportFolders/ReportFolders.aspx; World Bank Education Statistics online database. http://databank.worldbank.org/data/databases.aspx
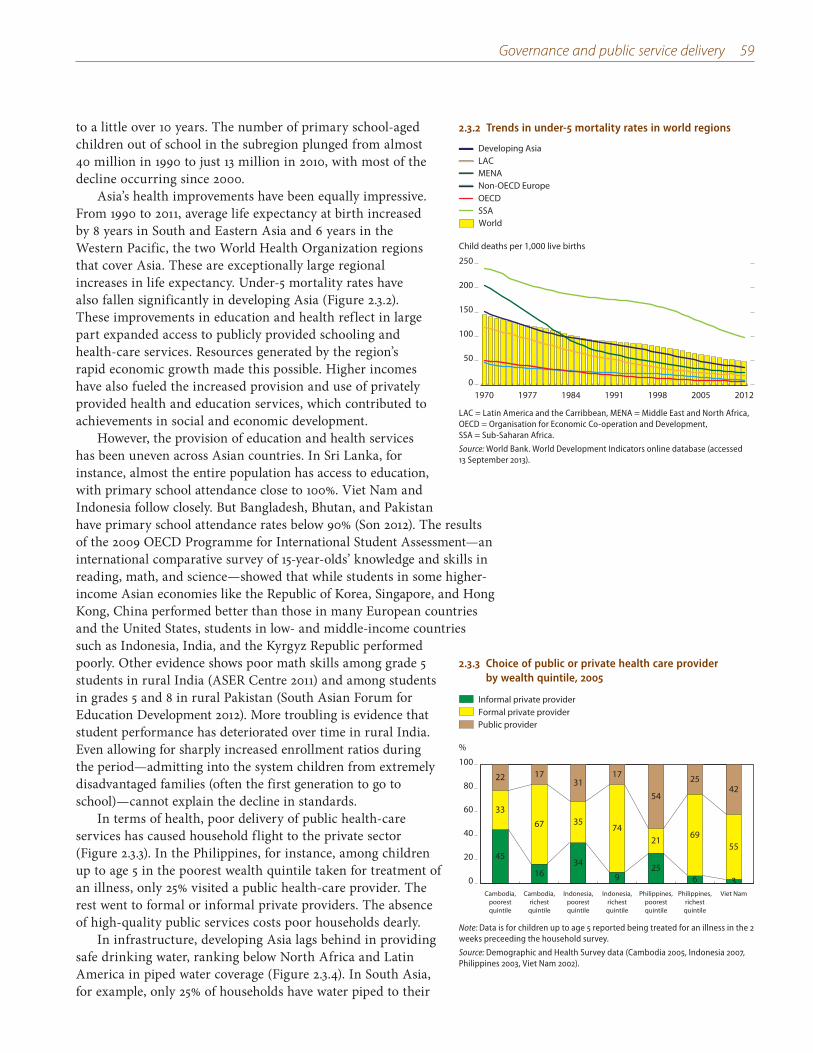
Governance and public service delivery 59
to a little over 10 years. The number of primary school-aged children out of school in the subregion plunged from almost 40 million in 1990 to just 13 million in 2010, with most of the decline occurring since 2000.
Asia’s health improvements have been equally impressive. From 1990 to 2011, average life expectancy at birth increased by 8 years in South and Eastern Asia and 6 years in the Western Pacific, the two World Health Organization regions that cover Asia. These are exceptionally large regional increases in life expectancy. Under-5 mortality rates have also fallen significantly in developing Asia (Figure 2.3.2). These improvements in education and health reflect in large part expanded access to publicly provided schooling and health-care services. Resources generated by the region’s rapid economic growth made this possible. Higher incomes have also fueled the increased provision and use of privately provided health and education services, which contributed to achievements in social and economic development.
However, the provision of education and health services has been uneven across Asian countries. In Sri Lanka, for instance, almost the entire population has access to education, with primary school attendance close to 100%. Viet Nam and Indonesia follow closely. But Bangladesh, Bhutan, and Pakistan have primary school attendance rates below 90% (Son 2012). The results of the 2009 OECD Programme for International Student Assessment—an international comparative survey of 15-year-olds’ knowledge and skills in reading, math, and science—showed that while students in some higher-income Asian economies like the Republic of Korea, Singapore, and Hong Kong, China performed better than those in many European countries and the United States, students in low- and middle-income countries such as Indonesia, India, and the Kyrgyz Republic performed poorly. Other evidence shows poor math skills among grade 5 students in rural India (ASER Centre 2011) and among students in grades 5 and 8 in rural Pakistan (South Asian Forum for Education Development 2012). More troubling is evidence that student performance has deteriorated over time in rural India. Even allowing for sharply increased enrollment ratios during the period—admitting into the system children from extremely disadvantaged families (often the first generation to go to school)—cannot explain the decline in standards.
In terms of health, poor delivery of public health-care services has caused household flight to the private sector (Figure 2.3.3). In the Philippines, for instance, among children up to age 5 in the poorest wealth quintile taken for treatment of an illness, only 25% visited a public health-care provider. The rest went to formal or informal private providers. The absence of high-quality public services costs poor households dearly.
In infrastructure, developing Asia lags behind in providing safe drinking water, ranking below North Africa and Latin America in piped water coverage (Figure 2.3.4). In South Asia, for example, only 25% of households have water piped to their
2.3.2 Trends in under-5 mortality rates in world regions
World
0
50
100
150
200
250
20122005 1998 1991 19841977 1970
Child deaths per 1,000 live births
OECDNon-OECD EuropeMENALACDeveloping Asia
SSA
LAC = Latin America and the Carribbean, MENA = Middle East and North Africa, OECD = Organisation for Economic Co-operation and Development, SSA = Sub-Saharan Africa.
Source: World Bank. World Development Indicators online database (accessed 13 September 2013).
2.3.3 Choice of public or private health care provider by wealth quintile, 2005
45
1634
925
6 3
33
67 3574
2169
55
22 1731
17
54
2542
0
20
40
60
80
100
Cambodia,poorestquintile
Indonesia,poorestquintile
Indonesia,richestquintile
Philippines,richestquintile
Philippines,poorestquintile
Cambodia,richestquintile
Viet Nam
%
Formal private providerPublic provider
Informal private provider
Note: Data is for children up to age 5 reported being treated for an illness in the 2 weeks preceeding the household survey.
Source: Demographic and Health Survey data (Cambodia 2005, Indonesia 2007, Philippines 2003, Viet Nam 2002).
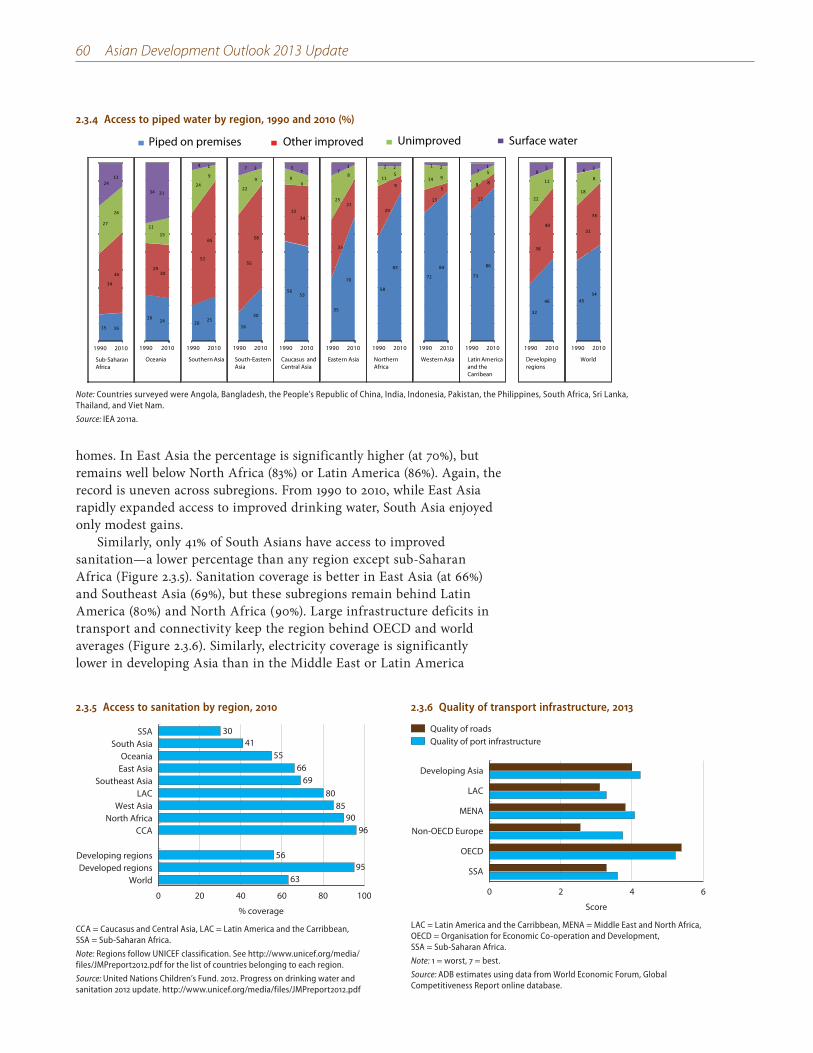
60 Asian Development Outlook 2013 Update
homes. In East Asia the percentage is significantly higher (at 70%), but remains well below North Africa (83%) or Latin America (86%). Again, the record is uneven across subregions. From 1990 to 2010, while East Asia rapidly expanded access to improved drinking water, South Asia enjoyed only modest gains.
Similarly, only 41% of South Asians have access to improved sanitation—a lower percentage than any region except sub-Saharan Africa (Figure 2.3.5). Sanitation coverage is better in East Asia (at 66%) and Southeast Asia (69%), but these subregions remain behind Latin America (80%) and North Africa (90%). Large infrastructure deficits in transport and connectivity keep the region behind OECD and world averages (Figure 2.3.6). Similarly, electricity coverage is significantly lower in developing Asia than in the Middle East or Latin America
2.3.5 Access to sanitation by region, 2010
0 20 40 60 80 100
WorldDeveloped regions
Developing regions
CCANorth Africa
West AsiaLAC
Southeast AsiaEast AsiaOceania
South AsiaSSA
% coverage
3041
5566
6980
8590
96
5695
63
CCA = Caucasus and Central Asia, LAC = Latin America and the Carribbean, SSA = Sub-Saharan Africa.
Note: Regions follow UNICEF classification. See http://www.unicef.org/media/files/JMPreport2012.pdf for the list of countries belonging to each region.
Source: United Nations Children’s Fund. 2012. Progress on drinking water and sanitation 2012 update. http://www.unicef.org/media/files/JMPreport2012.pdf
2.3.4 Access to piped water by region, 1990 and 2010 ()
Piped on premises Other improved Unimproved Surface water
15 16
34
45
27
26
2413
1990 2010
Sub-SaharanAfrica
26 24
2930
1115
34 31
1990 2010
Oceania
2025
52
65
24
9
4 1
1990 2010
Southern Asia
16
30
55
58
22
9
7 3
1990 2010
South-EasternAsia
5653
3234
96
37
1990 2010
Caucasus andCentral Asia
35
70
33
2125
87
1
1990 2010
Eastern Asia
58
83
29
911
52 2
1990 2010
Northern Africa
72
84
13
5
14 9
1 2
1990 2010
Western Asia
73
86
12
88
571
1990 2010
Latin Americaand theCarribean
32
46
38
40
22
11
83
1990 2010
Developing regions
4554
31
35
18
8
6 3
1990 2010
World
Note: Countries surveyed were Angola, Bangladesh, the People’s Republic of China, India, Indonesia, Pakistan, the Philippines, South Africa, Sri Lanka, Thailand, and Viet Nam.
Source: IEA 2011a.
2.3.6 Quality of transport infrastructure, 2013
0 2 4 6
SSA
OECD
Non-OECD Europe
MENA
LAC
Developing Asia
Score
Quality of port infrastructureQuality of roads
LAC = Latin America and the Carribbean, MENA = Middle East and North Africa, OECD = Organisation for Economic Co-operation and Development, SSA = Sub-Saharan Africa.
Note: 1 = worst, 7 = best.
Source: ADB estimates using data from World Economic Forum, Global Competitiveness Report online database.
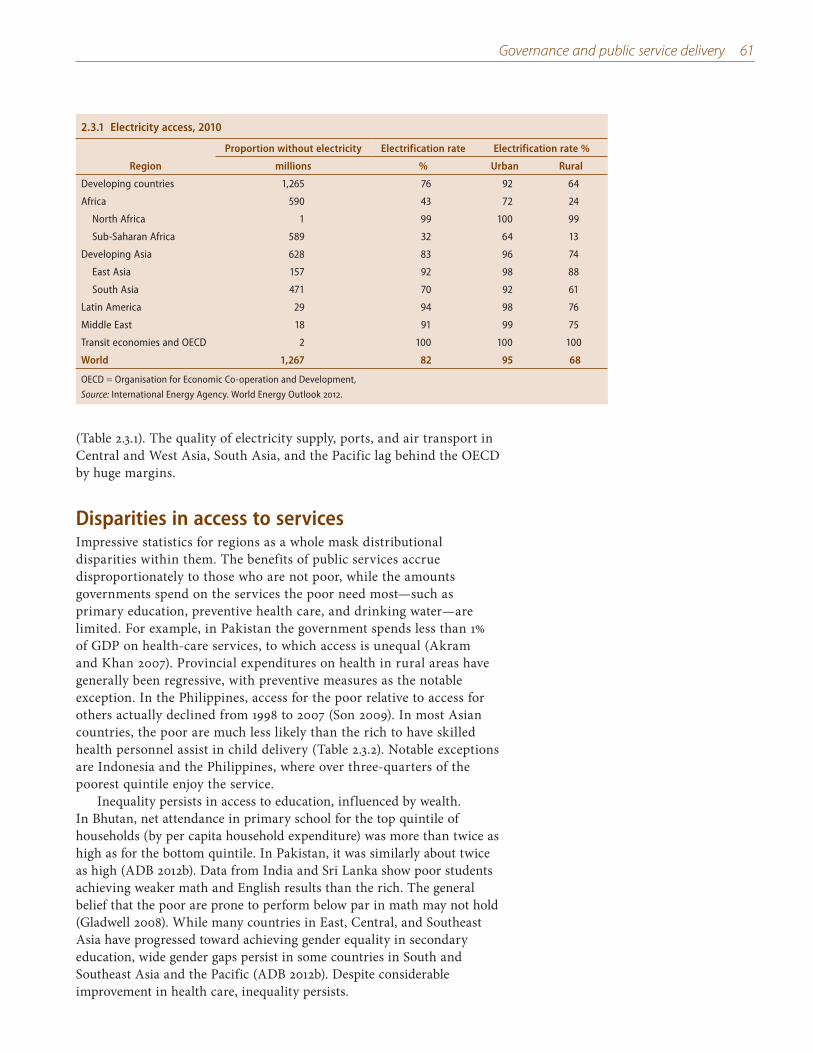
Governance and public service delivery 61
(Table 2.3.1). The quality of electricity supply, ports, and air transport in Central and West Asia, South Asia, and the Pacific lag behind the OECD by huge margins.
Disparities in access to servicesImpressive statistics for regions as a whole mask distributional disparities within them. The benefits of public services accrue disproportionately to those who are not poor, while the amounts governments spend on the services the poor need most—such as primary education, preventive health care, and drinking water—are limited. For example, in Pakistan the government spends less than 1% of GDP on health-care services, to which access is unequal (Akram and Khan 2007). Provincial expenditures on health in rural areas have generally been regressive, with preventive measures as the notable exception. In the Philippines, access for the poor relative to access for others actually declined from 1998 to 2007 (Son 2009). In most Asian countries, the poor are much less likely than the rich to have skilled health personnel assist in child delivery (Table 2.3.2). Notable exceptions are Indonesia and the Philippines, where over three-quarters of the poorest quintile enjoy the service.
Inequality persists in access to education, influenced by wealth. In Bhutan, net attendance in primary school for the top quintile of households (by per capita household expenditure) was more than twice as high as for the bottom quintile. In Pakistan, it was similarly about twice as high (ADB 2012b). Data from India and Sri Lanka show poor students achieving weaker math and English results than the rich. The general belief that the poor are prone to perform below par in math may not hold (Gladwell 2008). While many countries in East, Central, and Southeast Asia have progressed toward achieving gender equality in secondary education, wide gender gaps persist in some countries in South and Southeast Asia and the Pacific (ADB 2012b). Despite considerable improvement in health care, inequality persists.
2.3.1 Electricity access, 2010
Region
Proportion without electricity Electrification rate Electrification rate %
millions % Urban Rural
Developing countries 1,265 76 92 64
Africa 590 43 72 24
North Africa 1 99 100 99
Sub-Saharan Africa 589 32 64 13
Developing Asia 628 83 96 74
East Asia 157 92 98 88
South Asia 471 70 92 61
Latin America 29 94 98 76
Middle East 18 91 99 75
Transit economies and OECD 2 100 100 100
World 1,267 82 95 68
OECD = Organisation for Economic Co-operation and Development,
Source: International Energy Agency. World Energy Outlook 2012.
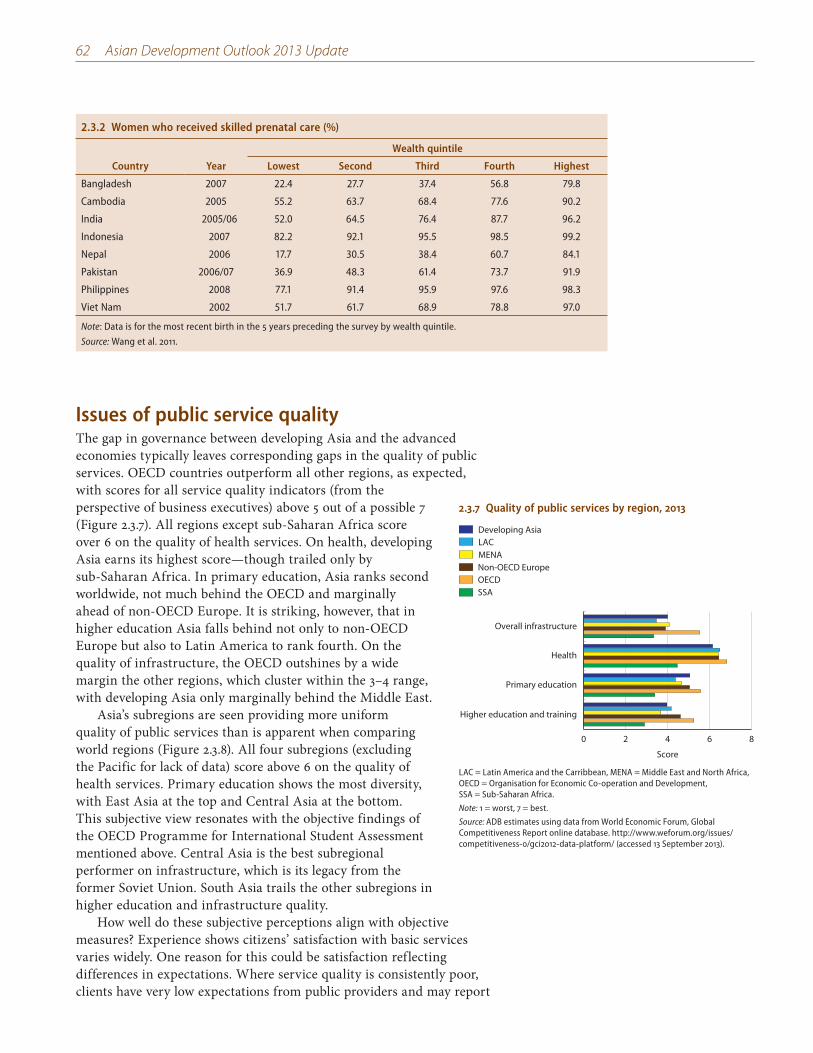
62 Asian Development Outlook 2013 Update
Issues of public service qualityThe gap in governance between developing Asia and the advanced economies typically leaves corresponding gaps in the quality of public services. OECD countries outperform all other regions, as expected, with scores for all service quality indicators (from the perspective of business executives) above 5 out of a possible 7 (Figure 2.3.7). All regions except sub-Saharan Africa score over 6 on the quality of health services. On health, developing Asia earns its highest score—though trailed only by sub-Saharan Africa. In primary education, Asia ranks second worldwide, not much behind the OECD and marginally ahead of non-OECD Europe. It is striking, however, that in higher education Asia falls behind not only to non-OECD Europe but also to Latin America to rank fourth. On the quality of infrastructure, the OECD outshines by a wide margin the other regions, which cluster within the 3–4 range, with developing Asia only marginally behind the Middle East.
Asia’s subregions are seen providing more uniform quality of public services than is apparent when comparing world regions (Figure 2.3.8). All four subregions (excluding the Pacific for lack of data) score above 6 on the quality of health services. Primary education shows the most diversity, with East Asia at the top and Central Asia at the bottom. This subjective view resonates with the objective findings of the OECD Programme for International Student Assessment mentioned above. Central Asia is the best subregional performer on infrastructure, which is its legacy from the former Soviet Union. South Asia trails the other subregions in higher education and infrastructure quality.
How well do these subjective perceptions align with objective measures? Experience shows citizens’ satisfaction with basic services varies widely. One reason for this could be satisfaction reflecting differences in expectations. Where service quality is consistently poor, clients have very low expectations from public providers and may report
2.3.7 Quality of public services by region, 2013
0 2 4 6 8
Higher education and training
Primary education
Health
Overall infrastructure
Score
MENANon-OECD EuropeOECDSSA
LACDeveloping Asia
LAC = Latin America and the Carribbean, MENA = Middle East and North Africa, OECD = Organisation for Economic Co-operation and Development, SSA = Sub-Saharan Africa.
Note: 1 = worst, 7 = best.
Source: ADB estimates using data from World Economic Forum, Global Competitiveness Report online database. http://www.weforum.org/issues/competitiveness-0/gci2012-data-platform/ (accessed 13 September 2013).
2.3.2 Women who received skilled prenatal care (%)
Country Year
Wealth quintile
Lowest Second Third Fourth Highest
Bangladesh 2007 22.4 27.7 37.4 56.8 79.8
Cambodia 2005 55.2 63.7 68.4 77.6 90.2
India 2005/06 52.0 64.5 76.4 87.7 96.2
Indonesia 2007 82.2 92.1 95.5 98.5 99.2
Nepal 2006 17.7 30.5 38.4 60.7 84.1
Pakistan 2006/07 36.9 48.3 61.4 73.7 91.9
Philippines 2008 77.1 91.4 95.9 97.6 98.3
Viet Nam 2002 51.7 61.7 68.9 78.8 97.0
Note: Data is for the most recent birth in the 5 years preceding the survey by wealth quintile.
Source: Wang et al. 2011.
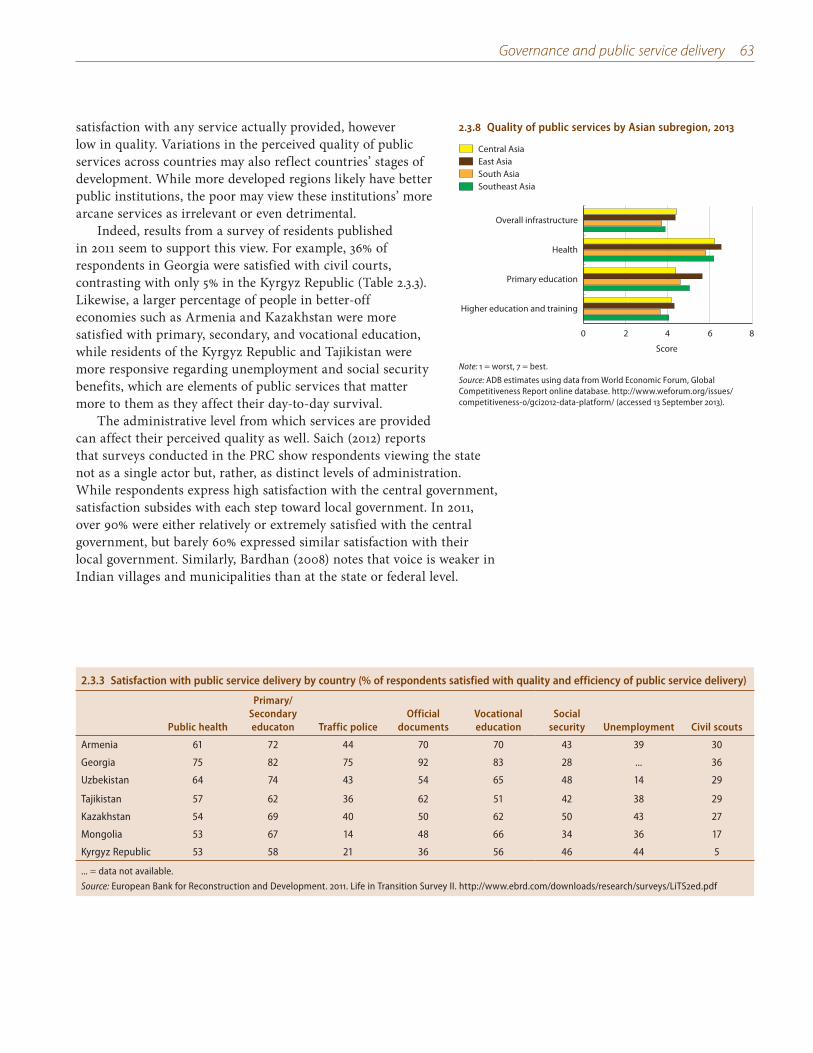
Governance and public service delivery 63
2.3.8 Quality of public services by Asian subregion, 2013
Central AsiaEast AsiaSouth AsiaSoutheast Asia
0 2 4 6 8
Higher education and training
Primary education
Health
Overall infrastructure
Score
Note: 1 = worst, 7 = best.
Source: ADB estimates using data from World Economic Forum, Global Competitiveness Report online database. http://www.weforum.org/issues/competitiveness-0/gci2012-data-platform/ (accessed 13 September 2013).
2.3.3 Satisfaction with public service delivery by country (% of respondents satisfied with quality and efficiency of public service delivery)
Public health
Primary/Secondary educaton Traffic police
Official documents
Vocational education
Social security Unemployment Civil scouts
Armenia 61 72 44 70 70 43 39 30
Georgia 75 82 75 92 83 28 ... 36
Uzbekistan 64 74 43 54 65 48 14 29
Tajikistan 57 62 36 62 51 42 38 29
Kazakhstan 54 69 40 50 62 50 43 27
Mongolia 53 67 14 48 66 34 36 17
Kyrgyz Republic 53 58 21 36 56 46 44 5
... = data not available.
Source: European Bank for Reconstruction and Development. 2011. Life in Transition Survey II. http://www.ebrd.com/downloads/research/surveys/LiTS2ed.pdf
satisfaction with any service actually provided, however low in quality. Variations in the perceived quality of public services across countries may also reflect countries’ stages of development. While more developed regions likely have better public institutions, the poor may view these institutions’ more arcane services as irrelevant or even detrimental.
Indeed, results from a survey of residents published in 2011 seem to support this view. For example, 36% of respondents in Georgia were satisfied with civil courts, contrasting with only 5% in the Kyrgyz Republic (Table 2.3.3). Likewise, a larger percentage of people in better-off economies such as Armenia and Kazakhstan were more satisfied with primary, secondary, and vocational education, while residents of the Kyrgyz Republic and Tajikistan were more responsive regarding unemployment and social security benefits, which are elements of public services that matter more to them as they affect their day-to-day survival.
The administrative level from which services are provided can affect their perceived quality as well. Saich (2012) reports that surveys conducted in the PRC show respondents viewing the state not as a single actor but, rather, as distinct levels of administration. While respondents express high satisfaction with the central government, satisfaction subsides with each step toward local government. In 2011, over 90% were either relatively or extremely satisfied with the central government, but barely 60% expressed similar satisfaction with their local government. Similarly, Bardhan (2008) notes that voice is weaker in Indian villages and municipalities than at the state or federal level.
64 Asian Development Outlook 2013 Update
2.3.1 Delinquency, incompetence, and pilferage as corruption
Too many unmotivated service providers in weak systems in developing Asia fail to show up for work. This insidious form of corruption—wrongfully diverting for private gain not funds per se but paid-for time and talent—robs children of education, the sick of hope, and society of welfare gains foregone (Banerjee et al. 2012). Better monitoring can limit the scope for shirking and other forms of petty corruption.
In India, despite substantial improvement in physical infrastructure for schools and pupil–teacher ratios, teacher absence rates barely changed from 2003 to 2010, with some states performing significantly worse than others (Muralidharan et al. 2013). Data from Indonesia show teacher absenteeism nationally in public primary schools is 19% (Usman, Akhmadi, and Suryadarma 2007). Even when teachers show up, there is no guarantee that education will be high quality. Teachers evaluated according to the test scores of their students may, for example, decide to teach to the test at the expense of improving other dimensions of teaching (Glewwe et al. 2010, Figlio and Getzler 2002).
Muralidharan et al. (2013) calculated the fiscal cost of teacher absenteeism from public schools in India at $1.5 billion per year. They found strong evidence that better monitoring reduces teacher absence and estimated that investments that increase the frequency of teacher monitoring would yield a nine-fold return on investment. Usman, Akhmadi, and Suryadarma (2007) noted that teacher recognition programs in Indonesia reduce teacher absenteeism. Analysis from Indonesia’s school-based management system shows that evaluating teachers more frequently and arranging greater participation in teacher working groups improve learning in public primary schools (Menno Pradhan forthcoming).
As with teachers, the mere presence of doctors does not guarantee high-quality health care. Health workers may resort to rule-of-thumb decisions that risk overmedicating patients, rather than follow through with time-consuming diagnostic procedures. Das and Hammer (2004) found the quality of doctors in Delhi to be very
low on average, noting that as few as 30% of health-care providers correctly prescribe oral rehydration therapy to treat diarrhea, a common affliction in developing countries.
In addition to shirking, contracted providers may divert economic resources for private gain. If corruption is pervasive, little public funding ends up being used productively, regardless of how much is allocated.
Olken (2006) and Jha and Ramaswami (2012) provide interesting evidence from food subsidy programs in Indonesia and India. To detect corruption, the authors compared the amount of food the national government officially reported as disbursed in a given village or district with the amount households reported receiving. The discrepancy suggests that 18%–50% of the food was diverted by corruption in the supply chain.
Weak service delivery means long waiting times, inadequate attention, and inferior treatment for the poor. Extortion, bribes, and theft of resources hurt the poor most as they either struggle to scrape together money to pay or simply lose out on services. The wide prevalence of this kind of petty corruption is a major challenge for policy makers in developing Asia.
Sources: Banerjee et al. 2012; Muralidharan et al. 2013; Usman, Akhmadi, and Suryadarma 2007; Pradhan, (forthcoming; Chaudhury and Hammer 2004; Chaudhury et al. 2006; Banerjee et al. 2004; Das and Hammer 2004; Olken 2006; Jha and Ramaswami 2012.
Governance and public service delivery 65
It is also clear that corruption and lack of commitment undermine welfare gains, as an examination of critical education, health-care, and nutrition services shows. Teacher absenteeism mocks investments to improve school infrastructure and raise teacher–student ratios. Doctors absent from public health clinics and rice missing from distribution programs also typify casual corruption on the frontlines that routinely deprives communities of 20%–40% of funded benefits (Box 3.2.1).
Many governance projects fail to curb corruption, reinforcing the need for comprehensive reforms that carefully assign official discretion to limit the scope for abuse. It is important, too, that the quality of public services depends not just on the quality of governance but also on the fiscal resources needed to deliver public services. Half of developing Asian countries spend less than 5% of their GDP on health and a similar amount for education (Lavado and Domingo forthcoming). While greater investment is required in social and infrastructure services to empower the poor, marginalized, and vulnerable, so is giving them voice to demand accountability and basic public services of acceptable quality. Public service delivery needs reform from the perspective of both supply and demand, with input from the public and private sectors, including civil society. If market providers work efficiently, they can satisfy the need for some services and free up public resources for use elsewhere.
66 Asian Development Outlook 2013 Update
Ways to improve public service delivery
Discussing the larger issues of governance and service delivery is one thing, but it is another to actually deliver public services through micro interventions that reach local communities, households, and individuals. Public service delivery that effectively reaches target groups and efficiently uses available resources—providing roads and computerized health-care records to communities, electricity to homes, and textbooks to students—depends on a clear understanding of the opportunities and pitfalls posed by each intervention. Central governments often lack the knowledge about local needs and preferences to provide public services of adequate quality to their citizens. They can compensate by collaborating with local governments, the private sector, and civil society.
Decentralization and civic participation are two complementary ways of strengthening and legitimizing local governance reform. In recent decades, central governments have increasingly shared responsibility for providing public services with local governments to improve public accountability and responsiveness. Local governance comprises a set of institutions, mechanisms, and processes through which citizens and community groups can voice their interests and needs, mediate differences, and exercise rights and obligations locally (UNDP 2004). When local governments lack the administrative capacity to design or administer public services, local civil society—citizens and nonprofit organizations—can fill the gap. Civic engagement develops individual capacity; builds social trust, norms of cooperation, and the ideal of the common good; and promotes more equal protection of interests (Lehman, Verba, and Brady 1999). Public–private partnerships in Asia are proliferating and becoming more complex, at their best infusing service provision with social dynamism (Capuno forthcoming).
Whether Asian governments are successful in addressing these issues—by either raising more funds or using existing local resources more efficiently—depends largely on the extent to which they can use three central mechanisms for public service delivery—the “three Es”:
Empowering citizens enables people to participate in public service delivery or monitor service provision, as well as demand accountability from service providers, thereby limiting scope for corruption. Engaging local governments and the private sector to provide public services addresses communities’ particular needs and—in a hands-on fashion—the uneven delivery of public services across provinces. Expanding information and communication technology provides a catalyst to enhance the leveraging that empowerment and decentralization bring to service delivery.4
Governance and public service delivery 67
Empowering citizens One effective way of delivering public services to a targeted clientele is civic empowerment. This grants people the freedom to decide on matters that affect their lives and the right to participate in development, empowering them by expanding their assets and capabilities. This concept is influenced by the rights and capacity approach elucidated by the economist and Nobel laureate Amartya Sen. It emphasizes that people should be free to choose what they want to do, have the ability to put those choices into action, and live in an environment that allows them to actually get it done (Sen 2005). When adequately empowered, citizens can use their client power to improve service provision and the accountability of politicians and service providers.
Empowerment can occur in three major ways: rights-based entitlements, in which the state guarantees to people the right to information and specific social services and basic necessities, such as food, employment, health, and education; performance monitoring by citizens and communities, who monitor and evaluate the implementation of public services—often against indicators the people themselves have selected—toward demanding better performance from service providers; and community participation, wherein groups of end users or entire communities become involved in delivering services and thereby directly controlling their quantity and quality.
Rights-based entitlements Some public services are so basic to decent human life that they are considered fundamental human rights. Without formal rights, people—especially the poor—may struggle under continual uncertainty, at risk of deprivation and destitution with no means of subsistence, and perhaps displaced from ancestral lands. A common form of empowerment is through rights-based entitlements—enforceable rights enshrined in the legal framework or national constitution—with specific roles and responsibilities for implementing authorities, and clear criteria for identifying eligible beneficiaries.
Many Asian countries have adopted this rights-based approach. They include Bangladesh and Pakistan for education; Bangladesh, India, Indonesia, the Philippines, and Sri Lanka for water; and Indonesia, the Maldives, Nepal, Thailand, and Timor-Leste for health care. India is one country that has adopted rights to information, jobs, and food in a steady and successive manner (Aiyar and Walton forthcoming). Most recent is a new law on food security, passed in September 2013, that grants a legal right to heavily subsidized food grains to nearly 800 million people—three-quarters of the rural population plus half of the urban population. In 2012, most member states of the International Labour Organisation voted for “social protection floors,” which establish as rights the receipt of public services that meet minimum service standards (International Labour Organisation 2012). National social protection floors—based on national objectives and economic and fiscal capacity—are expected to address poverty, vulnerability, and social exclusion.
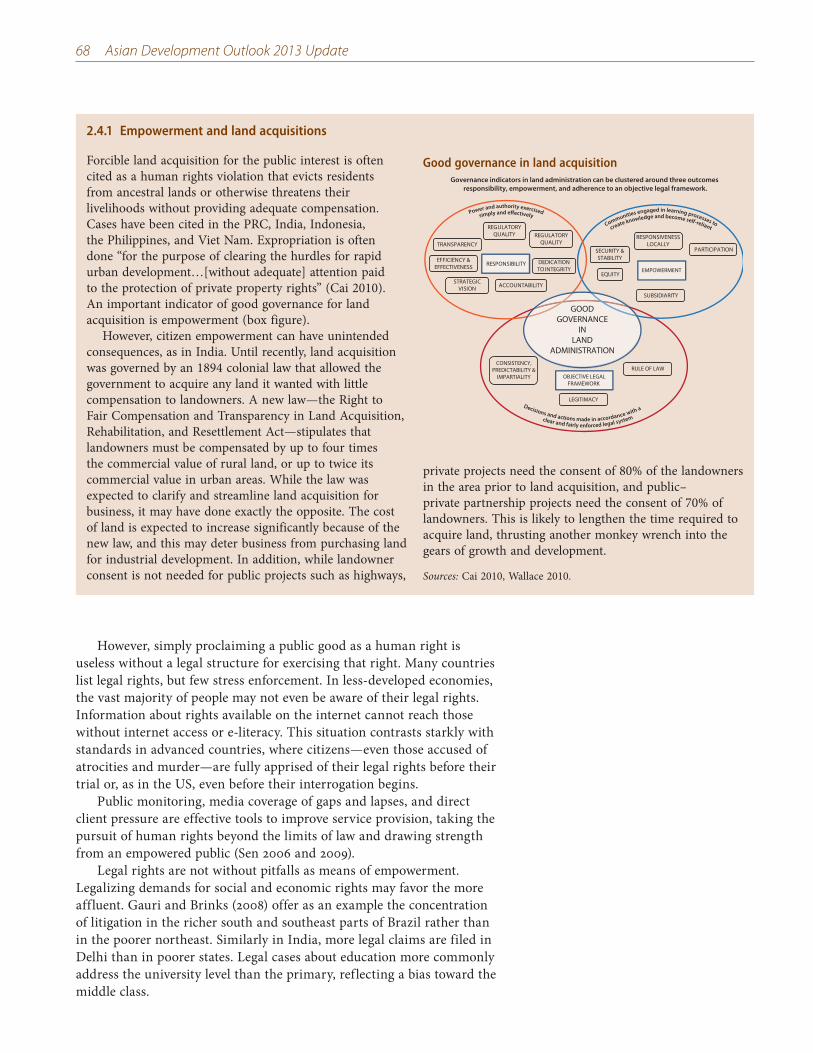
68 Asian Development Outlook 2013 Update
However, simply proclaiming a public good as a human right is useless without a legal structure for exercising that right. Many countries list legal rights, but few stress enforcement. In less-developed economies, the vast majority of people may not even be aware of their legal rights. Information about rights available on the internet cannot reach those without internet access or e-literacy. This situation contrasts starkly with standards in advanced countries, where citizens—even those accused of atrocities and murder—are fully apprised of their legal rights before their trial or, as in the US, even before their interrogation begins.
Public monitoring, media coverage of gaps and lapses, and direct client pressure are effective tools to improve service provision, taking the pursuit of human rights beyond the limits of law and drawing strength from an empowered public (Sen 2006 and 2009).
Legal rights are not without pitfalls as means of empowerment. Legalizing demands for social and economic rights may favor the more affluent. Gauri and Brinks (2008) offer as an example the concentration of litigation in the richer south and southeast parts of Brazil rather than in the poorer northeast. Similarly in India, more legal claims are filed in Delhi than in poorer states. Legal cases about education more commonly address the university level than the primary, reflecting a bias toward the middle class.
2.4.1 Empowerment and land acquisitions
Forcible land acquisition for the public interest is often cited as a human rights violation that evicts residents from ancestral lands or otherwise threatens their livelihoods without providing adequate compensation. Cases have been cited in the PRC, India, Indonesia, the Philippines, and Viet Nam. Expropriation is often done “for the purpose of clearing the hurdles for rapid urban development…[without adequate] attention paid to the protection of private property rights” (Cai 2010). An important indicator of good governance for land acquisition is empowerment (box figure).
However, citizen empowerment can have unintended consequences, as in India. Until recently, land acquisition was governed by an 1894 colonial law that allowed the government to acquire any land it wanted with little compensation to landowners. A new law—the Right to Fair Compensation and Transparency in Land Acquisition, Rehabilitation, and Resettlement Act—stipulates that landowners must be compensated by up to four times the commercial value of rural land, or up to twice its commercial value in urban areas. While the law was expected to clarify and streamline land acquisition for business, it may have done exactly the opposite. The cost of land is expected to increase significantly because of the new law, and this may deter business from purchasing land for industrial development. In addition, while landowner consent is not needed for public projects such as highways,
private projects need the consent of 80% of the landowners in the area prior to land acquisition, and public–private partnership projects need the consent of 70% of landowners. This is likely to lengthen the time required to acquire land, thrusting another monkey wrench into the gears of growth and development.
Sources: Cai 2010, Wallace 2010.
Good governance in land acquisition
TRANSPARENCY
Governance indicators in land administration can be clustered around three outcomes
responsibility, empowerment, and adherence to an objective legal framework.
EFFICIENCY &EFFECTIVENESS
ACCOUNTABILITY
DEDICATIONTO INTEGRITY
REGULATORYQUALITY
STRATEGICVISION
REGULATORYQUALITY
SUBSIDIARITY
EQUITY
PARTICIPATION
LEGITIMACY
CONSISTENCY,PREDICTABILITY &
IMPARTIALITYRULE OF LAW
RESPONSIBILITYEMPOWERMENT
OBJECTIVE LEGALFRAMEWORK
Decisions and actions made in accordance with a
clear and fairly enforced legal system
GOODGOVERNANCE
INLAND
ADMINISTRATION
Power and authority exercisedsimply and effectively
Communities engaged in learning processes tocreate knowledge and become self-reliant
RESPONSIVENESSLOCALLY
SECURITY &STABILITY
Governance and public service delivery 69
Rights-based entitlements can be misused or exploited. Empowered communities and citizens have sometimes jeopardized high-priority national infrastructure projects such as large irrigation works, dams, and public highways by mounting protests—that is, by exercising voice. Land acquisition under eminent domain frequently falls victim to entrenched interests (Box 2.4.1).
Perhaps the biggest challenge to implementing a rights-based approach is resource constraint, especially in low-income countries and in countries with high fiscal deficits. Economic and social rights to social protection, health, and education require particularly large resources (Munro 2008). Pursuing these rights risks amassing government commitments that are both excessive and inflexible, threatening macroeconomic stability and crowding out other worthy investments. For example, India’s new food security law is estimated to expand the country’s food subsidy burden by 18%, or 1% of GDP (Ramaswami, Murugkar, and Kotwal 2013). Kelkar and Shah (2011) frame this explicitly in terms of a substantive shift toward social democratic commitments that is unaffordable at India’s stage of economic development.
If fundamental rights-based entitlement programs are to seriously address poverty and inequality, the rights-based framework must be fiscally sustainable and reflected in government budgets. Sustaining the quality of services requires resources for operating and maintaining service facilities and sufficient capacity to deliver on these commitments. This demands an efficient use of scarce public funds (Lavado and Domingo forthcoming).
Public monitoring Social accountability mechanisms—such as the public’s monitoring and evaluation of service delivery—build government responsiveness through civic engagement. Citizen report cards, community score cards, social audits and public hearings, grievance redress systems, and opinion surveys are some ways of building accountability.
Citizen report cards gather information about users’ perceptions and views of service delivery performance, outcomes, and usefulness. They provide stakeholders with feedback toward taking remedial action. Success stories from Asia include, in India, the 1994 and 1999 Bangalore citizen report cards and the 1997 Ahmedabad report card, and, in the Philippines, the 2001 citizen report card (Babajanian forthcoming).
Social public service audits safeguard transparency and accountability by verifying discrepancies in government records and expenditures on services. In the Philippines, participatory audits of local government infrastructure projects by social groups—including the poor and women—and assessment reports by nongovernment organizations (NGOs), such as the Concerned Citizens of Abra for Good Governance, became conditions for the release of local government funds for service provision (PAF, Sirker, and Cosic 2007, Ramkumar and Krafchik 2005).
Community score cards are hybrids of citizen report cards and social audits, relying heavily on community monitoring to assess service quality and performance, as well as to negotiate with service providers remedies for any shortcomings. These monitoring tools have been effective in Africa and Asia at exposing corruption, building
70 Asian Development Outlook 2013 Update
awareness of entitlements, empowering people to claim their rights, and facilitating citizen engagement in service delivery (Joshi 2010, McGee and Gaventa 2010). However, their impact can be limited by the difficulty of identifying and involving poor and marginalized groups that live in remote areas, exercise little voice, and are easily excluded from empowering processes (Agarwal, Heltberg, and Diachok 2009, Chambers 1995). Institutional arrangements for redressing grievances and enforcing social accountability must be accompanied by effective citizen outreach to support information dissemination and awareness building.
Community participation Community participation typically addresses two major barriers to empowering citizens vis-à-vis the state and public service providers: Information is often lacking about what constitutes adequate quality in public services, and poor coordination and participation in monitoring may stop citizen-clients’ expressing their views, robbing them of voice.
The main factors affecting people’s willingness and ability to participate in service delivery is poor governance, especially inadequate rule of law, discrimination, and privileged patron–client relationships. A recent review of nearly 500 studies on participatory development by Mansuri and Rao (2012) suggests that the key to success is to distinguish between organic participation (participation spurred by civic groups) and induced or mandated participation (state efforts to promote participation). The success of either type depends on local capacity for collective action.
One challenge is how to ensure that the poor and marginalized get involved to promote their interests, even as they face a perennial risk of capture of benefits by more prominent elite community members (Chambers 1997, Cleaver 2001). To improve services, the state apparatus—including local government, the bureaucracy, and public service providers—must change the way it does business and become more user-friendly. Practical issues of institutional redesign and realigning incentives for service providers need to be addressed. This may sometimes require far-reaching civil service reform, which may include performance-based pay for civil servants and public service providers, as well as allowing local communities to sanction unsatisfactory civil servants such as teachers and health workers.
Engaging local government and the private sector National governments can compensate for their shortcomings in local knowledge, institutions, technical capacity, and fiscal resources by devolving to provincial and local governments responsibility for delivering public services. Another option—one that can augment limited capacity in local governments and bring social dynamism to service provision—is to collaborate with the private sector and civil society.
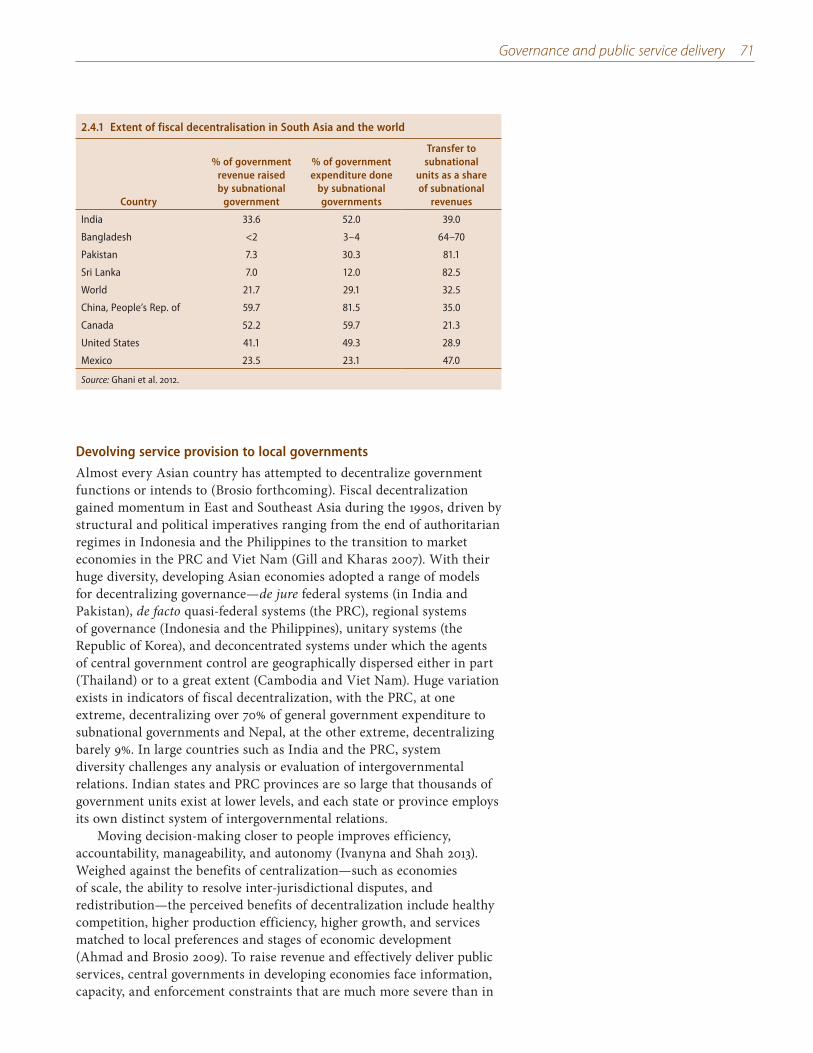
Governance and public service delivery 71
Devolving service provision to local governments
Almost every Asian country has attempted to decentralize government functions or intends to (Brosio forthcoming). Fiscal decentralization gained momentum in East and Southeast Asia during the 1990s, driven by structural and political imperatives ranging from the end of authoritarian regimes in Indonesia and the Philippines to the transition to market economies in the PRC and Viet Nam (Gill and Kharas 2007). With their huge diversity, developing Asian economies adopted a range of models for decentralizing governance—de jure federal systems (in India and Pakistan), de facto quasi-federal systems (the PRC), regional systems of governance (Indonesia and the Philippines), unitary systems (the Republic of Korea), and deconcentrated systems under which the agents of central government control are geographically dispersed either in part (Thailand) or to a great extent (Cambodia and Viet Nam). Huge variation exists in indicators of fiscal decentralization, with the PRC, at one extreme, decentralizing over 70% of general government expenditure to subnational governments and Nepal, at the other extreme, decentralizing barely 9%. In large countries such as India and the PRC, system diversity challenges any analysis or evaluation of intergovernmental relations. Indian states and PRC provinces are so large that thousands of government units exist at lower levels, and each state or province employs its own distinct system of intergovernmental relations.
Moving decision-making closer to people improves efficiency, accountability, manageability, and autonomy (Ivanyna and Shah 2013). Weighed against the benefits of centralization—such as economies of scale, the ability to resolve inter-jurisdictional disputes, and redistribution—the perceived benefits of decentralization include healthy competition, higher production efficiency, higher growth, and services matched to local preferences and stages of economic development (Ahmad and Brosio 2009). To raise revenue and effectively deliver public services, central governments in developing economies face information, capacity, and enforcement constraints that are much more severe than in
2.4.1 Extent of fiscal decentralisation in South Asia and the world
Country
% of government revenue raised by subnational
government
% of government expenditure done
by subnational governments
Transfer to subnational
units as a share of subnational
revenues
India 33.6 52.0 39.0
Bangladesh <2 3–4 64–70
Pakistan 7.3 30.3 81.1
Sri Lanka 7.0 12.0 82.5
World 21.7 29.1 32.5
China, People’s Rep. of 59.7 81.5 35.0
Canada 52.2 59.7 21.3
United States 41.1 49.3 28.9
Mexico 23.5 23.1 47.0
Source: Ghani et al. 2012.
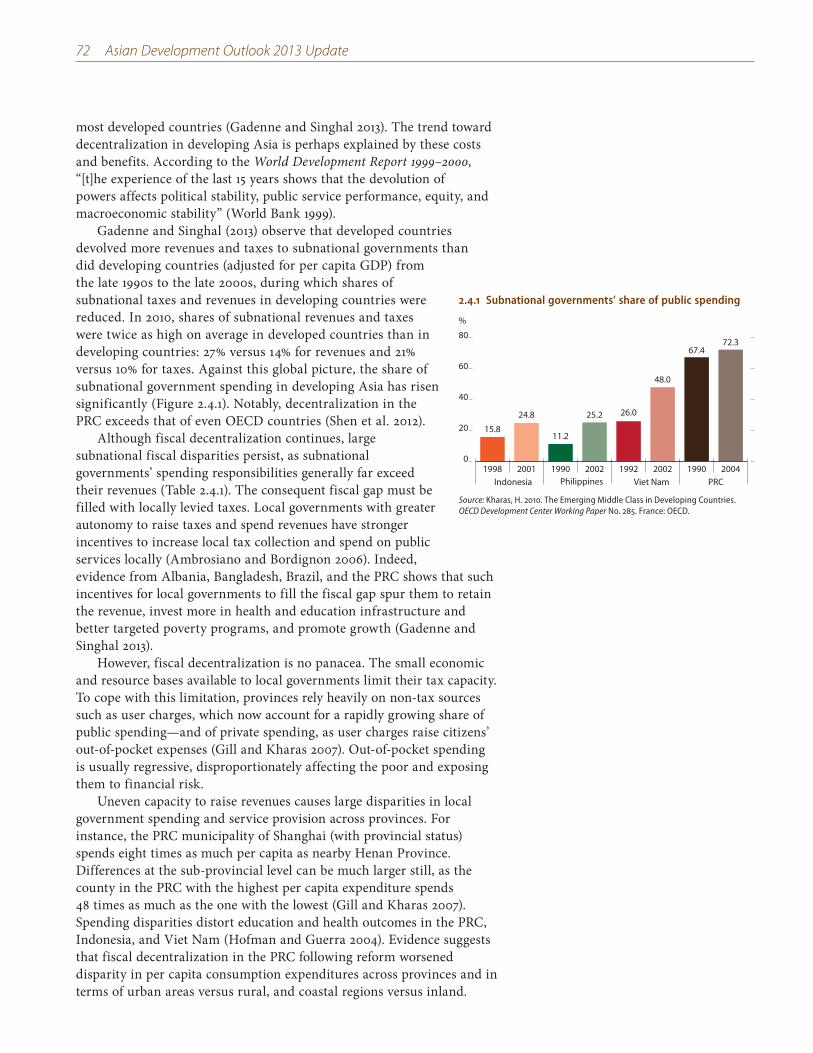
72 Asian Development Outlook 2013 Update
most developed countries (Gadenne and Singhal 2013). The trend toward decentralization in developing Asia is perhaps explained by these costs and benefits. According to the World Development Report 1999–2000, “[t]he experience of the last 15 years shows that the devolution of powers affects political stability, public service performance, equity, and macroeconomic stability” (World Bank 1999).
Gadenne and Singhal (2013) observe that developed countries devolved more revenues and taxes to subnational governments than did developing countries (adjusted for per capita GDP) from the late 1990s to the late 2000s, during which shares of subnational taxes and revenues in developing countries were reduced. In 2010, shares of subnational revenues and taxes were twice as high on average in developed countries than in developing countries: 27% versus 14% for revenues and 21% versus 10% for taxes. Against this global picture, the share of subnational government spending in developing Asia has risen significantly (Figure 2.4.1). Notably, decentralization in the PRC exceeds that of even OECD countries (Shen et al. 2012).
Although fiscal decentralization continues, large subnational fiscal disparities persist, as subnational governments’ spending responsibilities generally far exceed their revenues (Table 2.4.1). The consequent fiscal gap must be filled with locally levied taxes. Local governments with greater autonomy to raise taxes and spend revenues have stronger incentives to increase local tax collection and spend on public services locally (Ambrosiano and Bordignon 2006). Indeed, evidence from Albania, Bangladesh, Brazil, and the PRC shows that such incentives for local governments to fill the fiscal gap spur them to retain the revenue, invest more in health and education infrastructure and better targeted poverty programs, and promote growth (Gadenne and Singhal 2013).
However, fiscal decentralization is no panacea. The small economic and resource bases available to local governments limit their tax capacity. To cope with this limitation, provinces rely heavily on non-tax sources such as user charges, which now account for a rapidly growing share of public spending—and of private spending, as user charges raise citizens’ out-of-pocket expenses (Gill and Kharas 2007). Out-of-pocket spending is usually regressive, disproportionately affecting the poor and exposing them to financial risk.
Uneven capacity to raise revenues causes large disparities in local government spending and service provision across provinces. For instance, the PRC municipality of Shanghai (with provincial status) spends eight times as much per capita as nearby Henan Province. Differences at the sub-provincial level can be much larger still, as the county in the PRC with the highest per capita expenditure spends 48 times as much as the one with the lowest (Gill and Kharas 2007). Spending disparities distort education and health outcomes in the PRC, Indonesia, and Viet Nam (Hofman and Guerra 2004). Evidence suggests that fiscal decentralization in the PRC following reform worsened disparity in per capita consumption expenditures across provinces and in terms of urban areas versus rural, and coastal regions versus inland.
2.4.1 Subnational governments’ share of public spending
0
20
40
60
80
20041990200219922002199020011998Indonesia Viet NamPhilippines PRC
%
15.8
24.8
11.2
25.2 26.0
48.0
67.472.3
Source: Kharas, H. 2010. The Emerging Middle Class in Developing Countries. OECD Development Center Working Paper No. 285. France: OECD.
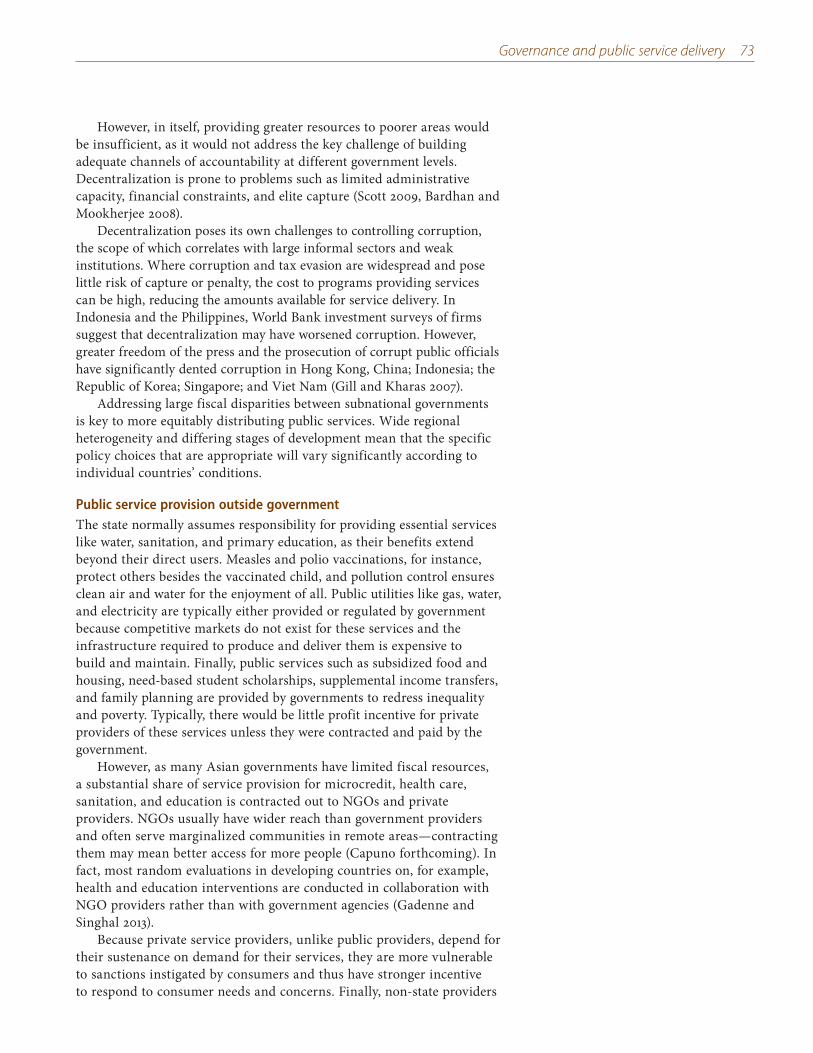
Governance and public service delivery 73
However, in itself, providing greater resources to poorer areas would be insufficient, as it would not address the key challenge of building adequate channels of accountability at different government levels. Decentralization is prone to problems such as limited administrative capacity, financial constraints, and elite capture (Scott 2009, Bardhan and Mookherjee 2008).
Decentralization poses its own challenges to controlling corruption, the scope of which correlates with large informal sectors and weak institutions. Where corruption and tax evasion are widespread and pose little risk of capture or penalty, the cost to programs providing services can be high, reducing the amounts available for service delivery. In Indonesia and the Philippines, World Bank investment surveys of firms suggest that decentralization may have worsened corruption. However, greater freedom of the press and the prosecution of corrupt public officials have significantly dented corruption in Hong Kong, China; Indonesia; the Republic of Korea; Singapore; and Viet Nam (Gill and Kharas 2007).
Addressing large fiscal disparities between subnational governments is key to more equitably distributing public services. Wide regional heterogeneity and differing stages of development mean that the specific policy choices that are appropriate will vary significantly according to individual countries’ conditions.
Public service provision outside government The state normally assumes responsibility for providing essential services like water, sanitation, and primary education, as their benefits extend beyond their direct users. Measles and polio vaccinations, for instance, protect others besides the vaccinated child, and pollution control ensures clean air and water for the enjoyment of all. Public utilities like gas, water, and electricity are typically either provided or regulated by government because competitive markets do not exist for these services and the infrastructure required to produce and deliver them is expensive to build and maintain. Finally, public services such as subsidized food and housing, need-based student scholarships, supplemental income transfers, and family planning are provided by governments to redress inequality and poverty. Typically, there would be little profit incentive for private providers of these services unless they were contracted and paid by the government.
However, as many Asian governments have limited fiscal resources, a substantial share of service provision for microcredit, health care, sanitation, and education is contracted out to NGOs and private providers. NGOs usually have wider reach than government providers and often serve marginalized communities in remote areas—contracting them may mean better access for more people (Capuno forthcoming). In fact, most random evaluations in developing countries on, for example, health and education interventions are conducted in collaboration with NGO providers rather than with government agencies (Gadenne and Singhal 2013).
Because private service providers, unlike public providers, depend for their sustenance on demand for their services, they are more vulnerable to sanctions instigated by consumers and thus have stronger incentive to respond to consumer needs and concerns. Finally, non-state providers
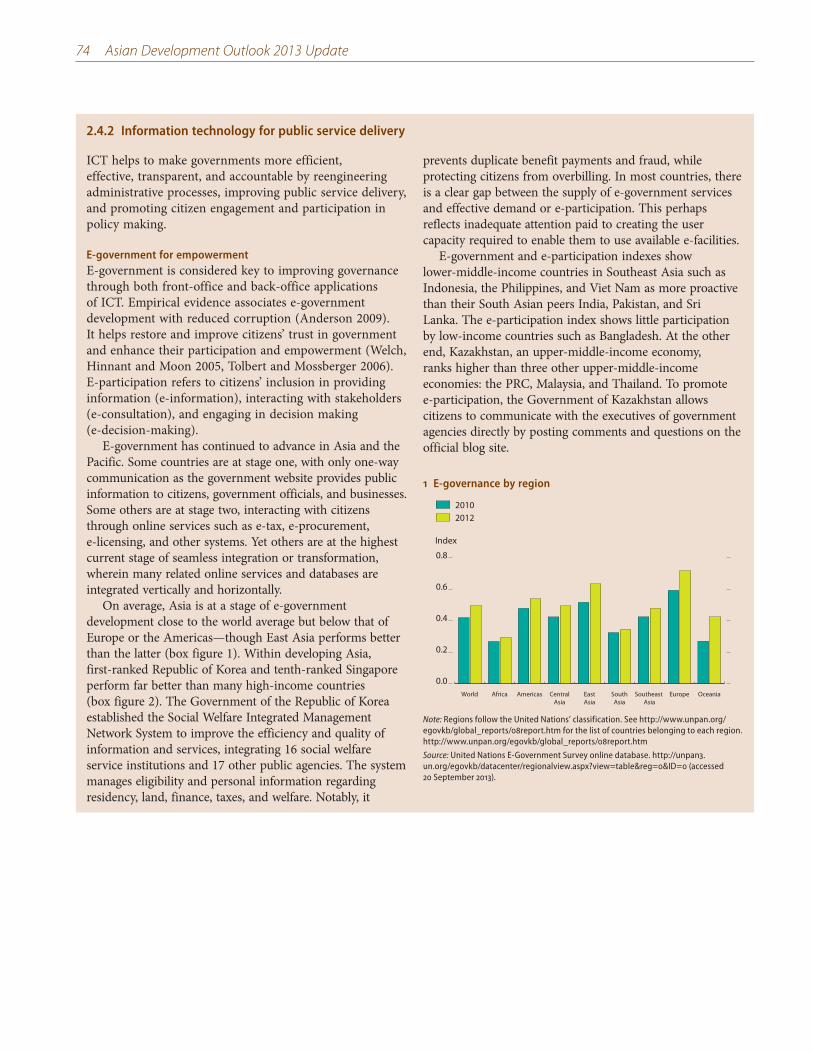
74 Asian Development Outlook 2013 Update
2.4.2 Information technology for public service delivery
ICT helps to make governments more efficient, effective, transparent, and accountable by reengineering administrative processes, improving public service delivery, and promoting citizen engagement and participation in policy making.
E-government for empowermentE-government is considered key to improving governance through both front-office and back-office applications of ICT. Empirical evidence associates e-government development with reduced corruption (Anderson 2009). It helps restore and improve citizens’ trust in government and enhance their participation and empowerment (Welch, Hinnant and Moon 2005, Tolbert and Mossberger 2006). E-participation refers to citizens’ inclusion in providing information (e-information), interacting with stakeholders (e-consultation), and engaging in decision making (e-decision-making).
E-government has continued to advance in Asia and the Pacific. Some countries are at stage one, with only one-way communication as the government website provides public information to citizens, government officials, and businesses. Some others are at stage two, interacting with citizens through online services such as e-tax, e-procurement, e-licensing, and other systems. Yet others are at the highest current stage of seamless integration or transformation, wherein many related online services and databases are integrated vertically and horizontally.
On average, Asia is at a stage of e-government development close to the world average but below that of Europe or the Americas—though East Asia performs better than the latter (box figure 1). Within developing Asia, first-ranked Republic of Korea and tenth-ranked Singapore perform far better than many high-income countries (box figure 2). The Government of the Republic of Korea established the Social Welfare Integrated Management Network System to improve the efficiency and quality of information and services, integrating 16 social welfare service institutions and 17 other public agencies. The system manages eligibility and personal information regarding residency, land, finance, taxes, and welfare. Notably, it
prevents duplicate benefit payments and fraud, while protecting citizens from overbilling. In most countries, there is a clear gap between the supply of e-government services and effective demand or e-participation. This perhaps reflects inadequate attention paid to creating the user capacity required to enable them to use available e-facilities.
E-government and e-participation indexes show lower-middle-income countries in Southeast Asia such as Indonesia, the Philippines, and Viet Nam as more proactive than their South Asian peers India, Pakistan, and Sri Lanka. The e-participation index shows little participation by low-income countries such as Bangladesh. At the other end, Kazakhstan, an upper-middle-income economy, ranks higher than three other upper-middle-income economies: the PRC, Malaysia, and Thailand. To promote e-participation, the Government of Kazakhstan allows citizens to communicate with the executives of government agencies directly by posting comments and questions on the official blog site.
1 E-governance by region
20122010
Index
0.0
0.2
0.4
0.6
0.8
OceaniaEuropeSoutheast Asia
SouthAsia
EastAsia
CentralAsia
AmericasAfricaWorld
Note: Regions follow the United Nations’ classification. See http://www.unpan.org/egovkb/global_reports/08report.htm for the list of countries belonging to each region. http://www.unpan.org/egovkb/global_reports/08report.htm
Source: United Nations E-Government Survey online database. http://unpan3.un.org/egovkb/datacenter/regionalview.aspx?view=table®=0&ID=0 (accessed 20 September 2013).
Governance and public service delivery 75
Matching local needs and capacity to maximize e-dividends Developing Asian economies need to optimize their use of ICT and maximize ICT dividends by matching various ICT technologies to local needs and local capacities. Countries should consider their technological, economic, human, and geographical factors when choosing appropriate ICT applications for local use. For example, mobile broadband is more economical and feasible than fixed lines for tackling tough geographical challenges such as reaching small communities in the mountains or on scattered islands. Such initiatives potentially provide effective instruments for public sector reform to make government more transparent, accountable, and participatory. They also serve as a springboard for ICT developments in other sectors by creating a more ICT-receptive institutional environment and stimulating ICT markets with government purchases of ICT devices, services, and infrastructure. National e-government initiatives need to be practical and strategic, incorporating ICT governance structure, financing mechanisms and procurement plans, and national and local e-government projects.
Prioritization is essential to make good use of limited resources in developing Asia. Governments should carefully prioritize various e-government services in conjunction with infrastructure development to maximize trickle-down benefits. A number of successful cases such as the Republic of Korea, Singapore, and Taipei,China demonstrate how strong e-government initiatives orchestrate the development of e-government services, public sector reform, and the development of ICT infrastructure in tandem, particularly at early stages. These cases suggest that governments’ strong involvement initially can very effectively advance public sector reform while developing ICT services and, more generally, advancing social and economic development.
Sources: ADB forthcoming; Anderson 2009; Welch et al. 2005; Tolbert and Mossberger 2006.
2 E-Government in selected Asian countries
E-Government indexE-Participation index
0.0
0.2
0.4
0.6
0.8
1.0
FSMFIJUZBKAZSRIPAKINDBANVIETHASINPHIMALINOKORPRC
Index
BAN = Bangladesh; FIJ = Fiji; FSM = Federated States of Micronesia ; IND = India; INO = Indonesia; KAZ = Kazakhstan; KOR = Republic of Korea; MAL = Malaysia; PAK = Pakistan; PHI = Philippines; PRC = People’s Republic of China; SIN = Singapore; SRI = Sri Lanka; THA = Thailand; UZB = Uzbekistan; VIE = Viet Nam.
Notes: The E-participation index assesses the quality and usefulness of information and services provided by a country for the purpose of engaging its citizens in public policy making through the use of e-government programs.
The E-government development index is a composite index comprising the web measure index, the telecommunication infrastructure index and the human capital index.
Source: United Nations E-Government Survey online database. http://unpan3.un.org/egovkb/datacenter/regionalview.aspx?view=table®=0&ID=0 (accessed 20 September 2013).
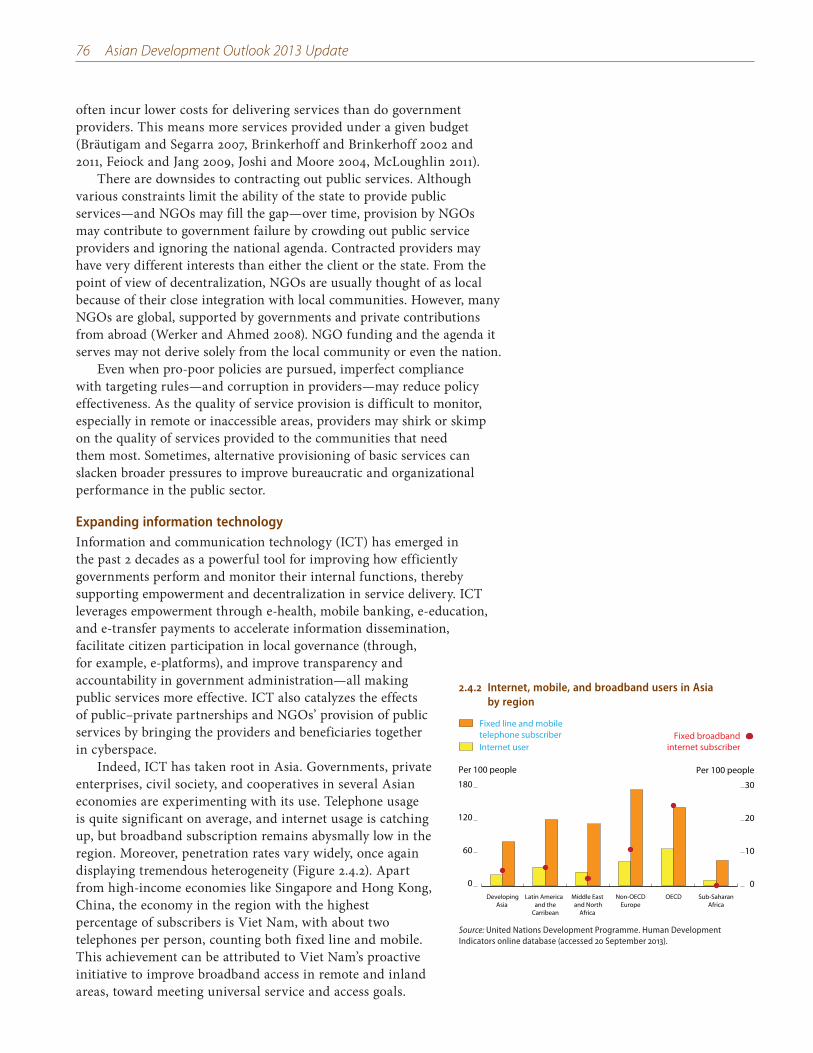
76 Asian Development Outlook 2013 Update
often incur lower costs for delivering services than do government providers. This means more services provided under a given budget (Bräutigam and Segarra 2007, Brinkerhoff and Brinkerhoff 2002 and 2011, Feiock and Jang 2009, Joshi and Moore 2004, McLoughlin 2011).
There are downsides to contracting out public services. Although various constraints limit the ability of the state to provide public services—and NGOs may fill the gap—over time, provision by NGOs may contribute to government failure by crowding out public service providers and ignoring the national agenda. Contracted providers may have very different interests than either the client or the state. From the point of view of decentralization, NGOs are usually thought of as local because of their close integration with local communities. However, many NGOs are global, supported by governments and private contributions from abroad (Werker and Ahmed 2008). NGO funding and the agenda it serves may not derive solely from the local community or even the nation.
Even when pro-poor policies are pursued, imperfect compliance with targeting rules—and corruption in providers—may reduce policy effectiveness. As the quality of service provision is difficult to monitor, especially in remote or inaccessible areas, providers may shirk or skimp on the quality of services provided to the communities that need them most. Sometimes, alternative provisioning of basic services can slacken broader pressures to improve bureaucratic and organizational performance in the public sector.
Expanding information technology Information and communication technology (ICT) has emerged in the past 2 decades as a powerful tool for improving how efficiently governments perform and monitor their internal functions, thereby supporting empowerment and decentralization in service delivery. ICT leverages empowerment through e-health, mobile banking, e-education, and e-transfer payments to accelerate information dissemination, facilitate citizen participation in local governance (through, for example, e-platforms), and improve transparency and accountability in government administration—all making public services more effective. ICT also catalyzes the effects of public–private partnerships and NGOs’ provision of public services by bringing the providers and beneficiaries together in cyberspace.
Indeed, ICT has taken root in Asia. Governments, private enterprises, civil society, and cooperatives in several Asian economies are experimenting with its use. Telephone usage is quite significant on average, and internet usage is catching up, but broadband subscription remains abysmally low in the region. Moreover, penetration rates vary widely, once again displaying tremendous heterogeneity (Figure 2.4.2). Apart from high-income economies like Singapore and Hong Kong, China, the economy in the region with the highest percentage of subscribers is Viet Nam, with about two telephones per person, counting both fixed line and mobile. This achievement can be attributed to Viet Nam’s proactive initiative to improve broadband access in remote and inland areas, toward meeting universal service and access goals.
2.4.2 Internet, mobile, and broadband users in Asia by region
0
10
20
30
0
60
120
180
DevelopingAsia
Latin America and the
Carribean
Middle East and North
Africa
Non-OECDEurope
OECD Sub-SaharanAfrica
Per 100 peoplePer 100 people
Internet user
Fixed line and mobiletelephone subscriber Fixed broadband
internet subscriber
Source: United Nations Development Programme. Human Development Indicators online database (accessed 20 September 2013).
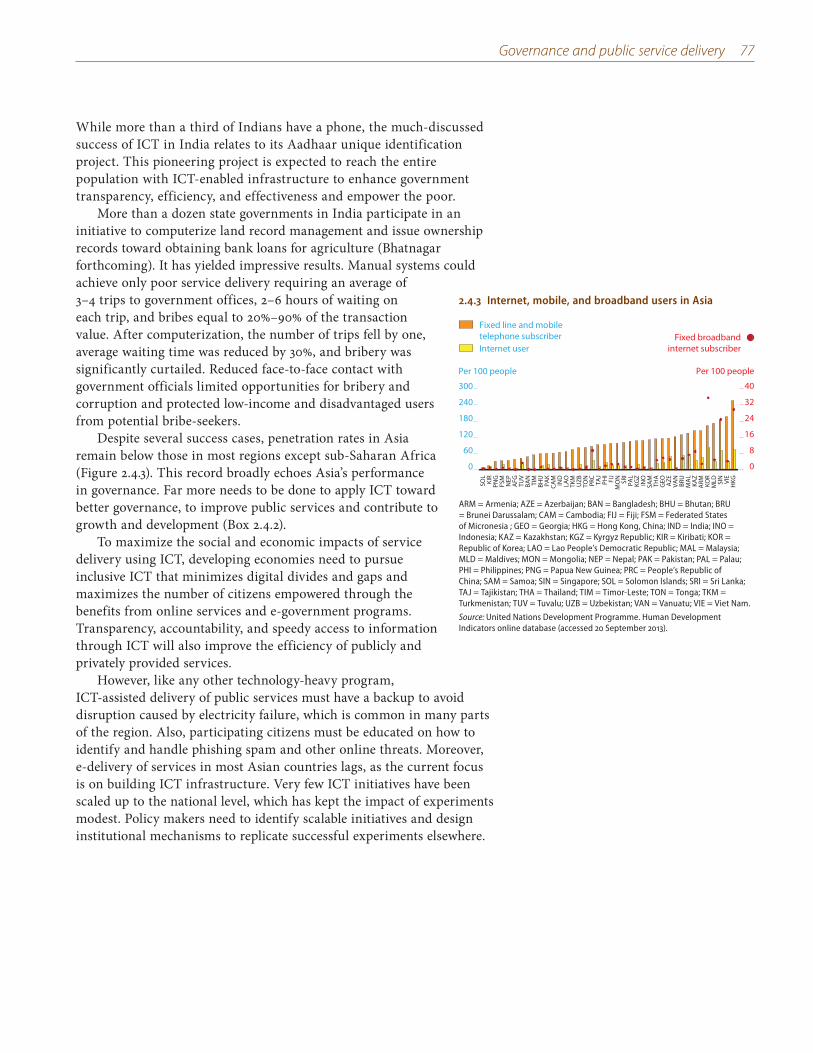
Governance and public service delivery 77
While more than a third of Indians have a phone, the much-discussed success of ICT in India relates to its Aadhaar unique identification project. This pioneering project is expected to reach the entire population with ICT-enabled infrastructure to enhance government transparency, efficiency, and effectiveness and empower the poor.
More than a dozen state governments in India participate in an initiative to computerize land record management and issue ownership records toward obtaining bank loans for agriculture (Bhatnagar forthcoming). It has yielded impressive results. Manual systems could achieve only poor service delivery requiring an average of 3–4 trips to government offices, 2–6 hours of waiting on each trip, and bribes equal to 20%–90% of the transaction value. After computerization, the number of trips fell by one, average waiting time was reduced by 30%, and bribery was significantly curtailed. Reduced face-to-face contact with government officials limited opportunities for bribery and corruption and protected low-income and disadvantaged users from potential bribe-seekers.
Despite several success cases, penetration rates in Asia remain below those in most regions except sub-Saharan Africa (Figure 2.4.3). This record broadly echoes Asia’s performance in governance. Far more needs to be done to apply ICT toward better governance, to improve public services and contribute to growth and development (Box 2.4.2).
To maximize the social and economic impacts of service delivery using ICT, developing economies need to pursue inclusive ICT that minimizes digital divides and gaps and maximizes the number of citizens empowered through the benefits from online services and e-government programs. Transparency, accountability, and speedy access to information through ICT will also improve the efficiency of publicly and privately provided services.
However, like any other technology-heavy program, ICT-assisted delivery of public services must have a backup to avoid disruption caused by electricity failure, which is common in many parts of the region. Also, participating citizens must be educated on how to identify and handle phishing spam and other online threats. Moreover, e-delivery of services in most Asian countries lags, as the current focus is on building ICT infrastructure. Very few ICT initiatives have been scaled up to the national level, which has kept the impact of experiments modest. Policy makers need to identify scalable initiatives and design institutional mechanisms to replicate successful experiments elsewhere.
2.4.3 Internet, mobile, and broadband users in Asia
0
8
16
24
32
40
0
60
120
180
240
300
SOL
KIR
PNG
FSM
NEP
AFG TU
VBA
NTI
MBH
UPA
KCA
MIN
DLA
OTK
MU
ZBTO
NPR
CTA
JPH
IFI
JM
ON
SRI
PAL
KGZ
INO
SAM
THA
GEO AZE
VAN
BRU
MA
LKA
ZA
RM KOR
MLD SI
NVI
EH
KG
Per 100 peoplePer 100 people
Internet user
Fixed line and mobiletelephone subscriber Fixed broadband
internet subscriber
ARM = Armenia; AZE = Azerbaijan; BAN = Bangladesh; BHU = Bhutan; BRU = Brunei Darussalam; CAM = Cambodia; FIJ = Fiji; FSM = Federated States of Micronesia ; GEO = Georgia; HKG = Hong Kong, China; IND = India; INO = Indonesia; KAZ = Kazakhstan; KGZ = Kyrgyz Republic; KIR = Kiribati; KOR = Republic of Korea; LAO = Lao People’s Democratic Republic; MAL = Malaysia; MLD = Maldives; MON = Mongolia; NEP = Nepal; PAK = Pakistan; PAL = Palau; PHI = Philippines; PNG = Papua New Guinea; PRC = People’s Republic of China; SAM = Samoa; SIN = Singapore; SOL = Solomon Islands; SRI = Sri Lanka; TAJ = Tajikistan; THA = Thailand; TIM = Timor-Leste; TON = Tonga; TKM = Turkmenistan; TUV = Tuvalu; UZB = Uzbekistan; VAN = Vanuatu; VIE = Viet Nam.
Source: United Nations Development Programme. Human Development Indicators online database (accessed 20 September 2013).
78 Asian Development Outlook 2013 Update
Moving forward on governance reform
Empirical analysis reported here shows that governance matters for growth and development. Yet, despite its phenomenal economic growth and rapid gains relative to advanced economies, Asia has seen less progress in closing the governance gap. The World Bank’s perception-based World Governance Indicators in 2011 place developing Asia below the OECD and Latin America in all areas measured. Accounting for income differences improves the region’s global ranking somewhat, but Asia still lags these regions on controlling corruption, regulatory quality, and voice. Within Asia, large differences in governance performance exist across subregions and between countries. East Asia performs better on government effectiveness, regulatory quality, and the rule of law, but lags on voice. Political stability and regulatory quality are the key issues for South Asia, where voice is stronger.
A tailored approach to governance reformBetter governance seems to influence economic growth in Asia more than it does social development indicators. This can be expected as social changes often bear fruit only slowly. Better education and health systems may take a generation to register as higher educational attainment and better health. The importance of various elements of governance depends on the constraints countries face and their social and historical backgrounds.
Governments therefore need to prioritize those components of governance that hold back development. For low-income countries, priorities are likely to be strengthening government effectiveness through, for example, civil service reform; improving regulatory quality and the rule of law; scaling up corruption control; and improving the quality of public services. These improvements can provide entry points for wider governance reform and accelerate the attainment of middle-income status. Middle-income economies, for their part, must look to the experience of advanced economies. Maintaining an environment conducive to growth remains important for them, but policies must also acknowledge people’s rising aspirations and demands for a better quality of life. People with higher incomes demand from their governments greater transparency, participation, and accountability.
Governance and public service delivery 79
Public service delivery focus for improving governanceIn Asia, most people judge the quality of governance through their experience of public service delivery, such as the quality of social services and infrastructure. Governance may be a broad concept, but it distils to public service delivery in the eyes of most ordinary people as they decide whether or not their government is doing its job. Improved public service delivery can create momentum for broader governance reform later on. Because public services are particularly important to the poor, effective delivery is central to making economic growth more inclusive.
Despite significant improvements already achieved in developing Asia, many countries lag in both the quantity and quality of essential services provided. This hinders development and growth. In many Asian countries, the reading, math, and science skills of elementary and middle-school children remain subpar. In addition, the massive infrastructure deficit across much of the region stunts development, leaving about one-fifth of Asians—over half the population in some countries—without electricity (ADB 2013a).
Weak governance is often to blame for public service failures. Corruption and the lack of transparency in service delivery attract the most attention. To access health, education, electricity, water, and other vital social services, people must navigate an obstacle course of corruption that includes bribes, favoritism and discrimination, theft and other diversion of public resources, and elite capture. The poor and marginalized are particularly vulnerable, as they can afford neither to pay bribes nor to acquire services through private providers. Long waiting lines impose heavy opportunity costs. Ensuring the effective delivery of public services is thus crucial to drawing Asia’s poor into the economic growth and development process.
While a multipronged strategy is required to improve public services, case studies and experimental evidence show that quality improves when those using public services have a voice in their provision. In several Asian countries, a complementary set of mechanisms—the “three Es” as described in the previous section—improve public services. Empowering citizens, engaging local governments and the private sector, and expanding the use of ICT can be effective if policy makers recognize the limitations of each mechanism and use them according to their strengths, rather than haphazardly.
Empowering citizens—giving them basic human rights and the chance to participate in and monitor public service delivery—generates the dynamism needed to make service providers accountable. Some Asian countries have established public services as human rights. At the same time, low-income countries, and those with high fiscal deficits, must be careful to ensure that entitlements do not sap resources for future development.
Engaging local governments and the private sector can expand the scope and scale of public services and their delivery. Decentralization helps by relieving central authorities of more responsibility and by adjusting service delivery to local needs. Experience shows that devolving powers improves macroeconomic and political stability, public service
80 Asian Development Outlook 2013 Update
performance, and equity. However, local governments must have the institutional capacity to effectively take on responsibility. And they must balance their higher spending responsibilities with their limited authority to levy taxes.
Where public resources are scarce and private service providers competitive, hybrid arrangements such as partnering with private firms and NGOs can provide services and incentives to innovate and to monitor and contain costs. Involving private providers must be complemented, however, by appropriate government regulation and monitoring of service quality.
Expanding ICT use can improve public service provision and delivery by strengthening both demand and supply—whether e-governance for online requests, registration, and applications, or for delivery through identification cards or ATM banking. ICT improves access to information, transparency in government processes and procedures, and the accountability of public officials, while squelching opportunities for corruption. However, ICT often requires large investments up front and the provision of technical training to ensure enough technical literacy in the general population for broad consumer access with adequate protection from online scams.
The three Es enjoy great synergies with ICT boosting the other two mechanisms: ICT supports empowerment and decentralization. It not only provides effective mechanisms for delivery, but also mitigates their unintended consequences by boosting access to information, as well as transparency and accountability. Empowerment and decentralization generate in turn greater demand for ICT. Therefore, when designing a package of the 3Es’ to improve public service delivery, ICT use should rank high.
The three mechanisms will help improve public service delivery through better governance, thus creating a base for broader governance reform, which is critical to sustaining economic growth and reducing poverty. Good governance remains a cornerstone of sound development. Developing Asia has reached the point where reinforcing governance can no longer be delayed. Fortunately, Asia’s leaders recognize this and are stepping up efforts to build public confidence through policy reform and action. Anticorruption initiatives have flourished in response to public demand (Box 2.5.1). While progress is commendable, the road to good governance is long and strewn with obstacles. Overcoming them may be a challenge, but the payoff to development will be huge.
Governance and public service delivery 81
2.5.1 Recent anticorruption initiatives in Asia and the Pacific
It is clear that the cost of corruption can be very high. The World Economic Forum estimates that corruption costs the equivalent of more than 5% of global gross domestic product (GDP), and International Monetary Fund research shows that investment in countries deemed corrupt is 5% less than in countries that are relatively free of corruption (OECD 2013). The World Bank estimates that $1 trillion is paid in bribes globally each year (World Bank 2013b). Corruption hampers not only investment and growth, but also poverty reduction and equitable income distribution. Studies show child and infant mortality rates 30%–50% higher in countries with prevalent corruption than in those with corruption under better control. Student drop-out rates are five times higher (Gupta et al. 2002).
More and more countries in Asia and the Pacific are responding by stepping up anticorruption efforts. Most have ratified the United Nations Convention against Corruption. In many countries, fighting corruption ranks high on the agenda of top political leaders. In the PRC, fighting corruption is a policy centerpiece of the new leadership. The current governments of Indonesia and the Philippines campaigned on strong anticorruption platforms.
Boosting the integrity and transparency of the public sector, and of elected officials, has been a keystone of anticorruption initiatives in Asia in recent years (ADB and OECD 2006). Policies and reforms have been introduced to identify and discourage corruption committed by institutions or individuals, make decision-making and budgeting more transparent, limit official discretion, and strengthen safeguards. Several countries have introduced social accountability mechanisms that expose corruption, empower people to claim their rights, and facilitate engagement—mechanisms such as citizen report cards, community score cards, social audits, and grievance redress systems. Key to success is the use of modern information technology for e-governance, which squelches opportunities for rent-seeking in routine administrative procedures. Yet implementation and enforcement are huge challenges.
Anticorruption legislation and its enforcement have improved. Some countries, such as Bangladesh and Indonesia, have embedded individual reform projects in long-term anticorruption strategies. Many countries have legislated enabling laws and taken steps to ensure compliance with international standards. Provisions have been added to other laws to punish any activities that smell of corruption. The PRC, the Republic of Korea, Singapore, and Taipei,China all have laws criminalizing bribery. Several countries, including Bhutan, Cambodia, India, Indonesia, Mongolia, and the Philippines, have
recently strengthened their legal regimes for combating money laundering and the financing of terrorism.
Legal procedures addressing corruption have been strengthened, as have efforts to detect and investigate corruption. Many jurisdictions have established dedicated anticorruption agencies, including Bhutan; Hong Kong, China; Indonesia; Malaysia; Taipei,China; Thailand; and Timor-Leste. This year, Indonesia’s Corruption Eradication Commission received the prestigious Ramon Magsaysay Award. The PRC has established a 24-hour corruption hotline, and many countries—India, Malaysia, the Philippines, and the Republic of Korea—recently introduced witness protection programs or whistleblower protection laws.
The role of civil society in fighting corruption is increasingly recognized, and many governments have entered into partnerships with civil society organizations to run advocacy programs, information campaigns, and other dissemination activities. In some countries, governments have targeted youngsters, teaching them early on about the perils of corruption and what they can do about it. These are encouraging developments, but much remains to be done. Civil society’s involvement must be clearly defined and institutionalized.
Engaging the private sector is critical to a successful fight against corruption. Private sector corruption comes in various forms, such as corporate fraud, account manipulation, bribery, and insider trading. Government efforts to prevent corruption in the private sector have so far received less attention than such efforts in the public sector in developing Asia and the Pacific. Where government initiatives have lagged, however, the private sector is taking up the slack to show its willingness to root out corruption.
While progress is encouraging, developing Asia’s fight against corruption is only just setting out on what will be a long journey. Legal frameworks need to be tightened and gaps filled. Implementation and enforcement must be intensified. Coordination and cooperation among stakeholders—internally and externally—should be developed and enhanced. Public awareness and support for anticorruption efforts should be enhanced to bring the fight against corruption before the whole community. Knowledge, skills, and expertise should be sharpened so that those in charge will be able to perform their duties well. More than ever, the momentum to combat corruption must be sustained.
Sources: ADB and OECD 2006; ADB and OECD 2010; Gupta, Davoodi, and Tiongson 2002; OECD 2013; World Bank 2013b.
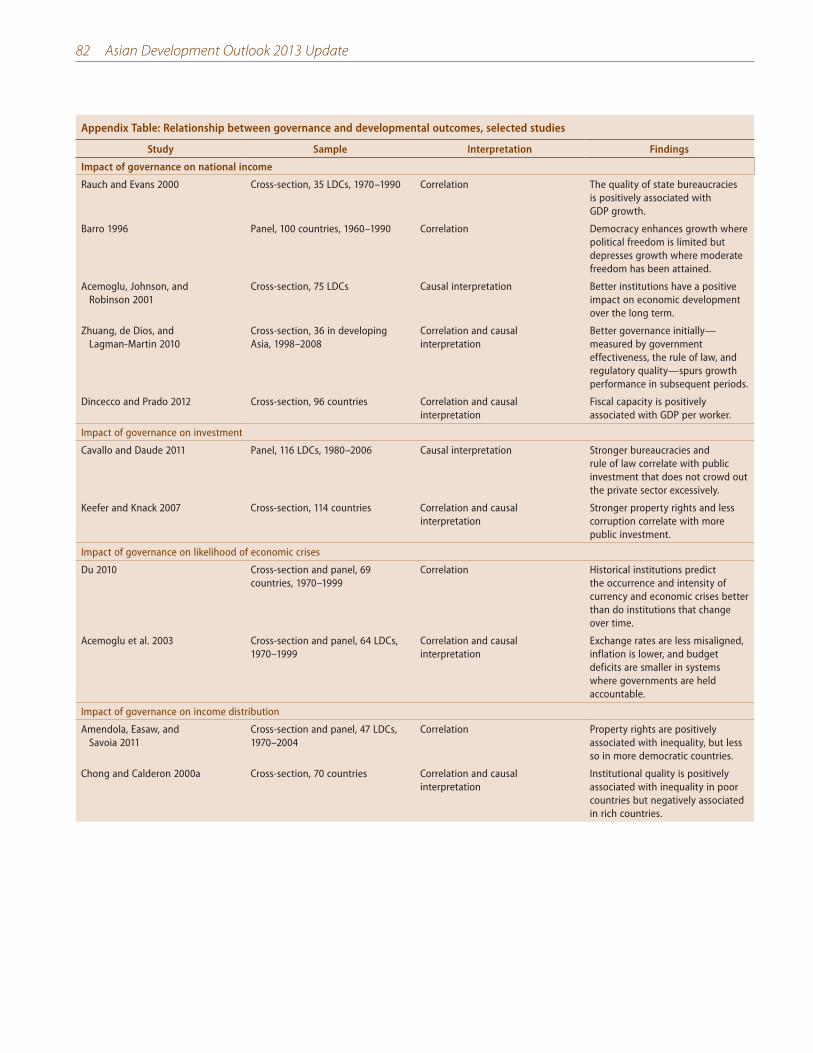
82 Asian Development Outlook 2013 Update
Appendix Table: Relationship between governance and developmental outcomes, selected studies
Study Sample Interpretation Findings
Impact of governance on national income
Rauch and Evans 2000 Cross-section, 35 LDCs, 1970–1990 Correlation The quality of state bureaucracies is positively associated with GDP growth.
Barro 1996 Panel, 100 countries, 1960–1990 Correlation Democracy enhances growth where political freedom is limited but depresses growth where moderate freedom has been attained.
Acemoglu, Johnson, and Robinson 2001
Cross-section, 75 LDCs Causal interpretation Better institutions have a positive impact on economic development over the long term.
Zhuang, de Dios, and Lagman-Martin 2010
Cross-section, 36 in developing Asia, 1998–2008
Correlation and causal interpretation
Better governance initially—measured by government effectiveness, the rule of law, and regulatory quality—spurs growth performance in subsequent periods.
Dincecco and Prado 2012 Cross-section, 96 countries Correlation and causal interpretation
Fiscal capacity is positively associated with GDP per worker.
Impact of governance on investment
Cavallo and Daude 2011 Panel, 116 LDCs, 1980–2006 Causal interpretation Stronger bureaucracies and rule of law correlate with public investment that does not crowd out the private sector excessively.
Keefer and Knack 2007 Cross-section, 114 countries Correlation and causal interpretation
Stronger property rights and less corruption correlate with more public investment.
Impact of governance on likelihood of economic crises
Du 2010 Cross-section and panel, 69 countries, 1970–1999
Correlation Historical institutions predict the occurrence and intensity of currency and economic crises better than do institutions that change over time.
Acemoglu et al. 2003 Cross-section and panel, 64 LDCs, 1970–1999
Correlation and causal interpretation
Exchange rates are less misaligned, inflation is lower, and budget deficits are smaller in systems where governments are held accountable.
Impact of governance on income distribution
Amendola, Easaw, and Savoia 2011
Cross-section and panel, 47 LDCs, 1970–2004
Correlation Property rights are positively associated with inequality, but less so in more democratic countries.
Chong and Calderon 2000a Cross-section, 70 countries Correlation and causal interpretation
Institutional quality is positively associated with inequality in poor countries but negatively associated in rich countries.
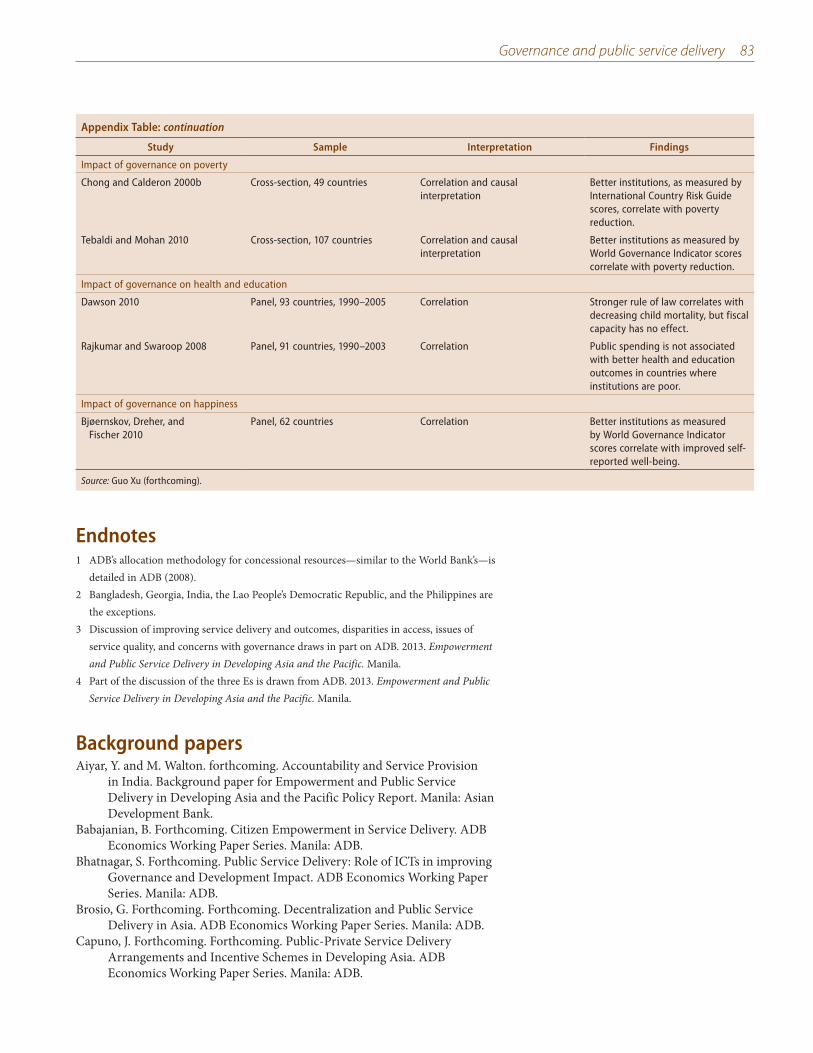
Governance and public service delivery 83
Endnotes1 ADB’s allocation methodology for concessional resources—similar to the World Bank’s—is
detailed in ADB (2008).2 Bangladesh, Georgia, India, the Lao People’s Democratic Republic, and the Philippines are
the exceptions.3 Discussion of improving service delivery and outcomes, disparities in access, issues of
service quality, and concerns with governance draws in part on ADB. 2013. Empowerment and Public Service Delivery in Developing Asia and the Pacific. Manila.
4 Part of the discussion of the three Es is drawn from ADB. 2013. Empowerment and Public Service Delivery in Developing Asia and the Pacific. Manila.
Background papersAiyar, Y. and M. Walton. forthcoming. Accountability and Service Provision
in India. Background paper for Empowerment and Public Service Delivery in Developing Asia and the Pacific Policy Report. Manila: Asian Development Bank.
Babajanian, B. Forthcoming. Citizen Empowerment in Service Delivery. ADB Economics Working Paper Series. Manila: ADB.
Bhatnagar, S. Forthcoming. Public Service Delivery: Role of ICTs in improving Governance and Development Impact. ADB Economics Working Paper Series. Manila: ADB.
Brosio, G. Forthcoming. Forthcoming. Decentralization and Public Service Delivery in Asia. ADB Economics Working Paper Series. Manila: ADB.
Capuno, J. Forthcoming. Forthcoming. Public-Private Service Delivery Arrangements and Incentive Schemes in Developing Asia. ADB Economics Working Paper Series. Manila: ADB.
Appendix Table: continuation
Study Sample Interpretation Findings
Impact of governance on poverty
Chong and Calderon 2000b Cross-section, 49 countries Correlation and causal interpretation
Better institutions, as measured by International Country Risk Guide scores, correlate with poverty reduction.
Tebaldi and Mohan 2010 Cross-section, 107 countries Correlation and causal interpretation
Better institutions as measured by World Governance Indicator scores correlate with poverty reduction.
Impact of governance on health and education
Dawson 2010 Panel, 93 countries, 1990–2005 Correlation Stronger rule of law correlates with decreasing child mortality, but fiscal capacity has no effect.
Rajkumar and Swaroop 2008 Panel, 91 countries, 1990–2003 Correlation Public spending is not associated with better health and education outcomes in countries where institutions are poor.
Impact of governance on happiness
Bjøernskov, Dreher, and Fischer 2010
Panel, 62 countries Correlation Better institutions as measured by World Governance Indicator scores correlate with improved self-reported well-being.
Source: Guo Xu (forthcoming).
84 Asian Development Outlook 2013 Update
Guo, X. Forthcoming. Development through Empowerment: Delivering Effective Public Services. ADB Economics Working Paper Series. Manila: ADB.
Han, X., H. Khan, and J. Zhuang. Forthcoming. Do Governance Indicators Explain Development Performance: A Cross-Country Analysis. ADB Economics Working Paper Series. Manila: ADB.
Lavado, R. and G. Domingo. Forthcoming. Publice Service Spending: Efficiency and Distributional Impact—Lessons from Asia. ADB Economics Working Paper Series. Manila: ADB.
Pradhan, M. Forthcoming. Teacher Incentives or motivation? The effect of teacher management on student learning in Indonesia. ADB Economics Working Paper Series. Manila: ADB.
Quibria, M. Forthcoming. Governance and Developing Asia, Concepts, Measurements, Determinants and Paradoxes. ADB Economics Working Paper Series. Manila: ADB.
Sen, K. Forthcoming. Governance and Development Outcomes in Asia. ADB Economics Working Paper Series. Manila: ADB.
ReferencesAcemoglu, D. and J. Robinson. 2006. Economic Origins of Dictatorship and
Democracy. New York: Cambridge University Press. _____. 2012. Why Nations Fail: The Origins of Power, Prosperity and Poverty.
New York: Crown Publishers.Acemoglu, D., S. Johnson, and J.A. Robinson. 2001. The Colonial Origins of
Comparative Development. American Economic Review. 91(5). pp.1369–1401.
Acemoglu,D., et al. 2003. Institutional Causes, Macroeconomic Symptoms: Volatility, Crises, and Growth. Journal of Monetary Economics. 50(1). pp.49–123.
Agarwal, S., R. Heltberg, and M. Diachok. 2009. Scaling Up Social Accountability in World Bank Operations. Washington, DC: World Bank.
Ahmad, E. and Brosio, G. 2009. Decentralization and Local Service Provision: What Do We Know? Asia Research Center Working Paper No. 27. London: London School of Economics and Political Science. www.lse.ac.uk/asiaResearchCentre/_files/ARCWP27-AhmadBrosio.pdf
Akram, M. and F. Khan. 2007. Health Care Services and Government Spending in Pakistan. PIDE Working Papers No. 32. Islamabad: Pakistan Institute of Development Economics.
Ambrosiano, Flavia and Massimo Bordignon. 2006. Normative versus positive theories of revenue assignments. In Ahmad, Ehtisham and Giorgio Brosio (eds.). 2006 Handbook of Fiscal Federalism. Edward Elgar.
Anderson, T. (2009) E-government as an Anti-corruption Strategy. Information Economics and Policy. 21(3). pp. 201–210.
ASER Centre. 2011. Annual Status of Education Report India. http://www.pratham.org/M-19-3-ASER.aspx
Amendola, A., J. Easaw, and A. Savoia. 2013. Inequality in Developing Economies: The Role of Institutional Development. Public Choice. 155(1). pp. 43–60.
Asian Development Bank (ADB). 2013a. Empowerment and Public Service Delivery in Developing Asia and the Pacific. Manila.
_____. 2013b. Key Indicators for Asia and the Pacific 2013. Manila._____. 2012. Confronting Rising Inequality in Asia. Asian Development
Outlook. Manila._____. 2008. Refining the Performance-Based Allocation of Asian Development
Fund Resources. Manila.
Governance and public service delivery 85
_____. Forthcoming. Leveraging the Knowledge Based Economy for the Future of Asian Developing Economies. Manila.
Asian Development Bank (ADB) and Organisation for Economic Co-operation and Development (OECD). 2006. Anti-Corruption Policies in Asia and the Pacific: Progress in Legal and Institutional Reform in 25 Countries. Manila: ADB.
_____. 2010. The Criminalisation of Bribery in Asia and the Pacific. Manila._____. 2012. Compilation of Written Reports by Steering Group Members
on Recent Developments and Activities. Ha Noi, Viet Nam.www.oecd.org/site/adboecdanti-corruptioninitiative/meetingsandconferences/SG17StepsTakentoImplementAnti-CorruptionPlan&UNCAC.pdf
Banerjee, A., A. Deaton, and E. Duflo. 2004. Wealth, Health, and Health Services in Rural Rajasthan. American Economic Review. 94 (2). pp. 326–330.
Banerjee, A., R. Hanna, and S. Mullainathan. 2012. Corruption. NBER Working Paper. No. 17968. Cambridge, MA: National Bureau of Economic Research (NBER).
Bardhan, P. 2008. Democracy and Distributive Politics in India. In I. Shapiro, P. A. Swenson, and D. Donno, eds. Divide and Deal: The Politics of Distribution in Democracies. New York and London: New York University Press.
Bardhan, P. and Dilip Mookherjee. 2008. Decentralization, Corruption And Government Accountability: An Overview. In Susan Rose-Ackerman (ed) Handbook of Economic Corruption. Edward Elgar.
Barro, R. 1996. Democracy and Growth. Journal of Economic Growth, 1(1). pp. 1–27.
Barro, R. 1991. Economic Growth in a Cross-section of Countries. Quarterly Journal of Economics. 106(2):407−43.
Barro, R. and X. Sala-i-Martin. 1995. Economic Growth. New York: McGraw-Hill.
Bjøernskov, C., A. Dreher, and J. Fischer. 2010. Formal Institutions and Subjective Well-Being: Revisiting the Cross-Country Evidence. European Journal of Political Economy. 26(4), p.p 419–430.
Bräutigam, D. and M. Segarra. 2007. Difficult Partnerships: The World Bank, States, and NGOs. Latin American Politics and Society. 49(4). pp.149–81.
Brinkerhoff, J. and D. Brinkerhoff. 2002. Government-Nonprofit Relations in Comparative Perspective. Evolution, Themes and New Directions. Public Administration and Development. 22. pp.2–18.
Brinkerhoff, D. W. and Brinkerhoff, J. M. 2011. Public–private partnerships: Perspectives on purposes, publicness, and good governance. Public Administration and Development 31:2-14. DOI:10.1002/pad.584.
Cai, Y. 2010. Collective resistance in China: Why popular protests succeed or fail. Stanford, CA: Stanford University Press.
Cavallo, E. and C. Daude. 2011. Public Investment In Developing Countries: A Blessing Or A Curse? Journal of Comparative Economics. 39(1). pp. 65–81.
Chambers, R. 1995. Paradigm Shifts and the Practice of Participatory Research and Development. In N. Nelson and S. Wright (eds.). Power and Participatory Development. London: Intermediate Technology Publications.
Chambers, R. 1997. Whose Reality Counts? Putting the First Last. London: Intermediate Technology Publications.
Chaudhury, N. and J. Hammer. 2004. Ghost Doctors: Absenteeism in Rural Bangladeshi Health Facilities. World Bank Economic Review. 18(3). pp. 423–441.
86 Asian Development Outlook 2013 Update
Chaudhury, N., et al. 2006. Missing in Action: Teacher and Health Worker Absence in Developing Countries. Journal of Economic Perspectives. 20(1). pp. 91–116.
Chong, A. and C. Calderona. 2000. Causality and Feedback between Institutional Measures and Economic Growth. Economics and Politics. 12(1). pp. 69–82.
_____. 2000b. Institutional Quality and Income Distribution. Economic Development and Cultural Change. 48(4). pp. 761–786.
Cleaver, F. 2001 Institutions, Agency and the Limitations of Participatory Approaches to Development. In Cooke, B. & U. Kothari, eds. Participation: The New Tyranny?, London-New York :Zed Books Ltd.
Das, J. and J. Hammer. 2004. Which Doctor? Combining Vignettes and Item Response to Measure Doctor Quality. World Bank Policy Research Paper No. 3301. Washington, DC: World Bank. http://elibrary.worldbank.org/docserver/download/3301.pdf?expires=1379295549&id=id&accname=guest&checksum=C4AE0375AB13380752BD001804ED0234
Dawson A. 2010. State Capacity and the Political Economy of Child Mortality in Developing Countries Revisited: From Fiscal Sociology towards the Rule of Law. International Journal of Comparative Sociology. 51(6). pp. 403–422.
Dincecco, M. and M. Prado. 2012. Warfare, Fiscal Capacity, and Performance. Journal of Economic Growth. 17(3). pp. 171–203.
Du, J. 2010. Institutional Quality and Economic Crisis: Legal Origin Theory Versus Colonial Strategy Theory. Review of Economics and Statistics. 92(1). pp. 173–179.
European Bank for Reconstruction and Development. 2011. Life in Transition Survey II. http://www.ebrd.com/downloads/research/surveys/LiTS2ed.pdf
Feiock, R. and H. Jang. 2009. Nonprofits as Local Government Service Contractors. Public Administration Review. July-August. pp. 668-680.
Figlio, D. and L. Getzler. 2002. Accountability, Ability and Disability: Gaming the System, NBER Working Paper 9307. Cambrige, MA: National Bureau of Economics Research.
Fukuyama, F. 2008. Poverty, Inequality and Democracy: The Latin American Experience. Journal of Democracy. 19(4). pp. 69-79.
Gadenne, L and M. Singhal. 2013. Decentralization in Developing Economies. NBER Working Paper 19402. Cambridge, MA: National Bureau of Economics Research.
Gauri, V., and D. Brinks. 2008. Courting Social Justice: Judicial Enforcement of Social and Economic Rights in the Developing World. Cambridge: Cambridge University Press.
Ghani, E., L. Iyer, and S. Mishra. 2012. Is Decentralisation Helping the Poor Regions? www.voxeu.org/article/decentralisation-helping-poorest-regions-evidence-india
Gill, I. and Kharas, H. 2007. An East Asian Renaissance: Ideas for Economic Growth. Washington, DC: World Bank.
Gisselquist, R. 2002. To Rid the Scourge of War: UN Peacekeeping Operations and Today’s Crises. WPF Report No. 31. Massachusetts: World Peace Foundation.
Gladwell, M. 2008. Outliers:the story of success. New York: Little Brown.Glewwe, P., I. Nauman, and M. Kremer. 2010. Teacher Incentives. American
Economic Journal: Applied Economics. 2(3). pp. 205–227. Grindle, M. 2004. Good Enough Governance: Poverty Reduction and Reform
in Developing Countries. Governance: An International Journal of Policy, Administration, and Institutions. 17. pp. 525–548.
Governance and public service delivery 87
Gupta, S., H. Davoodi, and E. Tiongson. 2002. Corruption and Provision of Health Care and Education Services. In G. Abed, and Gupta S., eds. Governance, Corruption and Economic Performance. Washington, DC: International Monetary Fund.
Halleröd, B, B. Rothstein, A. Daoud, and S. Nandy. 2013. Bad Governance and Poor Children: A Comparative Analysis of Government Efficiency and Severe Child Deprivation in 68 Low- and Middle-income Countries. World Development. 48. pp. 19–31.
Hallward-Driemeier, M. and L. Pritchett. 2011. How Business is Done and the “Doing Business” Indicators: The Investment Climate When Firms Have Climate Control. Policy Research Working Paper No. 5563. Washington, DC: World Bank.
Hausmann, R., D. Rodrik, and A. Velasco. 2005. Growth Diagnostics. Boston: Harvard Kennedy School. www.hks.harvard.edu/fs/drodrik/Research%20papers/barcelonafinalmarch2005.pdf
Hofman, B. and S. Guerra. 2004. Fiscal Disparities in East Asia: How Large and Do They Matter? In East Asia Decentralizes: Making Local Government Work. Washington D.C.: The World Bank.
Hulme, D., A. Savoia and K. Sen. 2013. Governance as a Global Development Goal? Towards Measures for the Post 2015 Development Agenda, Effective States and Inclusive Development Working Paper. University of Manchester.
International Energy Agency. 2012. World Energy Outlook 2012. Paris. www.worldenergyoutlook.org/publications/weo-2012/
International Labour Organization. 2012. Text of the Recommendation Concerning National Floors of Social Protection. Provisional Record 14A. Geneva. www.ilo.org/wcmsp5/groups/public/---ed_norm/---relconf/documents/meetingdocument/wcms_183326.pdf
Ivanyna, M. and A. Shah. 2013. How Close Is Your Government to Its People? Worldwide Indicators on Localization and Decentralization. Economics Discussion Papers, No 2013-38. Kiel Institute for the World Economy. http://www.economics-ejournal.org/economics/discussionpapers/2013-38
Jha, S., and B. Ramaswami. 2012. The Percolation of Public Expenditures: Food Subsidies and the Poor in India and the Philippines. In S. Shah, B. Bosworth, and A. Panagariya, eds. India Policy Forum, 2011–12. London: Sage Publications.
Joshi, A. 2008. Producing Social Accountability? The Impact of Service Delivery Reforms. IDS Bulletin.38(6). pp. 10–17.
Joshi, A. 2010. Review of Impacts and Effectiveness of Transparency and Accountability Initiatives: Service Delivery, Annex 1. Background Paper for the Transparency and Accountability Imitative Workshop. Institute of Development Studies, Brighton. 15-15 October.
Joshi, A. and M. Moore. 2004. Institutionalize Co-production: Unorthodox Public Service Delivery in Challenging Environments. Journal of Development Studies. 40(4). pp. 31-49.
Keefer, P. and S. Knack. 2007. Boondoggles, Rent-seeking, and Political Checks and Balances: Public Investment under Unaccountable Governments. The Review of Economics and Statistics. 89(3). pp. 566–572.
Kelkar, V. and A. Shah. 2011. Indian Social Democracy: The Resource Perspective. National Institute of Public Finance and Policy Working Papers No. 11/82. New Delhi: NIPFP.
Kauffman D. and A. Kraay. 2008. Governance Indicators: Where Are We, Where Should We be Going? World Bank Research Observer. 23(1). pp. 1–30.
88 Asian Development Outlook 2013 Update
Lehman, K., S. Verba, and H. Brady. 1999. Civic Participation and Equality Problem. In Scocpol, T. and M. Fiorina, eds. Civic Engagement in American Democracy. Washington, DC: Brookings Institution Press, and New York City: Russell Sage Foundation. www-management.wharton.upenn.edu/guillen/Verba/Verba.Civic%20Participation.pdf
Mansuri, G., and V. Rao. 2012. Localizing Development: Does Participation Work? Washington, DC: World Bank.
Mauro, P. 1995. Corruption and Growth. Quarterly Journal of Economics. 110(3). pp. 681–712.
McGee, R. and J. Gaventa. 2010. Synthesis Report: Review of Impact and Effectiveness of Transparency and Accountability Initiatives. Brighton, UK: Institute of Development Studies.
McLoughlin, C. 2011. Factors Affecting State-Non-Governmental Organization Relations in Service Provision: Key Themes from Literature. Public Administration and Development. 31. pp. 240–251.
Mookherjee, D. 1998. Incentive and Bureaucratic Reforms in Tax Administration, in Boris Pleskovic and Joseph Stiglitz (eds.), Annual World Bank Conference on Development Economics 1997, Washington D.C.: The World Bank.
Mottiar, S. and P. Bond 2011. Social Protest in South Africa. Paper presented to the International Society for Third Sector Research in Stellenbosch University for Advanced Study on 24 August.
Munro, L. 2008. Risks, Needs and Rights: Compatible or Contradictory Bases for Social Protection. In A. Barrientos and D. Hulme, eds. Social Protection for the Poor and the Poorest: Concepts, Policies and Politics. Basingstoke and New York: Palgrave Macmillan. pp. 27–46
Muralidharan, K., J. Das, A. Holla, M. Kremer, and A. Mohpal. 2013. The Fiscal Cost of Weak Governance: Ebvidence from Primary Education in India. University of California San Diego Working Paper. USA: University of California San Diego.
OECD. 2008. Handbook on Constructing Composite Indicators: Methodology and User Guide.http://www.oecd.org/std/42495745.pdf
_____. 2013. Rationale for Fighting Corruption. http://www.oecd.org/cleangovbiz/49693613.pdf
Olken, B. 2006. Corruption and the Costs of Redistribution: Micro Evidence from Indonesia. Journal of Public Economics. 90(4–5). pp. 853–870.
PAF, K. Sirker, and S. Cosic. 2007. Empowering the Marginalized: Case Studies of Social Accountability Initiatives in Asia. Washington DC: World Bank.
Rajkumar A.S. and V. Swaroop. 2008. Public Spending and Outcomes: Does Governance Matter? Journal of Development Economics. 86(1). pp. 96–111.
Ramaswami B., M Murugkar, and A Kotwal. 2013. Correct Costs of the Food Security Bill. The Financial Express. 2 September. http://www.financialexpress.com/news/correct-costs-of-the-food-security-bill/1156251/0
Ramkumar, V and W. Krafchik. 2005. The Role of Civil Society Organisations in Auditing and Public Financial Management. The International Budget Project. Washington DC.
Rauch J.E., and P. Evans. 2000. Bureaucratic Structure and Bureaucratic Performance in Less Developed countries. Journal of Public Economics. 75(1). pp. 49–71.
Rodrik, D. 2008. Thinking about Governance. In World Bank, Governance, Growth, and Development Decision-Making. Washington, DC: World Bank.
Saich, A. 2012. The Quality of Governance in [the People’s Republic of] China: The Citizen’s View. Faculty Research Working Paper 12–051. Boston: Harvard Kennedy School.
Governance and public service delivery 89
Scott, Z. 2009. Decentralisation, Local Development and Social Cohesion: An Analytical Review. GSDRC research paper. Available: http://www.gsdrc.org/docs/open/PO60.pdf?bcsi_scan_e41ddc73166bc1eb=0&bcsi_scan_filename=PO60.pdf
Sen, A. 2005. Human Rights and Capabilities. Journal of Human Development. 6(2). pp. 151-156.
______. 2006. Human Rights and the Limits of Law. Cardozo Law Review. 27(6). pp. 2913-2927.
______. 2009. The Idea of Justice. Cambridge, MA: Penguin and Harvard University Press.
Shen Chunli, Jing Jin and Heng-fu Zou. 2012. Fiscal Decentralization in China: History, Impact, Challenges and Next Steps. Annals of Economics and Finance. 13(1). pp. 1–51.
Son, H. 2009. Equity in Health and Health Care in the Philippines. ADB Economics Working Paper Series. No. 171. Manila: Asian Development Bank.
______. 2012. Inequality of Human Opportunities in Developing Asia. ADB Economics Working Paper Series. No. 328. Manila: Asian Development Bank.
South Asian Forum for Education Development (SAFED). 2012. Annual Status of Education Report. http://www.aserpakistan.org/document/aser/2012/reports/national/National2012.pdf?bcsi_scan_97e98328e2b67804=1
Tebaldi, E. and R. Mohan. 2010. Institutions and Poverty. The Journal of Development Studies, 46(6). pp. 1047–1066.
Tolbert, C. and K. Mossberger. 2006. The Effects of E-government on Trust and Confidence in Government. Public Administration Review. 66(3). pp. 354–369.
United Nations. 2013. A New Global Partnership: Eradicate Poverty and Transform Economies Through Sustainable Development. The Report of the High Level Forum of Eminent Persons on Post 2015 Development Agenda. New York City.www.post2015hlp.org/wp-content/uploads/2013/05/UN-Report.pdf
United Nations. 2005. Investing in Development: A practical Plan to Achieve the Millennium Development Goals. New York City. http://www.unmillenniumproject.org/documents/MainReportComplete-lowres.pdf
United Nations Development Programme. 2004. Decentralised Governance for Development: A Combined Practice Note on Decentralisation, Local Governance and Urban/Rural Development. http://www.undp.org/content/dam/aplaws/publication/en/publications/democratic-governance/dg-publications-for-website/decentralised-governance-for-development-a-combined-practice-note-on-decentralisation-local-governance-and-urban-rural-development/DLGUD_PN_English.pdf
United Nations Educational, Scientific and Cultural Organization (UNESCO). Regions and Offices. http://www.unesco.org/new/en/unesco/worldwide/
United Nations Office on Drugs and Crime. 2004. United Nations Convention gainst Corruption. Vienna. www.unodc.org/documents/treaties/UNCAC/Publications/Convention/08-50026_E.pdf
United Nations Public Administration Programme. United Nations E-Government Survey 2012. http://unpan3.un.org/egovkb/global_reports/12report.htm
Usman, S., Akhmadi, and D. Suryadarma. 2007. Patterns of Teacher Absence in Public Primary Schools in Indonesia. Asia Pacific Journal of Education. 27(2). pp. 207-219.
Wallace, J. 2010. Land Acquisition in Developing Countries. www.fig.net/pub/monthly_articles/february_2010/february_2010_wallace.pdf
90 Asian Development Outlook 2013 Update
Welch, E., C. Hinnant, & M. Moon. 2005. Linking Citizen Satisfaction With E-government and Trust in Government. Journal of Public Administration Research and Theory. 15(3). pp. 371–391.
Werker, E. and F. Ahmed. 2008. What Do Nongovernmental Organizations Do? Journal of Economic Perspectives. 22(2). pp. 73–92.
Williams, A. and A. Siddique. 2008. The Use (and Abuse) of Governance Indicators in Economics: A Review. Economics of Governance. 9(2). pp. 131–175.
World Bank. 2013a. How We Classify Countries. http://data.worldbank.org/about/country-classifications (accessed 20 September 2013).
_____. 2013b. Six Questions on the Cost of Corruption with World Bank Institute Global Governance Director Daniel Kaufmann (accessed 20 September 2013).
_____. 1999. World Development Report 1999–2000: Entering the 21st Century – The Changing Development Landscape. Washington, DC: World Bank.
World Economic Forum. 2013. Global Competitiveness Report 2013–2014. www.weforum.org/issues/global-competitiveness
Zhuang, J., E. de Dios, and A. Lagman-Martin. 2010. Governance and Institutional Quality and the links with Growth and Inequality: How Asia fares. In Zhuang, J., ed. Poverty, Inequality, and Inclusive Growth in Asia: Measurement, Policy Issues, and Country Studies. Manila: ADB and London: Anthem Press.
3Economic trendsand prospects indeveloping Asia
Subregional summariesCentral Asia
East AsiaSouth Asia
Southeast AsiaThe Pacific
BangladeshPeople’s Republic of China
IndiaIndonesia
MalaysiaPakistan
PhilippinesThailandViet Nam
This chapter was written by Tatsuji Hayakawa for Central Asia; Shiela Camingue-Romance,
Donghyun Park, Arief Ramayandi, Aleli Rosario, Akiko Terada-Hagiwara, and Reza Vaez-
Zadeh, for East Asia; Sarah Carrington and Sabyasachi Mitra for South Asia; Anthony
Patrick for Southeast Asia; and Aaron Batten, Caroline Currie, Christopher Edmonds,
Milovan Lucich, Rommel Rabanal, Cara Tinio, Laisiasa Tora, and Emma Veve for the Pacific.
Country highlights were contributed by various ADB resident mission staff.
Economic trends and prospects in developing Asia
Subregional summariesCentral Asia
Subregional assessment and prospectsThis Update reduces the growth projection for Central Asia in 2013 made in the Asian Development Outlook 2013 (ADO 2013) from 5.5% to 5.4%, as lower forecasts for Georgia and Kazakhstan slightly outweigh higher forecasts for Azerbaijan, the Kyrgyz Republic, and Tajikistan. The growth projection for 2014 stays unchanged at 6.0% (Figure 3.1.1). The subregion’s inflation forecast for 2013 remains at 6.7%, as lower inflation in Georgia should offset higher inflation in Armenia. However, the inflation forecast for 2014 is now a notch higher at 6.8%, reflecting higher inflation in Armenia (Figure 3.1.2). The subregion’s current account surplus projection for 2013 has been lowered to 2.4% from 3.1%, reflecting narrower surpluses in Azerbaijan and Kazakhstan and wider deficits in Armenia and the Kyrgyz Republic that more than offset narrower deficits in Georgia and Tajikistan. The forecast surplus for 2014 remains at 4.5% of GDP, as smaller deficits in Georgia and Tajikistan should offset a larger deficit in Armenia (Figure 3.1.3).
This Update lowers GDP growth projections for Georgia and Kazakhstan. For Kazakhstan, the 2013 growth forecast is reduced from 5.2% to 4.8%, as growth slowed in the first half of 2013 and the short-term outlook is less buoyant. Industry and agriculture are growing slowly, while construction is dragging. Slow oil production and weak demand for metals have also reduced growth. However, growth is still projected to recover in 2014 to 5.6%, boosted by public investment and the commissioning of the Kashagan oil field. In Georgia, growth in the first 7 months of 2013 slowed to an annual rate of 1.7%, reflecting a wait-and-see attitude among investors, along with continued fiscal consolidation, weak domestic demand, and slower global growth.
3.1.1 GDP growth, Central Asia
0 3 6 9 12
Central Asia
Armenia
Azerbaijan
Georgia
Kazakhstan
Kyrgyz Republic
Tajikistan
Turkmenistan
Uzbekistan
%
–3
2012 2013 2014
Source: Asian Development Outlook database.
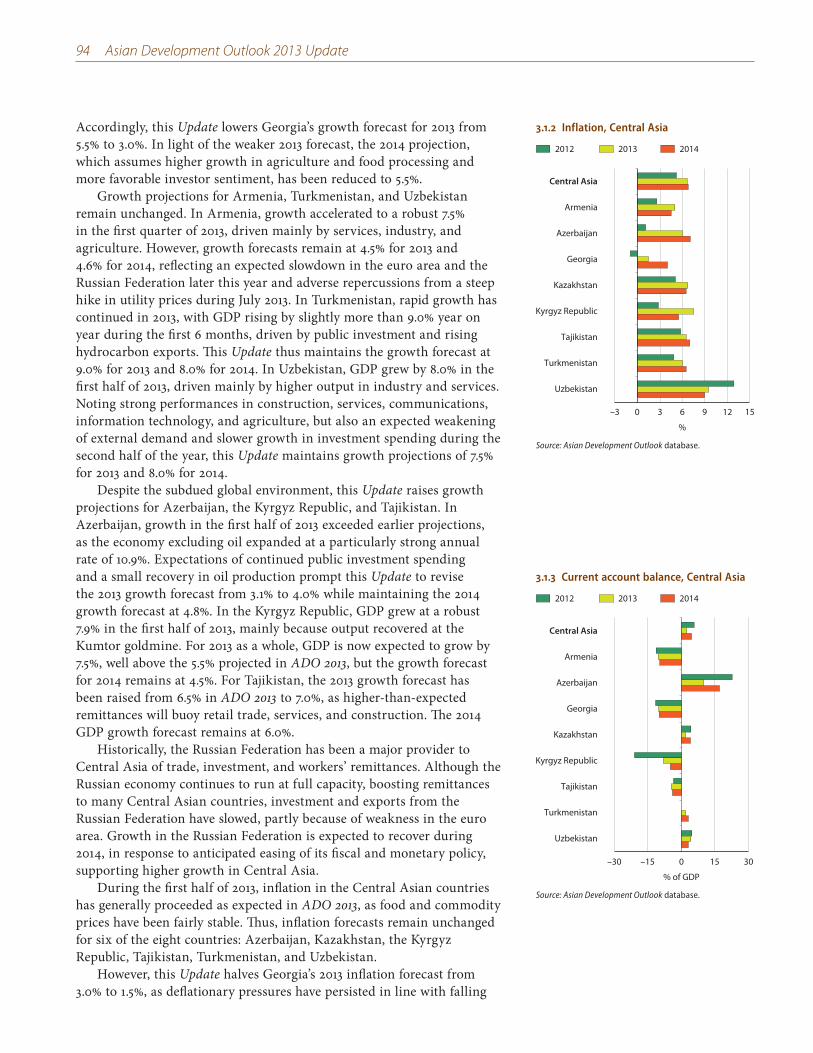
94 Asian Development Outlook 2013 Update
Accordingly, this Update lowers Georgia’s growth forecast for 2013 from 5.5% to 3.0%. In light of the weaker 2013 forecast, the 2014 projection, which assumes higher growth in agriculture and food processing and more favorable investor sentiment, has been reduced to 5.5%.
Growth projections for Armenia, Turkmenistan, and Uzbekistan remain unchanged. In Armenia, growth accelerated to a robust 7.5% in the first quarter of 2013, driven mainly by services, industry, and agriculture. However, growth forecasts remain at 4.5% for 2013 and 4.6% for 2014, reflecting an expected slowdown in the euro area and the Russian Federation later this year and adverse repercussions from a steep hike in utility prices during July 2013. In Turkmenistan, rapid growth has continued in 2013, with GDP rising by slightly more than 9.0% year on year during the first 6 months, driven by public investment and rising hydrocarbon exports. This Update thus maintains the growth forecast at 9.0% for 2013 and 8.0% for 2014. In Uzbekistan, GDP grew by 8.0% in the first half of 2013, driven mainly by higher output in industry and services. Noting strong performances in construction, services, communications, information technology, and agriculture, but also an expected weakening of external demand and slower growth in investment spending during the second half of the year, this Update maintains growth projections of 7.5% for 2013 and 8.0% for 2014.
Despite the subdued global environment, this Update raises growth projections for Azerbaijan, the Kyrgyz Republic, and Tajikistan. In Azerbaijan, growth in the first half of 2013 exceeded earlier projections, as the economy excluding oil expanded at a particularly strong annual rate of 10.9%. Expectations of continued public investment spending and a small recovery in oil production prompt this Update to revise the 2013 growth forecast from 3.1% to 4.0% while maintaining the 2014 growth forecast at 4.8%. In the Kyrgyz Republic, GDP grew at a robust 7.9% in the first half of 2013, mainly because output recovered at the Kumtor goldmine. For 2013 as a whole, GDP is now expected to grow by 7.5%, well above the 5.5% projected in ADO 2013, but the growth forecast for 2014 remains at 4.5%. For Tajikistan, the 2013 growth forecast has been raised from 6.5% in ADO 2013 to 7.0%, as higher-than-expected remittances will buoy retail trade, services, and construction. The 2014 GDP growth forecast remains at 6.0%.
Historically, the Russian Federation has been a major provider to Central Asia of trade, investment, and workers’ remittances. Although the Russian economy continues to run at full capacity, boosting remittances to many Central Asian countries, investment and exports from the Russian Federation have slowed, partly because of weakness in the euro area. Growth in the Russian Federation is expected to recover during 2014, in response to anticipated easing of its fiscal and monetary policy, supporting higher growth in Central Asia.
During the first half of 2013, inflation in the Central Asian countries has generally proceeded as expected in ADO 2013, as food and commodity prices have been fairly stable. Thus, inflation forecasts remain unchanged for six of the eight countries: Azerbaijan, Kazakhstan, the Kyrgyz Republic, Tajikistan, Turkmenistan, and Uzbekistan.
However, this Update halves Georgia’s 2013 inflation forecast from 3.0% to 1.5%, as deflationary pressures have persisted in line with falling
3.1.2 Inflation, Central Asia
Central Asia
Armenia
Azerbaijan
Georgia
Kazakhstan
Kyrgyz Republic
Tajikistan
Turkmenistan
Uzbekistan
%
2012 2013 2014
–3 0 3 6 9 12 15
Source: Asian Development Outlook database.
3.1.3 Current account balance, Central Asia
–30 –15 0 15 30
% of GDP
2012 2013 2014
Central Asia
Armenia
Azerbaijan
Georgia
Kazakhstan
Kyrgyz Republic
Tajikistan
Turkmenistan
Uzbekistan
Source: Asian Development Outlook database.
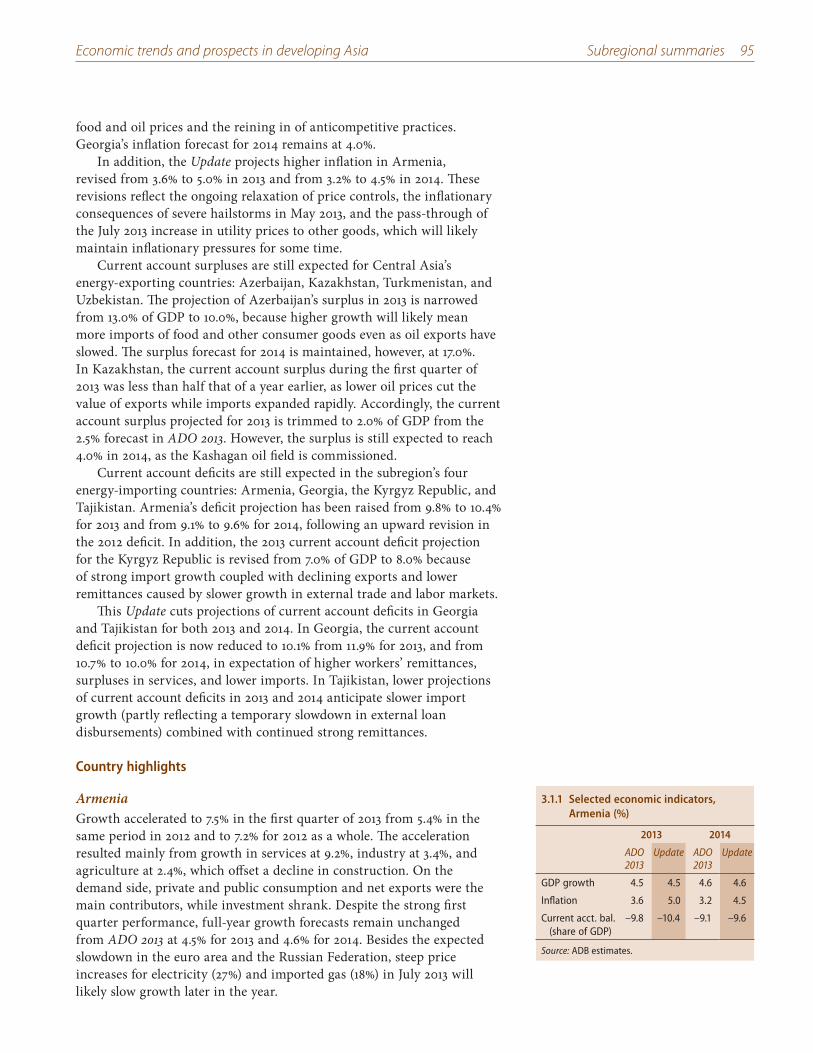
Economic trends and prospects in developing Asia Subregional summaries 95
food and oil prices and the reining in of anticompetitive practices. Georgia’s inflation forecast for 2014 remains at 4.0%.
In addition, the Update projects higher inflation in Armenia, revised from 3.6% to 5.0% in 2013 and from 3.2% to 4.5% in 2014. These revisions reflect the ongoing relaxation of price controls, the inflationary consequences of severe hailstorms in May 2013, and the pass-through of the July 2013 increase in utility prices to other goods, which will likely maintain inflationary pressures for some time.
Current account surpluses are still expected for Central Asia’s energy-exporting countries: Azerbaijan, Kazakhstan, Turkmenistan, and Uzbekistan. The projection of Azerbaijan’s surplus in 2013 is narrowed from 13.0% of GDP to 10.0%, because higher growth will likely mean more imports of food and other consumer goods even as oil exports have slowed. The surplus forecast for 2014 is maintained, however, at 17.0%. In Kazakhstan, the current account surplus during the first quarter of 2013 was less than half that of a year earlier, as lower oil prices cut the value of exports while imports expanded rapidly. Accordingly, the current account surplus projected for 2013 is trimmed to 2.0% of GDP from the 2.5% forecast in ADO 2013. However, the surplus is still expected to reach 4.0% in 2014, as the Kashagan oil field is commissioned.
Current account deficits are still expected in the subregion’s four energy-importing countries: Armenia, Georgia, the Kyrgyz Republic, and Tajikistan. Armenia’s deficit projection has been raised from 9.8% to 10.4% for 2013 and from 9.1% to 9.6% for 2014, following an upward revision in the 2012 deficit. In addition, the 2013 current account deficit projection for the Kyrgyz Republic is revised from 7.0% of GDP to 8.0% because of strong import growth coupled with declining exports and lower remittances caused by slower growth in external trade and labor markets.
This Update cuts projections of current account deficits in Georgia and Tajikistan for both 2013 and 2014. In Georgia, the current account deficit projection is now reduced to 10.1% from 11.9% for 2013, and from 10.7% to 10.0% for 2014, in expectation of higher workers’ remittances, surpluses in services, and lower imports. In Tajikistan, lower projections of current account deficits in 2013 and 2014 anticipate slower import growth (partly reflecting a temporary slowdown in external loan disbursements) combined with continued strong remittances.
Country highlights
ArmeniaGrowth accelerated to 7.5% in the first quarter of 2013 from 5.4% in the same period in 2012 and to 7.2% for 2012 as a whole. The acceleration resulted mainly from growth in services at 9.2%, industry at 3.4%, and agriculture at 2.4%, which offset a decline in construction. On the demand side, private and public consumption and net exports were the main contributors, while investment shrank. Despite the strong first quarter performance, full-year growth forecasts remain unchanged from ADO 2013 at 4.5% for 2013 and 4.6% for 2014. Besides the expected slowdown in the euro area and the Russian Federation, steep price increases for electricity (27%) and imported gas (18%) in July 2013 will likely slow growth later in the year.
3.1.1 Selected economic indicators, Armenia (%)
2013 2014
ADO 2013
Update ADO 2013
Update
GDP growth 4.5 4.5 4.6 4.6
Inflation 3.6 5.0 3.2 4.5
Current acct. bal. (share of GDP)
–9.8 –10.4 –9.1 –9.6
Source: ADB estimates.
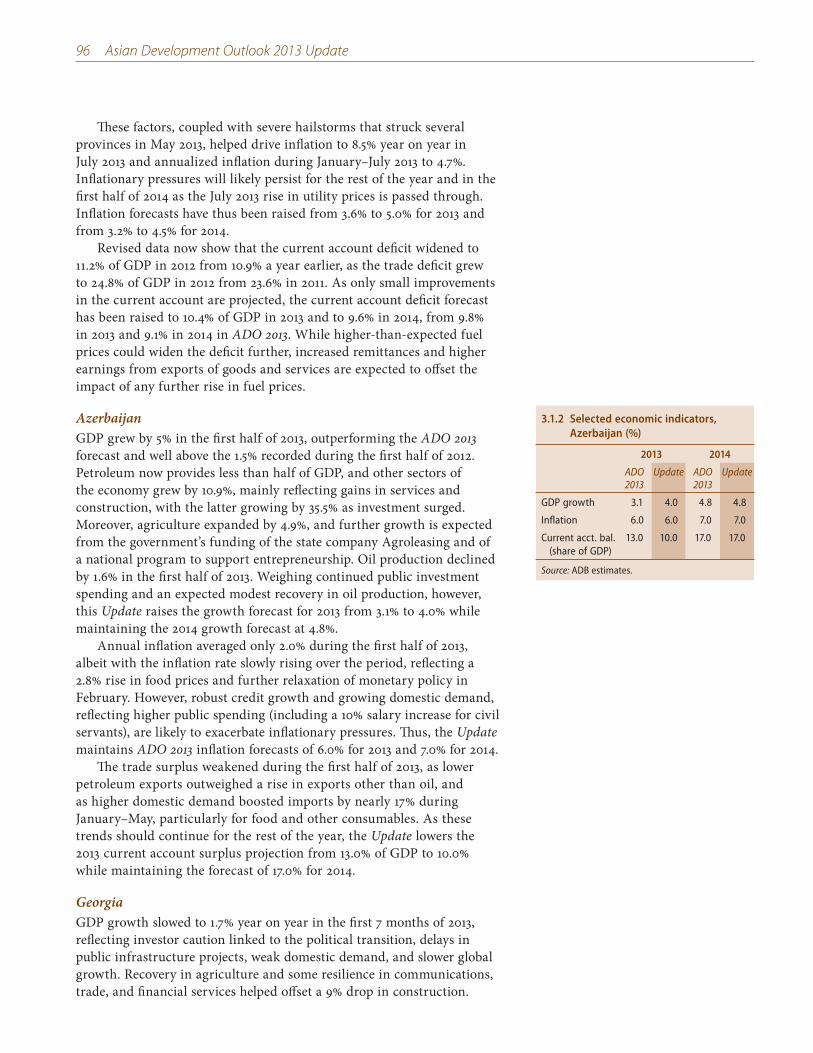
96 Asian Development Outlook 2013 Update
These factors, coupled with severe hailstorms that struck several provinces in May 2013, helped drive inflation to 8.5% year on year in July 2013 and annualized inflation during January–July 2013 to 4.7%. Inflationary pressures will likely persist for the rest of the year and in the first half of 2014 as the July 2013 rise in utility prices is passed through. Inflation forecasts have thus been raised from 3.6% to 5.0% for 2013 and from 3.2% to 4.5% for 2014.
Revised data now show that the current account deficit widened to 11.2% of GDP in 2012 from 10.9% a year earlier, as the trade deficit grew to 24.8% of GDP in 2012 from 23.6% in 2011. As only small improvements in the current account are projected, the current account deficit forecast has been raised to 10.4% of GDP in 2013 and to 9.6% in 2014, from 9.8% in 2013 and 9.1% in 2014 in ADO 2013. While higher-than-expected fuel prices could widen the deficit further, increased remittances and higher earnings from exports of goods and services are expected to offset the impact of any further rise in fuel prices.
AzerbaijanGDP grew by 5% in the first half of 2013, outperforming the ADO 2013 forecast and well above the 1.5% recorded during the first half of 2012. Petroleum now provides less than half of GDP, and other sectors of the economy grew by 10.9%, mainly reflecting gains in services and construction, with the latter growing by 35.5% as investment surged. Moreover, agriculture expanded by 4.9%, and further growth is expected from the government’s funding of the state company Agroleasing and of a national program to support entrepreneurship. Oil production declined by 1.6% in the first half of 2013. Weighing continued public investment spending and an expected modest recovery in oil production, however, this Update raises the growth forecast for 2013 from 3.1% to 4.0% while maintaining the 2014 growth forecast at 4.8%.
Annual inflation averaged only 2.0% during the first half of 2013, albeit with the inflation rate slowly rising over the period, reflecting a 2.8% rise in food prices and further relaxation of monetary policy in February. However, robust credit growth and growing domestic demand, reflecting higher public spending (including a 10% salary increase for civil servants), are likely to exacerbate inflationary pressures. Thus, the Update maintains ADO 2013 inflation forecasts of 6.0% for 2013 and 7.0% for 2014.
The trade surplus weakened during the first half of 2013, as lower petroleum exports outweighed a rise in exports other than oil, and as higher domestic demand boosted imports by nearly 17% during January–May, particularly for food and other consumables. As these trends should continue for the rest of the year, the Update lowers the 2013 current account surplus projection from 13.0% of GDP to 10.0% while maintaining the forecast of 17.0% for 2014.
GeorgiaGDP growth slowed to 1.7% year on year in the first 7 months of 2013, reflecting investor caution linked to the political transition, delays in public infrastructure projects, weak domestic demand, and slower global growth. Recovery in agriculture and some resilience in communications, trade, and financial services helped offset a 9% drop in construction.
3.1.2 Selected economic indicators, Azerbaijan (%)
2013 2014
ADO 2013
Update ADO 2013
Update
GDP growth 3.1 4.0 4.8 4.8
Inflation 6.0 6.0 7.0 7.0
Current acct. bal. (share of GDP)
13.0 10.0 17.0 17.0
Source: ADB estimates.
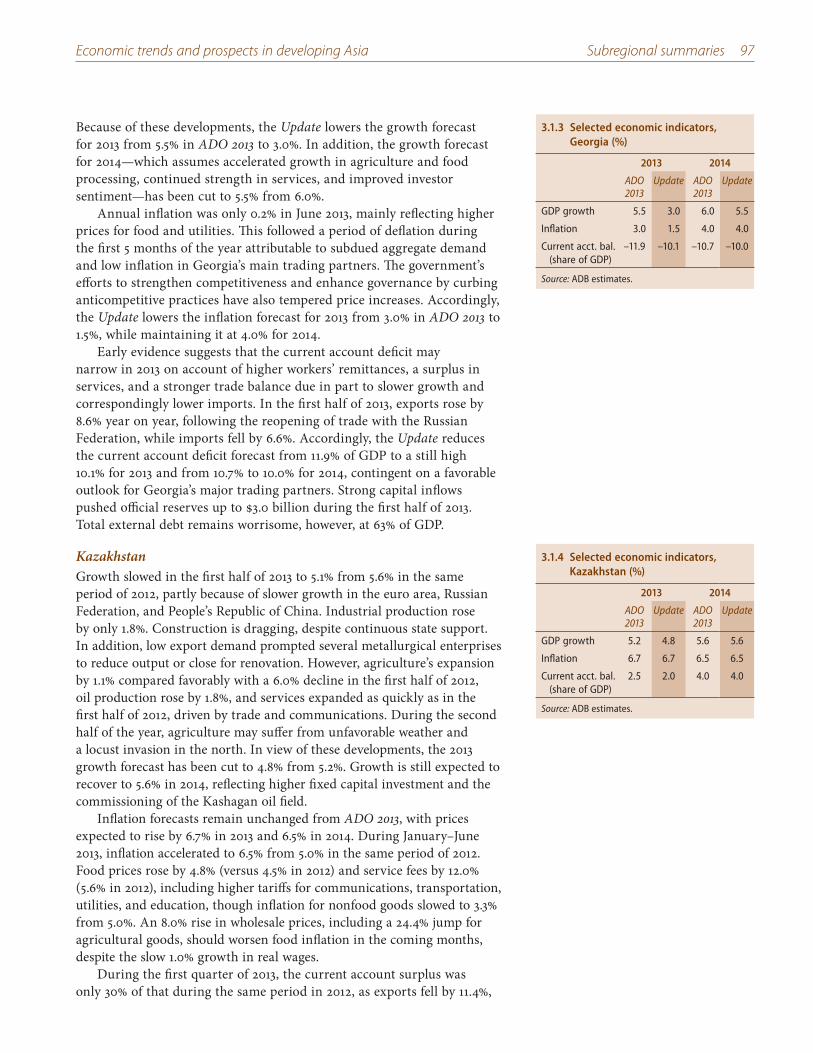
Economic trends and prospects in developing Asia Subregional summaries 97
Because of these developments, the Update lowers the growth forecast for 2013 from 5.5% in ADO 2013 to 3.0%. In addition, the growth forecast for 2014—which assumes accelerated growth in agriculture and food processing, continued strength in services, and improved investor sentiment—has been cut to 5.5% from 6.0%.
Annual inflation was only 0.2% in June 2013, mainly reflecting higher prices for food and utilities. This followed a period of deflation during the first 5 months of the year attributable to subdued aggregate demand and low inflation in Georgia’s main trading partners. The government’s efforts to strengthen competitiveness and enhance governance by curbing anticompetitive practices have also tempered price increases. Accordingly, the Update lowers the inflation forecast for 2013 from 3.0% in ADO 2013 to 1.5%, while maintaining it at 4.0% for 2014.
Early evidence suggests that the current account deficit may narrow in 2013 on account of higher workers’ remittances, a surplus in services, and a stronger trade balance due in part to slower growth and correspondingly lower imports. In the first half of 2013, exports rose by 8.6% year on year, following the reopening of trade with the Russian Federation, while imports fell by 6.6%. Accordingly, the Update reduces the current account deficit forecast from 11.9% of GDP to a still high 10.1% for 2013 and from 10.7% to 10.0% for 2014, contingent on a favorable outlook for Georgia’s major trading partners. Strong capital inflows pushed official reserves up to $3.0 billion during the first half of 2013. Total external debt remains worrisome, however, at 63% of GDP.
KazakhstanGrowth slowed in the first half of 2013 to 5.1% from 5.6% in the same period of 2012, partly because of slower growth in the euro area, Russian Federation, and People’s Republic of China. Industrial production rose by only 1.8%. Construction is dragging, despite continuous state support. In addition, low export demand prompted several metallurgical enterprises to reduce output or close for renovation. However, agriculture’s expansion by 1.1% compared favorably with a 6.0% decline in the first half of 2012, oil production rose by 1.8%, and services expanded as quickly as in the first half of 2012, driven by trade and communications. During the second half of the year, agriculture may suffer from unfavorable weather and a locust invasion in the north. In view of these developments, the 2013 growth forecast has been cut to 4.8% from 5.2%. Growth is still expected to recover to 5.6% in 2014, reflecting higher fixed capital investment and the commissioning of the Kashagan oil field.
Inflation forecasts remain unchanged from ADO 2013, with prices expected to rise by 6.7% in 2013 and 6.5% in 2014. During January–June 2013, inflation accelerated to 6.5% from 5.0% in the same period of 2012. Food prices rose by 4.8% (versus 4.5% in 2012) and service fees by 12.0% (5.6% in 2012), including higher tariffs for communications, transportation, utilities, and education, though inflation for nonfood goods slowed to 3.3% from 5.0%. An 8.0% rise in wholesale prices, including a 24.4% jump for agricultural goods, should worsen food inflation in the coming months, despite the slow 1.0% growth in real wages.
During the first quarter of 2013, the current account surplus was only 30% of that during the same period in 2012, as exports fell by 11.4%,
3.1.3 Selected economic indicators, Georgia (%)
2013 2014
ADO 2013
Update ADO 2013
Update
GDP growth 5.5 3.0 6.0 5.5
Inflation 3.0 1.5 4.0 4.0
Current acct. bal. (share of GDP)
–11.9 –10.1 –10.7 –10.0
Source: ADB estimates.
3.1.4 Selected economic indicators, Kazakhstan (%)
2013 2014
ADO 2013
Update ADO 2013
Update
GDP growth 5.2 4.8 5.6 5.6
Inflation 6.7 6.7 6.5 6.5
Current acct. bal. (share of GDP)
2.5 2.0 4.0 4.0
Source: ADB estimates.
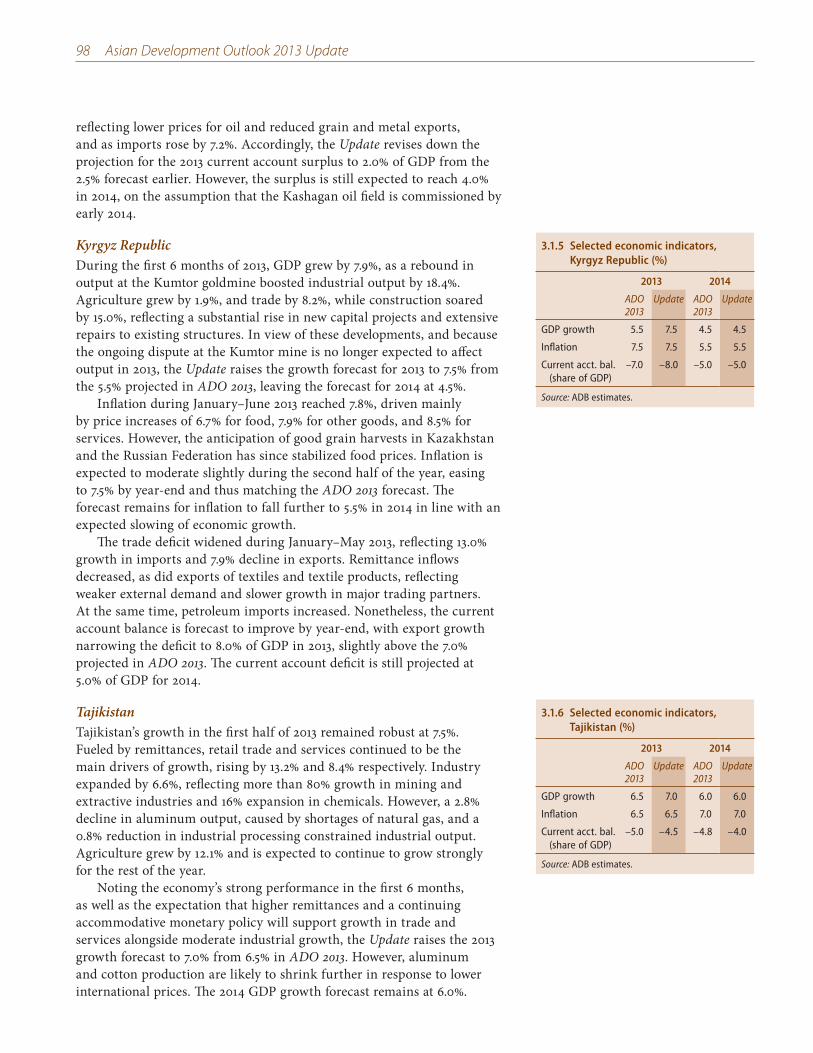
98 Asian Development Outlook 2013 Update
reflecting lower prices for oil and reduced grain and metal exports, and as imports rose by 7.2%. Accordingly, the Update revises down the projection for the 2013 current account surplus to 2.0% of GDP from the 2.5% forecast earlier. However, the surplus is still expected to reach 4.0% in 2014, on the assumption that the Kashagan oil field is commissioned by early 2014.
Kyrgyz RepublicDuring the first 6 months of 2013, GDP grew by 7.9%, as a rebound in output at the Kumtor goldmine boosted industrial output by 18.4%. Agriculture grew by 1.9%, and trade by 8.2%, while construction soared by 15.0%, reflecting a substantial rise in new capital projects and extensive repairs to existing structures. In view of these developments, and because the ongoing dispute at the Kumtor mine is no longer expected to affect output in 2013, the Update raises the growth forecast for 2013 to 7.5% from the 5.5% projected in ADO 2013, leaving the forecast for 2014 at 4.5%.
Inflation during January–June 2013 reached 7.8%, driven mainly by price increases of 6.7% for food, 7.9% for other goods, and 8.5% for services. However, the anticipation of good grain harvests in Kazakhstan and the Russian Federation has since stabilized food prices. Inflation is expected to moderate slightly during the second half of the year, easing to 7.5% by year-end and thus matching the ADO 2013 forecast. The forecast remains for inflation to fall further to 5.5% in 2014 in line with an expected slowing of economic growth.
The trade deficit widened during January–May 2013, reflecting 13.0% growth in imports and 7.9% decline in exports. Remittance inflows decreased, as did exports of textiles and textile products, reflecting weaker external demand and slower growth in major trading partners. At the same time, petroleum imports increased. Nonetheless, the current account balance is forecast to improve by year-end, with export growth narrowing the deficit to 8.0% of GDP in 2013, slightly above the 7.0% projected in ADO 2013. The current account deficit is still projected at 5.0% of GDP for 2014.
TajikistanTajikistan’s growth in the first half of 2013 remained robust at 7.5%. Fueled by remittances, retail trade and services continued to be the main drivers of growth, rising by 13.2% and 8.4% respectively. Industry expanded by 6.6%, reflecting more than 80% growth in mining and extractive industries and 16% expansion in chemicals. However, a 2.8% decline in aluminum output, caused by shortages of natural gas, and a 0.8% reduction in industrial processing constrained industrial output. Agriculture grew by 12.1% and is expected to continue to grow strongly for the rest of the year.
Noting the economy’s strong performance in the first 6 months, as well as the expectation that higher remittances and a continuing accommodative monetary policy will support growth in trade and services alongside moderate industrial growth, the Update raises the 2013 growth forecast to 7.0% from 6.5% in ADO 2013. However, aluminum and cotton production are likely to shrink further in response to lower international prices. The 2014 GDP growth forecast remains at 6.0%.
3.1.5 Selected economic indicators, Kyrgyz Republic (%)
2013 2014
ADO 2013
Update ADO 2013
Update
GDP growth 5.5 7.5 4.5 4.5
Inflation 7.5 7.5 5.5 5.5
Current acct. bal. (share of GDP)
–7.0 –8.0 –5.0 –5.0
Source: ADB estimates.
3.1.6 Selected economic indicators, Tajikistan (%)
2013 2014
ADO 2013
Update ADO 2013
Update
GDP growth 6.5 7.0 6.0 6.0
Inflation 6.5 6.5 7.0 7.0
Current acct. bal. (share of GDP)
–5.0 –4.5 –4.8 –4.0
Source: ADB estimates.
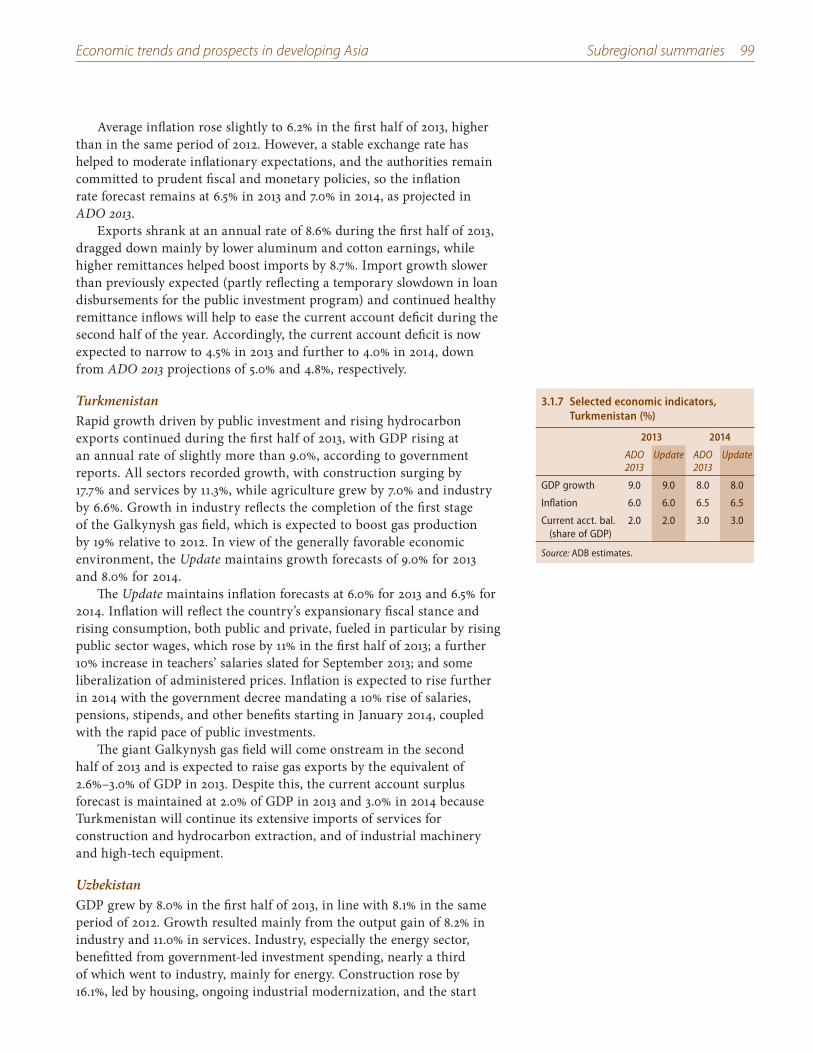
Economic trends and prospects in developing Asia Subregional summaries 99
Average inflation rose slightly to 6.2% in the first half of 2013, higher than in the same period of 2012. However, a stable exchange rate has helped to moderate inflationary expectations, and the authorities remain committed to prudent fiscal and monetary policies, so the inflation rate forecast remains at 6.5% in 2013 and 7.0% in 2014, as projected in ADO 2013.
Exports shrank at an annual rate of 8.6% during the first half of 2013, dragged down mainly by lower aluminum and cotton earnings, while higher remittances helped boost imports by 8.7%. Import growth slower than previously expected (partly reflecting a temporary slowdown in loan disbursements for the public investment program) and continued healthy remittance inflows will help to ease the current account deficit during the second half of the year. Accordingly, the current account deficit is now expected to narrow to 4.5% in 2013 and further to 4.0% in 2014, down from ADO 2013 projections of 5.0% and 4.8%, respectively.
TurkmenistanRapid growth driven by public investment and rising hydrocarbon exports continued during the first half of 2013, with GDP rising at an annual rate of slightly more than 9.0%, according to government reports. All sectors recorded growth, with construction surging by 17.7% and services by 11.3%, while agriculture grew by 7.0% and industry by 6.6%. Growth in industry reflects the completion of the first stage of the Galkynysh gas field, which is expected to boost gas production by 19% relative to 2012. In view of the generally favorable economic environment, the Update maintains growth forecasts of 9.0% for 2013 and 8.0% for 2014.
The Update maintains inflation forecasts at 6.0% for 2013 and 6.5% for 2014. Inflation will reflect the country’s expansionary fiscal stance and rising consumption, both public and private, fueled in particular by rising public sector wages, which rose by 11% in the first half of 2013; a further 10% increase in teachers’ salaries slated for September 2013; and some liberalization of administered prices. Inflation is expected to rise further in 2014 with the government decree mandating a 10% rise of salaries, pensions, stipends, and other benefits starting in January 2014, coupled with the rapid pace of public investments.
The giant Galkynysh gas field will come onstream in the second half of 2013 and is expected to raise gas exports by the equivalent of 2.6%–3.0% of GDP in 2013. Despite this, the current account surplus forecast is maintained at 2.0% of GDP in 2013 and 3.0% in 2014 because Turkmenistan will continue its extensive imports of services for construction and hydrocarbon extraction, and of industrial machinery and high-tech equipment.
UzbekistanGDP grew by 8.0% in the first half of 2013, in line with 8.1% in the same period of 2012. Growth resulted mainly from the output gain of 8.2% in industry and 11.0% in services. Industry, especially the energy sector, benefitted from government-led investment spending, nearly a third of which went to industry, mainly for energy. Construction rose by 16.1%, led by housing, ongoing industrial modernization, and the start
3.1.7 Selected economic indicators, Turkmenistan (%)
2013 2014
ADO 2013
Update ADO 2013
Update
GDP growth 9.0 9.0 8.0 8.0
Inflation 6.0 6.0 6.5 6.5
Current acct. bal. (share of GDP)
2.0 2.0 3.0 3.0
Source: ADB estimates.
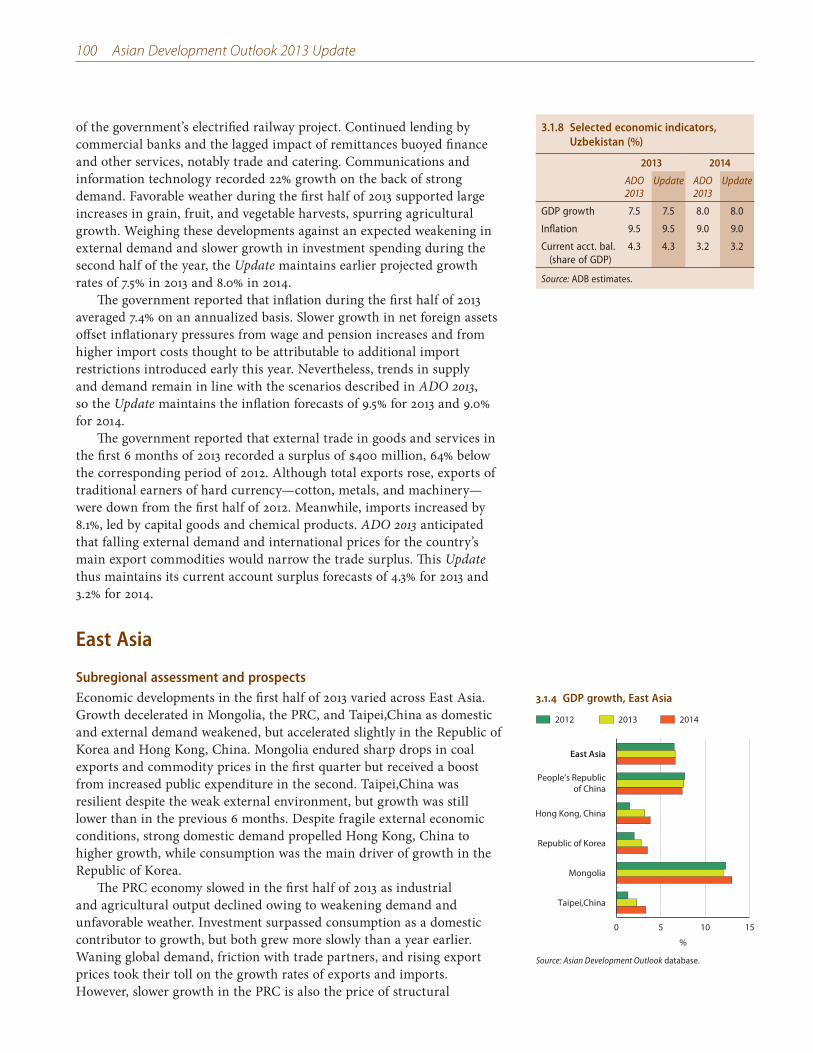
100 Asian Development Outlook 2013 Update
of the government’s electrified railway project. Continued lending by commercial banks and the lagged impact of remittances buoyed finance and other services, notably trade and catering. Communications and information technology recorded 22% growth on the back of strong demand. Favorable weather during the first half of 2013 supported large increases in grain, fruit, and vegetable harvests, spurring agricultural growth. Weighing these developments against an expected weakening in external demand and slower growth in investment spending during the second half of the year, the Update maintains earlier projected growth rates of 7.5% in 2013 and 8.0% in 2014.
The government reported that inflation during the first half of 2013 averaged 7.4% on an annualized basis. Slower growth in net foreign assets offset inflationary pressures from wage and pension increases and from higher import costs thought to be attributable to additional import restrictions introduced early this year. Nevertheless, trends in supply and demand remain in line with the scenarios described in ADO 2013, so the Update maintains the inflation forecasts of 9.5% for 2013 and 9.0% for 2014.
The government reported that external trade in goods and services in the first 6 months of 2013 recorded a surplus of $400 million, 64% below the corresponding period of 2012. Although total exports rose, exports of traditional earners of hard currency—cotton, metals, and machinery—were down from the first half of 2012. Meanwhile, imports increased by 8.1%, led by capital goods and chemical products. ADO 2013 anticipated that falling external demand and international prices for the country’s main export commodities would narrow the trade surplus. This Update thus maintains its current account surplus forecasts of 4.3% for 2013 and 3.2% for 2014.
East Asia
Subregional assessment and prospects Economic developments in the first half of 2013 varied across East Asia. Growth decelerated in Mongolia, the PRC, and Taipei,China as domestic and external demand weakened, but accelerated slightly in the Republic of Korea and Hong Kong, China. Mongolia endured sharp drops in coal exports and commodity prices in the first quarter but received a boost from increased public expenditure in the second. Taipei,China was resilient despite the weak external environment, but growth was still lower than in the previous 6 months. Despite fragile external economic conditions, strong domestic demand propelled Hong Kong, China to higher growth, while consumption was the main driver of growth in the Republic of Korea.
The PRC economy slowed in the first half of 2013 as industrial and agricultural output declined owing to weakening demand and unfavorable weather. Investment surpassed consumption as a domestic contributor to growth, but both grew more slowly than a year earlier. Waning global demand, friction with trade partners, and rising export prices took their toll on the growth rates of exports and imports. However, slower growth in the PRC is also the price of structural
3.1.8 Selected economic indicators, Uzbekistan (%)
2013 2014
ADO 2013
Update ADO 2013
Update
GDP growth 7.5 7.5 8.0 8.0
Inflation 9.5 9.5 9.0 9.0
Current acct. bal. (share of GDP)
4.3 4.3 3.2 3.2
Source: ADB estimates.
3.1.4 GDP growth, East Asia
2012 2013 2014
%
0 5 10 15
Taipei,China
Mongolia
Republic of Korea
Hong Kong, China
People’s Republicof China
East Asia
Source: Asian Development Outlook database.
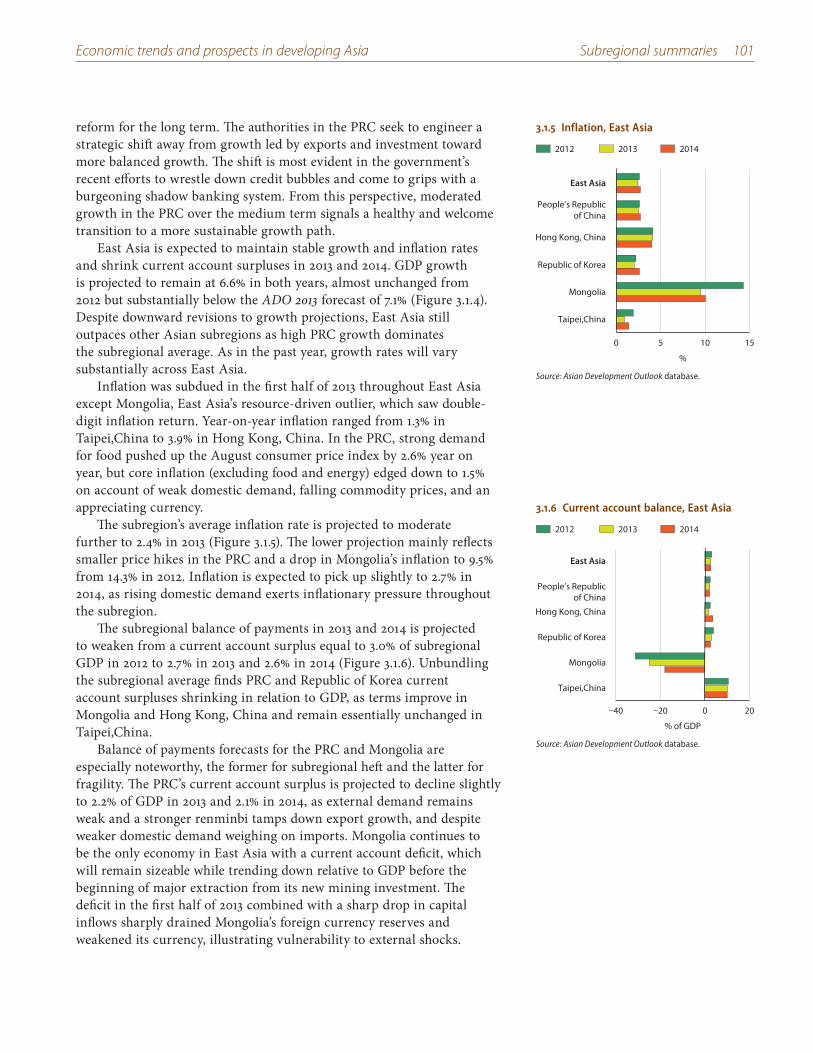
Economic trends and prospects in developing Asia Subregional summaries 101
reform for the long term. The authorities in the PRC seek to engineer a strategic shift away from growth led by exports and investment toward more balanced growth. The shift is most evident in the government’s recent efforts to wrestle down credit bubbles and come to grips with a burgeoning shadow banking system. From this perspective, moderated growth in the PRC over the medium term signals a healthy and welcome transition to a more sustainable growth path.
East Asia is expected to maintain stable growth and inflation rates and shrink current account surpluses in 2013 and 2014. GDP growth is projected to remain at 6.6% in both years, almost unchanged from 2012 but substantially below the ADO 2013 forecast of 7.1% (Figure 3.1.4). Despite downward revisions to growth projections, East Asia still outpaces other Asian subregions as high PRC growth dominates the subregional average. As in the past year, growth rates will vary substantially across East Asia.
Inflation was subdued in the first half of 2013 throughout East Asia except Mongolia, East Asia’s resource-driven outlier, which saw double-digit inflation return. Year-on-year inflation ranged from 1.3% in Taipei,China to 3.9% in Hong Kong, China. In the PRC, strong demand for food pushed up the August consumer price index by 2.6% year on year, but core inflation (excluding food and energy) edged down to 1.5% on account of weak domestic demand, falling commodity prices, and an appreciating currency.
The subregion’s average inflation rate is projected to moderate further to 2.4% in 2013 (Figure 3.1.5). The lower projection mainly reflects smaller price hikes in the PRC and a drop in Mongolia’s inflation to 9.5% from 14.3% in 2012. Inflation is expected to pick up slightly to 2.7% in 2014, as rising domestic demand exerts inflationary pressure throughout the subregion.
The subregional balance of payments in 2013 and 2014 is projected to weaken from a current account surplus equal to 3.0% of subregional GDP in 2012 to 2.7% in 2013 and 2.6% in 2014 (Figure 3.1.6). Unbundling the subregional average finds PRC and Republic of Korea current account surpluses shrinking in relation to GDP, as terms improve in Mongolia and Hong Kong, China and remain essentially unchanged in Taipei,China.
Balance of payments forecasts for the PRC and Mongolia are especially noteworthy, the former for subregional heft and the latter for fragility. The PRC’s current account surplus is projected to decline slightly to 2.2% of GDP in 2013 and 2.1% in 2014, as external demand remains weak and a stronger renminbi tamps down export growth, and despite weaker domestic demand weighing on imports. Mongolia continues to be the only economy in East Asia with a current account deficit, which will remain sizeable while trending down relative to GDP before the beginning of major extraction from its new mining investment. The deficit in the first half of 2013 combined with a sharp drop in capital inflows sharply drained Mongolia’s foreign currency reserves and weakened its currency, illustrating vulnerability to external shocks.
3.1.5 Inflation, East Asia
2012 2013 2014
0 5 10 15
Taipei,China
Mongolia
Republic of Korea
Hong Kong, China
People’s Republicof China
East Asia
%
Source: Asian Development Outlook database.
3.1.6 Current account balance, East Asia
2012 2013 2014
–40 –20 0 20
Taipei,China
Mongolia
Republic of Korea
Hong Kong, China
People’s Republicof China
East Asia
% of GDP
Source: Asian Development Outlook database.
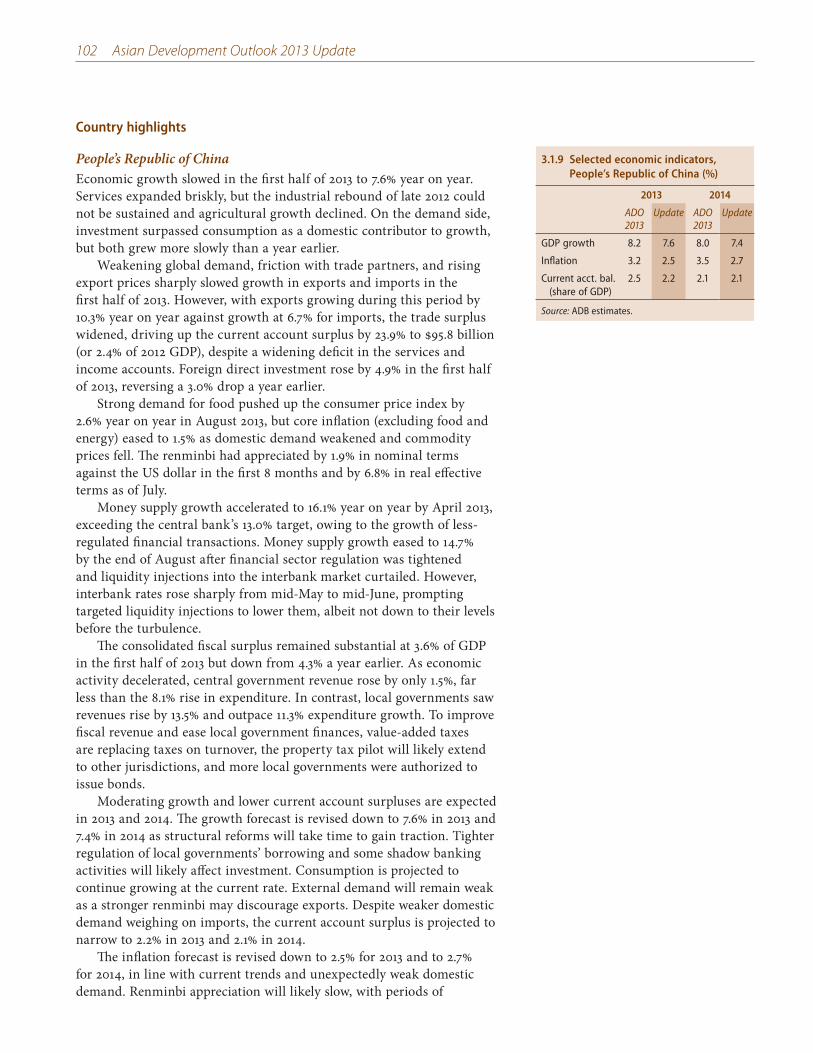
102 Asian Development Outlook 2013 Update
Country highlights
People’s Republic of ChinaEconomic growth slowed in the first half of 2013 to 7.6% year on year. Services expanded briskly, but the industrial rebound of late 2012 could not be sustained and agricultural growth declined. On the demand side, investment surpassed consumption as a domestic contributor to growth, but both grew more slowly than a year earlier.
Weakening global demand, friction with trade partners, and rising export prices sharply slowed growth in exports and imports in the first half of 2013. However, with exports growing during this period by 10.3% year on year against growth at 6.7% for imports, the trade surplus widened, driving up the current account surplus by 23.9% to $95.8 billion (or 2.4% of 2012 GDP), despite a widening deficit in the services and income accounts. Foreign direct investment rose by 4.9% in the first half of 2013, reversing a 3.0% drop a year earlier.
Strong demand for food pushed up the consumer price index by 2.6% year on year in August 2013, but core inflation (excluding food and energy) eased to 1.5% as domestic demand weakened and commodity prices fell. The renminbi had appreciated by 1.9% in nominal terms against the US dollar in the first 8 months and by 6.8% in real effective terms as of July.
Money supply growth accelerated to 16.1% year on year by April 2013, exceeding the central bank’s 13.0% target, owing to the growth of less-regulated financial transactions. Money supply growth eased to 14.7% by the end of August after financial sector regulation was tightened and liquidity injections into the interbank market curtailed. However, interbank rates rose sharply from mid-May to mid-June, prompting targeted liquidity injections to lower them, albeit not down to their levels before the turbulence.
The consolidated fiscal surplus remained substantial at 3.6% of GDP in the first half of 2013 but down from 4.3% a year earlier. As economic activity decelerated, central government revenue rose by only 1.5%, far less than the 8.1% rise in expenditure. In contrast, local governments saw revenues rise by 13.5% and outpace 11.3% expenditure growth. To improve fiscal revenue and ease local government finances, value-added taxes are replacing taxes on turnover, the property tax pilot will likely extend to other jurisdictions, and more local governments were authorized to issue bonds.
Moderating growth and lower current account surpluses are expected in 2013 and 2014. The growth forecast is revised down to 7.6% in 2013 and 7.4% in 2014 as structural reforms will take time to gain traction. Tighter regulation of local governments’ borrowing and some shadow banking activities will likely affect investment. Consumption is projected to continue growing at the current rate. External demand will remain weak as a stronger renminbi may discourage exports. Despite weaker domestic demand weighing on imports, the current account surplus is projected to narrow to 2.2% in 2013 and 2.1% in 2014.
The inflation forecast is revised down to 2.5% for 2013 and to 2.7% for 2014, in line with current trends and unexpectedly weak domestic demand. Renminbi appreciation will likely slow, with periods of
3.1.9 Selected economic indicators, People’s Republic of China (%)
2013 2014
ADO 2013
Update ADO 2013
Update
GDP growth 8.2 7.6 8.0 7.4
Inflation 3.2 2.5 3.5 2.7
Current acct. bal. (share of GDP)
2.5 2.2 2.1 2.1
Source: ADB estimates.
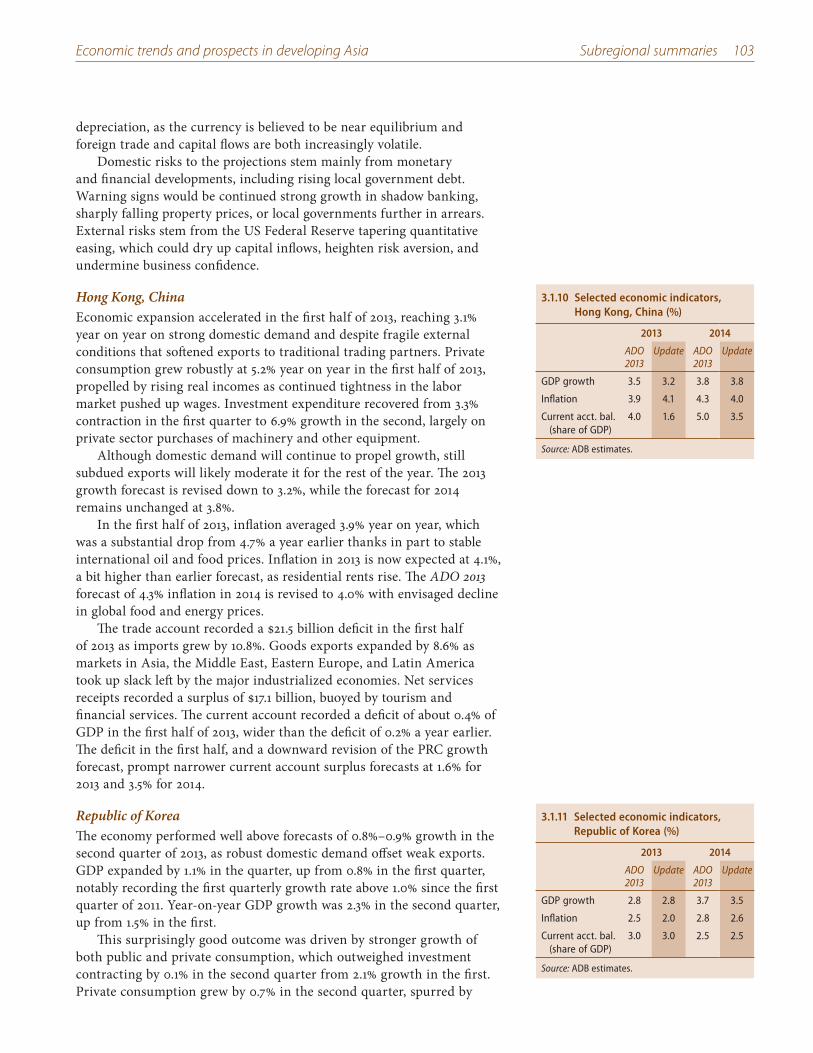
Economic trends and prospects in developing Asia Subregional summaries 103
depreciation, as the currency is believed to be near equilibrium and foreign trade and capital flows are both increasingly volatile.
Domestic risks to the projections stem mainly from monetary and financial developments, including rising local government debt. Warning signs would be continued strong growth in shadow banking, sharply falling property prices, or local governments further in arrears. External risks stem from the US Federal Reserve tapering quantitative easing, which could dry up capital inflows, heighten risk aversion, and undermine business confidence.
Hong Kong, ChinaEconomic expansion accelerated in the first half of 2013, reaching 3.1% year on year on strong domestic demand and despite fragile external conditions that softened exports to traditional trading partners. Private consumption grew robustly at 5.2% year on year in the first half of 2013, propelled by rising real incomes as continued tightness in the labor market pushed up wages. Investment expenditure recovered from 3.3% contraction in the first quarter to 6.9% growth in the second, largely on private sector purchases of machinery and other equipment.
Although domestic demand will continue to propel growth, still subdued exports will likely moderate it for the rest of the year. The 2013 growth forecast is revised down to 3.2%, while the forecast for 2014 remains unchanged at 3.8%.
In the first half of 2013, inflation averaged 3.9% year on year, which was a substantial drop from 4.7% a year earlier thanks in part to stable international oil and food prices. Inflation in 2013 is now expected at 4.1%, a bit higher than earlier forecast, as residential rents rise. The ADO 2013 forecast of 4.3% inflation in 2014 is revised to 4.0% with envisaged decline in global food and energy prices.
The trade account recorded a $21.5 billion deficit in the first half of 2013 as imports grew by 10.8%. Goods exports expanded by 8.6% as markets in Asia, the Middle East, Eastern Europe, and Latin America took up slack left by the major industrialized economies. Net services receipts recorded a surplus of $17.1 billion, buoyed by tourism and financial services. The current account recorded a deficit of about 0.4% of GDP in the first half of 2013, wider than the deficit of 0.2% a year earlier. The deficit in the first half, and a downward revision of the PRC growth forecast, prompt narrower current account surplus forecasts at 1.6% for 2013 and 3.5% for 2014.
Republic of KoreaThe economy performed well above forecasts of 0.8%–0.9% growth in the second quarter of 2013, as robust domestic demand offset weak exports. GDP expanded by 1.1% in the quarter, up from 0.8% in the first quarter, notably recording the first quarterly growth rate above 1.0% since the first quarter of 2011. Year-on-year GDP growth was 2.3% in the second quarter, up from 1.5% in the first.
This surprisingly good outcome was driven by stronger growth of both public and private consumption, which outweighed investment contracting by 0.1% in the second quarter from 2.1% growth in the first. Private consumption grew by 0.7% in the second quarter, spurred by
3.1.10 Selected economic indicators, Hong Kong, China (%)
2013 2014
ADO 2013
Update ADO 2013
Update
GDP growth 3.5 3.2 3.8 3.8
Inflation 3.9 4.1 4.3 4.0
Current acct. bal. (share of GDP)
4.0 1.6 5.0 3.5
Source: ADB estimates.
3.1.11 Selected economic indicators, Republic of Korea (%)
2013 2014
ADO 2013
Update ADO 2013
Update
GDP growth 2.8 2.8 3.7 3.5
Inflation 2.5 2.0 2.8 2.6
Current acct. bal. (share of GDP)
3.0 3.0 2.5 2.5
Source: ADB estimates.
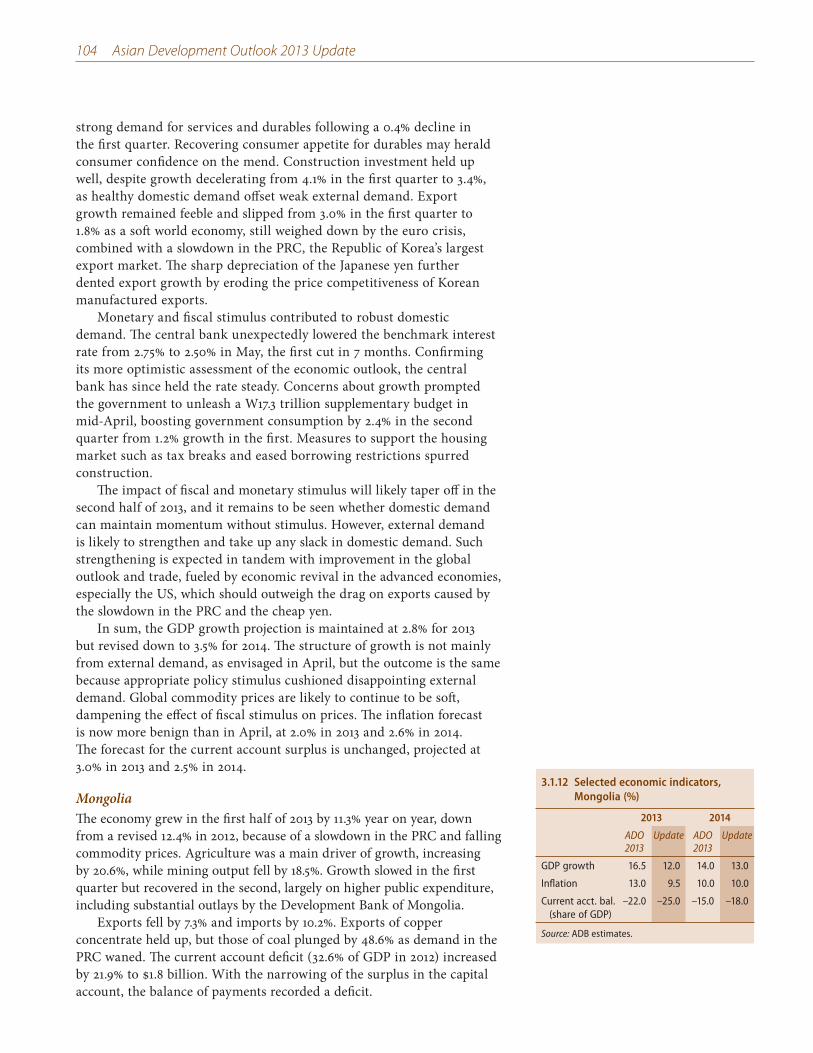
104 Asian Development Outlook 2013 Update
strong demand for services and durables following a 0.4% decline in the first quarter. Recovering consumer appetite for durables may herald consumer confidence on the mend. Construction investment held up well, despite growth decelerating from 4.1% in the first quarter to 3.4%, as healthy domestic demand offset weak external demand. Export growth remained feeble and slipped from 3.0% in the first quarter to 1.8% as a soft world economy, still weighed down by the euro crisis, combined with a slowdown in the PRC, the Republic of Korea’s largest export market. The sharp depreciation of the Japanese yen further dented export growth by eroding the price competitiveness of Korean manufactured exports.
Monetary and fiscal stimulus contributed to robust domestic demand. The central bank unexpectedly lowered the benchmark interest rate from 2.75% to 2.50% in May, the first cut in 7 months. Confirming its more optimistic assessment of the economic outlook, the central bank has since held the rate steady. Concerns about growth prompted the government to unleash a W17.3 trillion supplementary budget in mid-April, boosting government consumption by 2.4% in the second quarter from 1.2% growth in the first. Measures to support the housing market such as tax breaks and eased borrowing restrictions spurred construction.
The impact of fiscal and monetary stimulus will likely taper off in the second half of 2013, and it remains to be seen whether domestic demand can maintain momentum without stimulus. However, external demand is likely to strengthen and take up any slack in domestic demand. Such strengthening is expected in tandem with improvement in the global outlook and trade, fueled by economic revival in the advanced economies, especially the US, which should outweigh the drag on exports caused by the slowdown in the PRC and the cheap yen.
In sum, the GDP growth projection is maintained at 2.8% for 2013 but revised down to 3.5% for 2014. The structure of growth is not mainly from external demand, as envisaged in April, but the outcome is the same because appropriate policy stimulus cushioned disappointing external demand. Global commodity prices are likely to continue to be soft, dampening the effect of fiscal stimulus on prices. The inflation forecast is now more benign than in April, at 2.0% in 2013 and 2.6% in 2014. The forecast for the current account surplus is unchanged, projected at 3.0% in 2013 and 2.5% in 2014.
MongoliaThe economy grew in the first half of 2013 by 11.3% year on year, down from a revised 12.4% in 2012, because of a slowdown in the PRC and falling commodity prices. Agriculture was a main driver of growth, increasing by 20.6%, while mining output fell by 18.5%. Growth slowed in the first quarter but recovered in the second, largely on higher public expenditure, including substantial outlays by the Development Bank of Mongolia.
Exports fell by 7.3% and imports by 10.2%. Exports of copper concentrate held up, but those of coal plunged by 48.6% as demand in the PRC waned. The current account deficit (32.6% of GDP in 2012) increased by 21.9% to $1.8 billion. With the narrowing of the surplus in the capital account, the balance of payments recorded a deficit.
3.1.12 Selected economic indicators, Mongolia (%)
2013 2014
ADO 2013
Update ADO 2013
Update
GDP growth 16.5 12.0 14.0 13.0
Inflation 13.0 9.5 10.0 10.0
Current acct. bal. (share of GDP)
–22.0 –25.0 –15.0 –18.0
Source: ADB estimates.
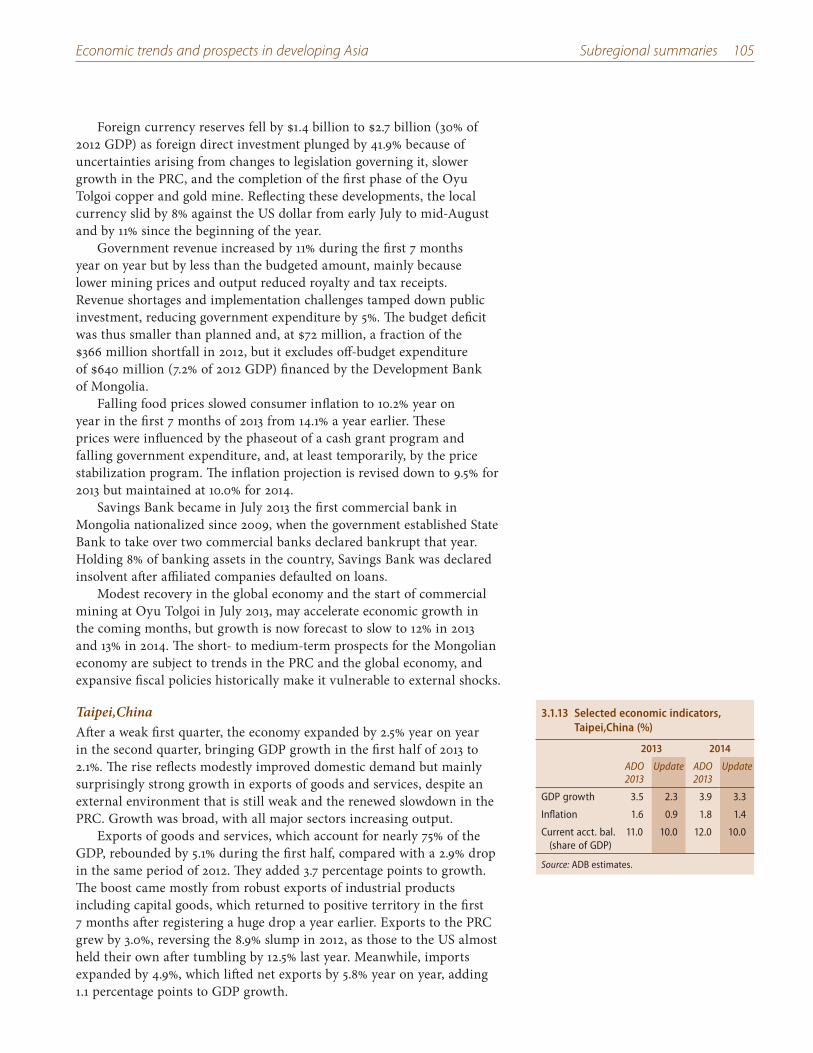
Economic trends and prospects in developing Asia Subregional summaries 105
Foreign currency reserves fell by $1.4 billion to $2.7 billion (30% of 2012 GDP) as foreign direct investment plunged by 41.9% because of uncertainties arising from changes to legislation governing it, slower growth in the PRC, and the completion of the first phase of the Oyu Tolgoi copper and gold mine. Reflecting these developments, the local currency slid by 8% against the US dollar from early July to mid-August and by 11% since the beginning of the year.
Government revenue increased by 11% during the first 7 months year on year but by less than the budgeted amount, mainly because lower mining prices and output reduced royalty and tax receipts. Revenue shortages and implementation challenges tamped down public investment, reducing government expenditure by 5%. The budget deficit was thus smaller than planned and, at $72 million, a fraction of the $366 million shortfall in 2012, but it excludes off-budget expenditure of $640 million (7.2% of 2012 GDP) financed by the Development Bank of Mongolia.
Falling food prices slowed consumer inflation to 10.2% year on year in the first 7 months of 2013 from 14.1% a year earlier. These prices were influenced by the phaseout of a cash grant program and falling government expenditure, and, at least temporarily, by the price stabilization program. The inflation projection is revised down to 9.5% for 2013 but maintained at 10.0% for 2014.
Savings Bank became in July 2013 the first commercial bank in Mongolia nationalized since 2009, when the government established State Bank to take over two commercial banks declared bankrupt that year. Holding 8% of banking assets in the country, Savings Bank was declared insolvent after affiliated companies defaulted on loans.
Modest recovery in the global economy and the start of commercial mining at Oyu Tolgoi in July 2013, may accelerate economic growth in the coming months, but growth is now forecast to slow to 12% in 2013 and 13% in 2014. The short- to medium-term prospects for the Mongolian economy are subject to trends in the PRC and the global economy, and expansive fiscal policies historically make it vulnerable to external shocks.
Taipei,ChinaAfter a weak first quarter, the economy expanded by 2.5% year on year in the second quarter, bringing GDP growth in the first half of 2013 to 2.1%. The rise reflects modestly improved domestic demand but mainly surprisingly strong growth in exports of goods and services, despite an external environment that is still weak and the renewed slowdown in the PRC. Growth was broad, with all major sectors increasing output.
Exports of goods and services, which account for nearly 75% of the GDP, rebounded by 5.1% during the first half, compared with a 2.9% drop in the same period of 2012. They added 3.7 percentage points to growth. The boost came mostly from robust exports of industrial products including capital goods, which returned to positive territory in the first 7 months after registering a huge drop a year earlier. Exports to the PRC grew by 3.0%, reversing the 8.9% slump in 2012, as those to the US almost held their own after tumbling by 12.5% last year. Meanwhile, imports expanded by 4.9%, which lifted net exports by 5.8% year on year, adding 1.1 percentage points to GDP growth.
3.1.13 Selected economic indicators, Taipei,China (%)
2013 2014
ADO 2013
Update ADO 2013
Update
GDP growth 3.5 2.3 3.9 3.3
Inflation 1.6 0.9 1.8 1.4
Current acct. bal. (share of GDP)
11.0 10.0 12.0 10.0
Source: ADB estimates.
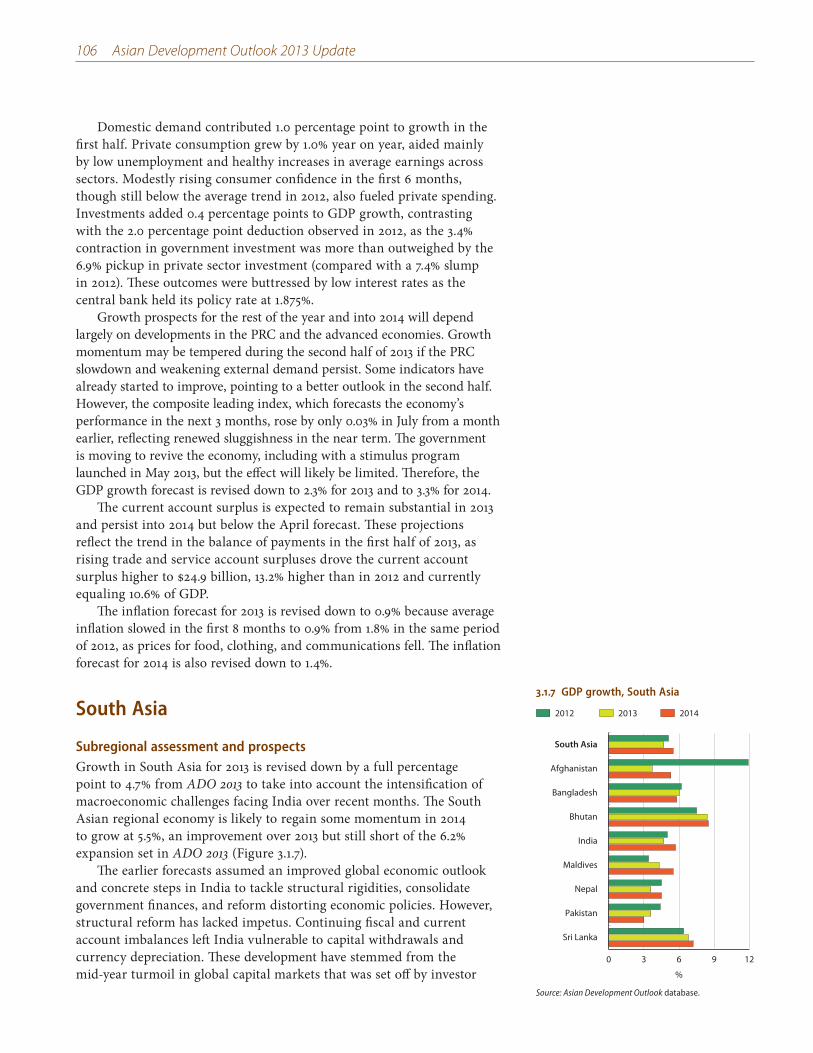
106 Asian Development Outlook 2013 Update
Domestic demand contributed 1.0 percentage point to growth in the first half. Private consumption grew by 1.0% year on year, aided mainly by low unemployment and healthy increases in average earnings across sectors. Modestly rising consumer confidence in the first 6 months, though still below the average trend in 2012, also fueled private spending. Investments added 0.4 percentage points to GDP growth, contrasting with the 2.0 percentage point deduction observed in 2012, as the 3.4% contraction in government investment was more than outweighed by the 6.9% pickup in private sector investment (compared with a 7.4% slump in 2012). These outcomes were buttressed by low interest rates as the central bank held its policy rate at 1.875%.
Growth prospects for the rest of the year and into 2014 will depend largely on developments in the PRC and the advanced economies. Growth momentum may be tempered during the second half of 2013 if the PRC slowdown and weakening external demand persist. Some indicators have already started to improve, pointing to a better outlook in the second half. However, the composite leading index, which forecasts the economy’s performance in the next 3 months, rose by only 0.03% in July from a month earlier, reflecting renewed sluggishness in the near term. The government is moving to revive the economy, including with a stimulus program launched in May 2013, but the effect will likely be limited. Therefore, the GDP growth forecast is revised down to 2.3% for 2013 and to 3.3% for 2014.
The current account surplus is expected to remain substantial in 2013 and persist into 2014 but below the April forecast. These projections reflect the trend in the balance of payments in the first half of 2013, as rising trade and service account surpluses drove the current account surplus higher to $24.9 billion, 13.2% higher than in 2012 and currently equaling 10.6% of GDP.
The inflation forecast for 2013 is revised down to 0.9% because average inflation slowed in the first 8 months to 0.9% from 1.8% in the same period of 2012, as prices for food, clothing, and communications fell. The inflation forecast for 2014 is also revised down to 1.4%.
South Asia
Subregional assessment and prospectsGrowth in South Asia for 2013 is revised down by a full percentage point to 4.7% from ADO 2013 to take into account the intensification of macroeconomic challenges facing India over recent months. The South Asian regional economy is likely to regain some momentum in 2014 to grow at 5.5%, an improvement over 2013 but still short of the 6.2% expansion set in ADO 2013 (Figure 3.1.7).
The earlier forecasts assumed an improved global economic outlook and concrete steps in India to tackle structural rigidities, consolidate government finances, and reform distorting economic policies. However, structural reform has lacked impetus. Continuing fiscal and current account imbalances left India vulnerable to capital withdrawals and currency depreciation. These development have stemmed from the mid-year turmoil in global capital markets that was set off by investor
3.1.7 GDP growth, South Asia
2012 2013 2014
%
0 3 6 9 12
Sri Lanka
Pakistan
Nepal
Maldives
India
Bhutan
Bangladesh
Afghanistan
South Asia
Source: Asian Development Outlook database.
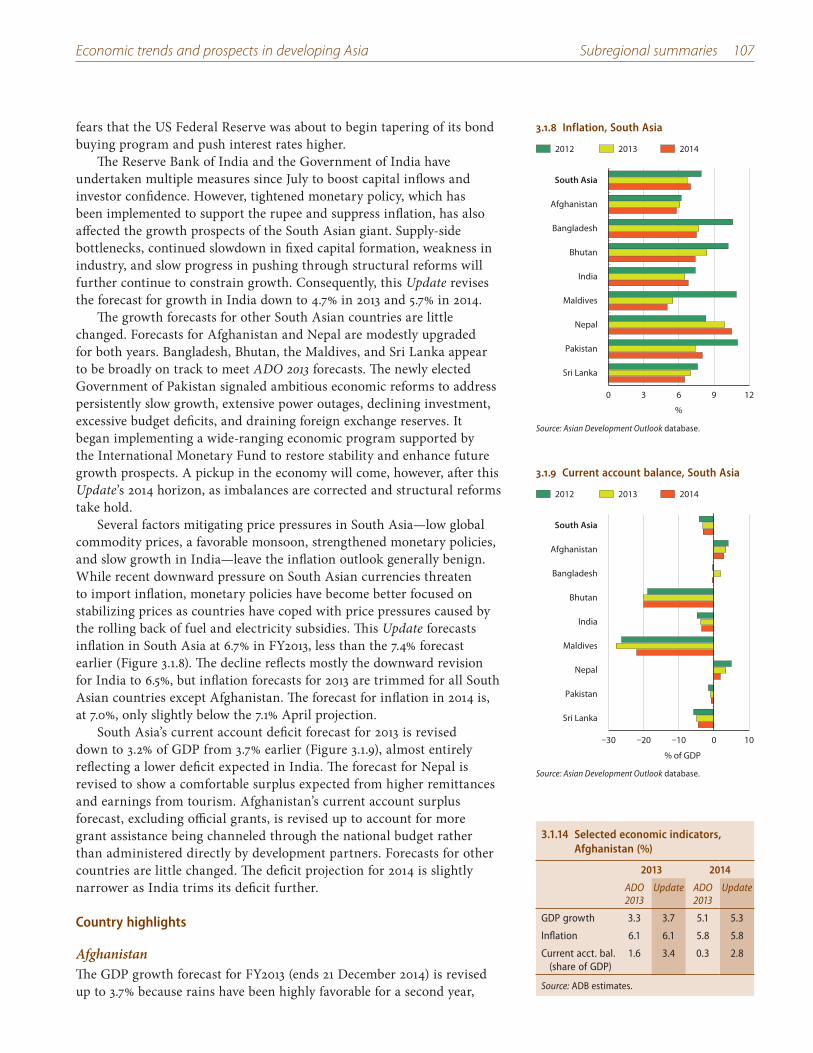
Economic trends and prospects in developing Asia Subregional summaries 107
fears that the US Federal Reserve was about to begin tapering of its bond buying program and push interest rates higher.
The Reserve Bank of India and the Government of India have undertaken multiple measures since July to boost capital inflows and investor confidence. However, tightened monetary policy, which has been implemented to support the rupee and suppress inflation, has also affected the growth prospects of the South Asian giant. Supply-side bottlenecks, continued slowdown in fixed capital formation, weakness in industry, and slow progress in pushing through structural reforms will further continue to constrain growth. Consequently, this Update revises the forecast for growth in India down to 4.7% in 2013 and 5.7% in 2014.
The growth forecasts for other South Asian countries are little changed. Forecasts for Afghanistan and Nepal are modestly upgraded for both years. Bangladesh, Bhutan, the Maldives, and Sri Lanka appear to be broadly on track to meet ADO 2013 forecasts. The newly elected Government of Pakistan signaled ambitious economic reforms to address persistently slow growth, extensive power outages, declining investment, excessive budget deficits, and draining foreign exchange reserves. It began implementing a wide-ranging economic program supported by the International Monetary Fund to restore stability and enhance future growth prospects. A pickup in the economy will come, however, after this Update’s 2014 horizon, as imbalances are corrected and structural reforms take hold.
Several factors mitigating price pressures in South Asia—low global commodity prices, a favorable monsoon, strengthened monetary policies, and slow growth in India—leave the inflation outlook generally benign. While recent downward pressure on South Asian currencies threaten to import inflation, monetary policies have become better focused on stabilizing prices as countries have coped with price pressures caused by the rolling back of fuel and electricity subsidies. This Update forecasts inflation in South Asia at 6.7% in FY2013, less than the 7.4% forecast earlier (Figure 3.1.8). The decline reflects mostly the downward revision for India to 6.5%, but inflation forecasts for 2013 are trimmed for all South Asian countries except Afghanistan. The forecast for inflation in 2014 is, at 7.0%, only slightly below the 7.1% April projection.
South Asia’s current account deficit forecast for 2013 is revised down to 3.2% of GDP from 3.7% earlier (Figure 3.1.9), almost entirely reflecting a lower deficit expected in India. The forecast for Nepal is revised to show a comfortable surplus expected from higher remittances and earnings from tourism. Afghanistan’s current account surplus forecast, excluding official grants, is revised up to account for more grant assistance being channeled through the national budget rather than administered directly by development partners. Forecasts for other countries are little changed. The deficit projection for 2014 is slightly narrower as India trims its deficit further.
Country highlights
AfghanistanThe GDP growth forecast for FY2013 (ends 21 December 2014) is revised up to 3.7% because rains have been highly favorable for a second year,
3.1.8 Inflation, South Asia
2012 2013 2014
Sri Lanka
Pakistan
Nepal
Maldives
India
Bhutan
Bangladesh
Afghanistan
South Asia
0 3 6 9 12
%
Source: Asian Development Outlook database.
3.1.9 Current account balance, South Asia
2012 2013 2014
Sri Lanka
Pakistan
Nepal
Maldives
India
Bhutan
Bangladesh
Afghanistan
South Asia
–30 –20 –10 0 10
% of GDP
Source: Asian Development Outlook database.
3.1.14 Selected economic indicators, Afghanistan (%)
2013 2014
ADO 2013
Update ADO 2013
Update
GDP growth 3.3 3.7 5.1 5.3
Inflation 6.1 6.1 5.8 5.8
Current acct. bal. (share of GDP)
1.6 3.4 0.3 2.8
Source: ADB estimates.
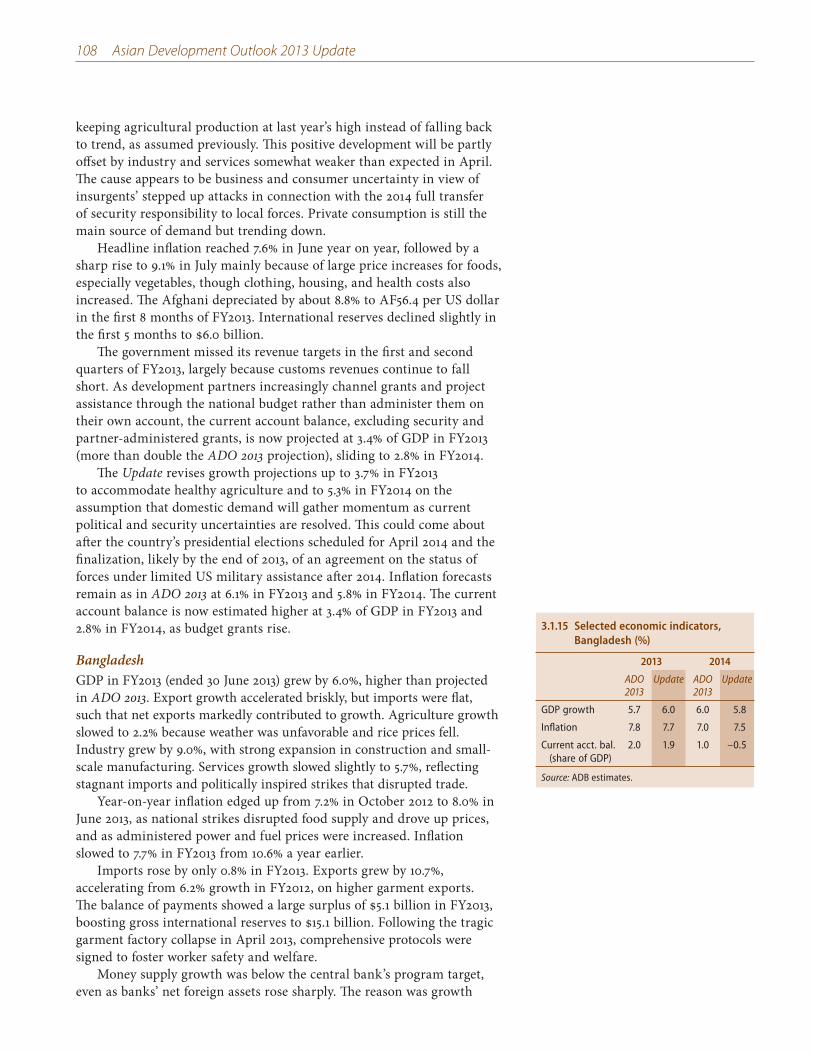
108 Asian Development Outlook 2013 Update
keeping agricultural production at last year’s high instead of falling back to trend, as assumed previously. This positive development will be partly offset by industry and services somewhat weaker than expected in April. The cause appears to be business and consumer uncertainty in view of insurgents’ stepped up attacks in connection with the 2014 full transfer of security responsibility to local forces. Private consumption is still the main source of demand but trending down.
Headline inflation reached 7.6% in June year on year, followed by a sharp rise to 9.1% in July mainly because of large price increases for foods, especially vegetables, though clothing, housing, and health costs also increased. The Afghani depreciated by about 8.8% to AF56.4 per US dollar in the first 8 months of FY2013. International reserves declined slightly in the first 5 months to $6.0 billion.
The government missed its revenue targets in the first and second quarters of FY2013, largely because customs revenues continue to fall short. As development partners increasingly channel grants and project assistance through the national budget rather than administer them on their own account, the current account balance, excluding security and partner-administered grants, is now projected at 3.4% of GDP in FY2013 (more than double the ADO 2013 projection), sliding to 2.8% in FY2014.
The Update revises growth projections up to 3.7% in FY2013 to accommodate healthy agriculture and to 5.3% in FY2014 on the assumption that domestic demand will gather momentum as current political and security uncertainties are resolved. This could come about after the country’s presidential elections scheduled for April 2014 and the finalization, likely by the end of 2013, of an agreement on the status of forces under limited US military assistance after 2014. Inflation forecasts remain as in ADO 2013 at 6.1% in FY2013 and 5.8% in FY2014. The current account balance is now estimated higher at 3.4% of GDP in FY2013 and 2.8% in FY2014, as budget grants rise.
BangladeshGDP in FY2013 (ended 30 June 2013) grew by 6.0%, higher than projected in ADO 2013. Export growth accelerated briskly, but imports were flat, such that net exports markedly contributed to growth. Agriculture growth slowed to 2.2% because weather was unfavorable and rice prices fell. Industry grew by 9.0%, with strong expansion in construction and small-scale manufacturing. Services growth slowed slightly to 5.7%, reflecting stagnant imports and politically inspired strikes that disrupted trade.
Year-on-year inflation edged up from 7.2% in October 2012 to 8.0% in June 2013, as national strikes disrupted food supply and drove up prices, and as administered power and fuel prices were increased. Inflation slowed to 7.7% in FY2013 from 10.6% a year earlier.
Imports rose by only 0.8% in FY2013. Exports grew by 10.7%, accelerating from 6.2% growth in FY2012, on higher garment exports. The balance of payments showed a large surplus of $5.1 billion in FY2013, boosting gross international reserves to $15.1 billion. Following the tragic garment factory collapse in April 2013, comprehensive protocols were signed to foster worker safety and welfare.
Money supply growth was below the central bank’s program target, even as banks’ net foreign assets rose sharply. The reason was growth
3.1.15 Selected economic indicators, Bangladesh (%)
2013 2014
ADO 2013
Update ADO 2013
Update
GDP growth 5.7 6.0 6.0 5.8
Inflation 7.8 7.7 7.0 7.5
Current acct. bal. (share of GDP)
2.0 1.9 1.0 –0.5
Source: ADB estimates.
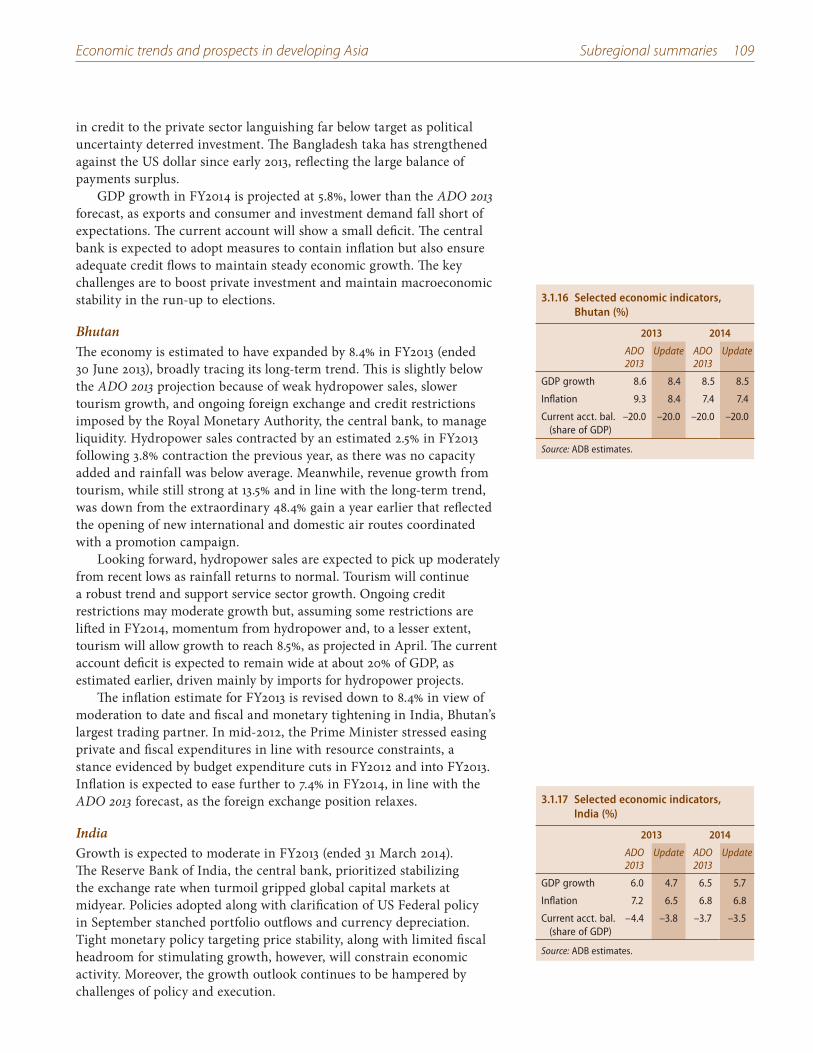
Economic trends and prospects in developing Asia Subregional summaries 109
in credit to the private sector languishing far below target as political uncertainty deterred investment. The Bangladesh taka has strengthened against the US dollar since early 2013, reflecting the large balance of payments surplus.
GDP growth in FY2014 is projected at 5.8%, lower than the ADO 2013 forecast, as exports and consumer and investment demand fall short of expectations. The current account will show a small deficit. The central bank is expected to adopt measures to contain inflation but also ensure adequate credit flows to maintain steady economic growth. The key challenges are to boost private investment and maintain macroeconomic stability in the run-up to elections.
Bhutan The economy is estimated to have expanded by 8.4% in FY2013 (ended 30 June 2013), broadly tracing its long-term trend. This is slightly below the ADO 2013 projection because of weak hydropower sales, slower tourism growth, and ongoing foreign exchange and credit restrictions imposed by the Royal Monetary Authority, the central bank, to manage liquidity. Hydropower sales contracted by an estimated 2.5% in FY2013 following 3.8% contraction the previous year, as there was no capacity added and rainfall was below average. Meanwhile, revenue growth from tourism, while still strong at 13.5% and in line with the long-term trend, was down from the extraordinary 48.4% gain a year earlier that reflected the opening of new international and domestic air routes coordinated with a promotion campaign.
Looking forward, hydropower sales are expected to pick up moderately from recent lows as rainfall returns to normal. Tourism will continue a robust trend and support service sector growth. Ongoing credit restrictions may moderate growth but, assuming some restrictions are lifted in FY2014, momentum from hydropower and, to a lesser extent, tourism will allow growth to reach 8.5%, as projected in April. The current account deficit is expected to remain wide at about 20% of GDP, as estimated earlier, driven mainly by imports for hydropower projects.
The inflation estimate for FY2013 is revised down to 8.4% in view of moderation to date and fiscal and monetary tightening in India, Bhutan’s largest trading partner. In mid-2012, the Prime Minister stressed easing private and fiscal expenditures in line with resource constraints, a stance evidenced by budget expenditure cuts in FY2012 and into FY2013. Inflation is expected to ease further to 7.4% in FY2014, in line with the ADO 2013 forecast, as the foreign exchange position relaxes.
India Growth is expected to moderate in FY2013 (ended 31 March 2014). The Reserve Bank of India, the central bank, prioritized stabilizing the exchange rate when turmoil gripped global capital markets at midyear. Policies adopted along with clarification of US Federal policy in September stanched portfolio outflows and currency depreciation. Tight monetary policy targeting price stability, along with limited fiscal headroom for stimulating growth, however, will constrain economic activity. Moreover, the growth outlook continues to be hampered by challenges of policy and execution.
3.1.16 Selected economic indicators, Bhutan (%)
2013 2014
ADO 2013
Update ADO 2013
Update
GDP growth 8.6 8.4 8.5 8.5
Inflation 9.3 8.4 7.4 7.4
Current acct. bal. (share of GDP)
–20.0 –20.0 –20.0 –20.0
Source: ADB estimates.
3.1.17 Selected economic indicators, India (%)
2013 2014
ADO 2013
Update ADO 2013
Update
GDP growth 6.0 4.7 6.5 5.7
Inflation 7.2 6.5 6.8 6.8
Current acct. bal. (share of GDP)
–4.4 –3.8 –3.7 –3.5
Source: ADB estimates.
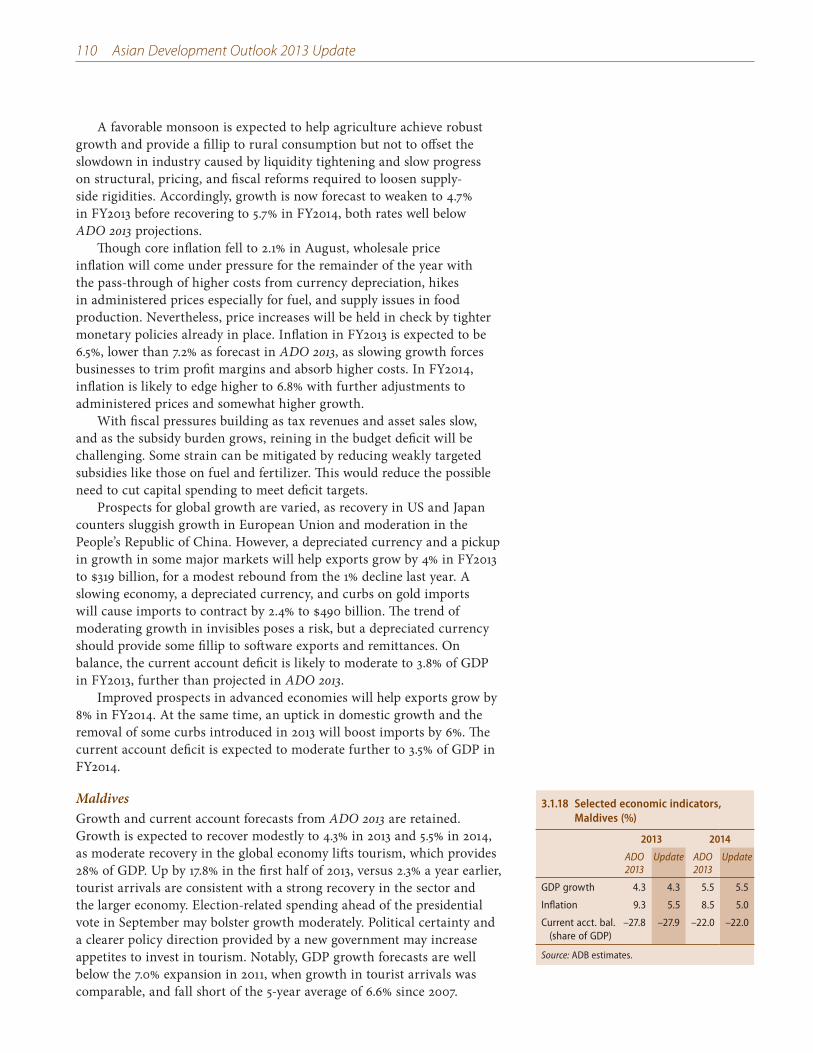
110 Asian Development Outlook 2013 Update
A favorable monsoon is expected to help agriculture achieve robust growth and provide a fillip to rural consumption but not to offset the slowdown in industry caused by liquidity tightening and slow progress on structural, pricing, and fiscal reforms required to loosen supply-side rigidities. Accordingly, growth is now forecast to weaken to 4.7% in FY2013 before recovering to 5.7% in FY2014, both rates well below ADO 2013 projections.
Though core inflation fell to 2.1% in August, wholesale price inflation will come under pressure for the remainder of the year with the pass-through of higher costs from currency depreciation, hikes in administered prices especially for fuel, and supply issues in food production. Nevertheless, price increases will be held in check by tighter monetary policies already in place. Inflation in FY2013 is expected to be 6.5%, lower than 7.2% as forecast in ADO 2013, as slowing growth forces businesses to trim profit margins and absorb higher costs. In FY2014, inflation is likely to edge higher to 6.8% with further adjustments to administered prices and somewhat higher growth.
With fiscal pressures building as tax revenues and asset sales slow, and as the subsidy burden grows, reining in the budget deficit will be challenging. Some strain can be mitigated by reducing weakly targeted subsidies like those on fuel and fertilizer. This would reduce the possible need to cut capital spending to meet deficit targets.
Prospects for global growth are varied, as recovery in US and Japan counters sluggish growth in European Union and moderation in the People’s Republic of China. However, a depreciated currency and a pickup in growth in some major markets will help exports grow by 4% in FY2013 to $319 billion, for a modest rebound from the 1% decline last year. A slowing economy, a depreciated currency, and curbs on gold imports will cause imports to contract by 2.4% to $490 billion. The trend of moderating growth in invisibles poses a risk, but a depreciated currency should provide some fillip to software exports and remittances. On balance, the current account deficit is likely to moderate to 3.8% of GDP in FY2013, further than projected in ADO 2013.
Improved prospects in advanced economies will help exports grow by 8% in FY2014. At the same time, an uptick in domestic growth and the removal of some curbs introduced in 2013 will boost imports by 6%. The current account deficit is expected to moderate further to 3.5% of GDP in FY2014.
Maldives Growth and current account forecasts from ADO 2013 are retained. Growth is expected to recover modestly to 4.3% in 2013 and 5.5% in 2014, as moderate recovery in the global economy lifts tourism, which provides 28% of GDP. Up by 17.8% in the first half of 2013, versus 2.3% a year earlier, tourist arrivals are consistent with a strong recovery in the sector and the larger economy. Election-related spending ahead of the presidential vote in September may bolster growth moderately. Political certainty and a clearer policy direction provided by a new government may increase appetites to invest in tourism. Notably, GDP growth forecasts are well below the 7.0% expansion in 2011, when growth in tourist arrivals was comparable, and fall short of the 5-year average of 6.6% since 2007.
3.1.18 Selected economic indicators, Maldives (%)
2013 2014
ADO 2013
Update ADO 2013
Update
GDP growth 4.3 4.3 5.5 5.5
Inflation 9.3 5.5 8.5 5.0
Current acct. bal. (share of GDP)
–27.8 –27.9 –22.0 –22.0
Source: ADB estimates.
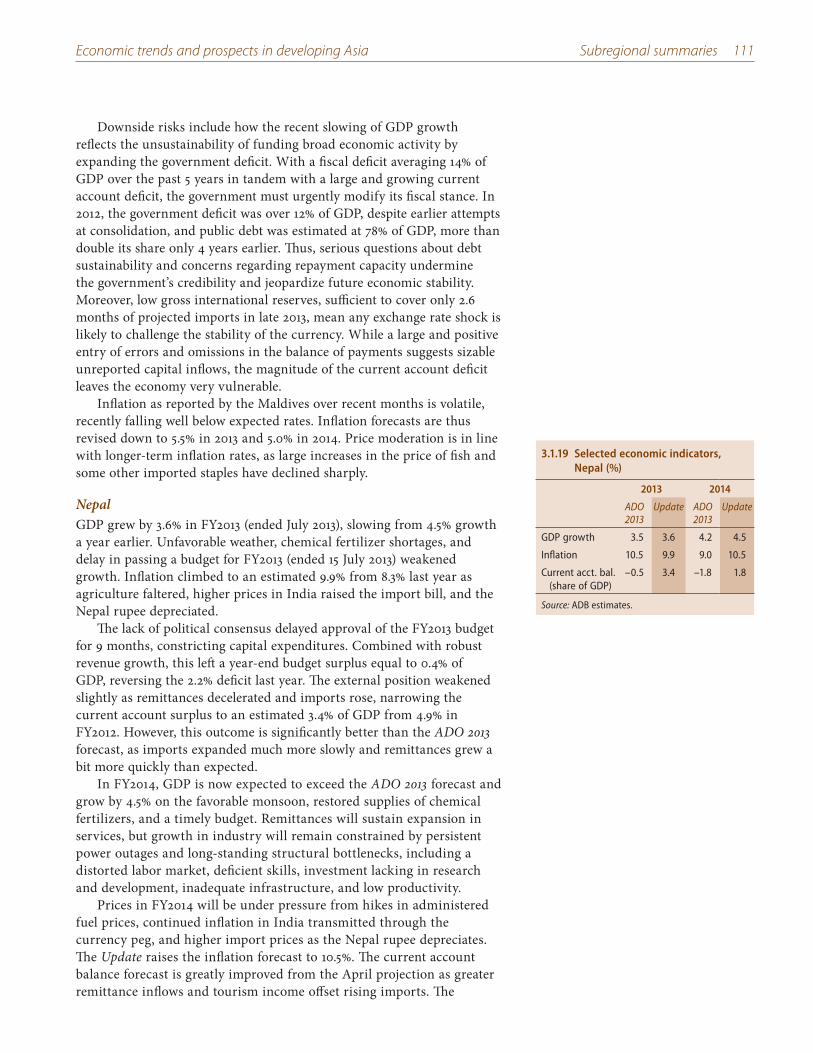
Economic trends and prospects in developing Asia Subregional summaries 111
Downside risks include how the recent slowing of GDP growth reflects the unsustainability of funding broad economic activity by expanding the government deficit. With a fiscal deficit averaging 14% of GDP over the past 5 years in tandem with a large and growing current account deficit, the government must urgently modify its fiscal stance. In 2012, the government deficit was over 12% of GDP, despite earlier attempts at consolidation, and public debt was estimated at 78% of GDP, more than double its share only 4 years earlier. Thus, serious questions about debt sustainability and concerns regarding repayment capacity undermine the government’s credibility and jeopardize future economic stability. Moreover, low gross international reserves, sufficient to cover only 2.6 months of projected imports in late 2013, mean any exchange rate shock is likely to challenge the stability of the currency. While a large and positive entry of errors and omissions in the balance of payments suggests sizable unreported capital inflows, the magnitude of the current account deficit leaves the economy very vulnerable.
Inflation as reported by the Maldives over recent months is volatile, recently falling well below expected rates. Inflation forecasts are thus revised down to 5.5% in 2013 and 5.0% in 2014. Price moderation is in line with longer-term inflation rates, as large increases in the price of fish and some other imported staples have declined sharply.
Nepal GDP grew by 3.6% in FY2013 (ended July 2013), slowing from 4.5% growth a year earlier. Unfavorable weather, chemical fertilizer shortages, and delay in passing a budget for FY2013 (ended 15 July 2013) weakened growth. Inflation climbed to an estimated 9.9% from 8.3% last year as agriculture faltered, higher prices in India raised the import bill, and the Nepal rupee depreciated.
The lack of political consensus delayed approval of the FY2013 budget for 9 months, constricting capital expenditures. Combined with robust revenue growth, this left a year-end budget surplus equal to 0.4% of GDP, reversing the 2.2% deficit last year. The external position weakened slightly as remittances decelerated and imports rose, narrowing the current account surplus to an estimated 3.4% of GDP from 4.9% in FY2012. However, this outcome is significantly better than the ADO 2013 forecast, as imports expanded much more slowly and remittances grew a bit more quickly than expected.
In FY2014, GDP is now expected to exceed the ADO 2013 forecast and grow by 4.5% on the favorable monsoon, restored supplies of chemical fertilizers, and a timely budget. Remittances will sustain expansion in services, but growth in industry will remain constrained by persistent power outages and long-standing structural bottlenecks, including a distorted labor market, deficient skills, investment lacking in research and development, inadequate infrastructure, and low productivity.
Prices in FY2014 will be under pressure from hikes in administered fuel prices, continued inflation in India transmitted through the currency peg, and higher import prices as the Nepal rupee depreciates. The Update raises the inflation forecast to 10.5%. The current account balance forecast is greatly improved from the April projection as greater remittance inflows and tourism income offset rising imports. The
3.1.19 Selected economic indicators, Nepal (%)
2013 2014
ADO 2013
Update ADO 2013
Update
GDP growth 3.5 3.6 4.2 4.5
Inflation 10.5 9.9 9.0 10.5
Current acct. bal. (share of GDP)
–0.5 3.4 –1.8 1.8
Source: ADB estimates.
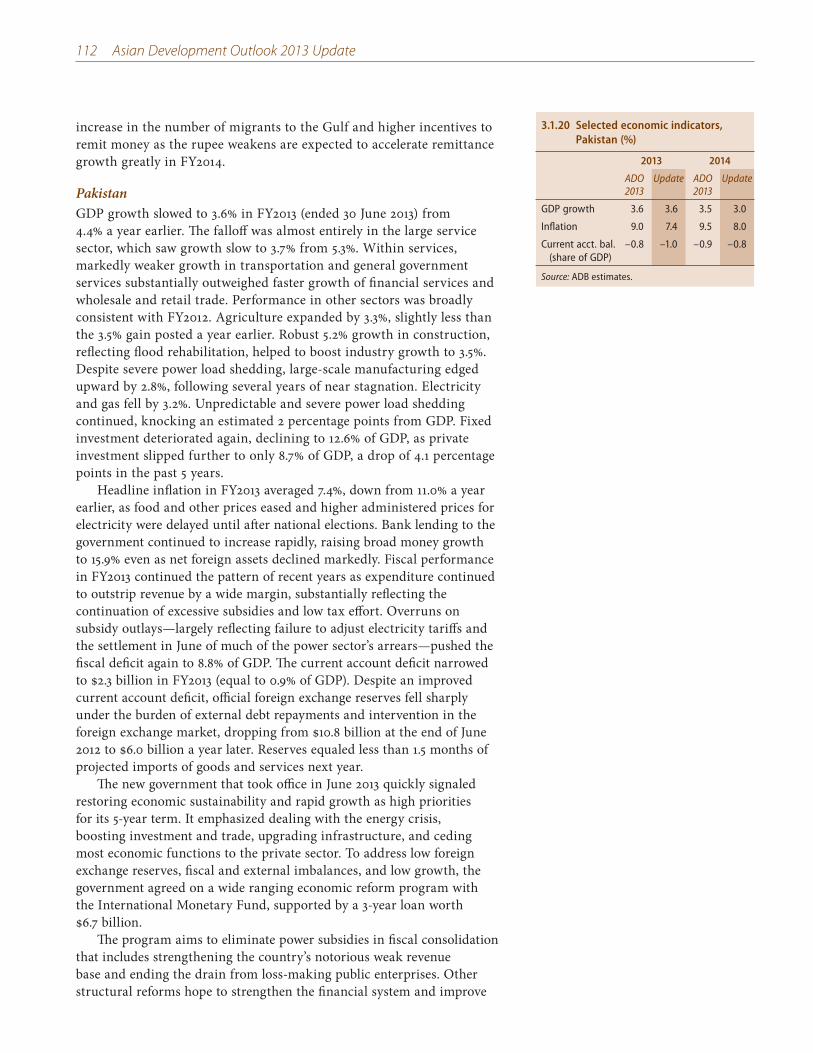
112 Asian Development Outlook 2013 Update
increase in the number of migrants to the Gulf and higher incentives to remit money as the rupee weakens are expected to accelerate remittance growth greatly in FY2014.
PakistanGDP growth slowed to 3.6% in FY2013 (ended 30 June 2013) from 4.4% a year earlier. The falloff was almost entirely in the large service sector, which saw growth slow to 3.7% from 5.3%. Within services, markedly weaker growth in transportation and general government services substantially outweighed faster growth of financial services and wholesale and retail trade. Performance in other sectors was broadly consistent with FY2012. Agriculture expanded by 3.3%, slightly less than the 3.5% gain posted a year earlier. Robust 5.2% growth in construction, reflecting flood rehabilitation, helped to boost industry growth to 3.5%. Despite severe power load shedding, large-scale manufacturing edged upward by 2.8%, following several years of near stagnation. Electricity and gas fell by 3.2%. Unpredictable and severe power load shedding continued, knocking an estimated 2 percentage points from GDP. Fixed investment deteriorated again, declining to 12.6% of GDP, as private investment slipped further to only 8.7% of GDP, a drop of 4.1 percentage points in the past 5 years.
Headline inflation in FY2013 averaged 7.4%, down from 11.0% a year earlier, as food and other prices eased and higher administered prices for electricity were delayed until after national elections. Bank lending to the government continued to increase rapidly, raising broad money growth to 15.9% even as net foreign assets declined markedly. Fiscal performance in FY2013 continued the pattern of recent years as expenditure continued to outstrip revenue by a wide margin, substantially reflecting the continuation of excessive subsidies and low tax effort. Overruns on subsidy outlays—largely reflecting failure to adjust electricity tariffs and the settlement in June of much of the power sector’s arrears—pushed the fiscal deficit again to 8.8% of GDP. The current account deficit narrowed to $2.3 billion in FY2013 (equal to 0.9% of GDP). Despite an improved current account deficit, official foreign exchange reserves fell sharply under the burden of external debt repayments and intervention in the foreign exchange market, dropping from $10.8 billion at the end of June 2012 to $6.0 billion a year later. Reserves equaled less than 1.5 months of projected imports of goods and services next year.
The new government that took office in June 2013 quickly signaled restoring economic sustainability and rapid growth as high priorities for its 5-year term. It emphasized dealing with the energy crisis, boosting investment and trade, upgrading infrastructure, and ceding most economic functions to the private sector. To address low foreign exchange reserves, fiscal and external imbalances, and low growth, the government agreed on a wide ranging economic reform program with the International Monetary Fund, supported by a 3-year loan worth $6.7 billion.
The program aims to eliminate power subsidies in fiscal consolidation that includes strengthening the country’s notorious weak revenue base and ending the drain from loss-making public enterprises. Other structural reforms hope to strengthen the financial system and improve
3.1.20 Selected economic indicators, Pakistan (%)
2013 2014
ADO 2013
Update ADO 2013
Update
GDP growth 3.6 3.6 3.5 3.0
Inflation 9.0 7.4 9.5 8.0
Current acct. bal. (share of GDP)
–0.8 –1.0 –0.9 –0.8
Source: ADB estimates.
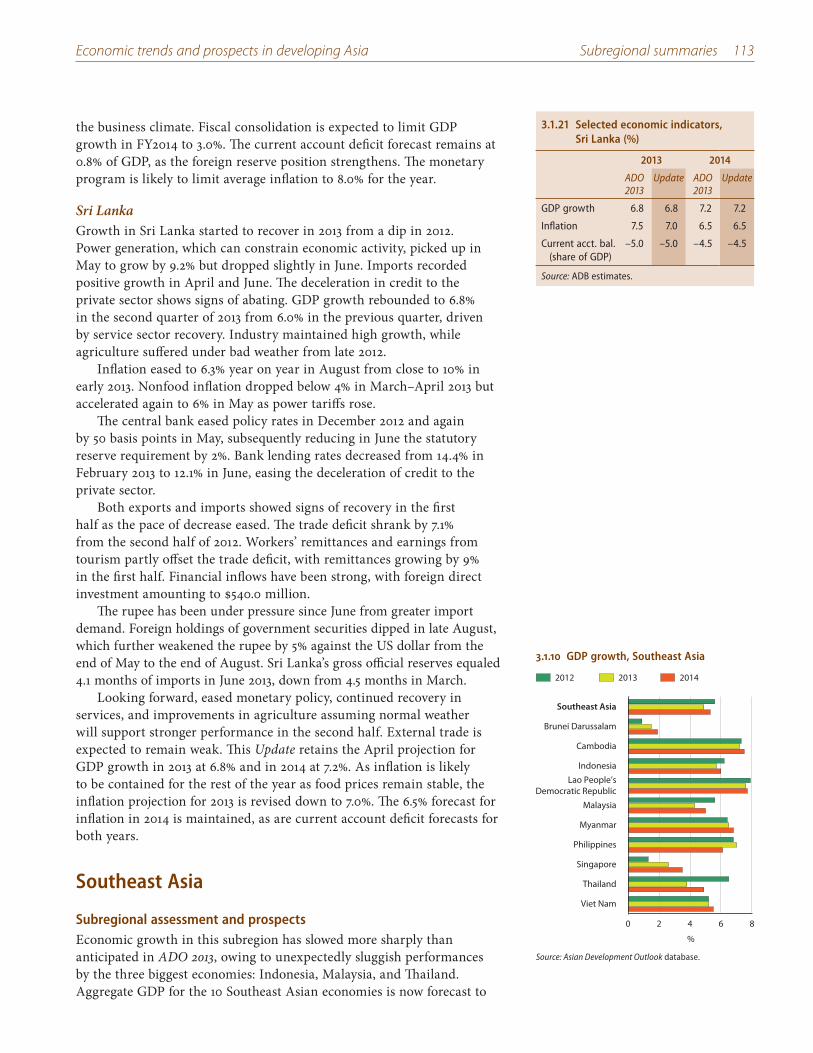
Economic trends and prospects in developing Asia Subregional summaries 113
the business climate. Fiscal consolidation is expected to limit GDP growth in FY2014 to 3.0%. The current account deficit forecast remains at 0.8% of GDP, as the foreign reserve position strengthens. The monetary program is likely to limit average inflation to 8.0% for the year.
Sri Lanka Growth in Sri Lanka started to recover in 2013 from a dip in 2012. Power generation, which can constrain economic activity, picked up in May to grow by 9.2% but dropped slightly in June. Imports recorded positive growth in April and June. The deceleration in credit to the private sector shows signs of abating. GDP growth rebounded to 6.8% in the second quarter of 2013 from 6.0% in the previous quarter, driven by service sector recovery. Industry maintained high growth, while agriculture suffered under bad weather from late 2012.
Inflation eased to 6.3% year on year in August from close to 10% in early 2013. Nonfood inflation dropped below 4% in March–April 2013 but accelerated again to 6% in May as power tariffs rose.
The central bank eased policy rates in December 2012 and again by 50 basis points in May, subsequently reducing in June the statutory reserve requirement by 2%. Bank lending rates decreased from 14.4% in February 2013 to 12.1% in June, easing the deceleration of credit to the private sector.
Both exports and imports showed signs of recovery in the first half as the pace of decrease eased. The trade deficit shrank by 7.1% from the second half of 2012. Workers’ remittances and earnings from tourism partly offset the trade deficit, with remittances growing by 9% in the first half. Financial inflows have been strong, with foreign direct investment amounting to $540.0 million.
The rupee has been under pressure since June from greater import demand. Foreign holdings of government securities dipped in late August, which further weakened the rupee by 5% against the US dollar from the end of May to the end of August. Sri Lanka’s gross official reserves equaled 4.1 months of imports in June 2013, down from 4.5 months in March.
Looking forward, eased monetary policy, continued recovery in services, and improvements in agriculture assuming normal weather will support stronger performance in the second half. External trade is expected to remain weak. This Update retains the April projection for GDP growth in 2013 at 6.8% and in 2014 at 7.2%. As inflation is likely to be contained for the rest of the year as food prices remain stable, the inflation projection for 2013 is revised down to 7.0%. The 6.5% forecast for inflation in 2014 is maintained, as are current account deficit forecasts for both years.
Southeast Asia
Subregional assessment and prospectsEconomic growth in this subregion has slowed more sharply than anticipated in ADO 2013, owing to unexpectedly sluggish performances by the three biggest economies: Indonesia, Malaysia, and Thailand. Aggregate GDP for the 10 Southeast Asian economies is now forecast to
3.1.21 Selected economic indicators, Sri Lanka (%)
2013 2014
ADO 2013
Update ADO 2013
Update
GDP growth 6.8 6.8 7.2 7.2
Inflation 7.5 7.0 6.5 6.5
Current acct. bal. (share of GDP)
–5.0 –5.0 –4.5 –4.5
Source: ADB estimates.
3.1.10 GDP growth, Southeast Asia
2012 2013 2014
0 2 4 6 8
Viet Nam
Thailand
Singapore
Philippines
Myanmar
Malaysia
Lao People’sDemocratic Republic
Indonesia
Cambodia
Brunei Darussalam
Southeast Asia
%
Source: Asian Development Outlook database.
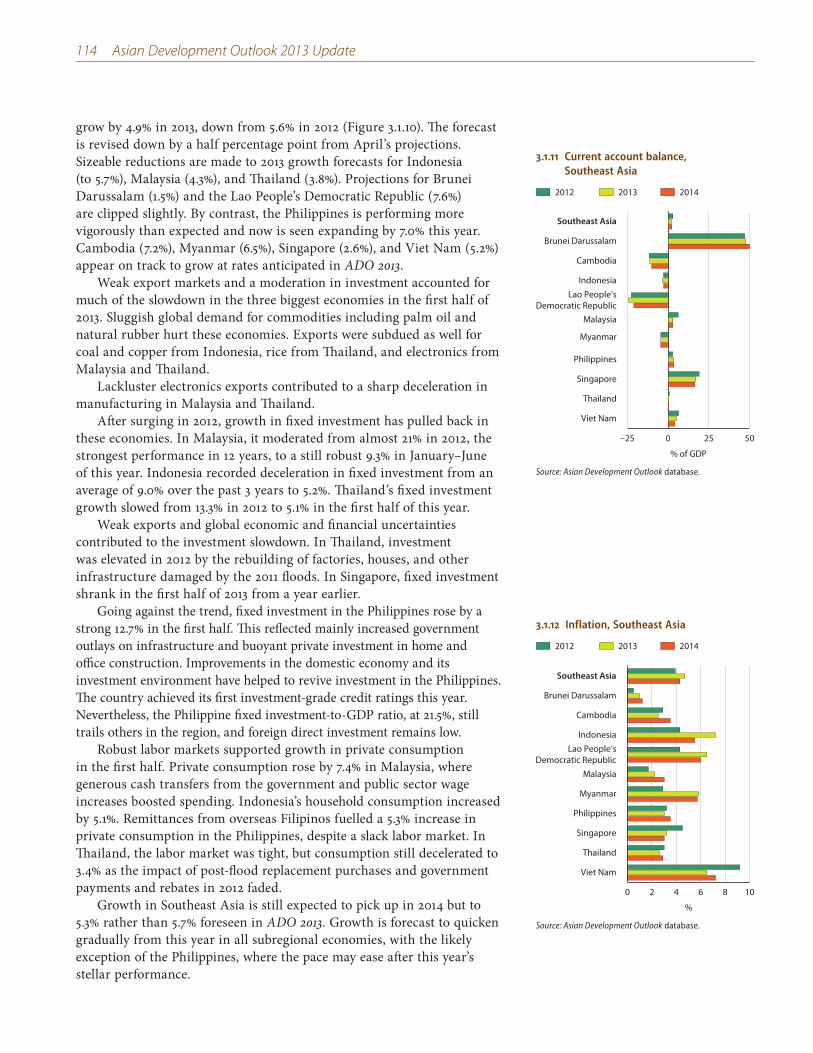
114 Asian Development Outlook 2013 Update
grow by 4.9% in 2013, down from 5.6% in 2012 (Figure 3.1.10). The forecast is revised down by a half percentage point from April’s projections.Sizeable reductions are made to 2013 growth forecasts for Indonesia (to 5.7%), Malaysia (4.3%), and Thailand (3.8%). Projections for Brunei Darussalam (1.5%) and the Lao People’s Democratic Republic (7.6%) are clipped slightly. By contrast, the Philippines is performing more vigorously than expected and now is seen expanding by 7.0% this year. Cambodia (7.2%), Myanmar (6.5%), Singapore (2.6%), and Viet Nam (5.2%) appear on track to grow at rates anticipated in ADO 2013.
Weak export markets and a moderation in investment accounted for much of the slowdown in the three biggest economies in the first half of 2013. Sluggish global demand for commodities including palm oil and natural rubber hurt these economies. Exports were subdued as well for coal and copper from Indonesia, rice from Thailand, and electronics from Malaysia and Thailand.
Lackluster electronics exports contributed to a sharp deceleration in manufacturing in Malaysia and Thailand.
After surging in 2012, growth in fixed investment has pulled back in these economies. In Malaysia, it moderated from almost 21% in 2012, the strongest performance in 12 years, to a still robust 9.3% in January–June of this year. Indonesia recorded deceleration in fixed investment from an average of 9.0% over the past 3 years to 5.2%. Thailand’s fixed investment growth slowed from 13.3% in 2012 to 5.1% in the first half of this year.
Weak exports and global economic and financial uncertainties contributed to the investment slowdown. In Thailand, investment was elevated in 2012 by the rebuilding of factories, houses, and other infrastructure damaged by the 2011 floods. In Singapore, fixed investment shrank in the first half of 2013 from a year earlier.
Going against the trend, fixed investment in the Philippines rose by a strong 12.7% in the first half. This reflected mainly increased government outlays on infrastructure and buoyant private investment in home and office construction. Improvements in the domestic economy and its investment environment have helped to revive investment in the Philippines. The country achieved its first investment-grade credit ratings this year. Nevertheless, the Philippine fixed investment-to-GDP ratio, at 21.5%, still trails others in the region, and foreign direct investment remains low.
Robust labor markets supported growth in private consumption in the first half. Private consumption rose by 7.4% in Malaysia, where generous cash transfers from the government and public sector wage increases boosted spending. Indonesia’s household consumption increased by 5.1%. Remittances from overseas Filipinos fuelled a 5.3% increase in private consumption in the Philippines, despite a slack labor market. In Thailand, the labor market was tight, but consumption still decelerated to 3.4% as the impact of post-flood replacement purchases and government payments and rebates in 2012 faded.
Growth in Southeast Asia is still expected to pick up in 2014 but to 5.3% rather than 5.7% foreseen in ADO 2013. Growth is forecast to quicken gradually from this year in all subregional economies, with the likely exception of the Philippines, where the pace may ease after this year’s stellar performance.
3.1.12 Inflation, Southeast Asia
2012 2013 2014
Viet Nam
Thailand
Singapore
Philippines
Myanmar
Malaysia
Lao People’sDemocratic Republic
Indonesia
Cambodia
Brunei Darussalam
Southeast Asia
0 2 4 6 8 10
%
Source: Asian Development Outlook database.
3.1.11 Current account balance, Southeast Asia
2012 2013 2014
–25 0 25 50
Viet Nam
Thailand
Singapore
Philippines
Malaysia
Myanmar
Lao People’sDemocratic Republic
Indonesia
Cambodia
Brunei Darussalam
Southeast Asia
% of GDP
Source: Asian Development Outlook database.
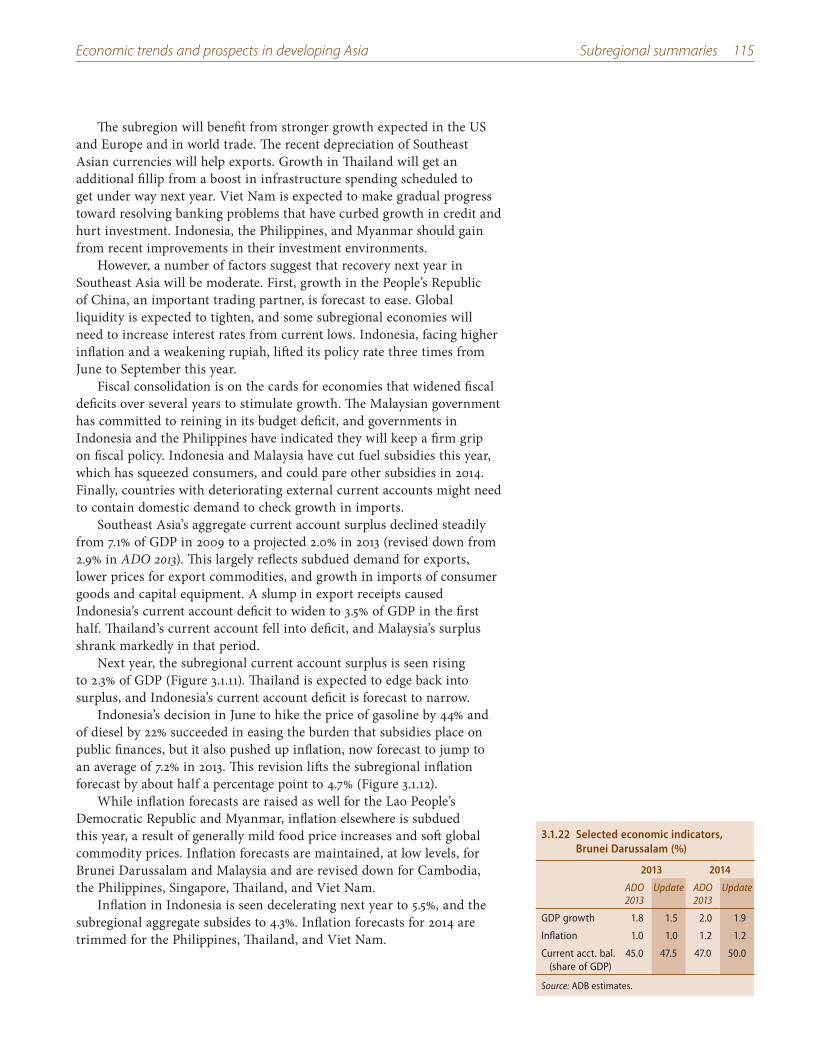
Economic trends and prospects in developing Asia Subregional summaries 115
3.1.22 Selected economic indicators, Brunei Darussalam (%)
2013 2014
ADO 2013
Update ADO 2013
Update
GDP growth 1.8 1.5 2.0 1.9
Inflation 1.0 1.0 1.2 1.2
Current acct. bal. (share of GDP)
45.0 47.5 47.0 50.0
Source: ADB estimates.
The subregion will benefit from stronger growth expected in the US and Europe and in world trade. The recent depreciation of Southeast Asian currencies will help exports. Growth in Thailand will get an additional fillip from a boost in infrastructure spending scheduled to get under way next year. Viet Nam is expected to make gradual progress toward resolving banking problems that have curbed growth in credit and hurt investment. Indonesia, the Philippines, and Myanmar should gain from recent improvements in their investment environments.
However, a number of factors suggest that recovery next year in Southeast Asia will be moderate. First, growth in the People’s Republic of China, an important trading partner, is forecast to ease. Global liquidity is expected to tighten, and some subregional economies will need to increase interest rates from current lows. Indonesia, facing higher inflation and a weakening rupiah, lifted its policy rate three times from June to September this year.
Fiscal consolidation is on the cards for economies that widened fiscal deficits over several years to stimulate growth. The Malaysian government has committed to reining in its budget deficit, and governments in Indonesia and the Philippines have indicated they will keep a firm grip on fiscal policy. Indonesia and Malaysia have cut fuel subsidies this year, which has squeezed consumers, and could pare other subsidies in 2014. Finally, countries with deteriorating external current accounts might need to contain domestic demand to check growth in imports.
Southeast Asia’s aggregate current account surplus declined steadily from 7.1% of GDP in 2009 to a projected 2.0% in 2013 (revised down from 2.9% in ADO 2013). This largely reflects subdued demand for exports, lower prices for export commodities, and growth in imports of consumer goods and capital equipment. A slump in export receipts caused Indonesia’s current account deficit to widen to 3.5% of GDP in the first half. Thailand’s current account fell into deficit, and Malaysia’s surplus shrank markedly in that period.
Next year, the subregional current account surplus is seen rising to 2.3% of GDP (Figure 3.1.11). Thailand is expected to edge back into surplus, and Indonesia’s current account deficit is forecast to narrow.
Indonesia’s decision in June to hike the price of gasoline by 44% and of diesel by 22% succeeded in easing the burden that subsidies place on public finances, but it also pushed up inflation, now forecast to jump to an average of 7.2% in 2013. This revision lifts the subregional inflation forecast by about half a percentage point to 4.7% (Figure 3.1.12).
While inflation forecasts are raised as well for the Lao People’s Democratic Republic and Myanmar, inflation elsewhere is subdued this year, a result of generally mild food price increases and soft global commodity prices. Inflation forecasts are maintained, at low levels, for Brunei Darussalam and Malaysia and are revised down for Cambodia, the Philippines, Singapore, Thailand, and Viet Nam.
Inflation in Indonesia is seen decelerating next year to 5.5%, and the subregional aggregate subsides to 4.3%. Inflation forecasts for 2014 are trimmed for the Philippines, Thailand, and Viet Nam.
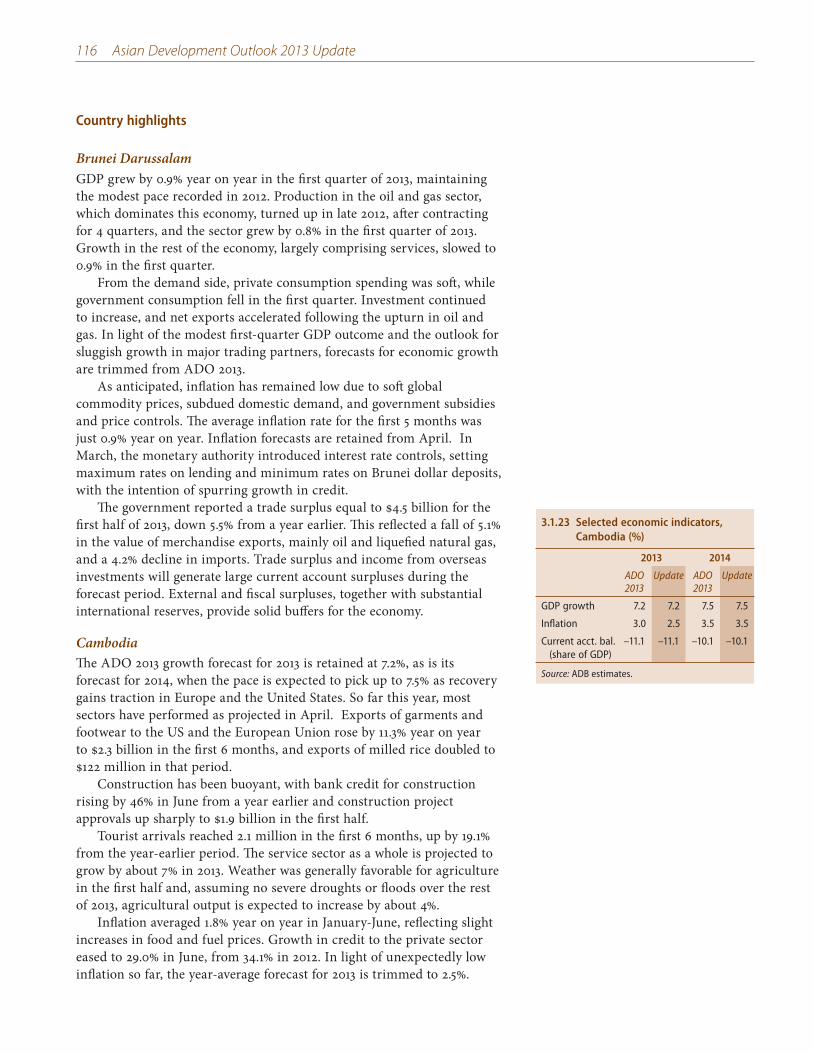
116 Asian Development Outlook 2013 Update
Country highlights
Brunei DarussalamGDP grew by 0.9% year on year in the first quarter of 2013, maintaining the modest pace recorded in 2012. Production in the oil and gas sector, which dominates this economy, turned up in late 2012, after contracting for 4 quarters, and the sector grew by 0.8% in the first quarter of 2013. Growth in the rest of the economy, largely comprising services, slowed to 0.9% in the first quarter.
From the demand side, private consumption spending was soft, while government consumption fell in the first quarter. Investment continued to increase, and net exports accelerated following the upturn in oil and gas. In light of the modest first-quarter GDP outcome and the outlook for sluggish growth in major trading partners, forecasts for economic growth are trimmed from ADO 2013.
As anticipated, inflation has remained low due to soft global commodity prices, subdued domestic demand, and government subsidies and price controls. The average inflation rate for the first 5 months was just 0.9% year on year. Inflation forecasts are retained from April. In March, the monetary authority introduced interest rate controls, setting maximum rates on lending and minimum rates on Brunei dollar deposits, with the intention of spurring growth in credit.
The government reported a trade surplus equal to $4.5 billion for the first half of 2013, down 5.5% from a year earlier. This reflected a fall of 5.1% in the value of merchandise exports, mainly oil and liquefied natural gas, and a 4.2% decline in imports. Trade surplus and income from overseas investments will generate large current account surpluses during the forecast period. External and fiscal surpluses, together with substantial international reserves, provide solid buffers for the economy.
CambodiaThe ADO 2013 growth forecast for 2013 is retained at 7.2%, as is its forecast for 2014, when the pace is expected to pick up to 7.5% as recovery gains traction in Europe and the United States. So far this year, most sectors have performed as projected in April. Exports of garments and footwear to the US and the European Union rose by 11.3% year on year to $2.3 billion in the first 6 months, and exports of milled rice doubled to $122 million in that period.
Construction has been buoyant, with bank credit for construction rising by 46% in June from a year earlier and construction project approvals up sharply to $1.9 billion in the first half.
Tourist arrivals reached 2.1 million in the first 6 months, up by 19.1% from the year-earlier period. The service sector as a whole is projected to grow by about 7% in 2013. Weather was generally favorable for agriculture in the first half and, assuming no severe droughts or floods over the rest of 2013, agricultural output is expected to increase by about 4%.
Inflation averaged 1.8% year on year in January-June, reflecting slight increases in food and fuel prices. Growth in credit to the private sector eased to 29.0% in June, from 34.1% in 2012. In light of unexpectedly low inflation so far, the year-average forecast for 2013 is trimmed to 2.5%.
3.1.23 Selected economic indicators, Cambodia (%)
2013 2014
ADO 2013
Update ADO 2013
Update
GDP growth 7.2 7.2 7.5 7.5
Inflation 3.0 2.5 3.5 3.5
Current acct. bal. (share of GDP)
–11.1 –11.1 –10.1 –10.1
Source: ADB estimates.
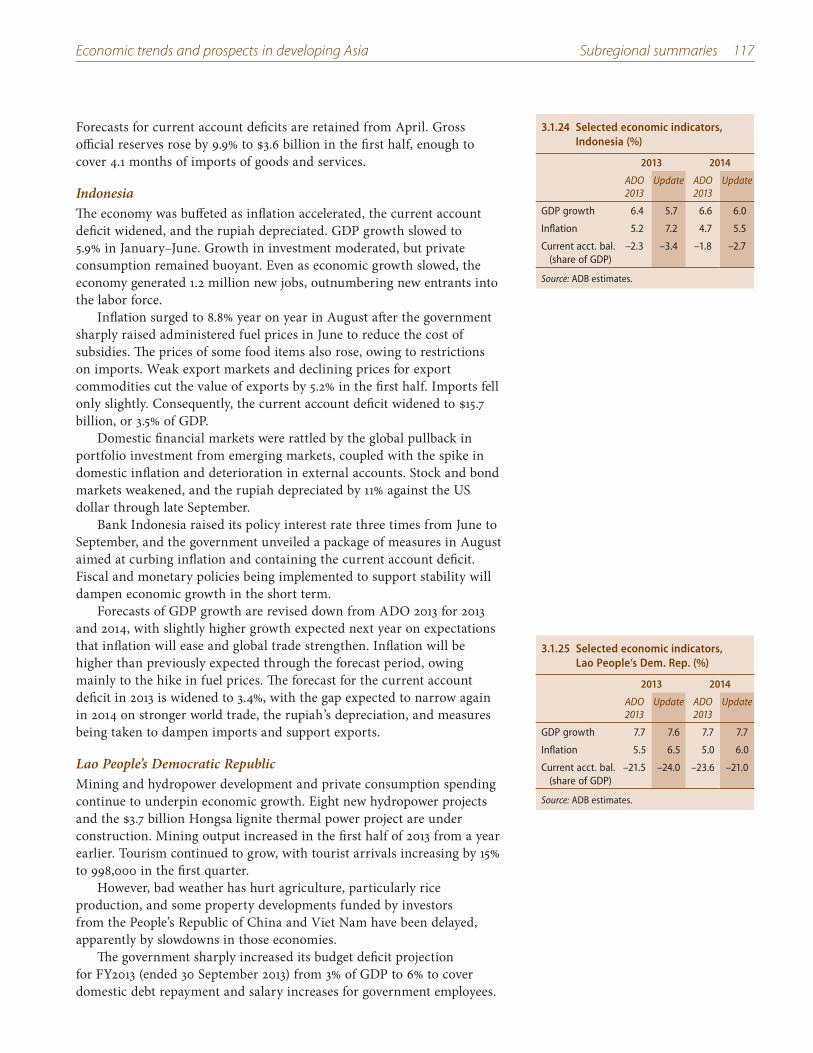
Economic trends and prospects in developing Asia Subregional summaries 117
Forecasts for current account deficits are retained from April. Gross official reserves rose by 9.9% to $3.6 billion in the first half, enough to cover 4.1 months of imports of goods and services.
IndonesiaThe economy was buffeted as inflation accelerated, the current account deficit widened, and the rupiah depreciated. GDP growth slowed to 5.9% in January–June. Growth in investment moderated, but private consumption remained buoyant. Even as economic growth slowed, the economy generated 1.2 million new jobs, outnumbering new entrants into the labor force.
Inflation surged to 8.8% year on year in August after the government sharply raised administered fuel prices in June to reduce the cost of subsidies. The prices of some food items also rose, owing to restrictions on imports. Weak export markets and declining prices for export commodities cut the value of exports by 5.2% in the first half. Imports fell only slightly. Consequently, the current account deficit widened to $15.7 billion, or 3.5% of GDP.
Domestic financial markets were rattled by the global pullback in portfolio investment from emerging markets, coupled with the spike in domestic inflation and deterioration in external accounts. Stock and bond markets weakened, and the rupiah depreciated by 11% against the US dollar through late September.
Bank Indonesia raised its policy interest rate three times from June to September, and the government unveiled a package of measures in August aimed at curbing inflation and containing the current account deficit. Fiscal and monetary policies being implemented to support stability will dampen economic growth in the short term.
Forecasts of GDP growth are revised down from ADO 2013 for 2013 and 2014, with slightly higher growth expected next year on expectations that inflation will ease and global trade strengthen. Inflation will be higher than previously expected through the forecast period, owing mainly to the hike in fuel prices. The forecast for the current account deficit in 2013 is widened to 3.4%, with the gap expected to narrow again in 2014 on stronger world trade, the rupiah’s depreciation, and measures being taken to dampen imports and support exports.
Lao People’s Democratic RepublicMining and hydropower development and private consumption spending continue to underpin economic growth. Eight new hydropower projects and the $3.7 billion Hongsa lignite thermal power project are under construction. Mining output increased in the first half of 2013 from a year earlier. Tourism continued to grow, with tourist arrivals increasing by 15% to 998,000 in the first quarter.
However, bad weather has hurt agriculture, particularly rice production, and some property developments funded by investors from the People’s Republic of China and Viet Nam have been delayed, apparently by slowdowns in those economies.
The government sharply increased its budget deficit projection for FY2013 (ended 30 September 2013) from 3% of GDP to 6% to cover domestic debt repayment and salary increases for government employees.
3.1.24 Selected economic indicators, Indonesia (%)
2013 2014
ADO 2013
Update ADO 2013
Update
GDP growth 6.4 5.7 6.6 6.0
Inflation 5.2 7.2 4.7 5.5
Current acct. bal. (share of GDP)
–2.3 –3.4 –1.8 –2.7
Source: ADB estimates.
3.1.25 Selected economic indicators, Lao People’s Dem. Rep. (%)
2013 2014
ADO 2013
Update ADO 2013
Update
GDP growth 7.7 7.6 7.7 7.7
Inflation 5.5 6.5 5.0 6.0
Current acct. bal. (share of GDP)
–21.5 –24.0 –23.6 –21.0
Source: ADB estimates.
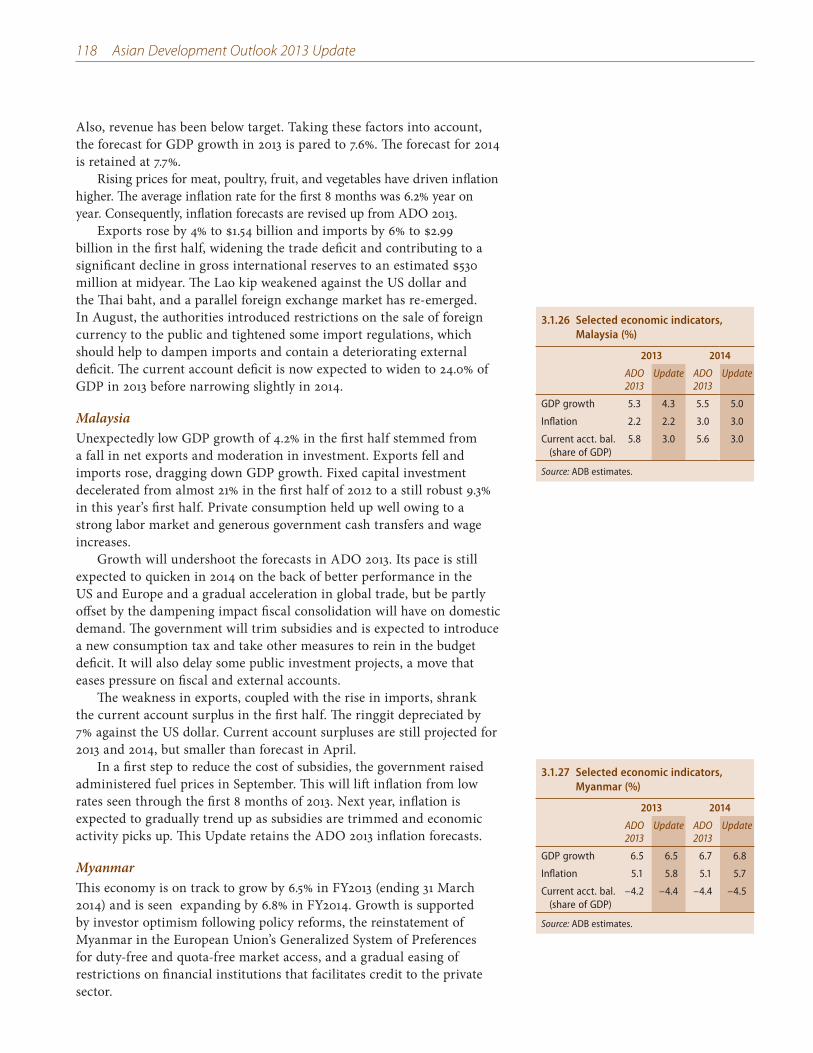
118 Asian Development Outlook 2013 Update
Also, revenue has been below target. Taking these factors into account, the forecast for GDP growth in 2013 is pared to 7.6%. The forecast for 2014 is retained at 7.7%.
Rising prices for meat, poultry, fruit, and vegetables have driven inflation higher. The average inflation rate for the first 8 months was 6.2% year on year. Consequently, inflation forecasts are revised up from ADO 2013.
Exports rose by 4% to $1.54 billion and imports by 6% to $2.99 billion in the first half, widening the trade deficit and contributing to a significant decline in gross international reserves to an estimated $530 million at midyear. The Lao kip weakened against the US dollar and the Thai baht, and a parallel foreign exchange market has re-emerged. In August, the authorities introduced restrictions on the sale of foreign currency to the public and tightened some import regulations, which should help to dampen imports and contain a deteriorating external deficit. The current account deficit is now expected to widen to 24.0% of GDP in 2013 before narrowing slightly in 2014.
MalaysiaUnexpectedly low GDP growth of 4.2% in the first half stemmed from a fall in net exports and moderation in investment. Exports fell and imports rose, dragging down GDP growth. Fixed capital investment decelerated from almost 21% in the first half of 2012 to a still robust 9.3% in this year’s first half. Private consumption held up well owing to a strong labor market and generous government cash transfers and wage increases.
Growth will undershoot the forecasts in ADO 2013. Its pace is still expected to quicken in 2014 on the back of better performance in the US and Europe and a gradual acceleration in global trade, but be partly offset by the dampening impact fiscal consolidation will have on domestic demand. The government will trim subsidies and is expected to introduce a new consumption tax and take other measures to rein in the budget deficit. It will also delay some public investment projects, a move that eases pressure on fiscal and external accounts.
The weakness in exports, coupled with the rise in imports, shrank the current account surplus in the first half. The ringgit depreciated by 7% against the US dollar. Current account surpluses are still projected for 2013 and 2014, but smaller than forecast in April.
In a first step to reduce the cost of subsidies, the government raised administered fuel prices in September. This will lift inflation from low rates seen through the first 8 months of 2013. Next year, inflation is expected to gradually trend up as subsidies are trimmed and economic activity picks up. This Update retains the ADO 2013 inflation forecasts.
MyanmarThis economy is on track to grow by 6.5% in FY2013 (ending 31 March 2014) and is seen expanding by 6.8% in FY2014. Growth is supported by investor optimism following policy reforms, the reinstatement of Myanmar in the European Union’s Generalized System of Preferences for duty-free and quota-free market access, and a gradual easing of restrictions on financial institutions that facilitates credit to the private sector.
3.1.27 Selected economic indicators, Myanmar (%)
2013 2014
ADO 2013
Update ADO 2013
Update
GDP growth 6.5 6.5 6.7 6.8
Inflation 5.1 5.8 5.1 5.7
Current acct. bal. (share of GDP)
–4.2 –4.4 –4.4 –4.5
Source: ADB estimates.
3.1.26 Selected economic indicators, Malaysia (%)
2013 2014
ADO 2013
Update ADO 2013
Update
GDP growth 5.3 4.3 5.5 5.0
Inflation 2.2 2.2 3.0 3.0
Current acct. bal. (share of GDP)
5.8 3.0 5.6 3.0
Source: ADB estimates.
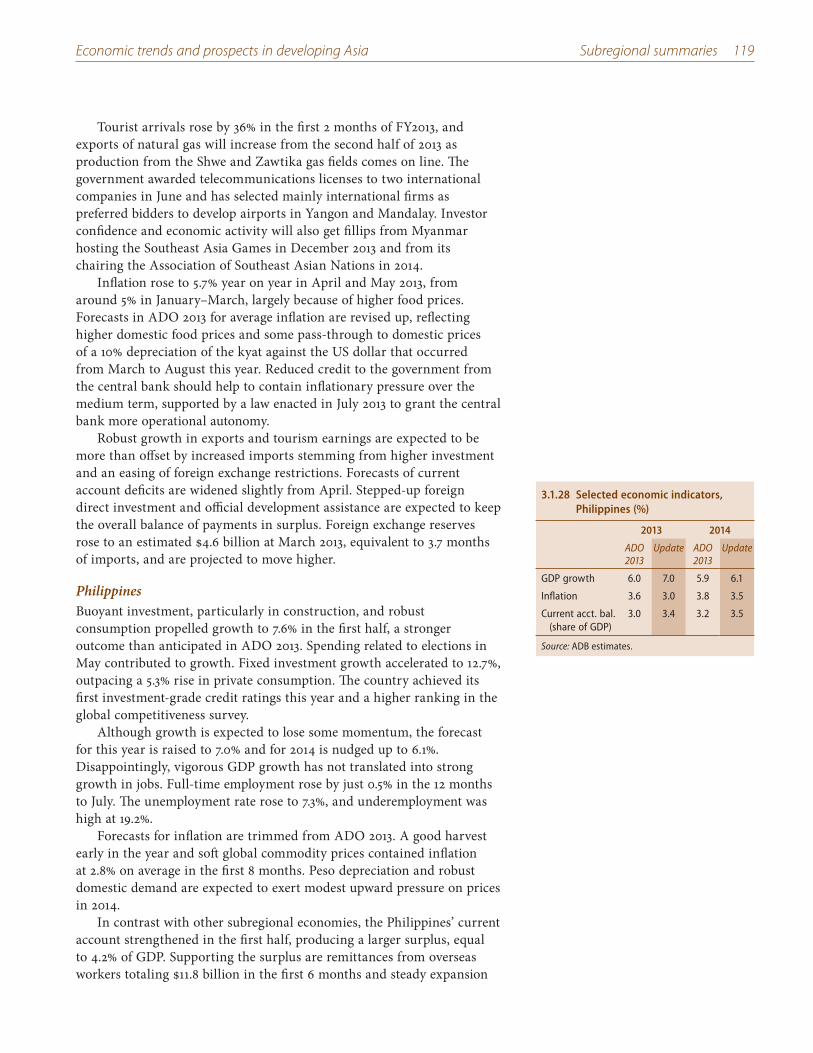
Economic trends and prospects in developing Asia Subregional summaries 119
3.1.28 Selected economic indicators, Philippines (%)
2013 2014
ADO 2013
Update ADO 2013
Update
GDP growth 6.0 7.0 5.9 6.1
Inflation 3.6 3.0 3.8 3.5
Current acct. bal. (share of GDP)
3.0 3.4 3.2 3.5
Source: ADB estimates.
Tourist arrivals rose by 36% in the first 2 months of FY2013, and exports of natural gas will increase from the second half of 2013 as production from the Shwe and Zawtika gas fields comes on line. The government awarded telecommunications licenses to two international companies in June and has selected mainly international firms as preferred bidders to develop airports in Yangon and Mandalay. Investor confidence and economic activity will also get fillips from Myanmar hosting the Southeast Asia Games in December 2013 and from its chairing the Association of Southeast Asian Nations in 2014.
Inflation rose to 5.7% year on year in April and May 2013, from around 5% in January–March, largely because of higher food prices. Forecasts in ADO 2013 for average inflation are revised up, reflecting higher domestic food prices and some pass-through to domestic prices of a 10% depreciation of the kyat against the US dollar that occurred from March to August this year. Reduced credit to the government from the central bank should help to contain inflationary pressure over the medium term, supported by a law enacted in July 2013 to grant the central bank more operational autonomy.
Robust growth in exports and tourism earnings are expected to be more than offset by increased imports stemming from higher investment and an easing of foreign exchange restrictions. Forecasts of current account deficits are widened slightly from April. Stepped-up foreign direct investment and official development assistance are expected to keep the overall balance of payments in surplus. Foreign exchange reserves rose to an estimated $4.6 billion at March 2013, equivalent to 3.7 months of imports, and are projected to move higher.
PhilippinesBuoyant investment, particularly in construction, and robust consumption propelled growth to 7.6% in the first half, a stronger outcome than anticipated in ADO 2013. Spending related to elections in May contributed to growth. Fixed investment growth accelerated to 12.7%, outpacing a 5.3% rise in private consumption. The country achieved its first investment-grade credit ratings this year and a higher ranking in the global competitiveness survey.
Although growth is expected to lose some momentum, the forecast for this year is raised to 7.0% and for 2014 is nudged up to 6.1%. Disappointingly, vigorous GDP growth has not translated into strong growth in jobs. Full-time employment rose by just 0.5% in the 12 months to July. The unemployment rate rose to 7.3%, and underemployment was high at 19.2%.
Forecasts for inflation are trimmed from ADO 2013. A good harvest early in the year and soft global commodity prices contained inflation at 2.8% on average in the first 8 months. Peso depreciation and robust domestic demand are expected to exert modest upward pressure on prices in 2014.
In contrast with other subregional economies, the Philippines’ current account strengthened in the first half, producing a larger surplus, equal to 4.2% of GDP. Supporting the surplus are remittances from overseas workers totaling $11.8 billion in the first 6 months and steady expansion
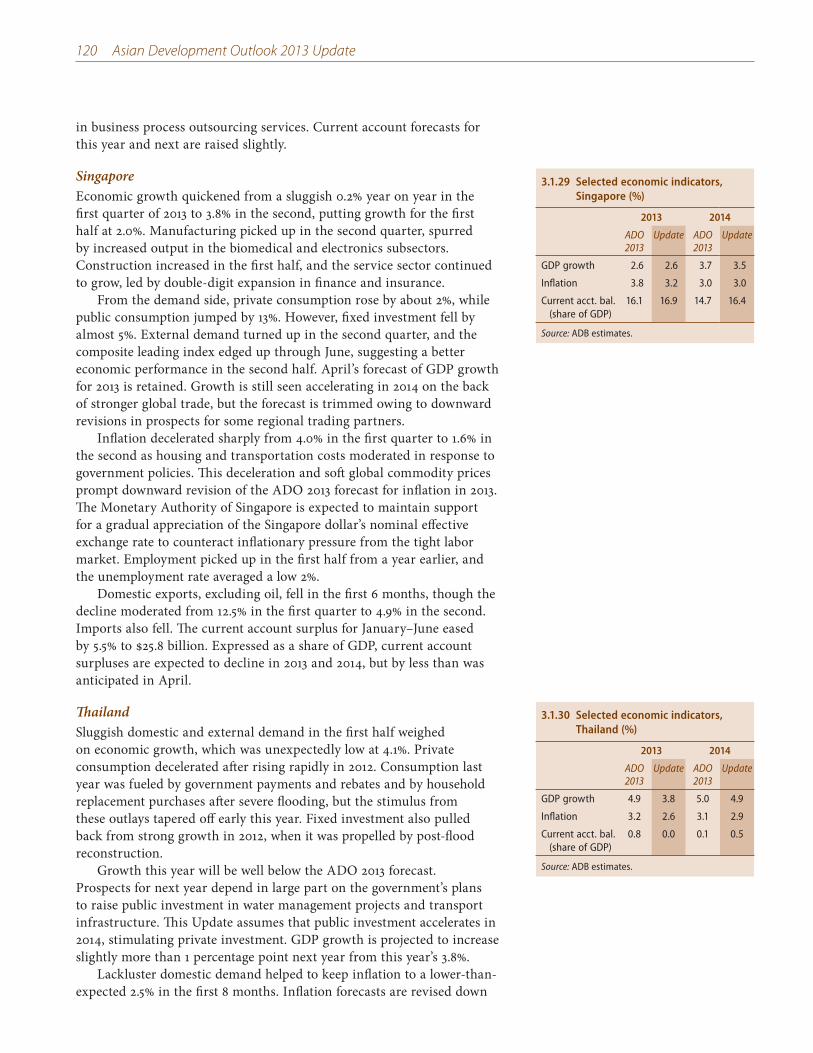
120 Asian Development Outlook 2013 Update
in business process outsourcing services. Current account forecasts for this year and next are raised slightly.
SingaporeEconomic growth quickened from a sluggish 0.2% year on year in the first quarter of 2013 to 3.8% in the second, putting growth for the first half at 2.0%. Manufacturing picked up in the second quarter, spurred by increased output in the biomedical and electronics subsectors. Construction increased in the first half, and the service sector continued to grow, led by double-digit expansion in finance and insurance.
From the demand side, private consumption rose by about 2%, while public consumption jumped by 13%. However, fixed investment fell by almost 5%. External demand turned up in the second quarter, and the composite leading index edged up through June, suggesting a better economic performance in the second half. April’s forecast of GDP growth for 2013 is retained. Growth is still seen accelerating in 2014 on the back of stronger global trade, but the forecast is trimmed owing to downward revisions in prospects for some regional trading partners.
Inflation decelerated sharply from 4.0% in the first quarter to 1.6% in the second as housing and transportation costs moderated in response to government policies. This deceleration and soft global commodity prices prompt downward revision of the ADO 2013 forecast for inflation in 2013. The Monetary Authority of Singapore is expected to maintain support for a gradual appreciation of the Singapore dollar’s nominal effective exchange rate to counteract inflationary pressure from the tight labor market. Employment picked up in the first half from a year earlier, and the unemployment rate averaged a low 2%.
Domestic exports, excluding oil, fell in the first 6 months, though the decline moderated from 12.5% in the first quarter to 4.9% in the second. Imports also fell. The current account surplus for January–June eased by 5.5% to $25.8 billion. Expressed as a share of GDP, current account surpluses are expected to decline in 2013 and 2014, but by less than was anticipated in April.
ThailandSluggish domestic and external demand in the first half weighed on economic growth, which was unexpectedly low at 4.1%. Private consumption decelerated after rising rapidly in 2012. Consumption last year was fueled by government payments and rebates and by household replacement purchases after severe flooding, but the stimulus from these outlays tapered off early this year. Fixed investment also pulled back from strong growth in 2012, when it was propelled by post-flood reconstruction.
Growth this year will be well below the ADO 2013 forecast. Prospects for next year depend in large part on the government’s plans to raise public investment in water management projects and transport infrastructure. This Update assumes that public investment accelerates in 2014, stimulating private investment. GDP growth is projected to increase slightly more than 1 percentage point next year from this year’s 3.8%.
Lackluster domestic demand helped to keep inflation to a lower-than-expected 2.5% in the first 8 months. Inflation forecasts are revised down
3.1.30 Selected economic indicators, Thailand (%)
2013 2014
ADO 2013
Update ADO 2013
Update
GDP growth 4.9 3.8 5.0 4.9
Inflation 3.2 2.6 3.1 2.9
Current acct. bal. (share of GDP)
0.8 0.0 0.1 0.5
Source: ADB estimates.
3.1.29 Selected economic indicators, Singapore (%)
2013 2014
ADO 2013
Update ADO 2013
Update
GDP growth 2.6 2.6 3.7 3.5
Inflation 3.8 3.2 3.0 3.0
Current acct. bal. (share of GDP)
16.1 16.9 14.7 16.4
Source: ADB estimates.
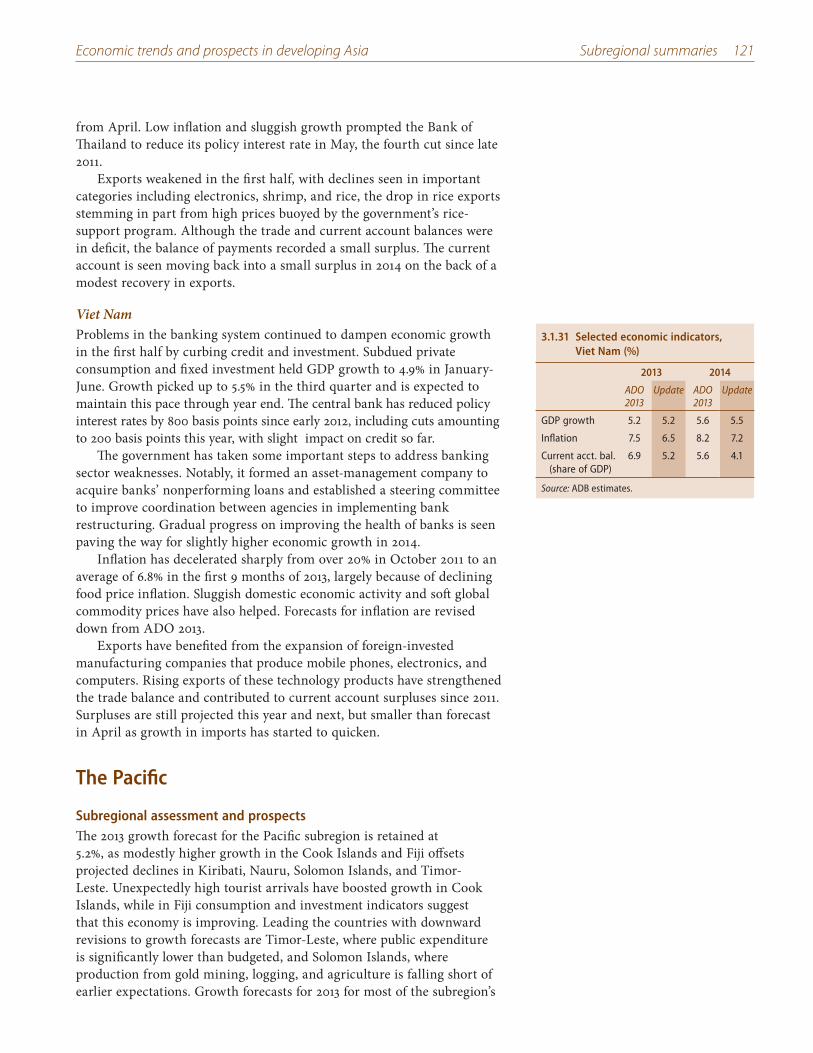
Economic trends and prospects in developing Asia Subregional summaries 121
from April. Low inflation and sluggish growth prompted the Bank of Thailand to reduce its policy interest rate in May, the fourth cut since late 2011.
Exports weakened in the first half, with declines seen in important categories including electronics, shrimp, and rice, the drop in rice exports stemming in part from high prices buoyed by the government’s rice-support program. Although the trade and current account balances were in deficit, the balance of payments recorded a small surplus. The current account is seen moving back into a small surplus in 2014 on the back of a modest recovery in exports.
Viet NamProblems in the banking system continued to dampen economic growth in the first half by curbing credit and investment. Subdued private consumption and fixed investment held GDP growth to 4.9% in January-June. Growth picked up to 5.5% in the third quarter and is expected to maintain this pace through year end. The central bank has reduced policy interest rates by 800 basis points since early 2012, including cuts amounting to 200 basis points this year, with slight impact on credit so far.
The government has taken some important steps to address banking sector weaknesses. Notably, it formed an asset-management company to acquire banks’ nonperforming loans and established a steering committee to improve coordination between agencies in implementing bank restructuring. Gradual progress on improving the health of banks is seen paving the way for slightly higher economic growth in 2014.
Inflation has decelerated sharply from over 20% in October 2011 to an average of 6.8% in the first 9 months of 2013, largely because of declining food price inflation. Sluggish domestic economic activity and soft global commodity prices have also helped. Forecasts for inflation are revised down from ADO 2013.
Exports have benefited from the expansion of foreign-invested manufacturing companies that produce mobile phones, electronics, and computers. Rising exports of these technology products have strengthened the trade balance and contributed to current account surpluses since 2011. Surpluses are still projected this year and next, but smaller than forecast in April as growth in imports has started to quicken.
3.1.31 Selected economic indicators, Viet Nam (%)
2013 2014
ADO 2013
Update ADO 2013
Update
GDP growth 5.2 5.2 5.6 5.5
Inflation 7.5 6.5 8.2 7.2
Current acct. bal. (share of GDP)
6.9 5.2 5.6 4.1
Source: ADB estimates.
The Pacific
Subregional assessment and prospects The 2013 growth forecast for the Pacific subregion is retained at 5.2%, as modestly higher growth in the Cook Islands and Fiji offsets projected declines in Kiribati, Nauru, Solomon Islands, and Timor-Leste. Unexpectedly high tourist arrivals have boosted growth in Cook Islands, while in Fiji consumption and investment indicators suggest that this economy is improving. Leading the countries with downward revisions to growth forecasts are Timor-Leste, where public expenditure is significantly lower than budgeted, and Solomon Islands, where production from gold mining, logging, and agriculture is falling short of earlier expectations. Growth forecasts for 2013 for most of the subregion’s
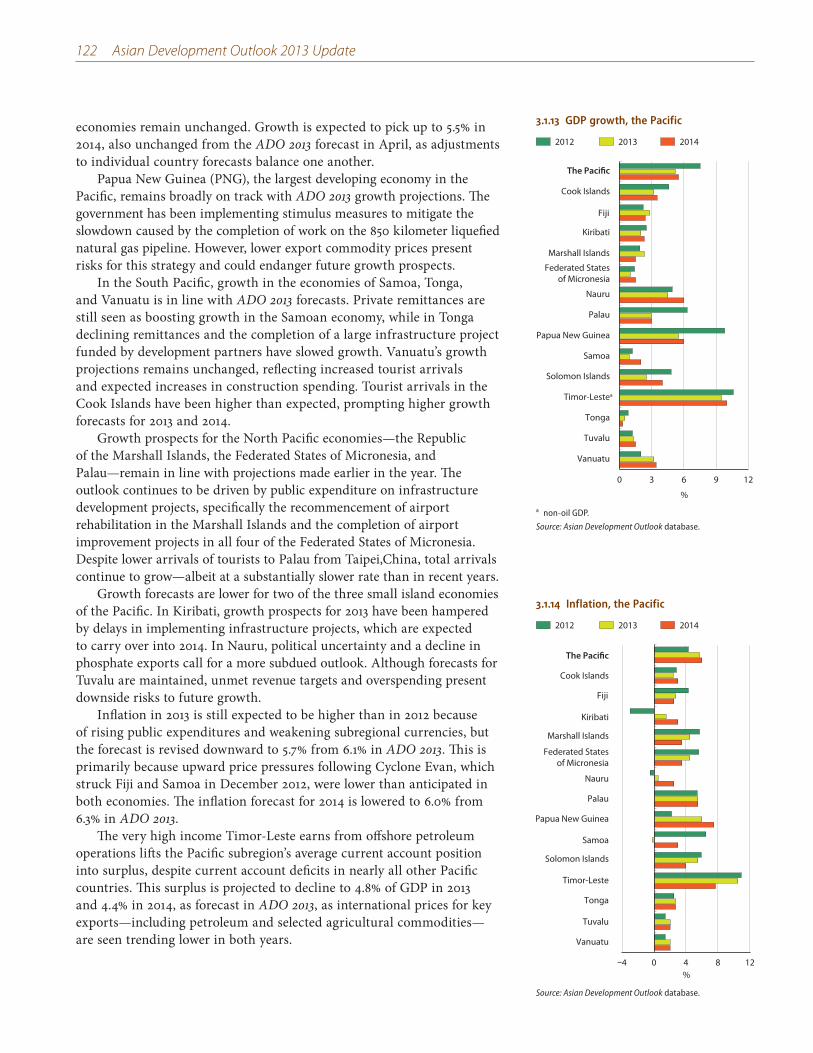
122 Asian Development Outlook 2013 Update
3.1.13 GDP growth, the Pacific
2012 2013 2014
%
0 3 6 9 12
Vanuatu
Tuvalu
Tonga
Timor-Lestea
Solomon Islands
Samoa
Papua New Guinea
Palau
Nauru
Federated Statesof Micronesia
Marshall Islands
Kiribati
Fiji
Cook Islands
The Pacific
a non-oil GDP.
Source: Asian Development Outlook database.
3.1.14 Inflation, the Pacific
–4 0 4 8 12
Vanuatu
Tuvalu
Tonga
Timor-Leste
Solomon Islands
Samoa
Papua New Guinea
Palau
Nauru
Federated Statesof Micronesia
Marshall Islands
Kiribati
Fiji
Cook Islands
The Pacific
2012 2013 2014
%
Source: Asian Development Outlook database.
economies remain unchanged. Growth is expected to pick up to 5.5% in 2014, also unchanged from the ADO 2013 forecast in April, as adjustments to individual country forecasts balance one another.
Papua New Guinea (PNG), the largest developing economy in the Pacific, remains broadly on track with ADO 2013 growth projections. The government has been implementing stimulus measures to mitigate the slowdown caused by the completion of work on the 850 kilometer liquefied natural gas pipeline. However, lower export commodity prices present risks for this strategy and could endanger future growth prospects.
In the South Pacific, growth in the economies of Samoa, Tonga, and Vanuatu is in line with ADO 2013 forecasts. Private remittances are still seen as boosting growth in the Samoan economy, while in Tonga declining remittances and the completion of a large infrastructure project funded by development partners have slowed growth. Vanuatu’s growth projections remains unchanged, reflecting increased tourist arrivals and expected increases in construction spending. Tourist arrivals in the Cook Islands have been higher than expected, prompting higher growth forecasts for 2013 and 2014.
Growth prospects for the North Pacific economies—the Republic of the Marshall Islands, the Federated States of Micronesia, and Palau—remain in line with projections made earlier in the year. The outlook continues to be driven by public expenditure on infrastructure development projects, specifically the recommencement of airport rehabilitation in the Marshall Islands and the completion of airport improvement projects in all four of the Federated States of Micronesia. Despite lower arrivals of tourists to Palau from Taipei,China, total arrivals continue to grow—albeit at a substantially slower rate than in recent years.
Growth forecasts are lower for two of the three small island economies of the Pacific. In Kiribati, growth prospects for 2013 have been hampered by delays in implementing infrastructure projects, which are expected to carry over into 2014. In Nauru, political uncertainty and a decline in phosphate exports call for a more subdued outlook. Although forecasts for Tuvalu are maintained, unmet revenue targets and overspending present downside risks to future growth.
Inflation in 2013 is still expected to be higher than in 2012 because of rising public expenditures and weakening subregional currencies, but the forecast is revised downward to 5.7% from 6.1% in ADO 2013. This is primarily because upward price pressures following Cyclone Evan, which struck Fiji and Samoa in December 2012, were lower than anticipated in both economies. The inflation forecast for 2014 is lowered to 6.0% from 6.3% in ADO 2013.
The very high income Timor-Leste earns from offshore petroleum operations lifts the Pacific subregion’s average current account position into surplus, despite current account deficits in nearly all other Pacific countries. This surplus is projected to decline to 4.8% of GDP in 2013 and 4.4% in 2014, as forecast in ADO 2013, as international prices for key exports—including petroleum and selected agricultural commodities—are seen trending lower in both years.
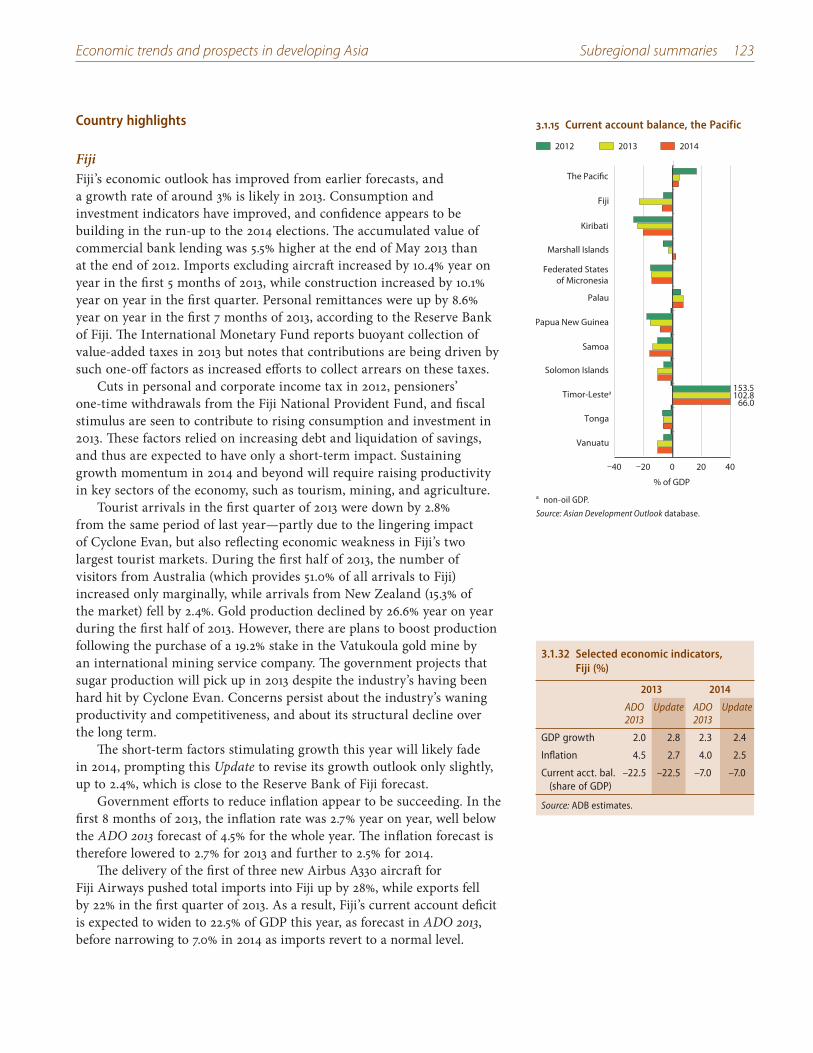
Economic trends and prospects in developing Asia Subregional summaries 123
Country highlights
FijiFiji’s economic outlook has improved from earlier forecasts, and a growth rate of around 3% is likely in 2013. Consumption and investment indicators have improved, and confidence appears to be building in the run-up to the 2014 elections. The accumulated value of commercial bank lending was 5.5% higher at the end of May 2013 than at the end of 2012. Imports excluding aircraft increased by 10.4% year on year in the first 5 months of 2013, while construction increased by 10.1% year on year in the first quarter. Personal remittances were up by 8.6% year on year in the first 7 months of 2013, according to the Reserve Bank of Fiji. The International Monetary Fund reports buoyant collection of value-added taxes in 2013 but notes that contributions are being driven by such one-off factors as increased efforts to collect arrears on these taxes.
Cuts in personal and corporate income tax in 2012, pensioners’ one-time withdrawals from the Fiji National Provident Fund, and fiscal stimulus are seen to contribute to rising consumption and investment in 2013. These factors relied on increasing debt and liquidation of savings, and thus are expected to have only a short-term impact. Sustaining growth momentum in 2014 and beyond will require raising productivity in key sectors of the economy, such as tourism, mining, and agriculture.
Tourist arrivals in the first quarter of 2013 were down by 2.8% from the same period of last year—partly due to the lingering impact of Cyclone Evan, but also reflecting economic weakness in Fiji’s two largest tourist markets. During the first half of 2013, the number of visitors from Australia (which provides 51.0% of all arrivals to Fiji) increased only marginally, while arrivals from New Zealand (15.3% of the market) fell by 2.4%. Gold production declined by 26.6% year on year during the first half of 2013. However, there are plans to boost production following the purchase of a 19.2% stake in the Vatukoula gold mine by an international mining service company. The government projects that sugar production will pick up in 2013 despite the industry’s having been hard hit by Cyclone Evan. Concerns persist about the industry’s waning productivity and competitiveness, and about its structural decline over the long term.
The short-term factors stimulating growth this year will likely fade in 2014, prompting this Update to revise its growth outlook only slightly, up to 2.4%, which is close to the Reserve Bank of Fiji forecast.
Government efforts to reduce inflation appear to be succeeding. In the first 8 months of 2013, the inflation rate was 2.7% year on year, well below the ADO 2013 forecast of 4.5% for the whole year. The inflation forecast is therefore lowered to 2.7% for 2013 and further to 2.5% for 2014.
The delivery of the first of three new Airbus A330 aircraft for Fiji Airways pushed total imports into Fiji up by 28%, while exports fell by 22% in the first quarter of 2013. As a result, Fiji’s current account deficit is expected to widen to 22.5% of GDP this year, as forecast in ADO 2013, before narrowing to 7.0% in 2014 as imports revert to a normal level.
3.1.32 Selected economic indicators, Fiji (%)
2013 2014
ADO 2013
Update ADO 2013
Update
GDP growth 2.0 2.8 2.3 2.4
Inflation 4.5 2.7 4.0 2.5
Current acct. bal. (share of GDP)
–22.5 –22.5 –7.0 –7.0
Source: ADB estimates.
3.1.15 Current account balance, the Pacific
2012 2013 2014
–40 –20 0 20 40
Vanuatu
Tonga
Timor-Lestea
Solomon Islands
Samoa
Papua New Guinea
Palau
Federated Statesof Micronesia
Marshall Islands
Kiribati
Fiji
The Pacific
% of GDP
153.5
66.0102.8
a non-oil GDP.
Source: Asian Development Outlook database.
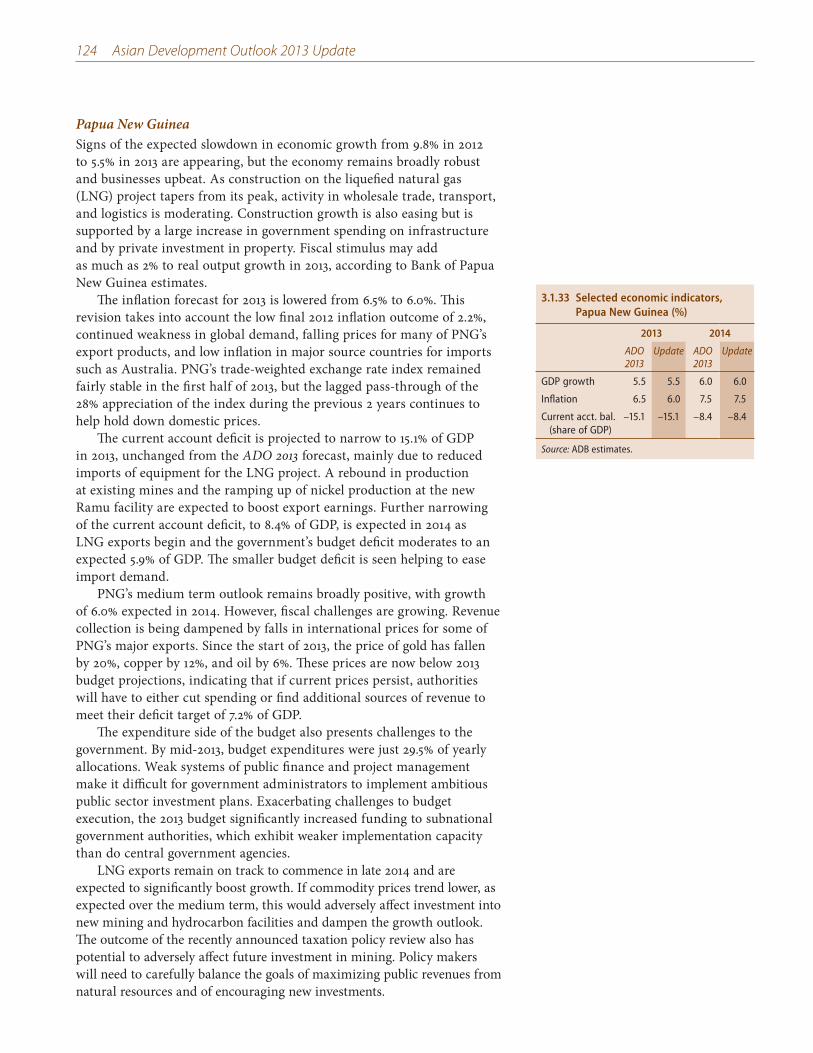
124 Asian Development Outlook 2013 Update
3.1.33 Selected economic indicators, Papua New Guinea (%)
2013 2014
ADO 2013
Update ADO 2013
Update
GDP growth 5.5 5.5 6.0 6.0
Inflation 6.5 6.0 7.5 7.5
Current acct. bal. (share of GDP)
–15.1 –15.1 –8.4 –8.4
Source: ADB estimates.
Papua New GuineaSigns of the expected slowdown in economic growth from 9.8% in 2012 to 5.5% in 2013 are appearing, but the economy remains broadly robust and businesses upbeat. As construction on the liquefied natural gas (LNG) project tapers from its peak, activity in wholesale trade, transport, and logistics is moderating. Construction growth is also easing but is supported by a large increase in government spending on infrastructure and by private investment in property. Fiscal stimulus may add as much as 2% to real output growth in 2013, according to Bank of Papua New Guinea estimates.
The inflation forecast for 2013 is lowered from 6.5% to 6.0%. This revision takes into account the low final 2012 inflation outcome of 2.2%, continued weakness in global demand, falling prices for many of PNG’s export products, and low inflation in major source countries for imports such as Australia. PNG’s trade-weighted exchange rate index remained fairly stable in the first half of 2013, but the lagged pass-through of the 28% appreciation of the index during the previous 2 years continues to help hold down domestic prices.
The current account deficit is projected to narrow to 15.1% of GDP in 2013, unchanged from the ADO 2013 forecast, mainly due to reduced imports of equipment for the LNG project. A rebound in production at existing mines and the ramping up of nickel production at the new Ramu facility are expected to boost export earnings. Further narrowing of the current account deficit, to 8.4% of GDP, is expected in 2014 as LNG exports begin and the government’s budget deficit moderates to an expected 5.9% of GDP. The smaller budget deficit is seen helping to ease import demand.
PNG’s medium term outlook remains broadly positive, with growth of 6.0% expected in 2014. However, fiscal challenges are growing. Revenue collection is being dampened by falls in international prices for some of PNG’s major exports. Since the start of 2013, the price of gold has fallen by 20%, copper by 12%, and oil by 6%. These prices are now below 2013 budget projections, indicating that if current prices persist, authorities will have to either cut spending or find additional sources of revenue to meet their deficit target of 7.2% of GDP.
The expenditure side of the budget also presents challenges to the government. By mid-2013, budget expenditures were just 29.5% of yearly allocations. Weak systems of public finance and project management make it difficult for government administrators to implement ambitious public sector investment plans. Exacerbating challenges to budget execution, the 2013 budget significantly increased funding to subnational government authorities, which exhibit weaker implementation capacity than do central government agencies.
LNG exports remain on track to commence in late 2014 and are expected to significantly boost growth. If commodity prices trend lower, as expected over the medium term, this would adversely affect investment into new mining and hydrocarbon facilities and dampen the growth outlook. The outcome of the recently announced taxation policy review also has potential to adversely affect future investment in mining. Policy makers will need to carefully balance the goals of maximizing public revenues from natural resources and of encouraging new investments.
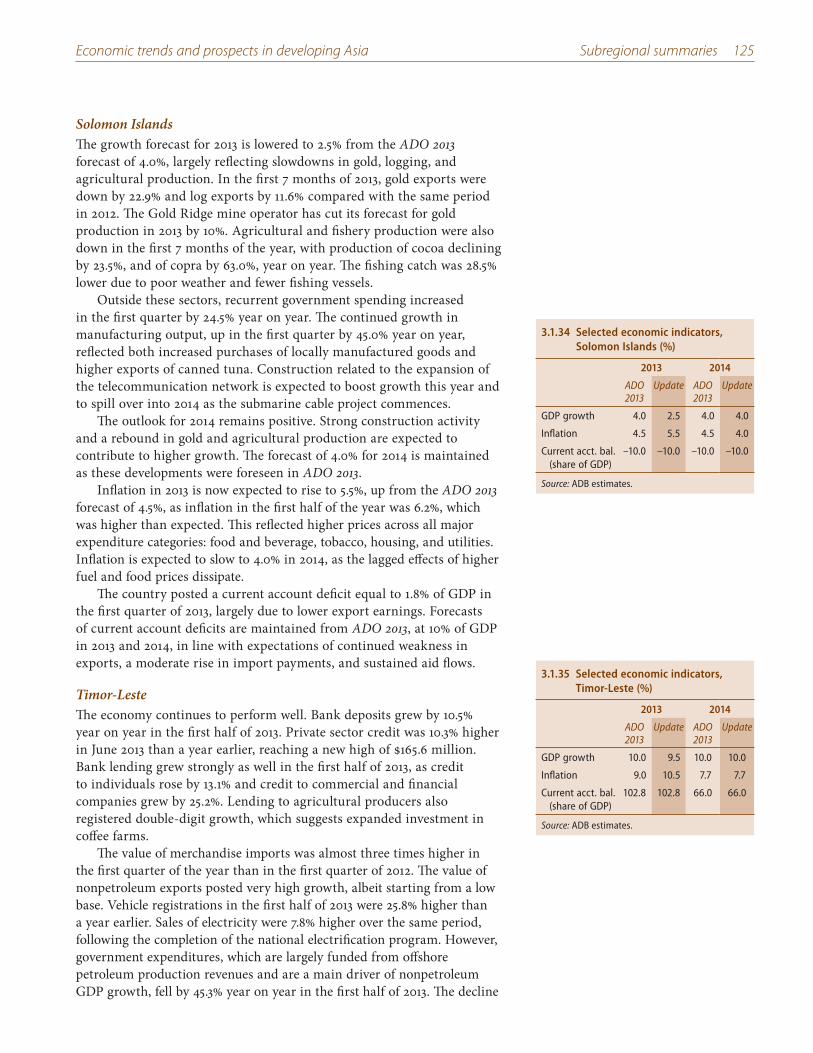
Economic trends and prospects in developing Asia Subregional summaries 125
Solomon IslandsThe growth forecast for 2013 is lowered to 2.5% from the ADO 2013 forecast of 4.0%, largely reflecting slowdowns in gold, logging, and agricultural production. In the first 7 months of 2013, gold exports were down by 22.9% and log exports by 11.6% compared with the same period in 2012. The Gold Ridge mine operator has cut its forecast for gold production in 2013 by 10%. Agricultural and fishery production were also down in the first 7 months of the year, with production of cocoa declining by 23.5%, and of copra by 63.0%, year on year. The fishing catch was 28.5% lower due to poor weather and fewer fishing vessels.
Outside these sectors, recurrent government spending increased in the first quarter by 24.5% year on year. The continued growth in manufacturing output, up in the first quarter by 45.0% year on year, reflected both increased purchases of locally manufactured goods and higher exports of canned tuna. Construction related to the expansion of the telecommunication network is expected to boost growth this year and to spill over into 2014 as the submarine cable project commences.
The outlook for 2014 remains positive. Strong construction activity and a rebound in gold and agricultural production are expected to contribute to higher growth. The forecast of 4.0% for 2014 is maintained as these developments were foreseen in ADO 2013.
Inflation in 2013 is now expected to rise to 5.5%, up from the ADO 2013 forecast of 4.5%, as inflation in the first half of the year was 6.2%, which was higher than expected. This reflected higher prices across all major expenditure categories: food and beverage, tobacco, housing, and utilities. Inflation is expected to slow to 4.0% in 2014, as the lagged effects of higher fuel and food prices dissipate.
The country posted a current account deficit equal to 1.8% of GDP in the first quarter of 2013, largely due to lower export earnings. Forecasts of current account deficits are maintained from ADO 2013, at 10% of GDP in 2013 and 2014, in line with expectations of continued weakness in exports, a moderate rise in import payments, and sustained aid flows.
Timor-LesteThe economy continues to perform well. Bank deposits grew by 10.5% year on year in the first half of 2013. Private sector credit was 10.3% higher in June 2013 than a year earlier, reaching a new high of $165.6 million. Bank lending grew strongly as well in the first half of 2013, as credit to individuals rose by 13.1% and credit to commercial and financial companies grew by 25.2%. Lending to agricultural producers also registered double-digit growth, which suggests expanded investment in coffee farms.
The value of merchandise imports was almost three times higher in the first quarter of the year than in the first quarter of 2012. The value of nonpetroleum exports posted very high growth, albeit starting from a low base. Vehicle registrations in the first half of 2013 were 25.8% higher than a year earlier. Sales of electricity were 7.8% higher over the same period, following the completion of the national electrification program. However, government expenditures, which are largely funded from offshore petroleum production revenues and are a main driver of nonpetroleum GDP growth, fell by 45.3% year on year in the first half of 2013. The decline
3.1.34 Selected economic indicators, Solomon Islands (%)
2013 2014
ADO 2013
Update ADO 2013
Update
GDP growth 4.0 2.5 4.0 4.0
Inflation 4.5 5.5 4.5 4.0
Current acct. bal. (share of GDP)
–10.0 –10.0 –10.0 –10.0
Source: ADB estimates.
3.1.35 Selected economic indicators, Timor-Leste (%)
2013 2014
ADO 2013
Update ADO 2013
Update
GDP growth 10.0 9.5 10.0 10.0
Inflation 9.0 10.5 7.7 7.7
Current acct. bal. (share of GDP)
102.8 102.8 66.0 66.0
Source: ADB estimates.
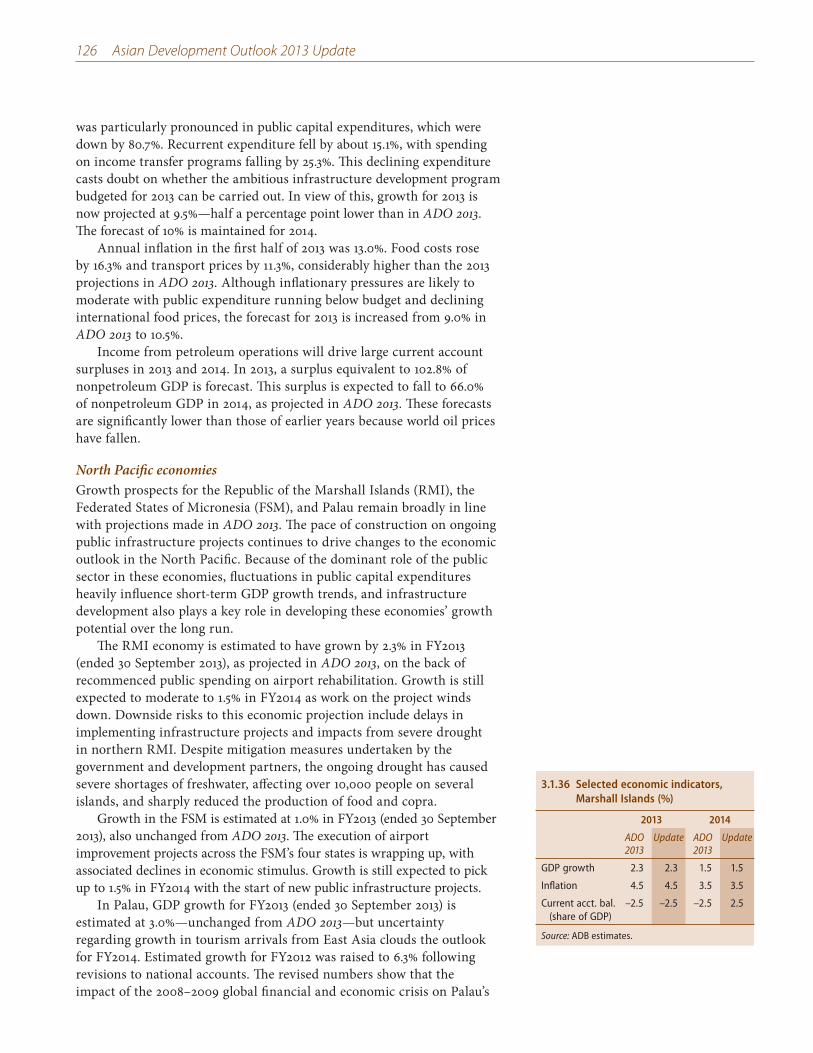
126 Asian Development Outlook 2013 Update
was particularly pronounced in public capital expenditures, which were down by 80.7%. Recurrent expenditure fell by about 15.1%, with spending on income transfer programs falling by 25.3%. This declining expenditure casts doubt on whether the ambitious infrastructure development program budgeted for 2013 can be carried out. In view of this, growth for 2013 is now projected at 9.5%—half a percentage point lower than in ADO 2013. The forecast of 10% is maintained for 2014.
Annual inflation in the first half of 2013 was 13.0%. Food costs rose by 16.3% and transport prices by 11.3%, considerably higher than the 2013 projections in ADO 2013. Although inflationary pressures are likely to moderate with public expenditure running below budget and declining international food prices, the forecast for 2013 is increased from 9.0% in ADO 2013 to 10.5%.
Income from petroleum operations will drive large current account surpluses in 2013 and 2014. In 2013, a surplus equivalent to 102.8% of nonpetroleum GDP is forecast. This surplus is expected to fall to 66.0% of nonpetroleum GDP in 2014, as projected in ADO 2013. These forecasts are significantly lower than those of earlier years because world oil prices have fallen.
North Pacific economiesGrowth prospects for the Republic of the Marshall Islands (RMI), the Federated States of Micronesia (FSM), and Palau remain broadly in line with projections made in ADO 2013. The pace of construction on ongoing public infrastructure projects continues to drive changes to the economic outlook in the North Pacific. Because of the dominant role of the public sector in these economies, fluctuations in public capital expenditures heavily influence short-term GDP growth trends, and infrastructure development also plays a key role in developing these economies’ growth potential over the long run.
The RMI economy is estimated to have grown by 2.3% in FY2013 (ended 30 September 2013), as projected in ADO 2013, on the back of recommenced public spending on airport rehabilitation. Growth is still expected to moderate to 1.5% in FY2014 as work on the project winds down. Downside risks to this economic projection include delays in implementing infrastructure projects and impacts from severe drought in northern RMI. Despite mitigation measures undertaken by the government and development partners, the ongoing drought has caused severe shortages of freshwater, affecting over 10,000 people on several islands, and sharply reduced the production of food and copra.
Growth in the FSM is estimated at 1.0% in FY2013 (ended 30 September 2013), also unchanged from ADO 2013. The execution of airport improvement projects across the FSM’s four states is wrapping up, with associated declines in economic stimulus. Growth is still expected to pick up to 1.5% in FY2014 with the start of new public infrastructure projects.
In Palau, GDP growth for FY2013 (ended 30 September 2013) is estimated at 3.0%—unchanged from ADO 2013—but uncertainty regarding growth in tourism arrivals from East Asia clouds the outlook for FY2014. Estimated growth for FY2012 was raised to 6.3% following revisions to national accounts. The revised numbers show that the impact of the 2008–2009 global financial and economic crisis on Palau’s
3.1.36 Selected economic indicators, Marshall Islands (%)
2013 2014
ADO 2013
Update ADO 2013
Update
GDP growth 2.3 2.3 1.5 1.5
Inflation 4.5 4.5 3.5 3.5
Current acct. bal. (share of GDP)
–2.5 –2.5 –2.5 2.5
Source: ADB estimates.
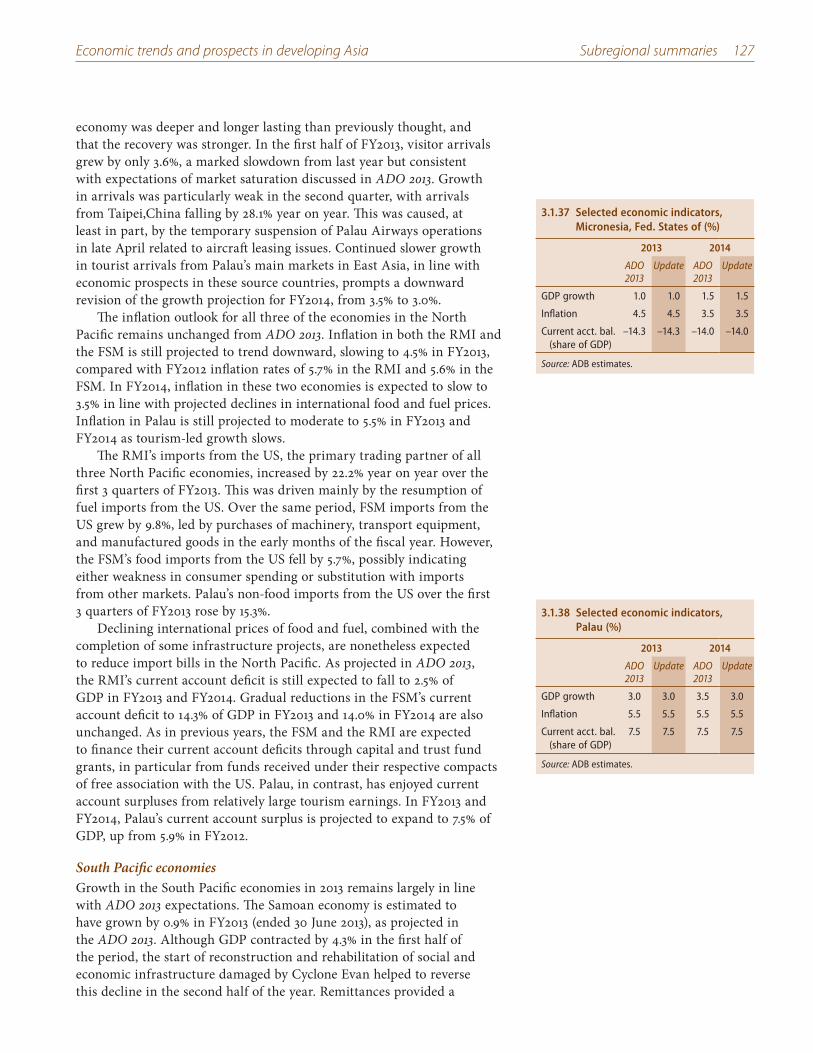
Economic trends and prospects in developing Asia Subregional summaries 127
economy was deeper and longer lasting than previously thought, and that the recovery was stronger. In the first half of FY2013, visitor arrivals grew by only 3.6%, a marked slowdown from last year but consistent with expectations of market saturation discussed in ADO 2013. Growth in arrivals was particularly weak in the second quarter, with arrivals from Taipei,China falling by 28.1% year on year. This was caused, at least in part, by the temporary suspension of Palau Airways operations in late April related to aircraft leasing issues. Continued slower growth in tourist arrivals from Palau’s main markets in East Asia, in line with economic prospects in these source countries, prompts a downward revision of the growth projection for FY2014, from 3.5% to 3.0%.
The inflation outlook for all three of the economies in the North Pacific remains unchanged from ADO 2013. Inflation in both the RMI and the FSM is still projected to trend downward, slowing to 4.5% in FY2013, compared with FY2012 inflation rates of 5.7% in the RMI and 5.6% in the FSM. In FY2014, inflation in these two economies is expected to slow to 3.5% in line with projected declines in international food and fuel prices. Inflation in Palau is still projected to moderate to 5.5% in FY2013 and FY2014 as tourism-led growth slows.
The RMI’s imports from the US, the primary trading partner of all three North Pacific economies, increased by 22.2% year on year over the first 3 quarters of FY2013. This was driven mainly by the resumption of fuel imports from the US. Over the same period, FSM imports from the US grew by 9.8%, led by purchases of machinery, transport equipment, and manufactured goods in the early months of the fiscal year. However, the FSM’s food imports from the US fell by 5.7%, possibly indicating either weakness in consumer spending or substitution with imports from other markets. Palau’s non-food imports from the US over the first 3 quarters of FY2013 rose by 15.3%.
Declining international prices of food and fuel, combined with the completion of some infrastructure projects, are nonetheless expected to reduce import bills in the North Pacific. As projected in ADO 2013, the RMI’s current account deficit is still expected to fall to 2.5% of GDP in FY2013 and FY2014. Gradual reductions in the FSM’s current account deficit to 14.3% of GDP in FY2013 and 14.0% in FY2014 are also unchanged. As in previous years, the FSM and the RMI are expected to finance their current account deficits through capital and trust fund grants, in particular from funds received under their respective compacts of free association with the US. Palau, in contrast, has enjoyed current account surpluses from relatively large tourism earnings. In FY2013 and FY2014, Palau’s current account surplus is projected to expand to 7.5% of GDP, up from 5.9% in FY2012.
South Pacific economiesGrowth in the South Pacific economies in 2013 remains largely in line with ADO 2013 expectations. The Samoan economy is estimated to have grown by 0.9% in FY2013 (ended 30 June 2013), as projected in the ADO 2013. Although GDP contracted by 4.3% in the first half of the period, the start of reconstruction and rehabilitation of social and economic infrastructure damaged by Cyclone Evan helped to reverse this decline in the second half of the year. Remittances provided a
3.1.38 Selected economic indicators, Palau (%)
2013 2014
ADO 2013
Update ADO 2013
Update
GDP growth 3.0 3.0 3.5 3.0
Inflation 5.5 5.5 5.5 5.5
Current acct. bal. (share of GDP)
7.5 7.5 7.5 7.5
Source: ADB estimates.
3.1.37 Selected economic indicators, Micronesia, Fed. States of (%)
2013 2014
ADO 2013
Update ADO 2013
Update
GDP growth 1.0 1.0 1.5 1.5
Inflation 4.5 4.5 3.5 3.5
Current acct. bal. (share of GDP)
–14.3 –14.3 –14.0 –14.0
Source: ADB estimates.
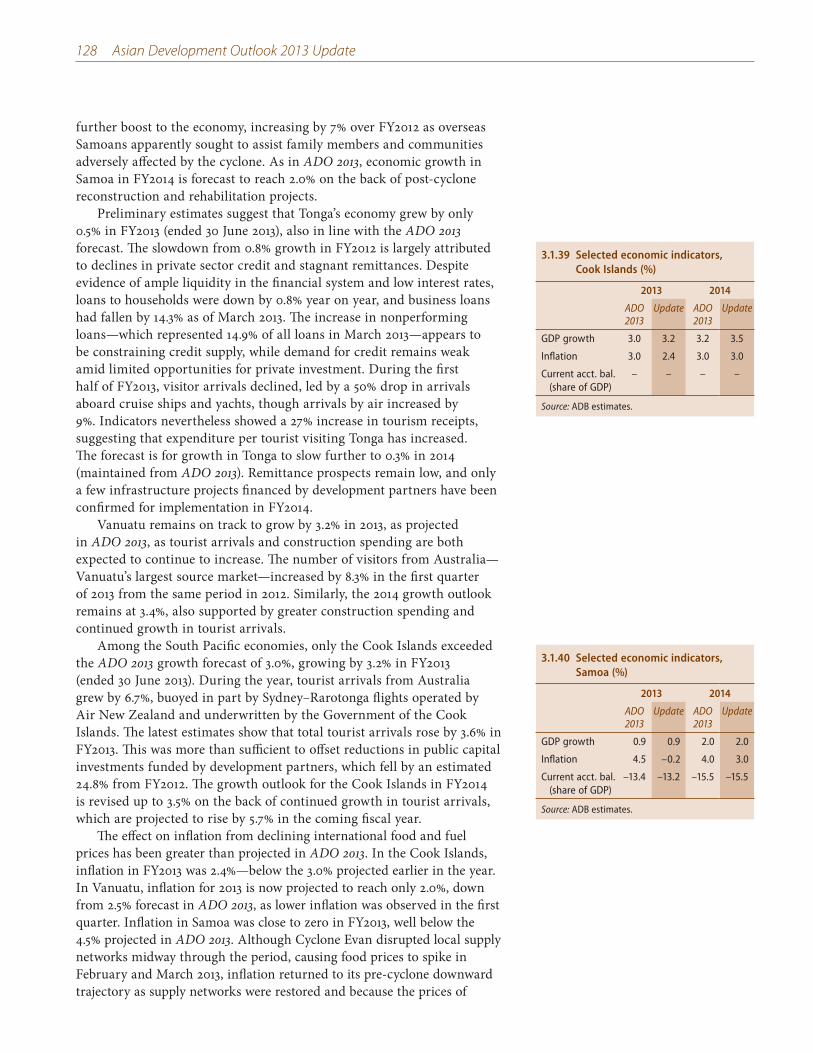
128 Asian Development Outlook 2013 Update
further boost to the economy, increasing by 7% over FY2012 as overseas Samoans apparently sought to assist family members and communities adversely affected by the cyclone. As in ADO 2013, economic growth in Samoa in FY2014 is forecast to reach 2.0% on the back of post-cyclone reconstruction and rehabilitation projects.
Preliminary estimates suggest that Tonga’s economy grew by only 0.5% in FY2013 (ended 30 June 2013), also in line with the ADO 2013 forecast. The slowdown from 0.8% growth in FY2012 is largely attributed to declines in private sector credit and stagnant remittances. Despite evidence of ample liquidity in the financial system and low interest rates, loans to households were down by 0.8% year on year, and business loans had fallen by 14.3% as of March 2013. The increase in nonperforming loans—which represented 14.9% of all loans in March 2013—appears to be constraining credit supply, while demand for credit remains weak amid limited opportunities for private investment. During the first half of FY2013, visitor arrivals declined, led by a 50% drop in arrivals aboard cruise ships and yachts, though arrivals by air increased by 9%. Indicators nevertheless showed a 27% increase in tourism receipts, suggesting that expenditure per tourist visiting Tonga has increased. The forecast is for growth in Tonga to slow further to 0.3% in 2014 (maintained from ADO 2013). Remittance prospects remain low, and only a few infrastructure projects financed by development partners have been confirmed for implementation in FY2014.
Vanuatu remains on track to grow by 3.2% in 2013, as projected in ADO 2013, as tourist arrivals and construction spending are both expected to continue to increase. The number of visitors from Australia—Vanuatu’s largest source market—increased by 8.3% in the first quarter of 2013 from the same period in 2012. Similarly, the 2014 growth outlook remains at 3.4%, also supported by greater construction spending and continued growth in tourist arrivals.
Among the South Pacific economies, only the Cook Islands exceeded the ADO 2013 growth forecast of 3.0%, growing by 3.2% in FY2013 (ended 30 June 2013). During the year, tourist arrivals from Australia grew by 6.7%, buoyed in part by Sydney–Rarotonga flights operated by Air New Zealand and underwritten by the Government of the Cook Islands. The latest estimates show that total tourist arrivals rose by 3.6% in FY2013. This was more than sufficient to offset reductions in public capital investments funded by development partners, which fell by an estimated 24.8% from FY2012. The growth outlook for the Cook Islands in FY2014 is revised up to 3.5% on the back of continued growth in tourist arrivals, which are projected to rise by 5.7% in the coming fiscal year.
The effect on inflation from declining international food and fuel prices has been greater than projected in ADO 2013. In the Cook Islands, inflation in FY2013 was 2.4%—below the 3.0% projected earlier in the year. In Vanuatu, inflation for 2013 is now projected to reach only 2.0%, down from 2.5% forecast in ADO 2013, as lower inflation was observed in the first quarter. Inflation in Samoa was close to zero in FY2013, well below the 4.5% projected in ADO 2013. Although Cyclone Evan disrupted local supply networks midway through the period, causing food prices to spike in February and March 2013, inflation returned to its pre-cyclone downward trajectory as supply networks were restored and because the prices of
3.1.40 Selected economic indicators, Samoa (%)
2013 2014
ADO 2013
Update ADO 2013
Update
GDP growth 0.9 0.9 2.0 2.0
Inflation 4.5 –0.2 4.0 3.0
Current acct. bal. (share of GDP)
–13.4 –13.2 –15.5 –15.5
Source: ADB estimates.
3.1.39 Selected economic indicators, Cook Islands (%)
2013 2014
ADO 2013
Update ADO 2013
Update
GDP growth 3.0 3.2 3.2 3.5
Inflation 3.0 2.4 3.0 3.0
Current acct. bal. (share of GDP)
– – – –
Source: ADB estimates.
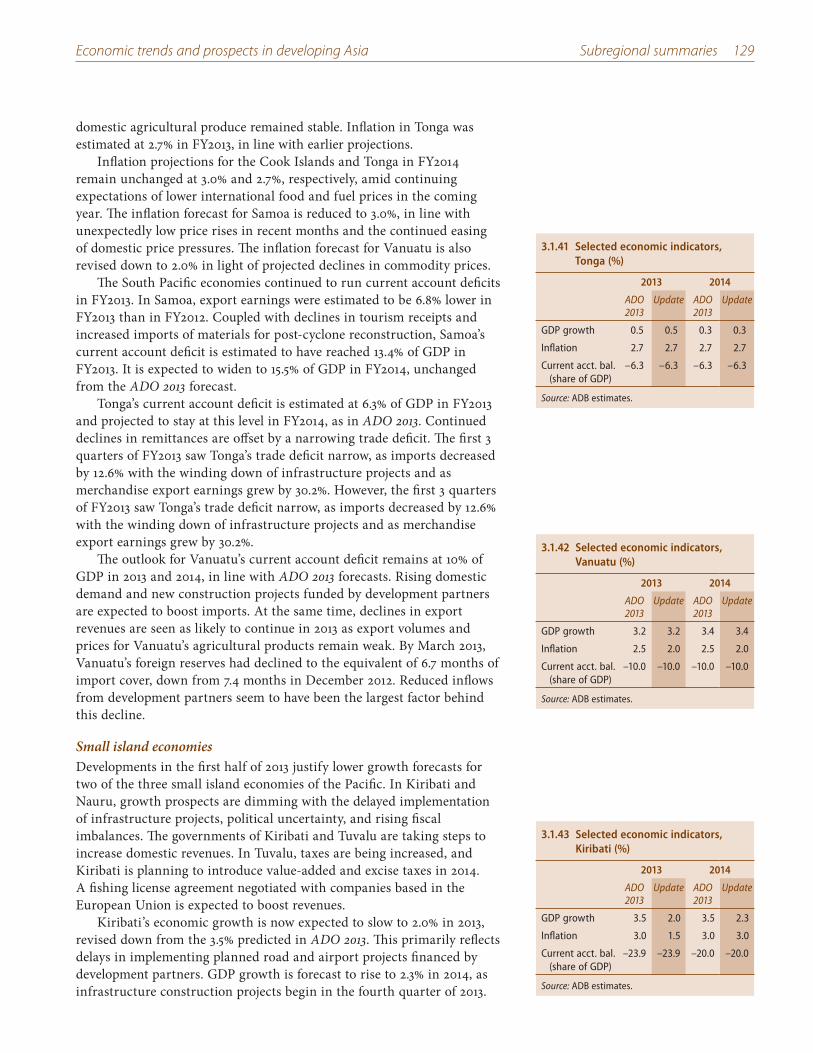
Economic trends and prospects in developing Asia Subregional summaries 129
3.1.41 Selected economic indicators, Tonga (%)
2013 2014
ADO 2013
Update ADO 2013
Update
GDP growth 0.5 0.5 0.3 0.3
Inflation 2.7 2.7 2.7 2.7
Current acct. bal. (share of GDP)
–6.3 –6.3 –6.3 –6.3
Source: ADB estimates.
3.1.42 Selected economic indicators, Vanuatu (%)
2013 2014
ADO 2013
Update ADO 2013
Update
GDP growth 3.2 3.2 3.4 3.4
Inflation 2.5 2.0 2.5 2.0
Current acct. bal. (share of GDP)
–10.0 –10.0 –10.0 –10.0
Source: ADB estimates.
domestic agricultural produce remained stable. Inflation in Tonga was estimated at 2.7% in FY2013, in line with earlier projections.
Inflation projections for the Cook Islands and Tonga in FY2014 remain unchanged at 3.0% and 2.7%, respectively, amid continuing expectations of lower international food and fuel prices in the coming year. The inflation forecast for Samoa is reduced to 3.0%, in line with unexpectedly low price rises in recent months and the continued easing of domestic price pressures. The inflation forecast for Vanuatu is also revised down to 2.0% in light of projected declines in commodity prices.
The South Pacific economies continued to run current account deficits in FY2013. In Samoa, export earnings were estimated to be 6.8% lower in FY2013 than in FY2012. Coupled with declines in tourism receipts and increased imports of materials for post-cyclone reconstruction, Samoa’s current account deficit is estimated to have reached 13.4% of GDP in FY2013. It is expected to widen to 15.5% of GDP in FY2014, unchanged from the ADO 2013 forecast.
Tonga’s current account deficit is estimated at 6.3% of GDP in FY2013 and projected to stay at this level in FY2014, as in ADO 2013. Continued declines in remittances are offset by a narrowing trade deficit. The first 3 quarters of FY2013 saw Tonga’s trade deficit narrow, as imports decreased by 12.6% with the winding down of infrastructure projects and as merchandise export earnings grew by 30.2%. However, the first 3 quarters of FY2013 saw Tonga’s trade deficit narrow, as imports decreased by 12.6% with the winding down of infrastructure projects and as merchandise export earnings grew by 30.2%.
The outlook for Vanuatu’s current account deficit remains at 10% of GDP in 2013 and 2014, in line with ADO 2013 forecasts. Rising domestic demand and new construction projects funded by development partners are expected to boost imports. At the same time, declines in export revenues are seen as likely to continue in 2013 as export volumes and prices for Vanuatu’s agricultural products remain weak. By March 2013, Vanuatu’s foreign reserves had declined to the equivalent of 6.7 months of import cover, down from 7.4 months in December 2012. Reduced inflows from development partners seem to have been the largest factor behind this decline.
Small island economiesDevelopments in the first half of 2013 justify lower growth forecasts for two of the three small island economies of the Pacific. In Kiribati and Nauru, growth prospects are dimming with the delayed implementation of infrastructure projects, political uncertainty, and rising fiscal imbalances. The governments of Kiribati and Tuvalu are taking steps to increase domestic revenues. In Tuvalu, taxes are being increased, and Kiribati is planning to introduce value-added and excise taxes in 2014. A fishing license agreement negotiated with companies based in the European Union is expected to boost revenues.
Kiribati’s economic growth is now expected to slow to 2.0% in 2013, revised down from the 3.5% predicted in ADO 2013. This primarily reflects delays in implementing planned road and airport projects financed by development partners. GDP growth is forecast to rise to 2.3% in 2014, as infrastructure construction projects begin in the fourth quarter of 2013.
3.1.43 Selected economic indicators, Kiribati (%)
2013 2014
ADO 2013
Update ADO 2013
Update
GDP growth 3.5 2.0 3.5 2.3
Inflation 3.0 1.5 3.0 3.0
Current acct. bal. (share of GDP)
–23.9 –23.9 –20.0 –20.0
Source: ADB estimates.
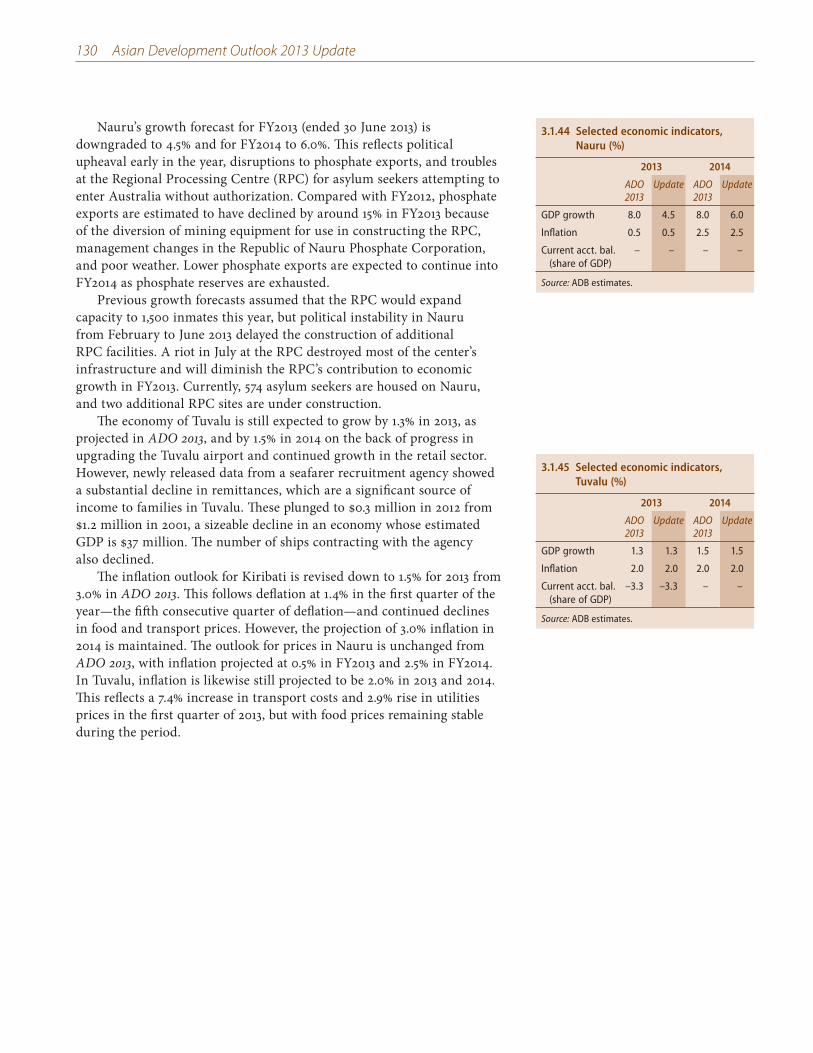
130 Asian Development Outlook 2013 Update
Nauru’s growth forecast for FY2013 (ended 30 June 2013) is downgraded to 4.5% and for FY2014 to 6.0%. This reflects political upheaval early in the year, disruptions to phosphate exports, and troubles at the Regional Processing Centre (RPC) for asylum seekers attempting to enter Australia without authorization. Compared with FY2012, phosphate exports are estimated to have declined by around 15% in FY2013 because of the diversion of mining equipment for use in constructing the RPC, management changes in the Republic of Nauru Phosphate Corporation, and poor weather. Lower phosphate exports are expected to continue into FY2014 as phosphate reserves are exhausted.
Previous growth forecasts assumed that the RPC would expand capacity to 1,500 inmates this year, but political instability in Nauru from February to June 2013 delayed the construction of additional RPC facilities. A riot in July at the RPC destroyed most of the center’s infrastructure and will diminish the RPC’s contribution to economic growth in FY2013. Currently, 574 asylum seekers are housed on Nauru, and two additional RPC sites are under construction.
The economy of Tuvalu is still expected to grow by 1.3% in 2013, as projected in ADO 2013, and by 1.5% in 2014 on the back of progress in upgrading the Tuvalu airport and continued growth in the retail sector. However, newly released data from a seafarer recruitment agency showed a substantial decline in remittances, which are a significant source of income to families in Tuvalu. These plunged to $0.3 million in 2012 from $1.2 million in 2001, a sizeable decline in an economy whose estimated GDP is $37 million. The number of ships contracting with the agency also declined.
The inflation outlook for Kiribati is revised down to 1.5% for 2013 from 3.0% in ADO 2013. This follows deflation at 1.4% in the first quarter of the year—the fifth consecutive quarter of deflation—and continued declines in food and transport prices. However, the projection of 3.0% inflation in 2014 is maintained. The outlook for prices in Nauru is unchanged from ADO 2013, with inflation projected at 0.5% in FY2013 and 2.5% in FY2014. In Tuvalu, inflation is likewise still projected to be 2.0% in 2013 and 2014. This reflects a 7.4% increase in transport costs and 2.9% rise in utilities prices in the first quarter of 2013, but with food prices remaining stable during the period.
3.1.44 Selected economic indicators, Nauru (%)
2013 2014
ADO 2013
Update ADO 2013
Update
GDP growth 8.0 4.5 8.0 6.0
Inflation 0.5 0.5 2.5 2.5
Current acct. bal. (share of GDP)
– – – –
Source: ADB estimates.
3.1.45 Selected economic indicators, Tuvalu (%)
2013 2014
ADO 2013
Update ADO 2013
Update
GDP growth 1.3 1.3 1.5 1.5
Inflation 2.0 2.0 2.0 2.0
Current acct. bal. (share of GDP)
–3.3 –3.3 – –
Source: ADB estimates.
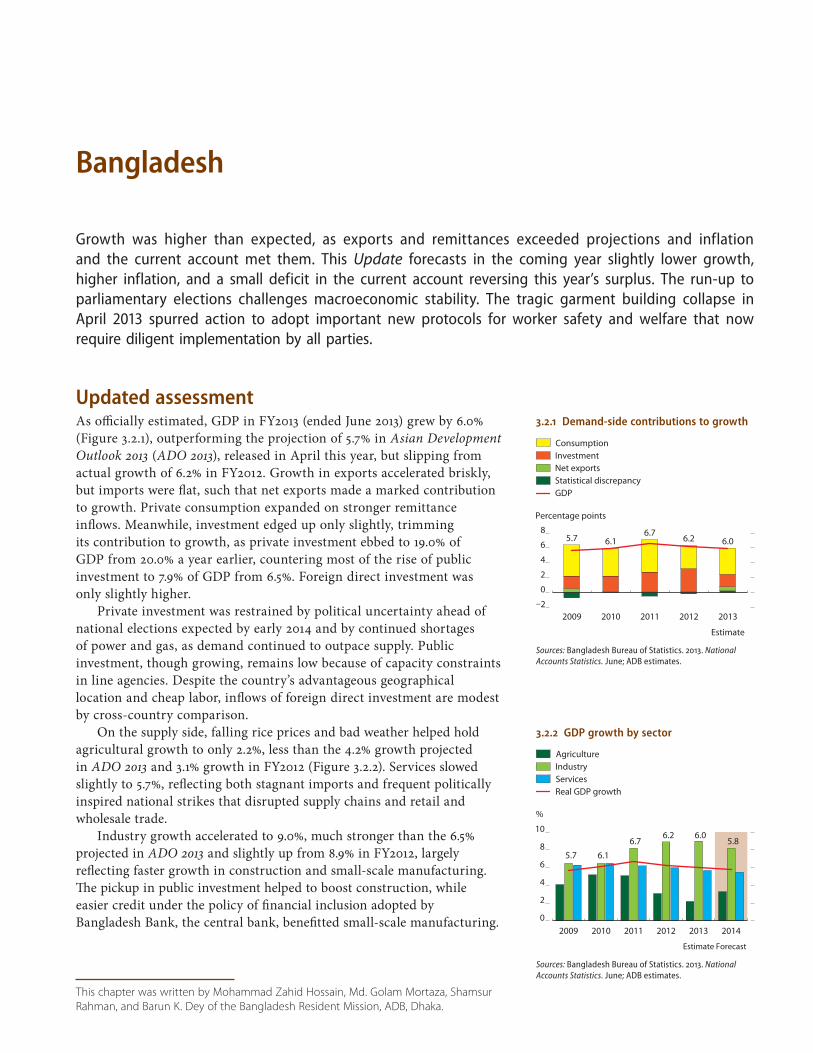
This chapter was written by Mohammad Zahid Hossain, Md. Golam Mortaza, Shamsur
Rahman, and Barun K. Dey of the Bangladesh Resident Mission, ADB, Dhaka.
3.2.1 Demand-side contributions to growth
5.7 6.16.7
6.2 6.0
–2
0
2
4
6
8
2009 2010 2011 2012 2013
Percentage points
Estimate
ConsumptionInvestmentNet exportsStatistical discrepancyGDP
Sources: Bangladesh Bureau of Statistics. 2013. National Accounts Statistics. June; ADB estimates.
Bangladesh
Growth was higher than expected, as exports and remittances exceeded projections and inflation and the current account met them. This Update forecasts in the coming year slightly lower growth, higher inflation, and a small deficit in the current account reversing this year’s surplus. The run-up to parliamentary elections challenges macroeconomic stability. The tragic garment building collapse in April 2013 spurred action to adopt important new protocols for worker safety and welfare that now require diligent implementation by all parties.
Updated assessment As officially estimated, GDP in FY2013 (ended June 2013) grew by 6.0% (Figure 3.2.1), outperforming the projection of 5.7% in Asian Development Outlook 2013 (ADO 2013), released in April this year, but slipping from actual growth of 6.2% in FY2012. Growth in exports accelerated briskly, but imports were flat, such that net exports made a marked contribution to growth. Private consumption expanded on stronger remittance inflows. Meanwhile, investment edged up only slightly, trimming its contribution to growth, as private investment ebbed to 19.0% of GDP from 20.0% a year earlier, countering most of the rise of public investment to 7.9% of GDP from 6.5%. Foreign direct investment was only slightly higher.
Private investment was restrained by political uncertainty ahead of national elections expected by early 2014 and by continued shortages of power and gas, as demand continued to outpace supply. Public investment, though growing, remains low because of capacity constraints in line agencies. Despite the country’s advantageous geographical location and cheap labor, inflows of foreign direct investment are modest by cross-country comparison.
On the supply side, falling rice prices and bad weather helped hold agricultural growth to only 2.2%, less than the 4.2% growth projected in ADO 2013 and 3.1% growth in FY2012 (Figure 3.2.2). Services slowed slightly to 5.7%, reflecting both stagnant imports and frequent politically inspired national strikes that disrupted supply chains and retail and wholesale trade.
Industry growth accelerated to 9.0%, much stronger than the 6.5% projected in ADO 2013 and slightly up from 8.9% in FY2012, largely reflecting faster growth in construction and small-scale manufacturing. The pickup in public investment helped to boost construction, while easier credit under the policy of financial inclusion adopted by Bangladesh Bank, the central bank, benefitted small-scale manufacturing.
3.2.2 GDP growth by sector
0
2
4
6
8
10
Real GDP growthServicesIndustryAgriculture
201420132012201120102009
%
Estimate
5.7
6.06.26.7
6.1
5.8
Forecast
Sources: Bangladesh Bureau of Statistics. 2013. National Accounts Statistics. June; ADB estimates.
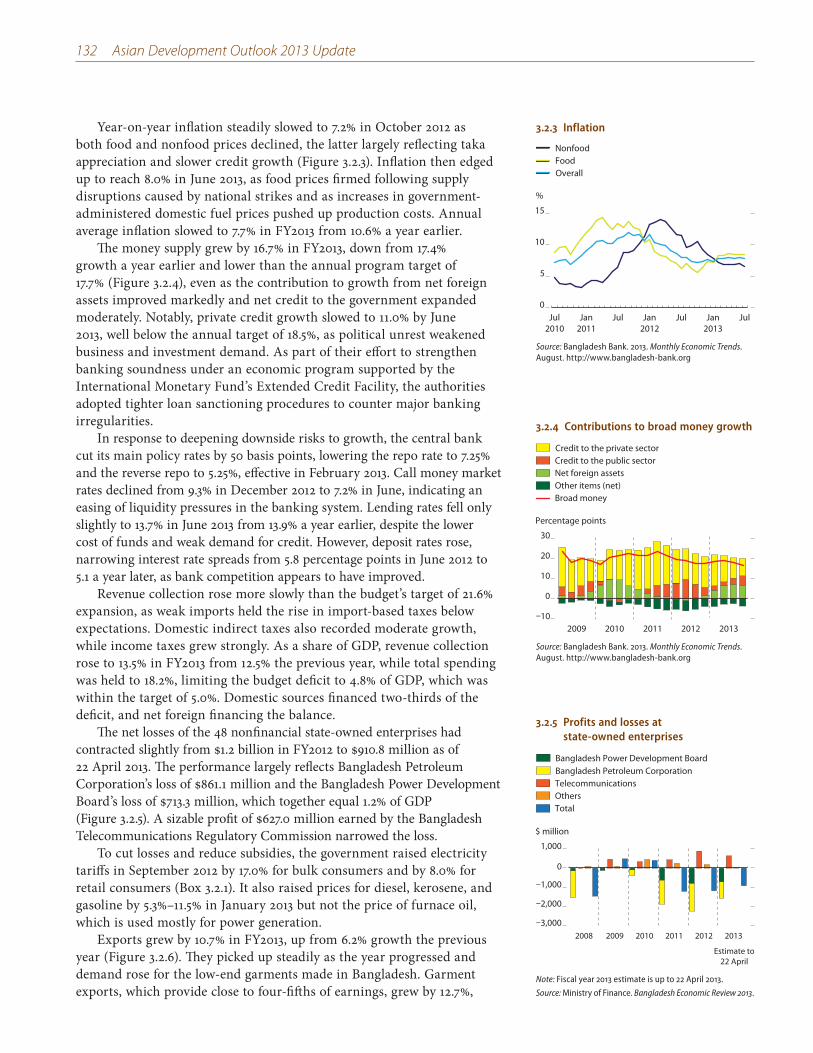
132 Asian Development Outlook 2013 Update
Year-on-year inflation steadily slowed to 7.2% in October 2012 as both food and nonfood prices declined, the latter largely reflecting taka appreciation and slower credit growth (Figure 3.2.3). Inflation then edged up to reach 8.0% in June 2013, as food prices firmed following supply disruptions caused by national strikes and as increases in government-administered domestic fuel prices pushed up production costs. Annual average inflation slowed to 7.7% in FY2013 from 10.6% a year earlier.
The money supply grew by 16.7% in FY2013, down from 17.4% growth a year earlier and lower than the annual program target of 17.7% (Figure 3.2.4), even as the contribution to growth from net foreign assets improved markedly and net credit to the government expanded moderately. Notably, private credit growth slowed to 11.0% by June 2013, well below the annual target of 18.5%, as political unrest weakened business and investment demand. As part of their effort to strengthen banking soundness under an economic program supported by the International Monetary Fund’s Extended Credit Facility, the authorities adopted tighter loan sanctioning procedures to counter major banking irregularities.
In response to deepening downside risks to growth, the central bank cut its main policy rates by 50 basis points, lowering the repo rate to 7.25% and the reverse repo to 5.25%, effective in February 2013. Call money market rates declined from 9.3% in December 2012 to 7.2% in June, indicating an easing of liquidity pressures in the banking system. Lending rates fell only slightly to 13.7% in June 2013 from 13.9% a year earlier, despite the lower cost of funds and weak demand for credit. However, deposit rates rose, narrowing interest rate spreads from 5.8 percentage points in June 2012 to 5.1 a year later, as bank competition appears to have improved.
Revenue collection rose more slowly than the budget’s target of 21.6% expansion, as weak imports held the rise in import-based taxes below expectations. Domestic indirect taxes also recorded moderate growth, while income taxes grew strongly. As a share of GDP, revenue collection rose to 13.5% in FY2013 from 12.5% the previous year, while total spending was held to 18.2%, limiting the budget deficit to 4.8% of GDP, which was within the target of 5.0%. Domestic sources financed two-thirds of the deficit, and net foreign financing the balance.
The net losses of the 48 nonfinancial state-owned enterprises had contracted slightly from $1.2 billion in FY2012 to $910.8 million as of 22 April 2013. The performance largely reflects Bangladesh Petroleum Corporation’s loss of $861.1 million and the Bangladesh Power Development Board’s loss of $713.3 million, which together equal 1.2% of GDP (Figure 3.2.5). A sizable profit of $627.0 million earned by the Bangladesh Telecommunications Regulatory Commission narrowed the loss.
To cut losses and reduce subsidies, the government raised electricity tariffs in September 2012 by 17.0% for bulk consumers and by 8.0% for retail consumers (Box 3.2.1). It also raised prices for diesel, kerosene, and gasoline by 5.3%–11.5% in January 2013 but not the price of furnace oil, which is used mostly for power generation.
Exports grew by 10.7% in FY2013, up from 6.2% growth the previous year (Figure 3.2.6). They picked up steadily as the year progressed and demand rose for the low-end garments made in Bangladesh. Garment exports, which provide close to four-fifths of earnings, grew by 12.7%,
3.2.3 Inflation
0
5
10
15
Nonfood Food Overall
JulJan2013
JulJan2012
JulJan2011
Jul2010
%
Source: Bangladesh Bank. 2013. Monthly Economic Trends. August. http://www.bangladesh-bank.org
3.2.4 Contributions to broad money growth
Percentage points
–10
0
10
20
30
2009 2010 2011 2012 2013
Credit to the private sectorCredit to the public sectorNet foreign assetsOther items (net)Broad money
Source: Bangladesh Bank. 2013. Monthly Economic Trends. August. http://www.bangladesh-bank.org
3.2.5 Profits and losses at state-owned enterprises
Bangladesh Petroleum CorporationTelecommunicationsOthersTotal
Bangladesh Power Development Board
–3,000
–2,000
–1,000
0
1,000
2008 2009 2010 2011 2012 2013
$ million
Estimate to22 April
Note: Fiscal year 2013 estimate is up to 22 April 2013.
Source: Ministry of Finance. Bangladesh Economic Review 2013.
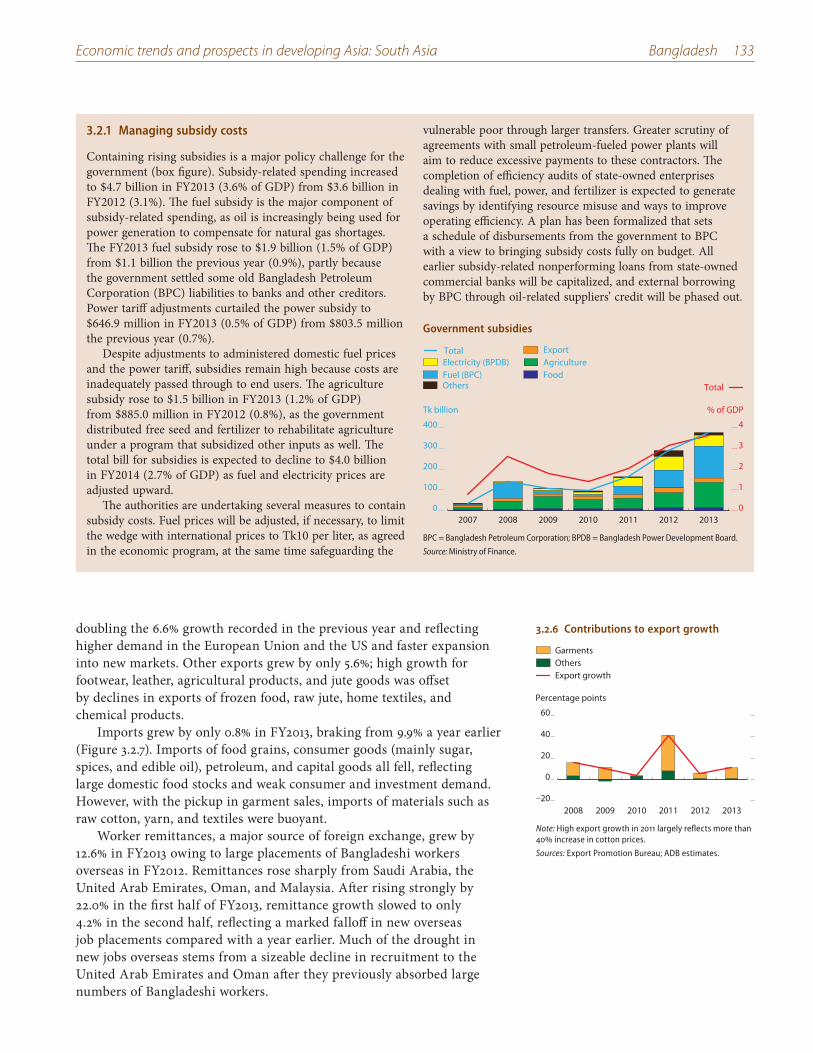
Economic trends and prospects in developing Asia: South Asia Bangladesh 133
3.2.1 Managing subsidy costs
Containing rising subsidies is a major policy challenge for the government (box figure). Subsidy-related spending increased to $4.7 billion in FY2013 (3.6% of GDP) from $3.6 billion in FY2012 (3.1%). The fuel subsidy is the major component of subsidy-related spending, as oil is increasingly being used for power generation to compensate for natural gas shortages. The FY2013 fuel subsidy rose to $1.9 billion (1.5% of GDP) from $1.1 billion the previous year (0.9%), partly because the government settled some old Bangladesh Petroleum Corporation (BPC) liabilities to banks and other creditors. Power tariff adjustments curtailed the power subsidy to $646.9 million in FY2013 (0.5% of GDP) from $803.5 million the previous year (0.7%).
Despite adjustments to administered domestic fuel prices and the power tariff, subsidies remain high because costs are inadequately passed through to end users. The agriculture subsidy rose to $1.5 billion in FY2013 (1.2% of GDP) from $885.0 million in FY2012 (0.8%), as the government distributed free seed and fertilizer to rehabilitate agriculture under a program that subsidized other inputs as well. The total bill for subsidies is expected to decline to $4.0 billion in FY2014 (2.7% of GDP) as fuel and electricity prices are adjusted upward.
The authorities are undertaking several measures to contain subsidy costs. Fuel prices will be adjusted, if necessary, to limit the wedge with international prices to Tk10 per liter, as agreed in the economic program, at the same time safeguarding the
vulnerable poor through larger transfers. Greater scrutiny of agreements with small petroleum-fueled power plants will aim to reduce excessive payments to these contractors. The completion of efficiency audits of state-owned enterprises dealing with fuel, power, and fertilizer is expected to generate savings by identifying resource misuse and ways to improve operating efficiency. A plan has been formalized that sets a schedule of disbursements from the government to BPC with a view to bringing subsidy costs fully on budget. All earlier subsidy-related nonperforming loans from state-owned commercial banks will be capitalized, and external borrowing by BPC through oil-related suppliers’ credit will be phased out.
doubling the 6.6% growth recorded in the previous year and reflecting higher demand in the European Union and the US and faster expansion into new markets. Other exports grew by only 5.6%; high growth for footwear, leather, agricultural products, and jute goods was offset by declines in exports of frozen food, raw jute, home textiles, and chemical products.
Imports grew by only 0.8% in FY2013, braking from 9.9% a year earlier (Figure 3.2.7). Imports of food grains, consumer goods (mainly sugar, spices, and edible oil), petroleum, and capital goods all fell, reflecting large domestic food stocks and weak consumer and investment demand. However, with the pickup in garment sales, imports of materials such as raw cotton, yarn, and textiles were buoyant.
Worker remittances, a major source of foreign exchange, grew by 12.6% in FY2013 owing to large placements of Bangladeshi workers overseas in FY2012. Remittances rose sharply from Saudi Arabia, the United Arab Emirates, Oman, and Malaysia. After rising strongly by 22.0% in the first half of FY2013, remittance growth slowed to only 4.2% in the second half, reflecting a marked falloff in new overseas job placements compared with a year earlier. Much of the drought in new jobs overseas stems from a sizeable decline in recruitment to the United Arab Emirates and Oman after they previously absorbed large numbers of Bangladeshi workers.
Government subsidies
0
100
200
300
400
0
1
2
3
4
Total
Total
Others
Electricity (BPDB)Fuel (BPC)
ExportAgricultureFood
2013201220112010200920082007
Tk billion % of GDP
BPC = Bangladesh Petroleum Corporation; BPDB = Bangladesh Power Development Board.
Source: Ministry of Finance.
3.2.6 Contributions to export growth
–20
0
20
40
60
2008 2009 2010 2011 2012 2013
Percentage points
GarmentsOthersExport growth
Note: High export growth in 2011 largely reflects more than 40 increase in cotton prices.
Sources: Export Promotion Bureau; ADB estimates.
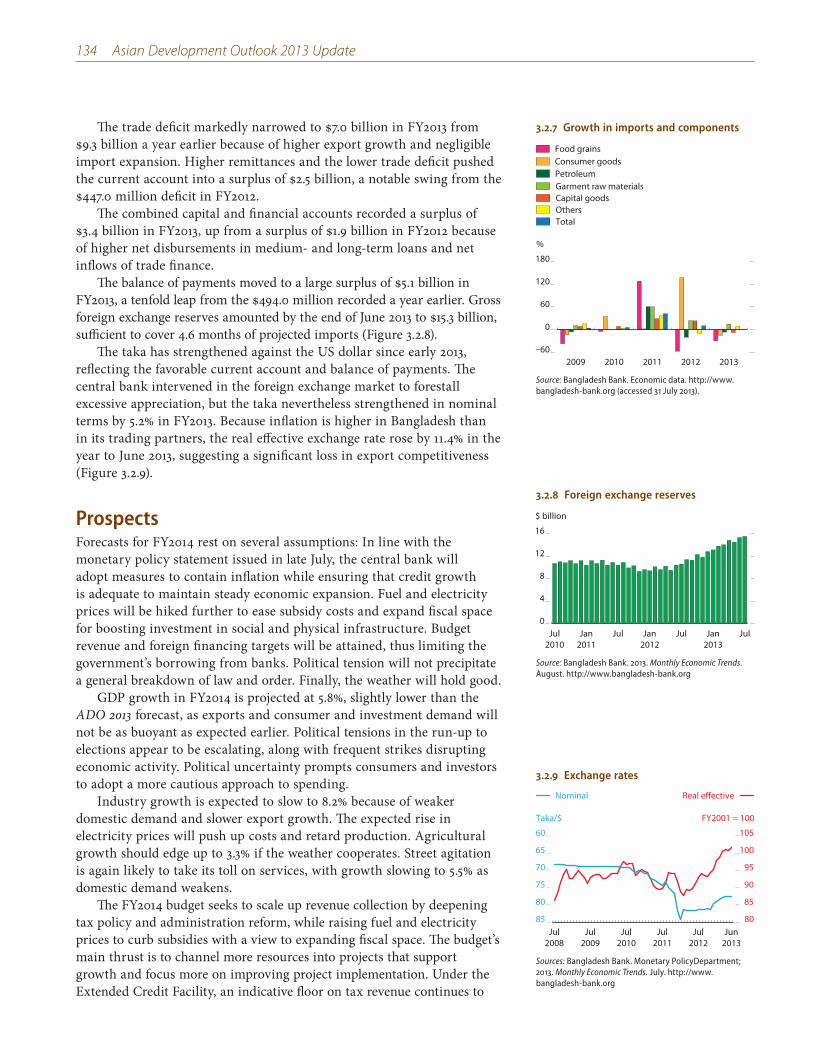
134 Asian Development Outlook 2013 Update
The trade deficit markedly narrowed to $7.0 billion in FY2013 from $9.3 billion a year earlier because of higher export growth and negligible import expansion. Higher remittances and the lower trade deficit pushed the current account into a surplus of $2.5 billion, a notable swing from the $447.0 million deficit in FY2012.
The combined capital and financial accounts recorded a surplus of $3.4 billion in FY2013, up from a surplus of $1.9 billion in FY2012 because of higher net disbursements in medium- and long-term loans and net inflows of trade finance.
The balance of payments moved to a large surplus of $5.1 billion in FY2013, a tenfold leap from the $494.0 million recorded a year earlier. Gross foreign exchange reserves amounted by the end of June 2013 to $15.3 billion, sufficient to cover 4.6 months of projected imports (Figure 3.2.8).
The taka has strengthened against the US dollar since early 2013, reflecting the favorable current account and balance of payments. The central bank intervened in the foreign exchange market to forestall excessive appreciation, but the taka nevertheless strengthened in nominal terms by 5.2% in FY2013. Because inflation is higher in Bangladesh than in its trading partners, the real effective exchange rate rose by 11.4% in the year to June 2013, suggesting a significant loss in export competitiveness (Figure 3.2.9).
Prospects Forecasts for FY2014 rest on several assumptions: In line with the monetary policy statement issued in late July, the central bank will adopt measures to contain inflation while ensuring that credit growth is adequate to maintain steady economic expansion. Fuel and electricity prices will be hiked further to ease subsidy costs and expand fiscal space for boosting investment in social and physical infrastructure. Budget revenue and foreign financing targets will be attained, thus limiting the government’s borrowing from banks. Political tension will not precipitate a general breakdown of law and order. Finally, the weather will hold good.
GDP growth in FY2014 is projected at 5.8%, slightly lower than the ADO 2013 forecast, as exports and consumer and investment demand will not be as buoyant as expected earlier. Political tensions in the run-up to elections appear to be escalating, along with frequent strikes disrupting economic activity. Political uncertainty prompts consumers and investors to adopt a more cautious approach to spending.
Industry growth is expected to slow to 8.2% because of weaker domestic demand and slower export growth. The expected rise in electricity prices will push up costs and retard production. Agricultural growth should edge up to 3.3% if the weather cooperates. Street agitation is again likely to take its toll on services, with growth slowing to 5.5% as domestic demand weakens.
The FY2014 budget seeks to scale up revenue collection by deepening tax policy and administration reform, while raising fuel and electricity prices to curb subsidies with a view to expanding fiscal space. The budget’s main thrust is to channel more resources into projects that support growth and focus more on improving project implementation. Under the Extended Credit Facility, an indicative floor on tax revenue continues to
3.2.7 Growth in imports and components
–60
0
60
120
180
TotalOthersCapital goodsGarment raw materialsPetroleumConsumer goodsFood grains
20132012201120102009
%
Source: Bangladesh Bank. Economic data. http://www.bangladesh-bank.org (accessed 31 July 2013).
3.2.8 Foreign exchange reserves
0
4
8
12
16
JulJan2013
JulJan2012
JulJan2011
Jul2010
$ billion
Source: Bangladesh Bank. 2013. Monthly Economic Trends. August. http://www.bangladesh-bank.org
3.2.9 Exchange rates
85
80
75
70
65
60
80
85
90
95
100
105
Real effectiveNominal
Jun2013
Jul2012
Jul2011
Jul2010
Jul2009
Jul2008
Taka/$ FY2001 = 100
Sources: Bangladesh Bank. Monetary PolicyDepartment; 2013. Monthly Economic Trends. July. http://www.bangladesh-bank.org
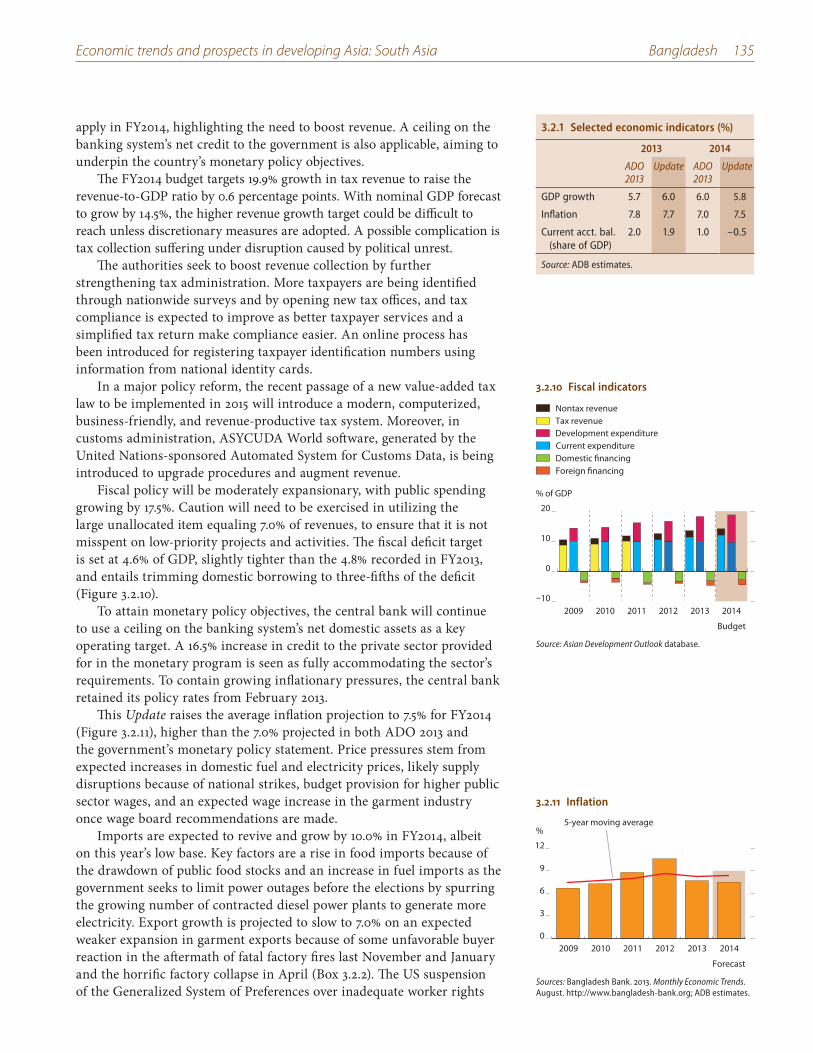
Economic trends and prospects in developing Asia: South Asia Bangladesh 135
apply in FY2014, highlighting the need to boost revenue. A ceiling on the banking system’s net credit to the government is also applicable, aiming to underpin the country’s monetary policy objectives.
The FY2014 budget targets 19.9% growth in tax revenue to raise the revenue-to-GDP ratio by 0.6 percentage points. With nominal GDP forecast to grow by 14.5%, the higher revenue growth target could be difficult to reach unless discretionary measures are adopted. A possible complication is tax collection suffering under disruption caused by political unrest.
The authorities seek to boost revenue collection by further strengthening tax administration. More taxpayers are being identified through nationwide surveys and by opening new tax offices, and tax compliance is expected to improve as better taxpayer services and a simplified tax return make compliance easier. An online process has been introduced for registering taxpayer identification numbers using information from national identity cards.
In a major policy reform, the recent passage of a new value-added tax law to be implemented in 2015 will introduce a modern, computerized, business-friendly, and revenue-productive tax system. Moreover, in customs administration, ASYCUDA World software, generated by the United Nations-sponsored Automated System for Customs Data, is being introduced to upgrade procedures and augment revenue.
Fiscal policy will be moderately expansionary, with public spending growing by 17.5%. Caution will need to be exercised in utilizing the large unallocated item equaling 7.0% of revenues, to ensure that it is not misspent on low-priority projects and activities. The fiscal deficit target is set at 4.6% of GDP, slightly tighter than the 4.8% recorded in FY2013, and entails trimming domestic borrowing to three-fifths of the deficit (Figure 3.2.10).
To attain monetary policy objectives, the central bank will continue to use a ceiling on the banking system’s net domestic assets as a key operating target. A 16.5% increase in credit to the private sector provided for in the monetary program is seen as fully accommodating the sector’s requirements. To contain growing inflationary pressures, the central bank retained its policy rates from February 2013.
This Update raises the average inflation projection to 7.5% for FY2014 (Figure 3.2.11), higher than the 7.0% projected in both ADO 2013 and the government’s monetary policy statement. Price pressures stem from expected increases in domestic fuel and electricity prices, likely supply disruptions because of national strikes, budget provision for higher public sector wages, and an expected wage increase in the garment industry once wage board recommendations are made.
Imports are expected to revive and grow by 10.0% in FY2014, albeit on this year’s low base. Key factors are a rise in food imports because of the drawdown of public food stocks and an increase in fuel imports as the government seeks to limit power outages before the elections by spurring the growing number of contracted diesel power plants to generate more electricity. Export growth is projected to slow to 7.0% on an expected weaker expansion in garment exports because of some unfavorable buyer reaction in the aftermath of fatal factory fires last November and January and the horrific factory collapse in April (Box 3.2.2). The US suspension of the Generalized System of Preferences over inadequate worker rights
3.2.1 Selected economic indicators (%)
2013 2014
ADO 2013
Update ADO 2013
Update
GDP growth 5.7 6.0 6.0 5.8
Inflation 7.8 7.7 7.0 7.5
Current acct. bal. (share of GDP)
2.0 1.9 1.0 –0.5
Source: ADB estimates.
3.2.10 Fiscal indicators
–10
0
10
20
Foreign financingDomestic financing
Development expenditureCurrent expenditure
Nontax revenueTax revenue
201420132012201120102009
% of GDP
Budget
Source: Asian Development Outlook database.
3.2.11 Inflation
0
3
6
9
12
201420132012201120102009
%5-year moving average
Forecast
Sources: Bangladesh Bank. 2013. Monthly Economic Trends. August. http://www.bangladesh-bank.org; ADB estimates.
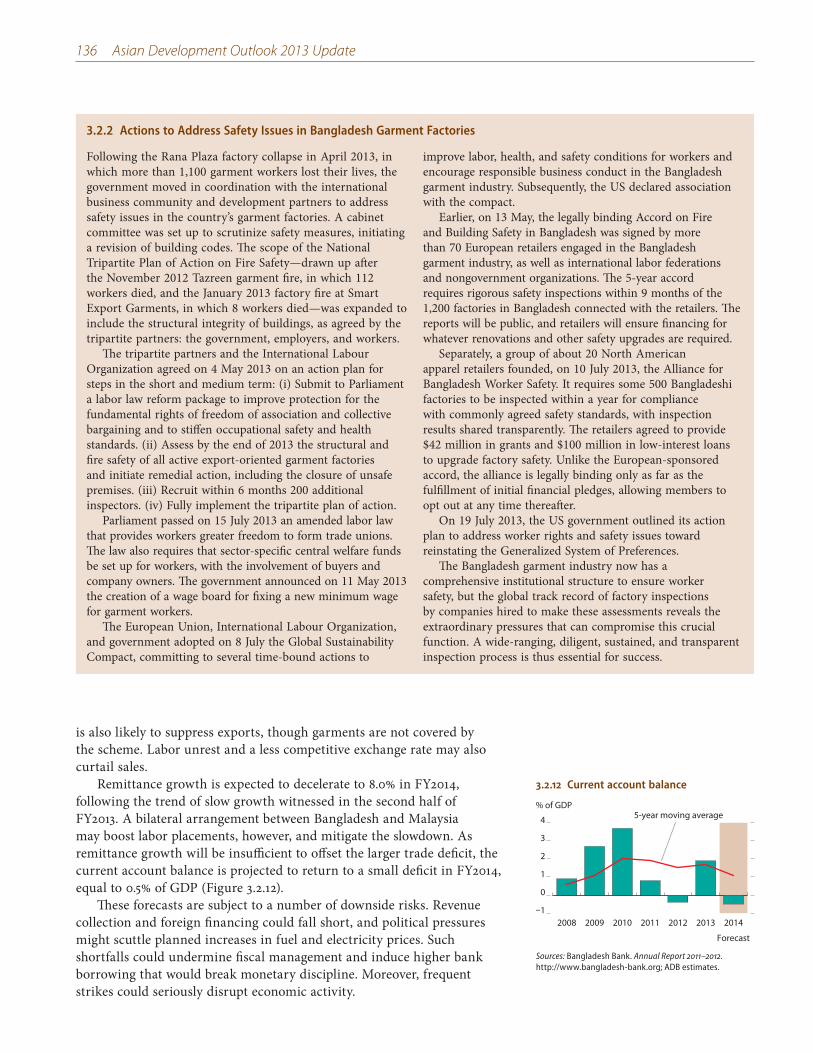
136 Asian Development Outlook 2013 Update
3.2.2 Actions to Address Safety Issues in Bangladesh Garment Factories
Following the Rana Plaza factory collapse in April 2013, in which more than 1,100 garment workers lost their lives, the government moved in coordination with the international business community and development partners to address safety issues in the country’s garment factories. A cabinet committee was set up to scrutinize safety measures, initiating a revision of building codes. The scope of the National Tripartite Plan of Action on Fire Safety—drawn up after the November 2012 Tazreen garment fire, in which 112 workers died, and the January 2013 factory fire at Smart Export Garments, in which 8 workers died—was expanded to include the structural integrity of buildings, as agreed by the tripartite partners: the government, employers, and workers.
The tripartite partners and the International Labour Organization agreed on 4 May 2013 on an action plan for steps in the short and medium term: (i) Submit to Parliament a labor law reform package to improve protection for the fundamental rights of freedom of association and collective bargaining and to stiffen occupational safety and health standards. (ii) Assess by the end of 2013 the structural and fire safety of all active export-oriented garment factories and initiate remedial action, including the closure of unsafe premises. (iii) Recruit within 6 months 200 additional inspectors. (iv) Fully implement the tripartite plan of action.
Parliament passed on 15 July 2013 an amended labor law that provides workers greater freedom to form trade unions. The law also requires that sector-specific central welfare funds be set up for workers, with the involvement of buyers and company owners. The government announced on 11 May 2013 the creation of a wage board for fixing a new minimum wage for garment workers.
The European Union, International Labour Organization, and government adopted on 8 July the Global Sustainability Compact, committing to several time-bound actions to
improve labor, health, and safety conditions for workers and encourage responsible business conduct in the Bangladesh garment industry. Subsequently, the US declared association with the compact.
Earlier, on 13 May, the legally binding Accord on Fire and Building Safety in Bangladesh was signed by more than 70 European retailers engaged in the Bangladesh garment industry, as well as international labor federations and nongovernment organizations. The 5-year accord requires rigorous safety inspections within 9 months of the 1,200 factories in Bangladesh connected with the retailers. The reports will be public, and retailers will ensure financing for whatever renovations and other safety upgrades are required.
Separately, a group of about 20 North American apparel retailers founded, on 10 July 2013, the Alliance for Bangladesh Worker Safety. It requires some 500 Bangladeshi factories to be inspected within a year for compliance with commonly agreed safety standards, with inspection results shared transparently. The retailers agreed to provide $42 million in grants and $100 million in low-interest loans to upgrade factory safety. Unlike the European-sponsored accord, the alliance is legally binding only as far as the fulfillment of initial financial pledges, allowing members to opt out at any time thereafter.
On 19 July 2013, the US government outlined its action plan to address worker rights and safety issues toward reinstating the Generalized System of Preferences.
The Bangladesh garment industry now has a comprehensive institutional structure to ensure worker safety, but the global track record of factory inspections by companies hired to make these assessments reveals the extraordinary pressures that can compromise this crucial function. A wide-ranging, diligent, sustained, and transparent inspection process is thus essential for success.
is also likely to suppress exports, though garments are not covered by the scheme. Labor unrest and a less competitive exchange rate may also curtail sales.
Remittance growth is expected to decelerate to 8.0% in FY2014, following the trend of slow growth witnessed in the second half of FY2013. A bilateral arrangement between Bangladesh and Malaysia may boost labor placements, however, and mitigate the slowdown. As remittance growth will be insufficient to offset the larger trade deficit, the current account balance is projected to return to a small deficit in FY2014, equal to 0.5% of GDP (Figure 3.2.12).
These forecasts are subject to a number of downside risks. Revenue collection and foreign financing could fall short, and political pressures might scuttle planned increases in fuel and electricity prices. Such shortfalls could undermine fiscal management and induce higher bank borrowing that would break monetary discipline. Moreover, frequent strikes could seriously disrupt economic activity.
3.2.12 Current account balance
–1
0
1
2
3
4
2014201320122011201020092008
% of GDP
Forecast
5-year moving average
Sources: Bangladesh Bank. Annual Report 2011–2012. http://www.bangladesh-bank.org; ADB estimates.
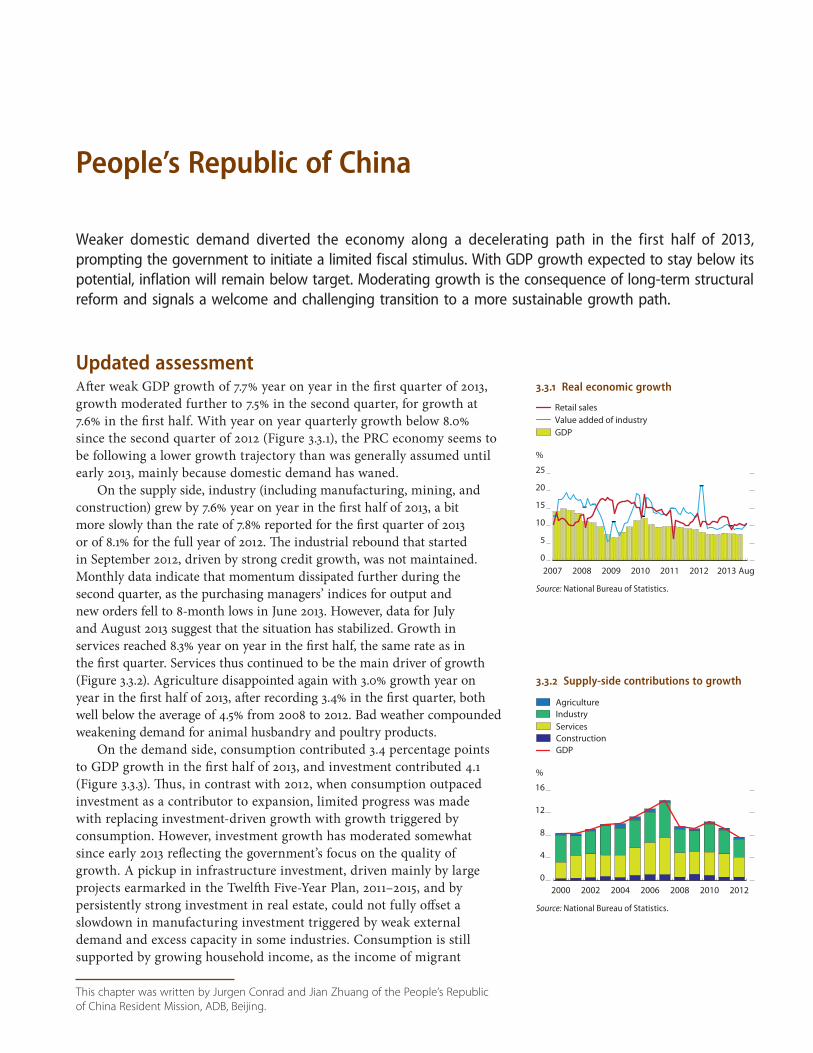
This chapter was written by Jurgen Conrad and Jian Zhuang of the People’s Republic
of China Resident Mission, ADB, Beijing.
People’s Republic of China
Weaker domestic demand diverted the economy along a decelerating path in the first half of 2013, prompting the government to initiate a limited fiscal stimulus. With GDP growth expected to stay below its potential, inflation will remain below target. Moderating growth is the consequence of long-term structural reform and signals a welcome and challenging transition to a more sustainable growth path.
Updated assessmentAfter weak GDP growth of 7.7% year on year in the first quarter of 2013, growth moderated further to 7.5% in the second quarter, for growth at 7.6% in the first half. With year on year quarterly growth below 8.0% since the second quarter of 2012 (Figure 3.3.1), the PRC economy seems to be following a lower growth trajectory than was generally assumed until early 2013, mainly because domestic demand has waned.
On the supply side, industry (including manufacturing, mining, and construction) grew by 7.6% year on year in the first half of 2013, a bit more slowly than the rate of 7.8% reported for the first quarter of 2013 or of 8.1% for the full year of 2012. The industrial rebound that started in September 2012, driven by strong credit growth, was not maintained. Monthly data indicate that momentum dissipated further during the second quarter, as the purchasing managers’ indices for output and new orders fell to 8-month lows in June 2013. However, data for July and August 2013 suggest that the situation has stabilized. Growth in services reached 8.3% year on year in the first half, the same rate as in the first quarter. Services thus continued to be the main driver of growth (Figure 3.3.2). Agriculture disappointed again with 3.0% growth year on year in the first half of 2013, after recording 3.4% in the first quarter, both well below the average of 4.5% from 2008 to 2012. Bad weather compounded weakening demand for animal husbandry and poultry products.
On the demand side, consumption contributed 3.4 percentage points to GDP growth in the first half of 2013, and investment contributed 4.1 (Figure 3.3.3). Thus, in contrast with 2012, when consumption outpaced investment as a contributor to expansion, limited progress was made with replacing investment-driven growth with growth triggered by consumption. However, investment growth has moderated somewhat since early 2013 reflecting the government’s focus on the quality of growth. A pickup in infrastructure investment, driven mainly by large projects earmarked in the Twelfth Five-Year Plan, 2011–2015, and by persistently strong investment in real estate, could not fully offset a slowdown in manufacturing investment triggered by weak external demand and excess capacity in some industries. Consumption is still supported by growing household income, as the income of migrant
3.3.1 Real economic growth
0
5
10
15
20
25
Retail salesValue added of industryGDP
Aug2013201220112010200920082007
%
Source: National Bureau of Statistics.
3.3.2 Supply-side contributions to growth
0
4
8
12
16
GDP
AgricultureIndustryServicesConstruction
2012201020082006200420022000
%
Source: National Bureau of Statistics.
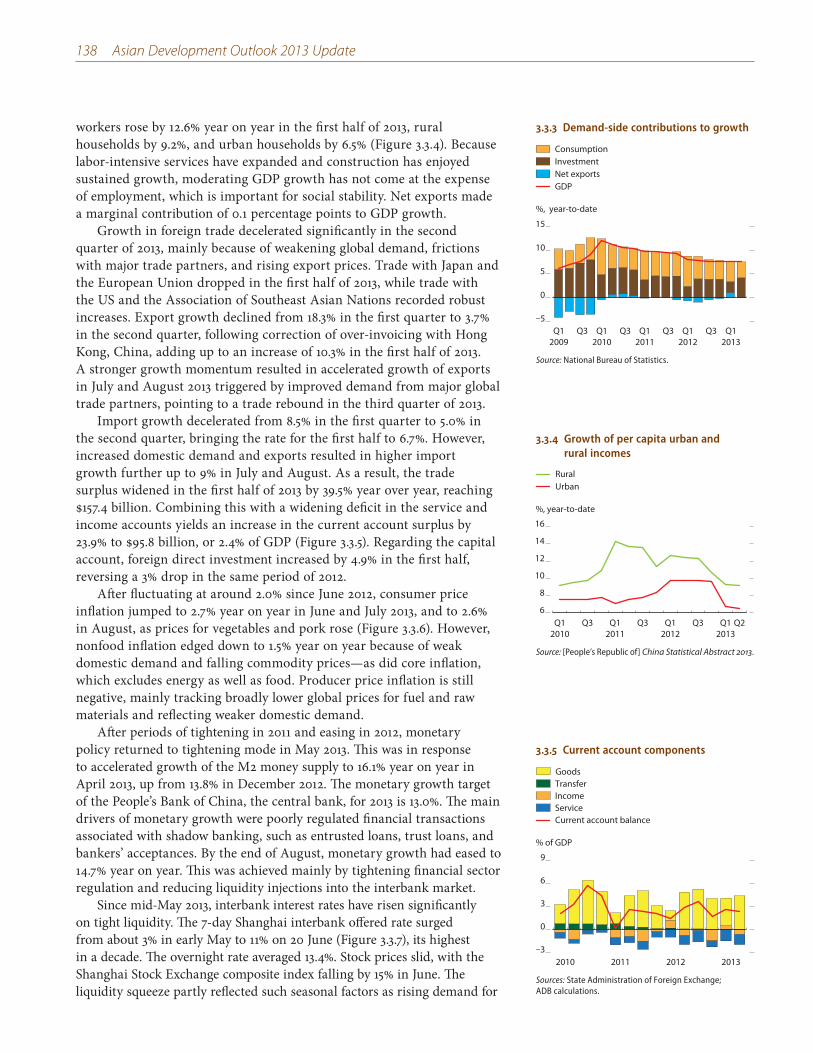
138 Asian Development Outlook 2013 Update
workers rose by 12.6% year on year in the first half of 2013, rural households by 9.2%, and urban households by 6.5% (Figure 3.3.4). Because labor-intensive services have expanded and construction has enjoyed sustained growth, moderating GDP growth has not come at the expense of employment, which is important for social stability. Net exports made a marginal contribution of 0.1 percentage points to GDP growth.
Growth in foreign trade decelerated significantly in the second quarter of 2013, mainly because of weakening global demand, frictions with major trade partners, and rising export prices. Trade with Japan and the European Union dropped in the first half of 2013, while trade with the US and the Association of Southeast Asian Nations recorded robust increases. Export growth declined from 18.3% in the first quarter to 3.7% in the second quarter, following correction of over-invoicing with Hong Kong, China, adding up to an increase of 10.3% in the first half of 2013. A stronger growth momentum resulted in accelerated growth of exports in July and August 2013 triggered by improved demand from major global trade partners, pointing to a trade rebound in the third quarter of 2013.
Import growth decelerated from 8.5% in the first quarter to 5.0% in the second quarter, bringing the rate for the first half to 6.7%. However, increased domestic demand and exports resulted in higher import growth further up to 9% in July and August. As a result, the trade surplus widened in the first half of 2013 by 39.5% year over year, reaching $157.4 billion. Combining this with a widening deficit in the service and income accounts yields an increase in the current account surplus by 23.9% to $95.8 billion, or 2.4% of GDP (Figure 3.3.5). Regarding the capital account, foreign direct investment increased by 4.9% in the first half, reversing a 3% drop in the same period of 2012.
After fluctuating at around 2.0% since June 2012, consumer price inflation jumped to 2.7% year on year in June and July 2013, and to 2.6% in August, as prices for vegetables and pork rose (Figure 3.3.6). However, nonfood inflation edged down to 1.5% year on year because of weak domestic demand and falling commodity prices—as did core inflation, which excludes energy as well as food. Producer price inflation is still negative, mainly tracking broadly lower global prices for fuel and raw materials and reflecting weaker domestic demand.
After periods of tightening in 2011 and easing in 2012, monetary policy returned to tightening mode in May 2013. This was in response to accelerated growth of the M2 money supply to 16.1% year on year in April 2013, up from 13.8% in December 2012. The monetary growth target of the People’s Bank of China, the central bank, for 2013 is 13.0%. The main drivers of monetary growth were poorly regulated financial transactions associated with shadow banking, such as entrusted loans, trust loans, and bankers’ acceptances. By the end of August, monetary growth had eased to 14.7% year on year. This was achieved mainly by tightening financial sector regulation and reducing liquidity injections into the interbank market.
Since mid-May 2013, interbank interest rates have risen significantly on tight liquidity. The 7-day Shanghai interbank offered rate surged from about 3% in early May to 11% on 20 June (Figure 3.3.7), its highest in a decade. The overnight rate averaged 13.4%. Stock prices slid, with the Shanghai Stock Exchange composite index falling by 15% in June. The liquidity squeeze partly reflected such seasonal factors as rising demand for
3.3.3 Demand-side contributions to growth
–5
0
5
10
15
Q12009
Q3 Q12010
Q3 Q12011
Q3 Q12012
Q3 Q12013
%, year-to-date
ConsumptionInvestmentNet exportsGDP
Source: National Bureau of Statistics.
3.3.4 Growth of per capita urban and rural incomes
6
8
10
12
14
16
RuralUrban
Q2Q12013
Q3Q12012
Q3Q12011
Q3Q12010
%, year-to-date
Source: [People’s Republic of] China Statistical Abstract 2013.
3.3.5 Current account components
6
–3
0
3
9
2010 2011 2012 2013
% of GDP
GoodsTransferIncomeServiceCurrent account balance
Sources: State Administration of Foreign Exchange; ADB calculations.
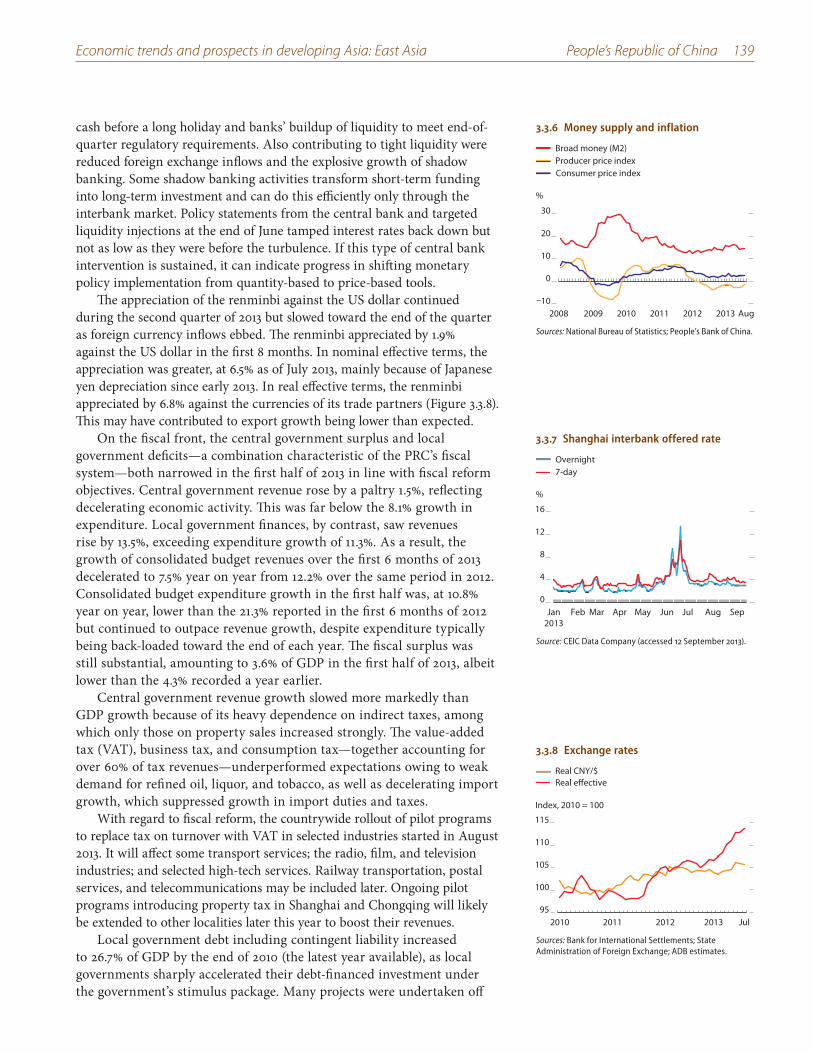
Economic trends and prospects in developing Asia: East Asia People’s Republic of China 139
cash before a long holiday and banks’ buildup of liquidity to meet end-of-quarter regulatory requirements. Also contributing to tight liquidity were reduced foreign exchange inflows and the explosive growth of shadow banking. Some shadow banking activities transform short-term funding into long-term investment and can do this efficiently only through the interbank market. Policy statements from the central bank and targeted liquidity injections at the end of June tamped interest rates back down but not as low as they were before the turbulence. If this type of central bank intervention is sustained, it can indicate progress in shifting monetary policy implementation from quantity-based to price-based tools.
The appreciation of the renminbi against the US dollar continued during the second quarter of 2013 but slowed toward the end of the quarter as foreign currency inflows ebbed. The renminbi appreciated by 1.9% against the US dollar in the first 8 months. In nominal effective terms, the appreciation was greater, at 6.5% as of July 2013, mainly because of Japanese yen depreciation since early 2013. In real effective terms, the renminbi appreciated by 6.8% against the currencies of its trade partners (Figure 3.3.8). This may have contributed to export growth being lower than expected.
On the fiscal front, the central government surplus and local government deficits—a combination characteristic of the PRC’s fiscal system—both narrowed in the first half of 2013 in line with fiscal reform objectives. Central government revenue rose by a paltry 1.5%, reflecting decelerating economic activity. This was far below the 8.1% growth in expenditure. Local government finances, by contrast, saw revenues rise by 13.5%, exceeding expenditure growth of 11.3%. As a result, the growth of consolidated budget revenues over the first 6 months of 2013 decelerated to 7.5% year on year from 12.2% over the same period in 2012. Consolidated budget expenditure growth in the first half was, at 10.8% year on year, lower than the 21.3% reported in the first 6 months of 2012 but continued to outpace revenue growth, despite expenditure typically being back-loaded toward the end of each year. The fiscal surplus was still substantial, amounting to 3.6% of GDP in the first half of 2013, albeit lower than the 4.3% recorded a year earlier.
Central government revenue growth slowed more markedly than GDP growth because of its heavy dependence on indirect taxes, among which only those on property sales increased strongly. The value-added tax (VAT), business tax, and consumption tax—together accounting for over 60% of tax revenues—underperformed expectations owing to weak demand for refined oil, liquor, and tobacco, as well as decelerating import growth, which suppressed growth in import duties and taxes.
With regard to fiscal reform, the countrywide rollout of pilot programs to replace tax on turnover with VAT in selected industries started in August 2013. It will affect some transport services; the radio, film, and television industries; and selected high-tech services. Railway transportation, postal services, and telecommunications may be included later. Ongoing pilot programs introducing property tax in Shanghai and Chongqing will likely be extended to other localities later this year to boost their revenues.
Local government debt including contingent liability increased to 26.7% of GDP by the end of 2010 (the latest year available), as local governments sharply accelerated their debt-financed investment under the government’s stimulus package. Many projects were undertaken off
3.3.6 Money supply and inflation
–10
0
10
20
30
Broad money (M2)Producer price indexConsumer price index
Aug201320122011201020092008
%
Sources: National Bureau of Statistics; People’s Bank of China.
3.3.7 Shanghai interbank offered rate
0
4
8
12
16
Overnight 7-day
SepAugJulJunMayAprMarFebJan2013
%
Source: CEIC Data Company (accessed 12 September 2013).
3.3.8 Exchange rates
95
100
105
110
115
Real CNY/$Real effective
Jul2013201220112010
Index, 2010 = 100
Sources: Bank for International Settlements; State Administration of Foreign Exchange; ADB estimates.
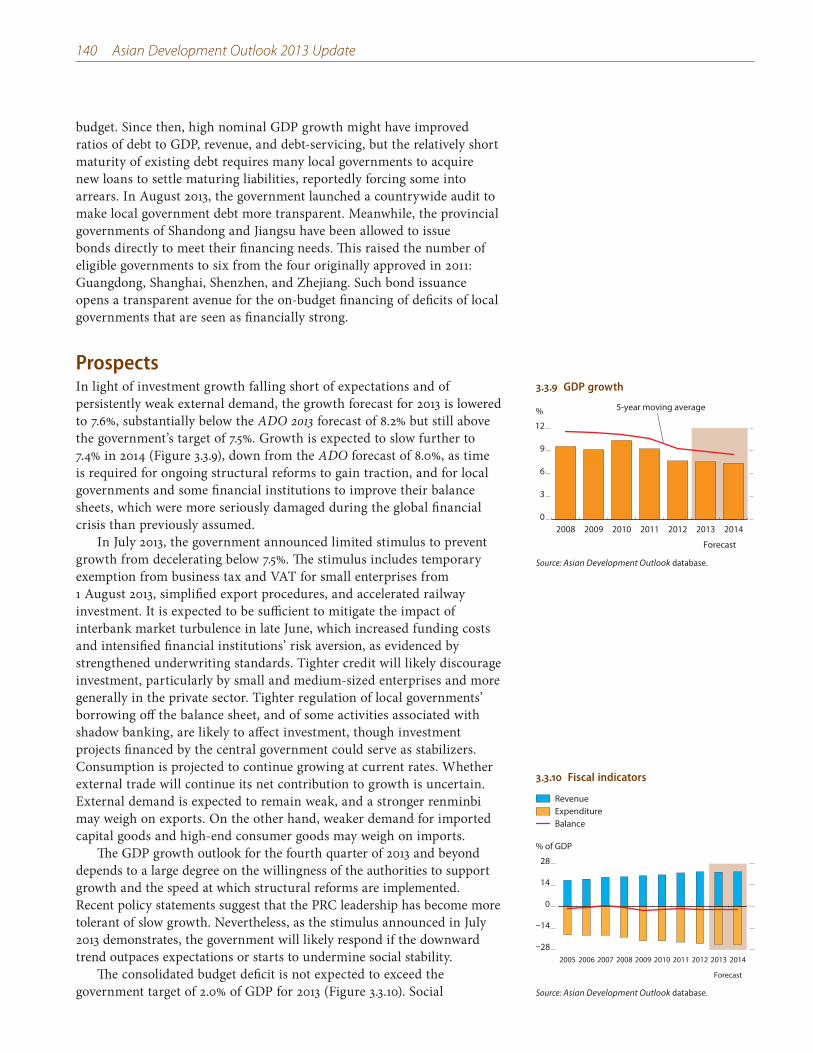
140 Asian Development Outlook 2013 Update
budget. Since then, high nominal GDP growth might have improved ratios of debt to GDP, revenue, and debt-servicing, but the relatively short maturity of existing debt requires many local governments to acquire new loans to settle maturing liabilities, reportedly forcing some into arrears. In August 2013, the government launched a countrywide audit to make local government debt more transparent. Meanwhile, the provincial governments of Shandong and Jiangsu have been allowed to issue bonds directly to meet their financing needs. This raised the number of eligible governments to six from the four originally approved in 2011: Guangdong, Shanghai, Shenzhen, and Zhejiang. Such bond issuance opens a transparent avenue for the on-budget financing of deficits of local governments that are seen as financially strong.
ProspectsIn light of investment growth falling short of expectations and of persistently weak external demand, the growth forecast for 2013 is lowered to 7.6%, substantially below the ADO 2013 forecast of 8.2% but still above the government’s target of 7.5%. Growth is expected to slow further to 7.4% in 2014 (Figure 3.3.9), down from the ADO forecast of 8.0%, as time is required for ongoing structural reforms to gain traction, and for local governments and some financial institutions to improve their balance sheets, which were more seriously damaged during the global financial crisis than previously assumed.
In July 2013, the government announced limited stimulus to prevent growth from decelerating below 7.5%. The stimulus includes temporary exemption from business tax and VAT for small enterprises from 1 August 2013, simplified export procedures, and accelerated railway investment. It is expected to be sufficient to mitigate the impact of interbank market turbulence in late June, which increased funding costs and intensified financial institutions’ risk aversion, as evidenced by strengthened underwriting standards. Tighter credit will likely discourage investment, particularly by small and medium-sized enterprises and more generally in the private sector. Tighter regulation of local governments’ borrowing off the balance sheet, and of some activities associated with shadow banking, are likely to affect investment, though investment projects financed by the central government could serve as stabilizers. Consumption is projected to continue growing at current rates. Whether external trade will continue its net contribution to growth is uncertain. External demand is expected to remain weak, and a stronger renminbi may weigh on exports. On the other hand, weaker demand for imported capital goods and high-end consumer goods may weigh on imports.
The GDP growth outlook for the fourth quarter of 2013 and beyond depends to a large degree on the willingness of the authorities to support growth and the speed at which structural reforms are implemented. Recent policy statements suggest that the PRC leadership has become more tolerant of slow growth. Nevertheless, as the stimulus announced in July 2013 demonstrates, the government will likely respond if the downward trend outpaces expectations or starts to undermine social stability.
The consolidated budget deficit is not expected to exceed the government target of 2.0% of GDP for 2013 (Figure 3.3.10). Social
3.3.9 GDP growth
0
3
6
9
12
2014201320122011201020092008
Forecast
5-year moving average%
Source: Asian Development Outlook database.
3.3.10 Fiscal indicators
–28
–14
0
14
28
2005 2006 2007 2008 2009 2010 2011 2012 2013 2014
% of GDP
Forecast
RevenueExpenditureBalance
Source: Asian Development Outlook database.
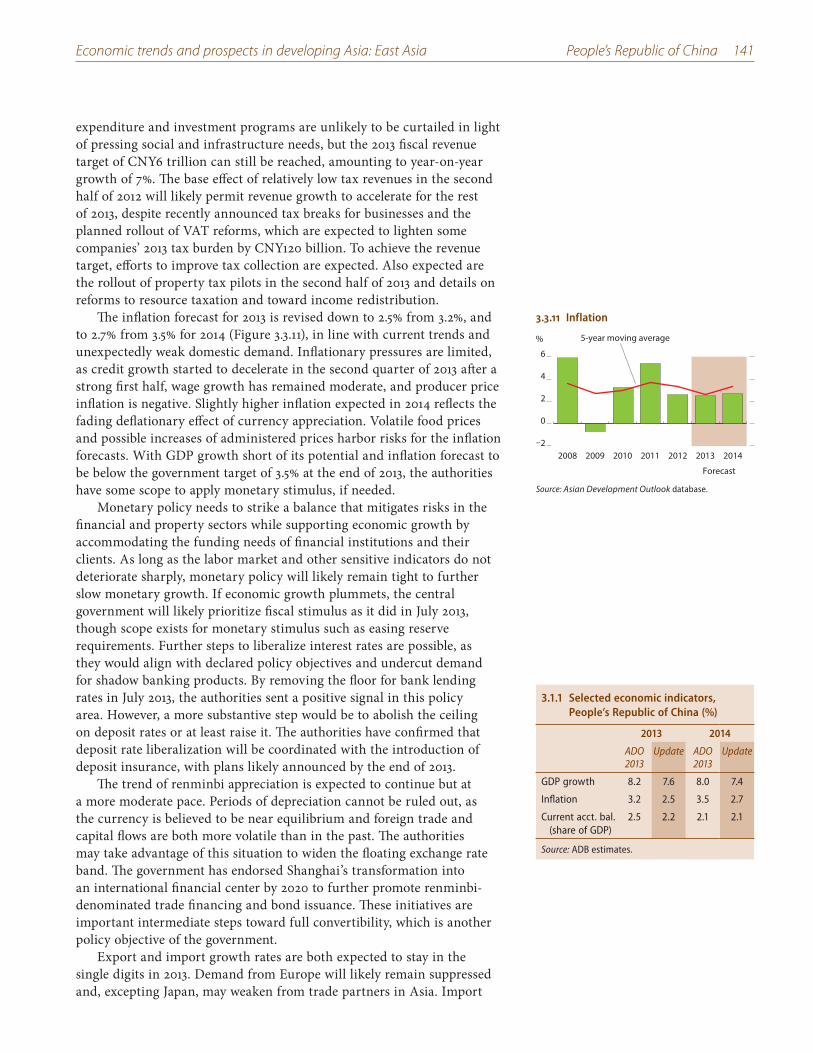
Economic trends and prospects in developing Asia: East Asia People’s Republic of China 141
expenditure and investment programs are unlikely to be curtailed in light of pressing social and infrastructure needs, but the 2013 fiscal revenue target of CNY6 trillion can still be reached, amounting to year-on-year growth of 7%. The base effect of relatively low tax revenues in the second half of 2012 will likely permit revenue growth to accelerate for the rest of 2013, despite recently announced tax breaks for businesses and the planned rollout of VAT reforms, which are expected to lighten some companies’ 2013 tax burden by CNY120 billion. To achieve the revenue target, efforts to improve tax collection are expected. Also expected are the rollout of property tax pilots in the second half of 2013 and details on reforms to resource taxation and toward income redistribution.
The inflation forecast for 2013 is revised down to 2.5% from 3.2%, and to 2.7% from 3.5% for 2014 (Figure 3.3.11), in line with current trends and unexpectedly weak domestic demand. Inflationary pressures are limited, as credit growth started to decelerate in the second quarter of 2013 after a strong first half, wage growth has remained moderate, and producer price inflation is negative. Slightly higher inflation expected in 2014 reflects the fading deflationary effect of currency appreciation. Volatile food prices and possible increases of administered prices harbor risks for the inflation forecasts. With GDP growth short of its potential and inflation forecast to be below the government target of 3.5% at the end of 2013, the authorities have some scope to apply monetary stimulus, if needed.
Monetary policy needs to strike a balance that mitigates risks in the financial and property sectors while supporting economic growth by accommodating the funding needs of financial institutions and their clients. As long as the labor market and other sensitive indicators do not deteriorate sharply, monetary policy will likely remain tight to further slow monetary growth. If economic growth plummets, the central government will likely prioritize fiscal stimulus as it did in July 2013, though scope exists for monetary stimulus such as easing reserve requirements. Further steps to liberalize interest rates are possible, as they would align with declared policy objectives and undercut demand for shadow banking products. By removing the floor for bank lending rates in July 2013, the authorities sent a positive signal in this policy area. However, a more substantive step would be to abolish the ceiling on deposit rates or at least raise it. The authorities have confirmed that deposit rate liberalization will be coordinated with the introduction of deposit insurance, with plans likely announced by the end of 2013.
The trend of renminbi appreciation is expected to continue but at a more moderate pace. Periods of depreciation cannot be ruled out, as the currency is believed to be near equilibrium and foreign trade and capital flows are both more volatile than in the past. The authorities may take advantage of this situation to widen the floating exchange rate band. The government has endorsed Shanghai’s transformation into an international financial center by 2020 to further promote renminbi-denominated trade financing and bond issuance. These initiatives are important intermediate steps toward full convertibility, which is another policy objective of the government.
Export and import growth rates are both expected to stay in the single digits in 2013. Demand from Europe will likely remain suppressed and, excepting Japan, may weaken from trade partners in Asia. Import
3.3.11 Inflation
–2
0
2
4
6
2014201320122011201020092008
%
Forecast
5-year moving average
Source: Asian Development Outlook database.
3.1.1 Selected economic indicators, People’s Republic of China (%)
2013 2014
ADO 2013
Update ADO 2013
Update
GDP growth 8.2 7.6 8.0 7.4
Inflation 3.2 2.5 3.5 2.7
Current acct. bal. (share of GDP)
2.5 2.2 2.1 2.1
Source: ADB estimates.
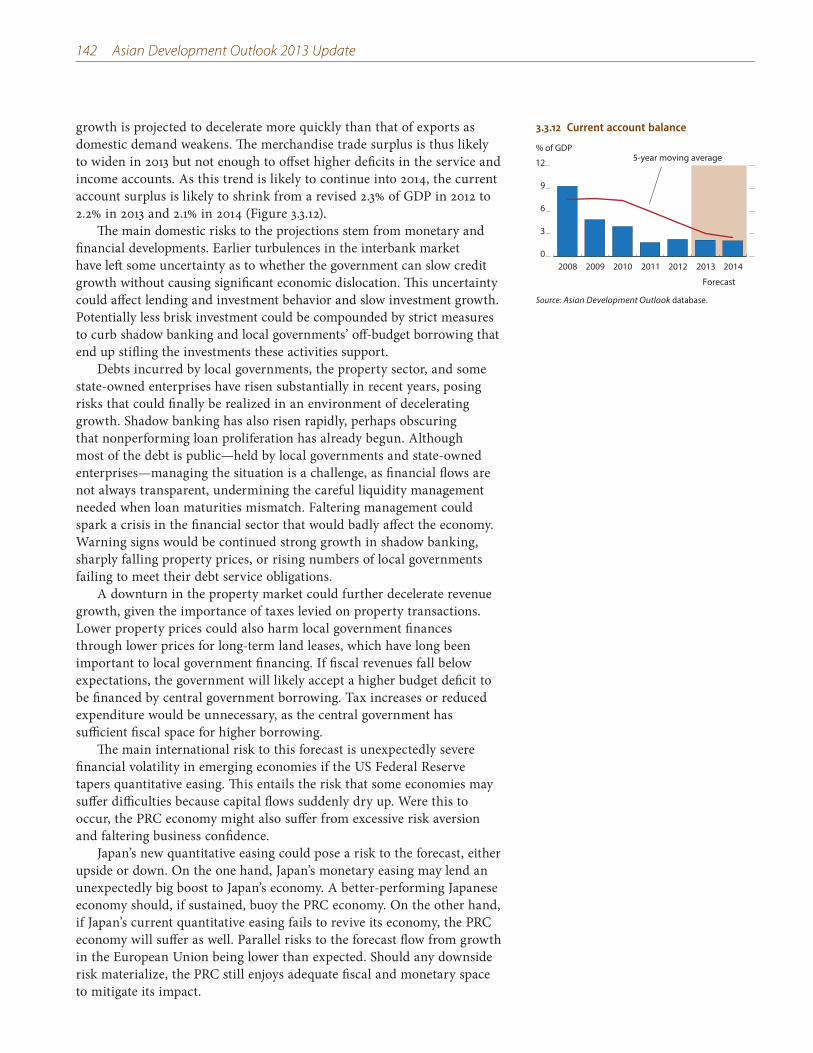
142 Asian Development Outlook 2013 Update
growth is projected to decelerate more quickly than that of exports as domestic demand weakens. The merchandise trade surplus is thus likely to widen in 2013 but not enough to offset higher deficits in the service and income accounts. As this trend is likely to continue into 2014, the current account surplus is likely to shrink from a revised 2.3% of GDP in 2012 to 2.2% in 2013 and 2.1% in 2014 (Figure 3.3.12).
The main domestic risks to the projections stem from monetary and financial developments. Earlier turbulences in the interbank market have left some uncertainty as to whether the government can slow credit growth without causing significant economic dislocation. This uncertainty could affect lending and investment behavior and slow investment growth. Potentially less brisk investment could be compounded by strict measures to curb shadow banking and local governments’ off-budget borrowing that end up stifling the investments these activities support.
Debts incurred by local governments, the property sector, and some state-owned enterprises have risen substantially in recent years, posing risks that could finally be realized in an environment of decelerating growth. Shadow banking has also risen rapidly, perhaps obscuring that nonperforming loan proliferation has already begun. Although most of the debt is public—held by local governments and state-owned enterprises—managing the situation is a challenge, as financial flows are not always transparent, undermining the careful liquidity management needed when loan maturities mismatch. Faltering management could spark a crisis in the financial sector that would badly affect the economy. Warning signs would be continued strong growth in shadow banking, sharply falling property prices, or rising numbers of local governments failing to meet their debt service obligations.
A downturn in the property market could further decelerate revenue growth, given the importance of taxes levied on property transactions. Lower property prices could also harm local government finances through lower prices for long-term land leases, which have long been important to local government financing. If fiscal revenues fall below expectations, the government will likely accept a higher budget deficit to be financed by central government borrowing. Tax increases or reduced expenditure would be unnecessary, as the central government has sufficient fiscal space for higher borrowing.
The main international risk to this forecast is unexpectedly severe financial volatility in emerging economies if the US Federal Reserve tapers quantitative easing. This entails the risk that some economies may suffer difficulties because capital flows suddenly dry up. Were this to occur, the PRC economy might also suffer from excessive risk aversion and faltering business confidence.
Japan’s new quantitative easing could pose a risk to the forecast, either upside or down. On the one hand, Japan’s monetary easing may lend an unexpectedly big boost to Japan’s economy. A better-performing Japanese economy should, if sustained, buoy the PRC economy. On the other hand, if Japan’s current quantitative easing fails to revive its economy, the PRC economy will suffer as well. Parallel risks to the forecast flow from growth in the European Union being lower than expected. Should any downside risk materialize, the PRC still enjoys adequate fiscal and monetary space to mitigate its impact.
3.3.12 Current account balance
0
3
6
9
12
2014201320122011201020092008
5-year moving average
Forecast
% of GDP
Source: Asian Development Outlook database.
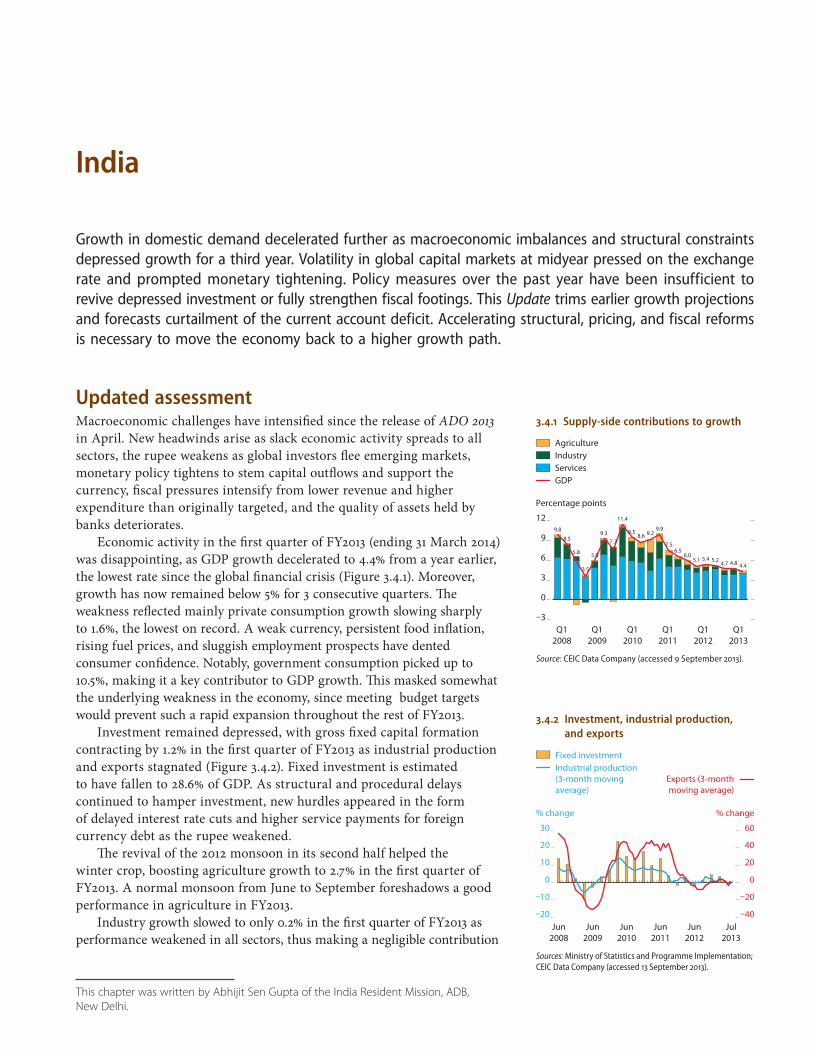
This chapter was written by Abhijit Sen Gupta of the India Resident Mission, ADB,
New Delhi.
India
Growth in domestic demand decelerated further as macroeconomic imbalances and structural constraints depressed growth for a third year. Volatility in global capital markets at midyear pressed on the exchange rate and prompted monetary tightening. Policy measures over the past year have been insufficient to revive depressed investment or fully strengthen fiscal footings. This Update trims earlier growth projections and forecasts curtailment of the current account deficit. Accelerating structural, pricing, and fiscal reforms is necessary to move the economy back to a higher growth path.
Updated assessmentMacroeconomic challenges have intensified since the release of ADO 2013 in April. New headwinds arise as slack economic activity spreads to all sectors, the rupee weakens as global investors flee emerging markets, monetary policy tightens to stem capital outflows and support the currency, fiscal pressures intensify from lower revenue and higher expenditure than originally targeted, and the quality of assets held by banks deteriorates.
Economic activity in the first quarter of FY2013 (ending 31 March 2014) was disappointing, as GDP growth decelerated to 4.4% from a year earlier, the lowest rate since the global financial crisis (Figure 3.4.1). Moreover, growth has now remained below 5% for 3 consecutive quarters. The weakness reflected mainly private consumption growth slowing sharply to 1.6%, the lowest on record. A weak currency, persistent food inflation, rising fuel prices, and sluggish employment prospects have dented consumer confidence. Notably, government consumption picked up to 10.5%, making it a key contributor to GDP growth. This masked somewhat the underlying weakness in the economy, since meeting budget targets would prevent such a rapid expansion throughout the rest of FY2013.
Investment remained depressed, with gross fixed capital formation contracting by 1.2% in the first quarter of FY2013 as industrial production and exports stagnated (Figure 3.4.2). Fixed investment is estimated to have fallen to 28.6% of GDP. As structural and procedural delays continued to hamper investment, new hurdles appeared in the form of delayed interest rate cuts and higher service payments for foreign currency debt as the rupee weakened.
The revival of the 2012 monsoon in its second half helped the winter crop, boosting agriculture growth to 2.7% in the first quarter of FY2013. A normal monsoon from June to September foreshadows a good performance in agriculture in FY2013.
Industry growth slowed to only 0.2% in the first quarter of FY2013 as performance weakened in all sectors, thus making a negligible contribution
3.4.1 Supply-side contributions to growth
9.8
8.5
5.8
3.5
5.9
9.37.7
11.4
9.58.6 9.2
9.9
7.56.5
6.05.1 5.4 5.2 4.7 4.8 4.4
–3
0
3
6
9
12
Q12008
Q12009
Q12010
Q12011
Q12012
Q12013
Percentage points
IndustryServicesGDP
Agriculture
Source: CEIC Data Company (accessed 9 September 2013).
3.4.2 Investment, industrial production, and exports
–20
–10
0
10
20
30
–40
–20
0
20
40
60
Exports (3-monthmoving average)
Fixed investmentIndustrial production(3-month movingaverage)
Jul2013
Jun2012
Jun2011
Jun2010
Jun2009
Jun2008
% change % change
Sources: Ministry of Statistics and Programme Implementation; CEIC Data Company (accessed 13 September 2013).
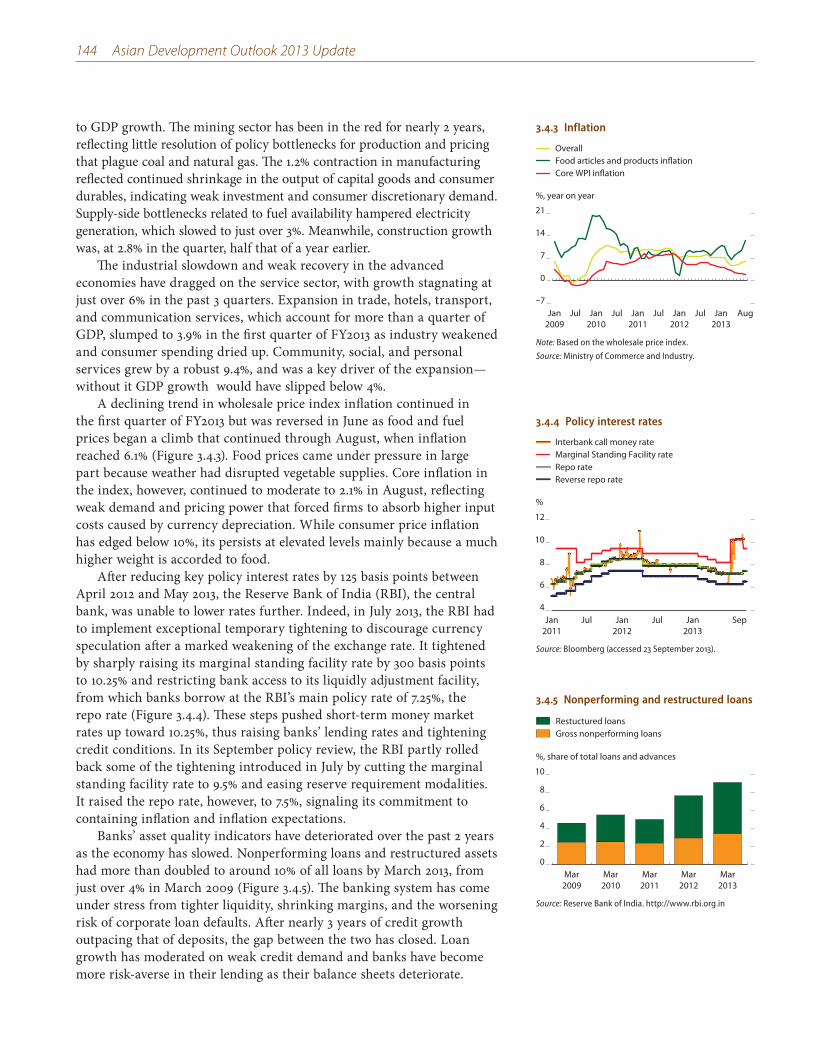
144 Asian Development Outlook 2013 Update
to GDP growth. The mining sector has been in the red for nearly 2 years, reflecting little resolution of policy bottlenecks for production and pricing that plague coal and natural gas. The 1.2% contraction in manufacturing reflected continued shrinkage in the output of capital goods and consumer durables, indicating weak investment and consumer discretionary demand. Supply-side bottlenecks related to fuel availability hampered electricity generation, which slowed to just over 3%. Meanwhile, construction growth was, at 2.8% in the quarter, half that of a year earlier.
The industrial slowdown and weak recovery in the advanced economies have dragged on the service sector, with growth stagnating at just over 6% in the past 3 quarters. Expansion in trade, hotels, transport, and communication services, which account for more than a quarter of GDP, slumped to 3.9% in the first quarter of FY2013 as industry weakened and consumer spending dried up. Community, social, and personal services grew by a robust 9.4%, and was a key driver of the expansion—without it GDP growth would have slipped below 4%.
A declining trend in wholesale price index inflation continued in the first quarter of FY2013 but was reversed in June as food and fuel prices began a climb that continued through August, when inflation reached 6.1% (Figure 3.4.3). Food prices came under pressure in large part because weather had disrupted vegetable supplies. Core inflation in the index, however, continued to moderate to 2.1% in August, reflecting weak demand and pricing power that forced firms to absorb higher input costs caused by currency depreciation. While consumer price inflation has edged below 10%, its persists at elevated levels mainly because a much higher weight is accorded to food.
After reducing key policy interest rates by 125 basis points between April 2012 and May 2013, the Reserve Bank of India (RBI), the central bank, was unable to lower rates further. Indeed, in July 2013, the RBI had to implement exceptional temporary tightening to discourage currency speculation after a marked weakening of the exchange rate. It tightened by sharply raising its marginal standing facility rate by 300 basis points to 10.25% and restricting bank access to its liquidly adjustment facility, from which banks borrow at the RBI’s main policy rate of 7.25%, the repo rate (Figure 3.4.4). These steps pushed short-term money market rates up toward 10.25%, thus raising banks’ lending rates and tightening credit conditions. In its September policy review, the RBI partly rolled back some of the tightening introduced in July by cutting the marginal standing facility rate to 9.5% and easing reserve requirement modalities. It raised the repo rate, however, to 7.5%, signaling its commitment to containing inflation and inflation expectations.
Banks’ asset quality indicators have deteriorated over the past 2 years as the economy has slowed. Nonperforming loans and restructured assets had more than doubled to around 10% of all loans by March 2013, from just over 4% in March 2009 (Figure 3.4.5). The banking system has come under stress from tighter liquidity, shrinking margins, and the worsening risk of corporate loan defaults. After nearly 3 years of credit growth outpacing that of deposits, the gap between the two has closed. Loan growth has moderated on weak credit demand and banks have become more risk-averse in their lending as their balance sheets deteriorate.
3.4.3 Inflation
–7
0
7
14
21
OverallFood articles and products inflationCore WPI inflation
AugJan2013
JulJan2012
JulJan2011
JulJan2010
JulJan2009
%, year on year
Note: Based on the wholesale price index.
Source: Ministry of Commerce and Industry.
3.4.4 Policy interest rates
4
6
8
10
12
Interbank call money rateMarginal Standing Facility rateRepo rateReverse repo rate
SepJan2013
JulJan2012
JulJan2011
%
Source: Bloomberg (accessed 23 September 2013).
3.4.5 Nonperforming and restructured loans
0
2
4
6
8
10
Restuctured loansGross nonperforming loans
Mar2013
Mar2012
Mar2011
Mar2010
Mar2009
%, share of total loans and advances
Source: Reserve Bank of India. http://www.rbi.org.in
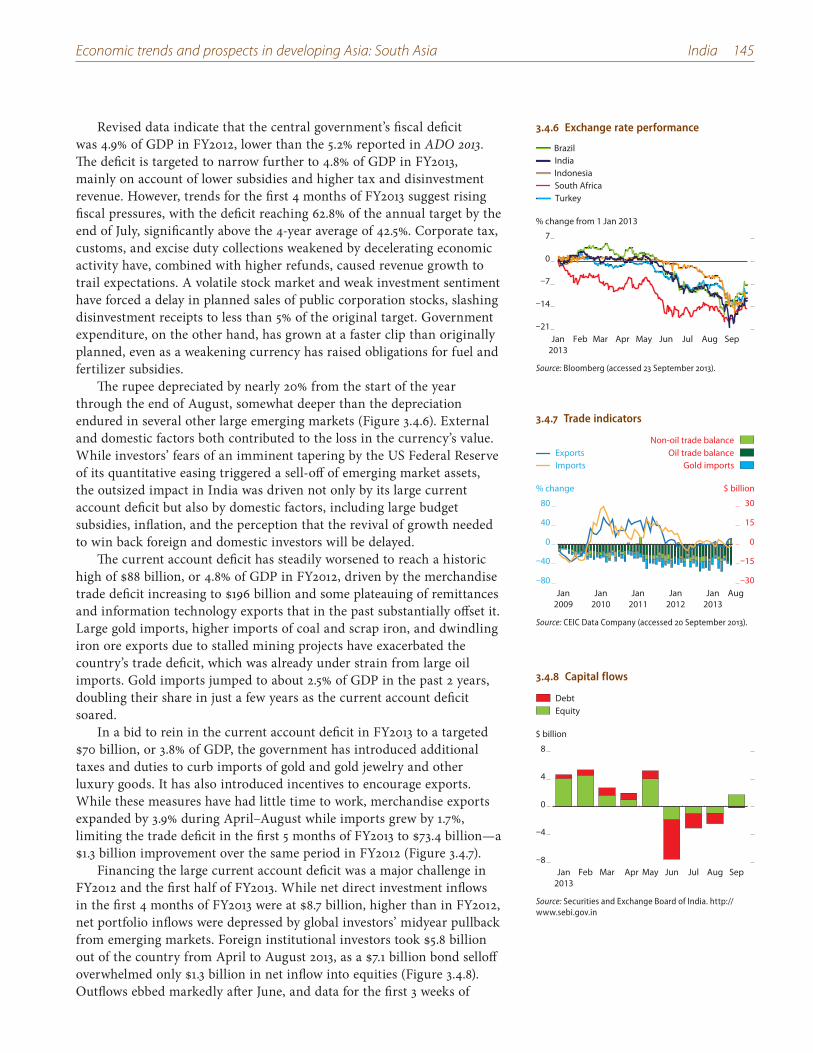
Economic trends and prospects in developing Asia: South Asia India 145
Revised data indicate that the central government’s fiscal deficit was 4.9% of GDP in FY2012, lower than the 5.2% reported in ADO 2013. The deficit is targeted to narrow further to 4.8% of GDP in FY2013, mainly on account of lower subsidies and higher tax and disinvestment revenue. However, trends for the first 4 months of FY2013 suggest rising fiscal pressures, with the deficit reaching 62.8% of the annual target by the end of July, significantly above the 4-year average of 42.5%. Corporate tax, customs, and excise duty collections weakened by decelerating economic activity have, combined with higher refunds, caused revenue growth to trail expectations. A volatile stock market and weak investment sentiment have forced a delay in planned sales of public corporation stocks, slashing disinvestment receipts to less than 5% of the original target. Government expenditure, on the other hand, has grown at a faster clip than originally planned, even as a weakening currency has raised obligations for fuel and fertilizer subsidies.
The rupee depreciated by nearly 20% from the start of the year through the end of August, somewhat deeper than the depreciation endured in several other large emerging markets (Figure 3.4.6). External and domestic factors both contributed to the loss in the currency’s value. While investors’ fears of an imminent tapering by the US Federal Reserve of its quantitative easing triggered a sell-off of emerging market assets, the outsized impact in India was driven not only by its large current account deficit but also by domestic factors, including large budget subsidies, inflation, and the perception that the revival of growth needed to win back foreign and domestic investors will be delayed.
The current account deficit has steadily worsened to reach a historic high of $88 billion, or 4.8% of GDP in FY2012, driven by the merchandise trade deficit increasing to $196 billion and some plateauing of remittances and information technology exports that in the past substantially offset it. Large gold imports, higher imports of coal and scrap iron, and dwindling iron ore exports due to stalled mining projects have exacerbated the country’s trade deficit, which was already under strain from large oil imports. Gold imports jumped to about 2.5% of GDP in the past 2 years, doubling their share in just a few years as the current account deficit soared.
In a bid to rein in the current account deficit in FY2013 to a targeted $70 billion, or 3.8% of GDP, the government has introduced additional taxes and duties to curb imports of gold and gold jewelry and other luxury goods. It has also introduced incentives to encourage exports. While these measures have had little time to work, merchandise exports expanded by 3.9% during April–August while imports grew by 1.7%, limiting the trade deficit in the first 5 months of FY2013 to $73.4 billion—a $1.3 billion improvement over the same period in FY2012 (Figure 3.4.7).
Financing the large current account deficit was a major challenge in FY2012 and the first half of FY2013. While net direct investment inflows in the first 4 months of FY2013 were at $8.7 billion, higher than in FY2012, net portfolio inflows were depressed by global investors’ midyear pullback from emerging markets. Foreign institutional investors took $5.8 billion out of the country from April to August 2013, as a $7.1 billion bond selloff overwhelmed only $1.3 billion in net inflow into equities (Figure 3.4.8). Outflows ebbed markedly after June, and data for the first 3 weeks of
3.4.6 Exchange rate performance
–21
–14
–7
0
7
TurkeySouth Africa
Brazil
IndonesiaIndia
SepAugJulJunMayAprMarFebJan2013
% change from 1 Jan 2013
Source: Bloomberg (accessed 23 September 2013).
3.4.7 Trade indicators
Oil trade balanceGold imports
Non-oil trade balance
–30
–15
0
15
30
–80
–40
0
40
80
Jan2009
Jan2010
Jan2011
Jan2012
Jan2013
Aug
$ billion% change
ImportsExports
Source: CEIC Data Company (accessed 20 September 2013).
3.4.8 Capital flows
–8
–4
0
4
8
Jan2013
Feb Mar Apr May Jun Jul Aug Sep
$ billion
Equity Debt
Source: Securities and Exchange Board of India. http://www.sebi.gov.in
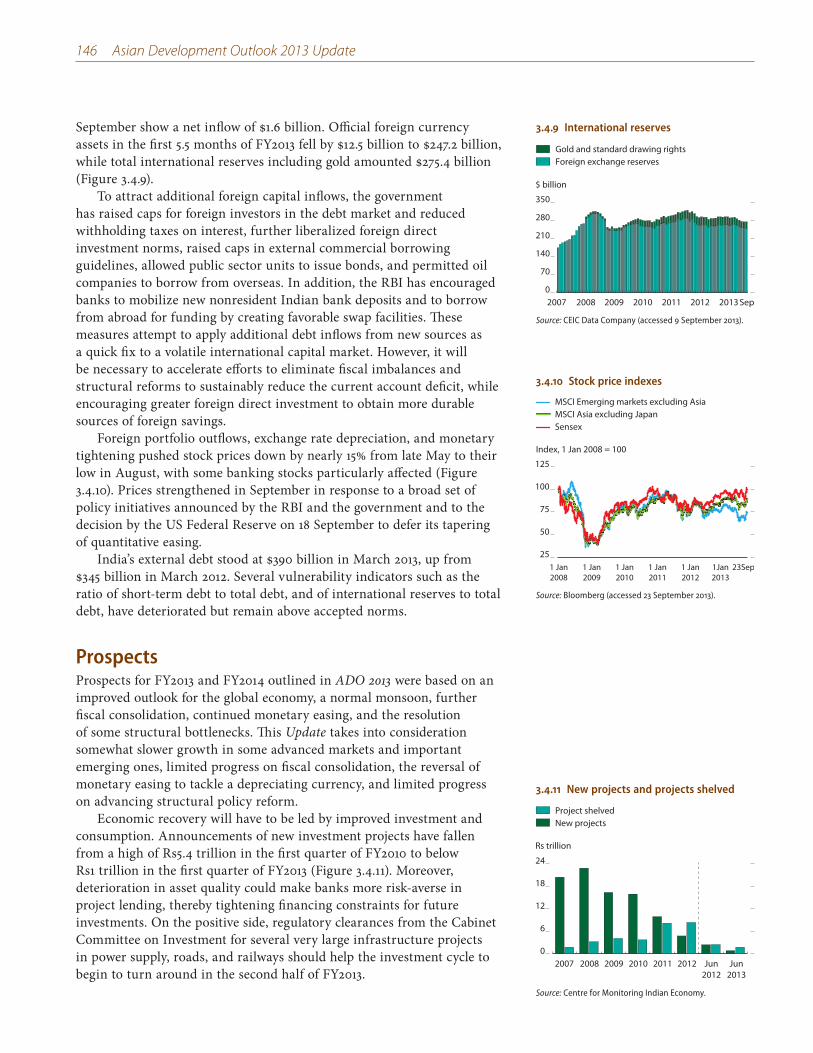
146 Asian Development Outlook 2013 Update
September show a net inflow of $1.6 billion. Official foreign currency assets in the first 5.5 months of FY2013 fell by $12.5 billion to $247.2 billion, while total international reserves including gold amounted $275.4 billion (Figure 3.4.9).
To attract additional foreign capital inflows, the government has raised caps for foreign investors in the debt market and reduced withholding taxes on interest, further liberalized foreign direct investment norms, raised caps in external commercial borrowing guidelines, allowed public sector units to issue bonds, and permitted oil companies to borrow from overseas. In addition, the RBI has encouraged banks to mobilize new nonresident Indian bank deposits and to borrow from abroad for funding by creating favorable swap facilities. These measures attempt to apply additional debt inflows from new sources as a quick fix to a volatile international capital market. However, it will be necessary to accelerate efforts to eliminate fiscal imbalances and structural reforms to sustainably reduce the current account deficit, while encouraging greater foreign direct investment to obtain more durable sources of foreign savings.
Foreign portfolio outflows, exchange rate depreciation, and monetary tightening pushed stock prices down by nearly 15% from late May to their low in August, with some banking stocks particularly affected (Figure 3.4.10). Prices strengthened in September in response to a broad set of policy initiatives announced by the RBI and the government and to the decision by the US Federal Reserve on 18 September to defer its tapering of quantitative easing.
India’s external debt stood at $390 billion in March 2013, up from $345 billion in March 2012. Several vulnerability indicators such as the ratio of short-term debt to total debt, and of international reserves to total debt, have deteriorated but remain above accepted norms.
ProspectsProspects for FY2013 and FY2014 outlined in ADO 2013 were based on an improved outlook for the global economy, a normal monsoon, further fiscal consolidation, continued monetary easing, and the resolution of some structural bottlenecks. This Update takes into consideration somewhat slower growth in some advanced markets and important emerging ones, limited progress on fiscal consolidation, the reversal of monetary easing to tackle a depreciating currency, and limited progress on advancing structural policy reform.
Economic recovery will have to be led by improved investment and consumption. Announcements of new investment projects have fallen from a high of Rs5.4 trillion in the first quarter of FY2010 to below Rs1 trillion in the first quarter of FY2013 (Figure 3.4.11). Moreover, deterioration in asset quality could make banks more risk-averse in project lending, thereby tightening financing constraints for future investments. On the positive side, regulatory clearances from the Cabinet Committee on Investment for several very large infrastructure projects in power supply, roads, and railways should help the investment cycle to begin to turn around in the second half of FY2013.
3.4.9 International reserves
0
70
140
210
280
350
Gold and standard drawing rightsForeign exchange reserves
Sep2013201220112010200920082007
$ billion
Source: CEIC Data Company (accessed 9 September 2013).
3.4.10 Stock price indexes
25
125
Index, 1 Jan 2008 = 100
50
75
100
23Sep1Jan2013
1 Jan2012
1 Jan2011
1 Jan2010
1 Jan2009
1 Jan2008
MSCI Emerging markets excluding AsiaMSCI Asia excluding JapanSensex
Source: Bloomberg (accessed 23 September 2013).
3.4.11 New projects and projects shelved
0
6
12
18
24
Project shelved New projects
Jun2013
Jun2012
201220112010200920082007
Rs trillion
Source: Centre for Monitoring Indian Economy.
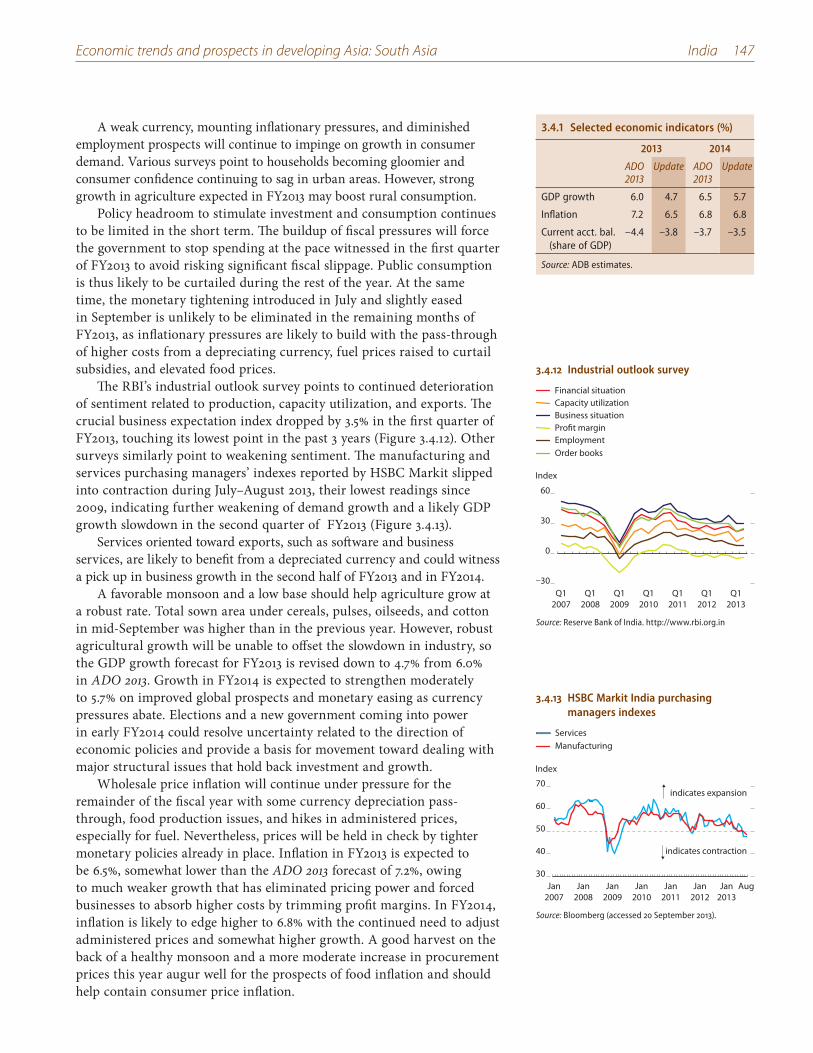
Economic trends and prospects in developing Asia: South Asia India 147
A weak currency, mounting inflationary pressures, and diminished employment prospects will continue to impinge on growth in consumer demand. Various surveys point to households becoming gloomier and consumer confidence continuing to sag in urban areas. However, strong growth in agriculture expected in FY2013 may boost rural consumption.
Policy headroom to stimulate investment and consumption continues to be limited in the short term. The buildup of fiscal pressures will force the government to stop spending at the pace witnessed in the first quarter of FY2013 to avoid risking significant fiscal slippage. Public consumption is thus likely to be curtailed during the rest of the year. At the same time, the monetary tightening introduced in July and slightly eased in September is unlikely to be eliminated in the remaining months of FY2013, as inflationary pressures are likely to build with the pass-through of higher costs from a depreciating currency, fuel prices raised to curtail subsidies, and elevated food prices.
The RBI’s industrial outlook survey points to continued deterioration of sentiment related to production, capacity utilization, and exports. The crucial business expectation index dropped by 3.5% in the first quarter of FY2013, touching its lowest point in the past 3 years (Figure 3.4.12). Other surveys similarly point to weakening sentiment. The manufacturing and services purchasing managers’ indexes reported by HSBC Markit slipped into contraction during July–August 2013, their lowest readings since 2009, indicating further weakening of demand growth and a likely GDP growth slowdown in the second quarter of FY2013 (Figure 3.4.13).
Services oriented toward exports, such as software and business services, are likely to benefit from a depreciated currency and could witness a pick up in business growth in the second half of FY2013 and in FY2014.
A favorable monsoon and a low base should help agriculture grow at a robust rate. Total sown area under cereals, pulses, oilseeds, and cotton in mid-September was higher than in the previous year. However, robust agricultural growth will be unable to offset the slowdown in industry, so the GDP growth forecast for FY2013 is revised down to 4.7% from 6.0% in ADO 2013. Growth in FY2014 is expected to strengthen moderately to 5.7% on improved global prospects and monetary easing as currency pressures abate. Elections and a new government coming into power in early FY2014 could resolve uncertainty related to the direction of economic policies and provide a basis for movement toward dealing with major structural issues that hold back investment and growth.
Wholesale price inflation will continue under pressure for the remainder of the fiscal year with some currency depreciation pass-through, food production issues, and hikes in administered prices, especially for fuel. Nevertheless, prices will be held in check by tighter monetary policies already in place. Inflation in FY2013 is expected to be 6.5%, somewhat lower than the ADO 2013 forecast of 7.2%, owing to much weaker growth that has eliminated pricing power and forced businesses to absorb higher costs by trimming profit margins. In FY2014, inflation is likely to edge higher to 6.8% with the continued need to adjust administered prices and somewhat higher growth. A good harvest on the back of a healthy monsoon and a more moderate increase in procurement prices this year augur well for the prospects of food inflation and should help contain consumer price inflation.
3.4.1 Selected economic indicators (%)
2013 2014
ADO 2013
Update ADO 2013
Update
GDP growth 6.0 4.7 6.5 5.7
Inflation 7.2 6.5 6.8 6.8
Current acct. bal. (share of GDP)
–4.4 –3.8 –3.7 –3.5
Source: ADB estimates.
3.4.12 Industrial outlook survey
–30
0
30
60
Financial situationCapacity utilizationBusiness situationProfit marginEmploymentOrder books
Q12013
Q12012
Q12011
Q12010
Q12009
Q12008
Q12007
Index
Source: Reserve Bank of India. http://www.rbi.org.in
3.4.13 HSBC Markit India purchasing managers indexes
30
40
50
60
70
ServicesManufacturing
AugJan2013
Jan2012
Jan2011
Jan2010
Jan2009
Jan2008
Jan2007
Index
indicates expansion
indicates contraction
Source: Bloomberg (accessed 20 September 2013).
148 Asian Development Outlook 2013 Update
Reining in the fiscal deficit to the targeted 4.8% of GDP will be challenging, with success depending critically on buoyant tax and nontax revenue and significant reductions in fuel subsidies. Tepid industrial activity will make it challenging for customs and excise duty collections to meet their targets, while slow growth will hurt corporate tax collections. Adverse market conditions are likely to push disinvestment receipts lower than originally targeted. While easing crude oil prices and periodic increases in domestic fuel prices will help keep fuel subsidies in check, a weaker currency has significantly raised the extent of losses on diesel, kerosene, and cooking gas, posing a major risk to meeting the subsidy-reduction target. Accordingly, there is concern that capital spending could be cut back to avoid overrunning the targeted fiscal deficit.
The recently passed National Food Security Bill, which entitles around two-thirds of the population to subsidized food grain, will put additional strain on fiscal expenditure in FY2014 (states are being given 6 months to identify eligible households in a fair and transparent manner). This strain could be mitigated by reducing other, weakly targeted subsidies. Passing the long-delayed legislation on income tax reform and the national value-added tax on goods and services (the Direct Tax Code and Goods and Services Tax bills) would substantially strengthen fiscal fundamentals.
The prospects for global growth remain uneven, as recovery in the US and Japan contrasts with sluggish growth in European Union and a moderation in the People’s Republic of China. Given the multispeed global cycle, a swift pickup in exports looks unlikely. However, a depreciated currency and a pickup in growth in some major markets should help exports grow at a faster clip than in FY2012, likely at 4% in FY2013 to reach $319 billion. A slowing economy, a depreciated currency, and curbs on imports of gold and other luxuries will allow imports to contract by 2.4% to $490 billion. The trend of moderating growth in invisibles over the past couple of years poses a risk, but a depreciated currency should provide some fillip to software exports and remittances. The introduction of an inflation-indexed saving scheme is likely to temper demand for gold, which has emerged as an inflation hedge in recent years. The current account deficit is likely to moderate to 3.8% of GDP in FY2013, better than the 4.4% forecast in ADO 2013.
Improved prospects in advanced economies are expected to help exports grow by 8% in FY2014. At the same time an uptick in domestic growth and the removal of some of the curbs introduced in 2013 will boost imports by 6%. The current account deficit is expected to improve to 3.5% in FY2014.
The measures introduced to curb the current account deficit and attract capital flows are likely to ensure adequate financing of the current account with little drawdown of foreign exchange reserves. India has expanded its bilateral swap agreement with Japan to $50 billion to strengthen its backstops.
The decision by the Federal Reserve Open Market Committee in September not to immediately taper its quantitative easing program bodes well for stability in international capital markets in the near term. But the recent lesson should not be lost: India needs to accelerate fundamental structural and fiscal reforms both to avoid risk when the advanced countries phase out their easy monetary policies and to realize the country’s full economic potential and resume the Indian success story.
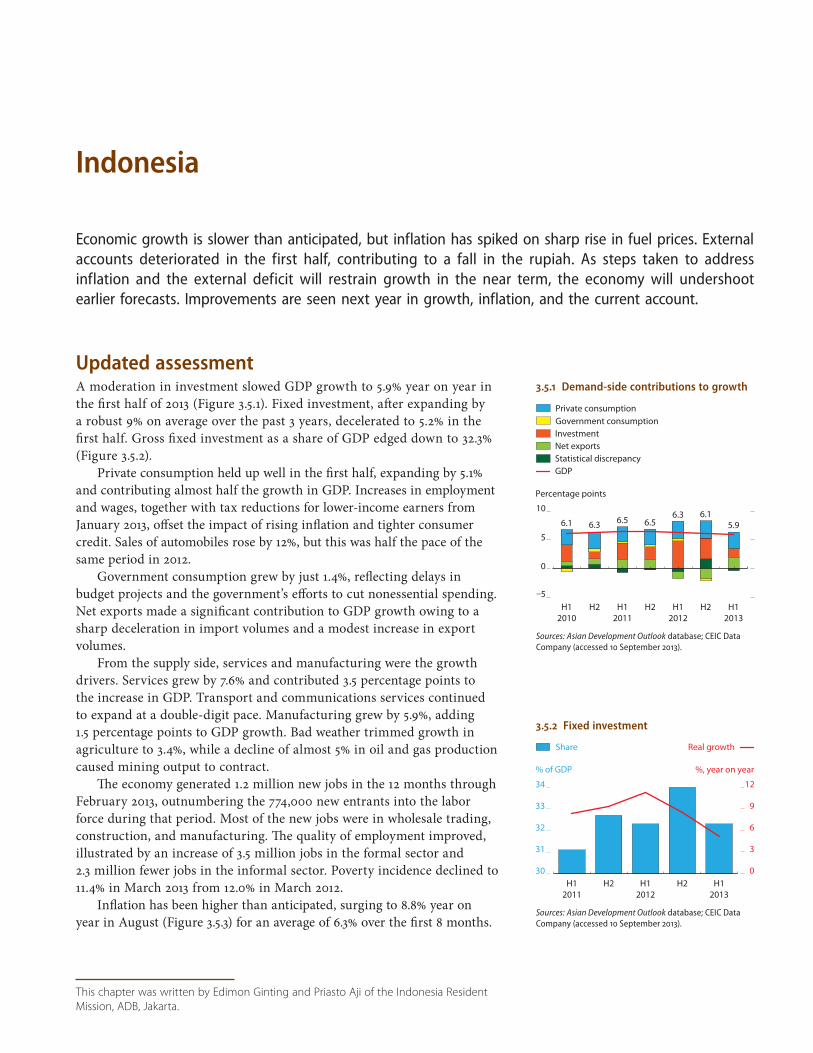
This chapter was written by Edimon Ginting and Priasto Aji of the Indonesia Resident
Mission, ADB, Jakarta.
Indonesia
Economic growth is slower than anticipated, but inflation has spiked on sharp rise in fuel prices. External accounts deteriorated in the first half, contributing to a fall in the rupiah. As steps taken to address inflation and the external deficit will restrain growth in the near term, the economy will undershoot earlier forecasts. Improvements are seen next year in growth, inflation, and the current account.
Updated assessmentA moderation in investment slowed GDP growth to 5.9% year on year in the first half of 2013 (Figure 3.5.1). Fixed investment, after expanding by a robust 9% on average over the past 3 years, decelerated to 5.2% in the first half. Gross fixed investment as a share of GDP edged down to 32.3% (Figure 3.5.2).
Private consumption held up well in the first half, expanding by 5.1% and contributing almost half the growth in GDP. Increases in employment and wages, together with tax reductions for lower-income earners from January 2013, offset the impact of rising inflation and tighter consumer credit. Sales of automobiles rose by 12%, but this was half the pace of the same period in 2012.
Government consumption grew by just 1.4%, reflecting delays in budget projects and the government’s efforts to cut nonessential spending. Net exports made a significant contribution to GDP growth owing to a sharp deceleration in import volumes and a modest increase in export volumes.
From the supply side, services and manufacturing were the growth drivers. Services grew by 7.6% and contributed 3.5 percentage points to the increase in GDP. Transport and communications services continued to expand at a double-digit pace. Manufacturing grew by 5.9%, adding 1.5 percentage points to GDP growth. Bad weather trimmed growth in agriculture to 3.4%, while a decline of almost 5% in oil and gas production caused mining output to contract.
The economy generated 1.2 million new jobs in the 12 months through February 2013, outnumbering the 774,000 new entrants into the labor force during that period. Most of the new jobs were in wholesale trading, construction, and manufacturing. The quality of employment improved, illustrated by an increase of 3.5 million jobs in the formal sector and 2.3 million fewer jobs in the informal sector. Poverty incidence declined to 11.4% in March 2013 from 12.0% in March 2012.
Inflation has been higher than anticipated, surging to 8.8% year on year in August (Figure 3.5.3) for an average of 6.3% over the first 8 months.
3.5.1 Demand-side contributions to growth
6.1 6.3 6.5 6.56.3 6.1
5.9
–5
0
5
10
H12010
H2 H12011
H2 H12012
H2
Percentage points
H12013
Government consumptionInvestmentNet exportsStatistical discrepancyGDP
Private consumption
Sources: Asian Development Outlook database; CEIC Data Company (accessed 10 September 2013).
3.5.2 Fixed investment
30
31
32
33
34
0
3
6
9
12
Real growthShare
H12013
H2H12012
H2H12011
% of GDP %, year on year
Sources: Asian Development Outlook database; CEIC Data Company (accessed 10 September 2013).
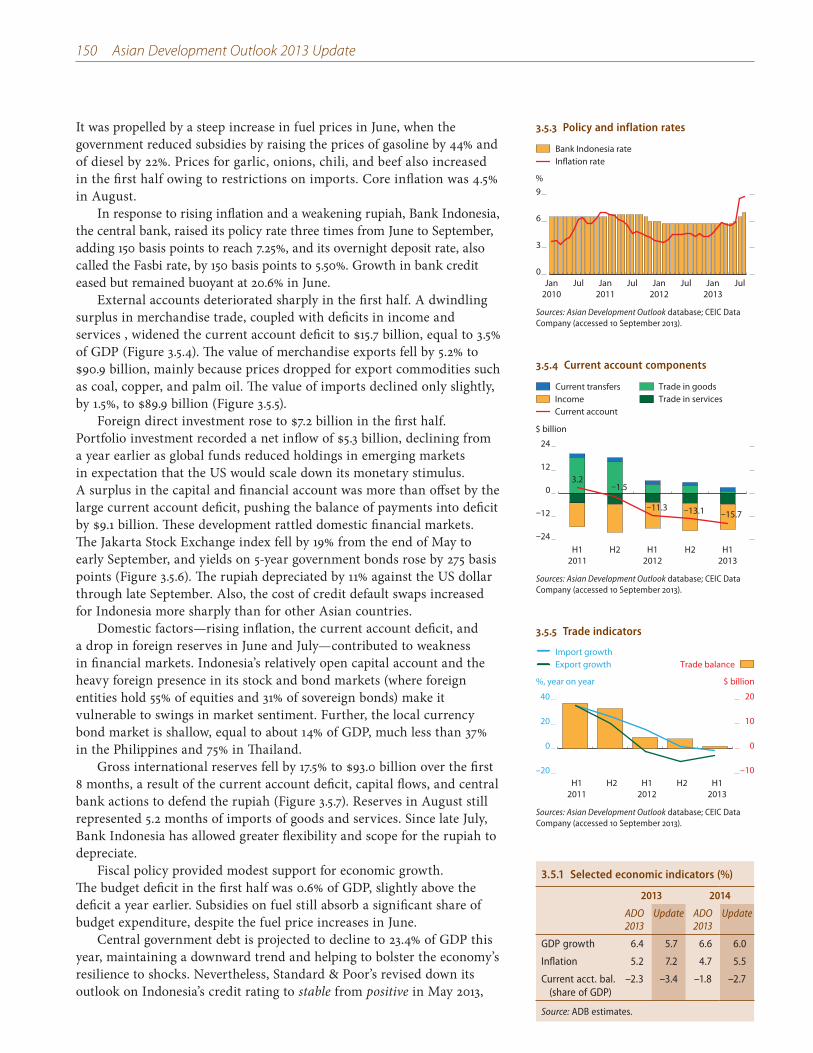
150 Asian Development Outlook 2013 Update
It was propelled by a steep increase in fuel prices in June, when the government reduced subsidies by raising the prices of gasoline by 44% and of diesel by 22%. Prices for garlic, onions, chili, and beef also increased in the first half owing to restrictions on imports. Core inflation was 4.5% in August.
In response to rising inflation and a weakening rupiah, Bank Indonesia, the central bank, raised its policy rate three times from June to September, adding 150 basis points to reach 7.25%, and its overnight deposit rate, also called the Fasbi rate, by 150 basis points to 5.50%. Growth in bank credit eased but remained buoyant at 20.6% in June.
External accounts deteriorated sharply in the first half. A dwindling surplus in merchandise trade, coupled with deficits in income and services , widened the current account deficit to $15.7 billion, equal to 3.5% of GDP (Figure 3.5.4). The value of merchandise exports fell by 5.2% to $90.9 billion, mainly because prices dropped for export commodities such as coal, copper, and palm oil. The value of imports declined only slightly, by 1.5%, to $89.9 billion (Figure 3.5.5).
Foreign direct investment rose to $7.2 billion in the first half. Portfolio investment recorded a net inflow of $5.3 billion, declining from a year earlier as global funds reduced holdings in emerging markets in expectation that the US would scale down its monetary stimulus. A surplus in the capital and financial account was more than offset by the large current account deficit, pushing the balance of payments into deficit by $9.1 billion. These development rattled domestic financial markets. The Jakarta Stock Exchange index fell by 19% from the end of May to early September, and yields on 5-year government bonds rose by 275 basis points (Figure 3.5.6). The rupiah depreciated by 11% against the US dollar through late September. Also, the cost of credit default swaps increased for Indonesia more sharply than for other Asian countries.
Domestic factors—rising inflation, the current account deficit, and a drop in foreign reserves in June and July—contributed to weakness in financial markets. Indonesia’s relatively open capital account and the heavy foreign presence in its stock and bond markets (where foreign entities hold 55% of equities and 31% of sovereign bonds) make it vulnerable to swings in market sentiment. Further, the local currency bond market is shallow, equal to about 14% of GDP, much less than 37% in the Philippines and 75% in Thailand.
Gross international reserves fell by 17.5% to $93.0 billion over the first 8 months, a result of the current account deficit, capital flows, and central bank actions to defend the rupiah (Figure 3.5.7). Reserves in August still represented 5.2 months of imports of goods and services. Since late July, Bank Indonesia has allowed greater flexibility and scope for the rupiah to depreciate.
Fiscal policy provided modest support for economic growth. The budget deficit in the first half was 0.6% of GDP, slightly above the deficit a year earlier. Subsidies on fuel still absorb a significant share of budget expenditure, despite the fuel price increases in June.
Central government debt is projected to decline to 23.4% of GDP this year, maintaining a downward trend and helping to bolster the economy’s resilience to shocks. Nevertheless, Standard & Poor’s revised down its outlook on Indonesia’s credit rating to stable from positive in May 2013,
3.5.3 Policy and inflation rates
0
3
6
9
Inflation rateBank Indonesia rate
Jul Jan2013
Jul Jan2012
Jul Jan2011
Jul Jan2010
%
Sources: Asian Development Outlook database; CEIC Data Company (accessed 10 September 2013).
3.5.4 Current account components
3.2–1.5
–11.3 –13.1 –15.7
–24
–12
0
12
24
H12011
H2 H12012
H2 H12013
$ billion
Current transfersIncome
Trade in goodsTrade in services
Current account
Sources: Asian Development Outlook database; CEIC Data Company (accessed 10 September 2013).
3.5.5 Trade indicators
–20
0
20
40
–10
0
10
20
Trade balanceImport growthExport growth
H12013
H2H12012
H2H12011
%, year on year $ billion
Sources: Asian Development Outlook database; CEIC Data Company (accessed 10 September 2013).
3.5.1 Selected economic indicators (%)
2013 2014
ADO 2013
Update ADO 2013
Update
GDP growth 6.4 5.7 6.6 6.0
Inflation 5.2 7.2 4.7 5.5
Current acct. bal. (share of GDP)
–2.3 –3.4 –1.8 –2.7
Source: ADB estimates.
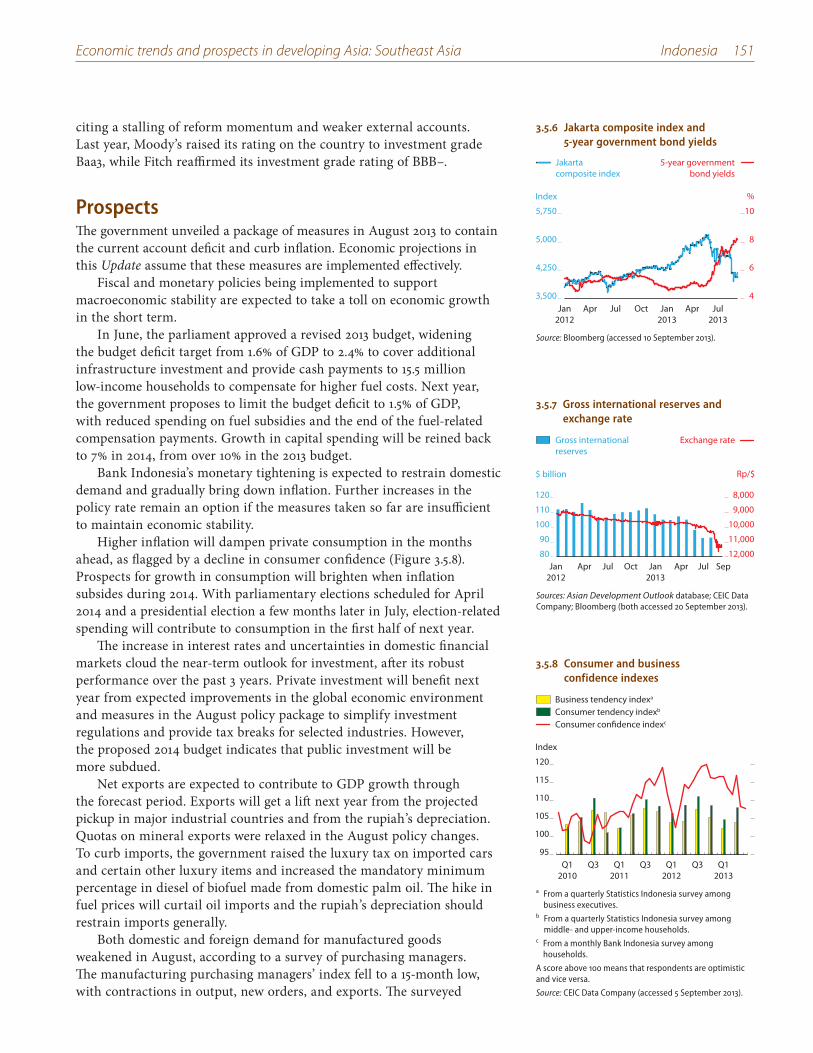
Economic trends and prospects in developing Asia: Southeast Asia Indonesia 151
citing a stalling of reform momentum and weaker external accounts. Last year, Moody’s raised its rating on the country to investment grade Baa3, while Fitch reaffirmed its investment grade rating of BBB–.
ProspectsThe government unveiled a package of measures in August 2013 to contain the current account deficit and curb inflation. Economic projections in this Update assume that these measures are implemented effectively.
Fiscal and monetary policies being implemented to support macroeconomic stability are expected to take a toll on economic growth in the short term.
In June, the parliament approved a revised 2013 budget, widening the budget deficit target from 1.6% of GDP to 2.4% to cover additional infrastructure investment and provide cash payments to 15.5 million low-income households to compensate for higher fuel costs. Next year, the government proposes to limit the budget deficit to 1.5% of GDP, with reduced spending on fuel subsidies and the end of the fuel-related compensation payments. Growth in capital spending will be reined back to 7% in 2014, from over 10% in the 2013 budget.
Bank Indonesia’s monetary tightening is expected to restrain domestic demand and gradually bring down inflation. Further increases in the policy rate remain an option if the measures taken so far are insufficient to maintain economic stability.
Higher inflation will dampen private consumption in the months ahead, as flagged by a decline in consumer confidence (Figure 3.5.8). Prospects for growth in consumption will brighten when inflation subsides during 2014. With parliamentary elections scheduled for April 2014 and a presidential election a few months later in July, election-related spending will contribute to consumption in the first half of next year.
The increase in interest rates and uncertainties in domestic financial markets cloud the near-term outlook for investment, after its robust performance over the past 3 years. Private investment will benefit next year from expected improvements in the global economic environment and measures in the August policy package to simplify investment regulations and provide tax breaks for selected industries. However, the proposed 2014 budget indicates that public investment will be more subdued.
Net exports are expected to contribute to GDP growth through the forecast period. Exports will get a lift next year from the projected pickup in major industrial countries and from the rupiah’s depreciation. Quotas on mineral exports were relaxed in the August policy changes. To curb imports, the government raised the luxury tax on imported cars and certain other luxury items and increased the mandatory minimum percentage in diesel of biofuel made from domestic palm oil. The hike in fuel prices will curtail oil imports and the rupiah’s depreciation should restrain imports generally.
Both domestic and foreign demand for manufactured goods weakened in August, according to a survey of purchasing managers. The manufacturing purchasing managers’ index fell to a 15-month low, with contractions in output, new orders, and exports. The surveyed
3.5.6 Jakarta composite index and 5-year government bond yields
3,500
4,250
5,000
5,750
4
6
8
10
Jakartacomposite index
5-year governmentbond yields
Jul2013
AprJan2013
OctJulAprJan2012
Index %
Source: Bloomberg (accessed 10 September 2013).
3.5.7 Gross international reserves and exchange rate
Rp/$$ billion
Exchange rateGross internationalreserves
8,000
9,000
10,000
11,000
12,00080
90
100
110
120
Jan2012
Apr Jul Oct Jan2013
Apr Jul Sep
Sources: Asian Development Outlook database; CEIC Data Company; Bloomberg (both accessed 20 September 2013).
3.5.8 Consumer and business confidence indexes
95
100
105
110
115
120
Q12013
Q3 Q12012
Q3 Q12011
Q3 Q12010
Index
Business tendency indexa
Consumer tendency indexb
Consumer confidence indexc
a From a quarterly Statistics Indonesia survey among business executives.
b From a quarterly Statistics Indonesia survey among middle- and upper-income households.
c From a monthly Bank Indonesia survey among households.
A score above 100 means that respondents are optimistic and vice versa.
Source: CEIC Data Company (accessed 5 September 2013).
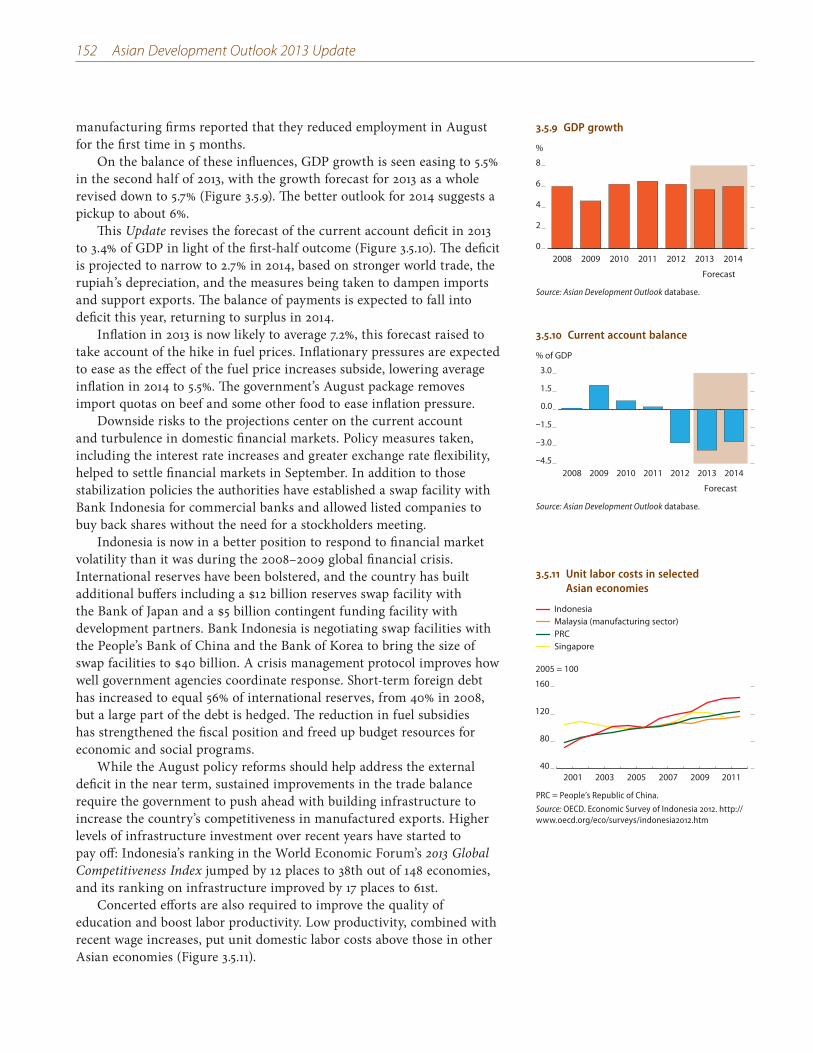
152 Asian Development Outlook 2013 Update
manufacturing firms reported that they reduced employment in August for the first time in 5 months.
On the balance of these influences, GDP growth is seen easing to 5.5% in the second half of 2013, with the growth forecast for 2013 as a whole revised down to 5.7% (Figure 3.5.9). The better outlook for 2014 suggests a pickup to about 6%.
This Update revises the forecast of the current account deficit in 2013 to 3.4% of GDP in light of the first-half outcome (Figure 3.5.10). The deficit is projected to narrow to 2.7% in 2014, based on stronger world trade, the rupiah’s depreciation, and the measures being taken to dampen imports and support exports. The balance of payments is expected to fall into deficit this year, returning to surplus in 2014.
Inflation in 2013 is now likely to average 7.2%, this forecast raised to take account of the hike in fuel prices. Inflationary pressures are expected to ease as the effect of the fuel price increases subside, lowering average inflation in 2014 to 5.5%. The government’s August package removes import quotas on beef and some other food to ease inflation pressure.
Downside risks to the projections center on the current account and turbulence in domestic financial markets. Policy measures taken, including the interest rate increases and greater exchange rate flexibility, helped to settle financial markets in September. In addition to those stabilization policies the authorities have established a swap facility with Bank Indonesia for commercial banks and allowed listed companies to buy back shares without the need for a stockholders meeting.
Indonesia is now in a better position to respond to financial market volatility than it was during the 2008–2009 global financial crisis. International reserves have been bolstered, and the country has built additional buffers including a $12 billion reserves swap facility with the Bank of Japan and a $5 billion contingent funding facility with development partners. Bank Indonesia is negotiating swap facilities with the People’s Bank of China and the Bank of Korea to bring the size of swap facilities to $40 billion. A crisis management protocol improves how well government agencies coordinate response. Short-term foreign debt has increased to equal 56% of international reserves, from 40% in 2008, but a large part of the debt is hedged. The reduction in fuel subsidies has strengthened the fiscal position and freed up budget resources for economic and social programs.
While the August policy reforms should help address the external deficit in the near term, sustained improvements in the trade balance require the government to push ahead with building infrastructure to increase the country’s competitiveness in manufactured exports. Higher levels of infrastructure investment over recent years have started to pay off: Indonesia’s ranking in the World Economic Forum’s 2013 Global Competitiveness Index jumped by 12 places to 38th out of 148 economies, and its ranking on infrastructure improved by 17 places to 61st.
Concerted efforts are also required to improve the quality of education and boost labor productivity. Low productivity, combined with recent wage increases, put unit domestic labor costs above those in other Asian economies (Figure 3.5.11).
3.5.9 GDP growth
0
2
4
6
8
2014201320122011201020092008
%
Forecast
Source: Asian Development Outlook database.
3.5.10 Current account balance
–4.5
–3.0
–1.5
0.0
1.5
3.0
2014201320122011201020092008
% of GDP
Forecast
Source: Asian Development Outlook database.
3.5.11 Unit labor costs in selected Asian economies
40
80
120
160
Singapore
Malaysia (manufacturing sector)PRC
Indonesia
201120092007200520032001
2005 = 100
PRC = People’s Republic of China.
Source: OECD. Economic Survey of Indonesia 2012. http://www.oecd.org/eco/surveys/indonesia2012.htm
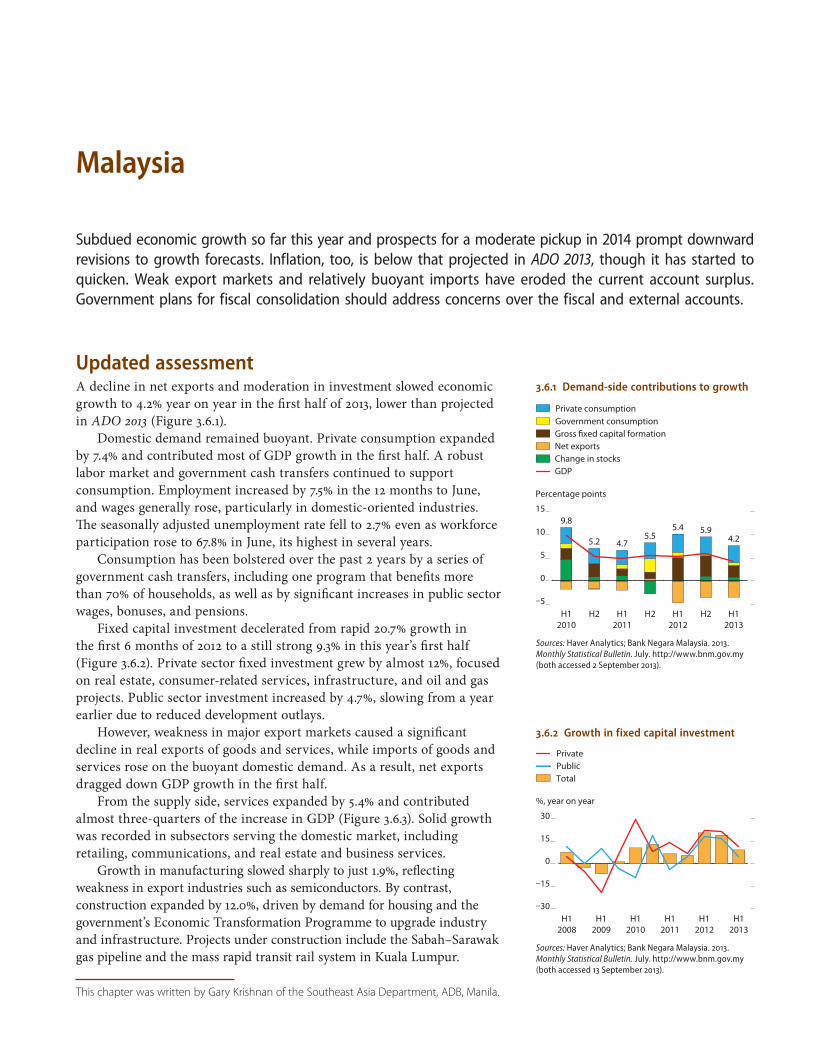
This chapter was written by Gary Krishnan of the Southeast Asia Department, ADB, Manila.
3.6.1 Demand-side contributions to growth
Government consumptionGross fixed capital formationNet exportsChange in stocksGDP
Private consumption
9.8
5.2 4.75.5
5.4 5.94.2
–5
0
5
10
15
H12010
H2 H12011
H2 H12012
H2 H12013
Percentage points
Sources: Haver Analytics; Bank Negara Malaysia. 2013. Monthly Statistical Bulletin. July. http://www.bnm.gov.my (both accessed 2 September 2013).
Malaysia
Subdued economic growth so far this year and prospects for a moderate pickup in 2014 prompt downward revisions to growth forecasts. Inflation, too, is below that projected in ADO 2013, though it has started to quicken. Weak export markets and relatively buoyant imports have eroded the current account surplus. Government plans for fiscal consolidation should address concerns over the fiscal and external accounts.
Updated assessmentA decline in net exports and moderation in investment slowed economic growth to 4.2% year on year in the first half of 2013, lower than projected in ADO 2013 (Figure 3.6.1).
Domestic demand remained buoyant. Private consumption expanded by 7.4% and contributed most of GDP growth in the first half. A robust labor market and government cash transfers continued to support consumption. Employment increased by 7.5% in the 12 months to June, and wages generally rose, particularly in domestic-oriented industries. The seasonally adjusted unemployment rate fell to 2.7% even as workforce participation rose to 67.8% in June, its highest in several years.
Consumption has been bolstered over the past 2 years by a series of government cash transfers, including one program that benefits more than 70% of households, as well as by significant increases in public sector wages, bonuses, and pensions.
Fixed capital investment decelerated from rapid 20.7% growth in the first 6 months of 2012 to a still strong 9.3% in this year’s first half (Figure 3.6.2). Private sector fixed investment grew by almost 12%, focused on real estate, consumer-related services, infrastructure, and oil and gas projects. Public sector investment increased by 4.7%, slowing from a year earlier due to reduced development outlays.
However, weakness in major export markets caused a significant decline in real exports of goods and services, while imports of goods and services rose on the buoyant domestic demand. As a result, net exports dragged down GDP growth in the first half.
From the supply side, services expanded by 5.4% and contributed almost three-quarters of the increase in GDP (Figure 3.6.3). Solid growth was recorded in subsectors serving the domestic market, including retailing, communications, and real estate and business services.
Growth in manufacturing slowed sharply to just 1.9%, reflecting weakness in export industries such as semiconductors. By contrast, construction expanded by 12.0%, driven by demand for housing and the government’s Economic Transformation Programme to upgrade industry and infrastructure. Projects under construction include the Sabah–Sarawak gas pipeline and the mass rapid transit rail system in Kuala Lumpur.
3.6.2 Growth in fixed capital investment
–30
–15
0
15
30
PrivatePublicTotal
H12013
H12012
H12011
H12010
H12009
H12008
%, year on year
Sources: Haver Analytics; Bank Negara Malaysia. 2013. Monthly Statistical Bulletin. July. http://www.bnm.gov.my (both accessed 13 September 2013).
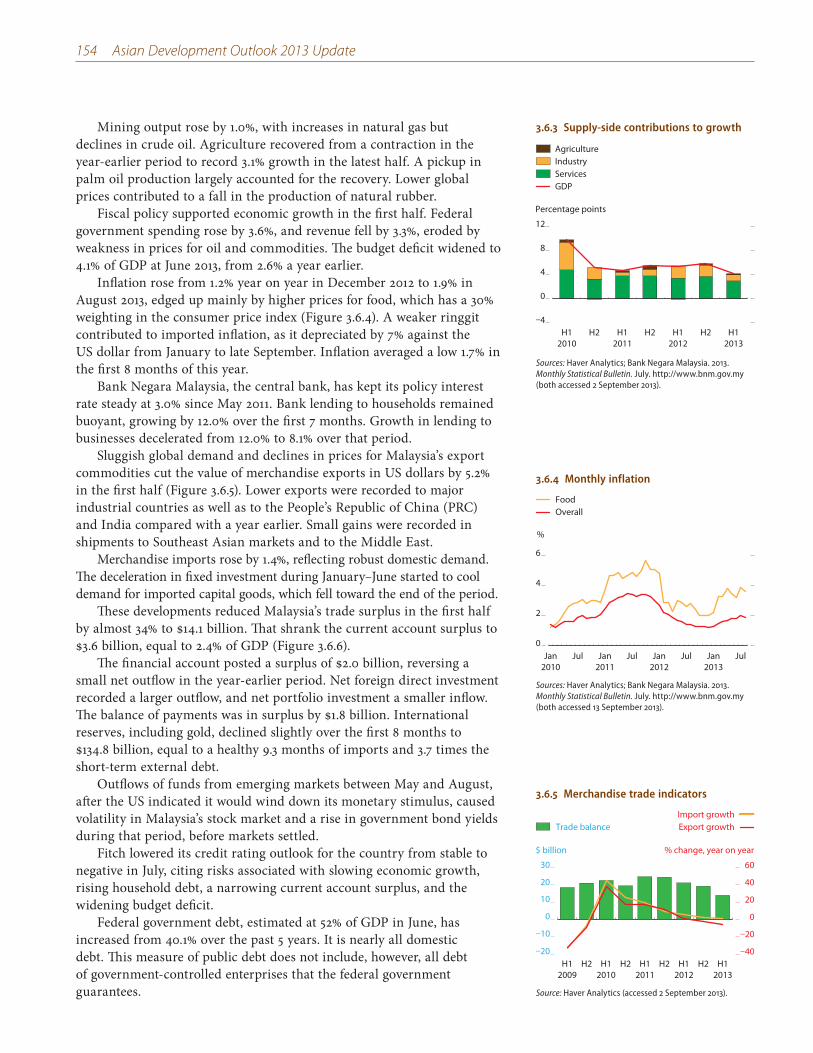
154 Asian Development Outlook 2013 Update
Mining output rose by 1.0%, with increases in natural gas but declines in crude oil. Agriculture recovered from a contraction in the year-earlier period to record 3.1% growth in the latest half. A pickup in palm oil production largely accounted for the recovery. Lower global prices contributed to a fall in the production of natural rubber.
Fiscal policy supported economic growth in the first half. Federal government spending rose by 3.6%, and revenue fell by 3.3%, eroded by weakness in prices for oil and commodities. The budget deficit widened to 4.1% of GDP at June 2013, from 2.6% a year earlier.
Inflation rose from 1.2% year on year in December 2012 to 1.9% in August 2013, edged up mainly by higher prices for food, which has a 30% weighting in the consumer price index (Figure 3.6.4). A weaker ringgit contributed to imported inflation, as it depreciated by 7% against the US dollar from January to late September. Inflation averaged a low 1.7% in the first 8 months of this year.
Bank Negara Malaysia, the central bank, has kept its policy interest rate steady at 3.0% since May 2011. Bank lending to households remained buoyant, growing by 12.0% over the first 7 months. Growth in lending to businesses decelerated from 12.0% to 8.1% over that period.
Sluggish global demand and declines in prices for Malaysia’s export commodities cut the value of merchandise exports in US dollars by 5.2% in the first half (Figure 3.6.5). Lower exports were recorded to major industrial countries as well as to the People’s Republic of China (PRC) and India compared with a year earlier. Small gains were recorded in shipments to Southeast Asian markets and to the Middle East.
Merchandise imports rose by 1.4%, reflecting robust domestic demand. The deceleration in fixed investment during January–June started to cool demand for imported capital goods, which fell toward the end of the period.
These developments reduced Malaysia’s trade surplus in the first half by almost 34% to $14.1 billion. That shrank the current account surplus to $3.6 billion, equal to 2.4% of GDP (Figure 3.6.6).
The financial account posted a surplus of $2.0 billion, reversing a small net outflow in the year-earlier period. Net foreign direct investment recorded a larger outflow, and net portfolio investment a smaller inflow. The balance of payments was in surplus by $1.8 billion. International reserves, including gold, declined slightly over the first 8 months to $134.8 billion, equal to a healthy 9.3 months of imports and 3.7 times the short-term external debt.
Outflows of funds from emerging markets between May and August, after the US indicated it would wind down its monetary stimulus, caused volatility in Malaysia’s stock market and a rise in government bond yields during that period, before markets settled.
Fitch lowered its credit rating outlook for the country from stable to negative in July, citing risks associated with slowing economic growth, rising household debt, a narrowing current account surplus, and the widening budget deficit.
Federal government debt, estimated at 52% of GDP in June, has increased from 40.1% over the past 5 years. It is nearly all domestic debt. This measure of public debt does not include, however, all debt of government-controlled enterprises that the federal government guarantees.
3.6.3 Supply-side contributions to growth
AgricultureIndustryServicesGDP
–4
0
4
8
12
H12010
H2 H12011
H2 H12012
H2 H12013
Percentage points
Sources: Haver Analytics; Bank Negara Malaysia. 2013. Monthly Statistical Bulletin. July. http://www.bnm.gov.my (both accessed 2 September 2013).
3.6.4 Monthly inflation
0
2
4
6
FoodOverall
Jul Jan2013
JulJan2012
JulJan2011
JulJan2010
%
Sources: Haver Analytics; Bank Negara Malaysia. 2013. Monthly Statistical Bulletin. July. http://www.bnm.gov.my (both accessed 13 September 2013).
3.6.5 Merchandise trade indicators
–20
–10
0
10
20
30
–40
–20
0
20
40
60
Trade balanceImport growthExport growth
H12013
H2H12012
H2H12011
H2H12010
H2H12009
$ billion % change, year on year
Source: Haver Analytics (accessed 2 September 2013).
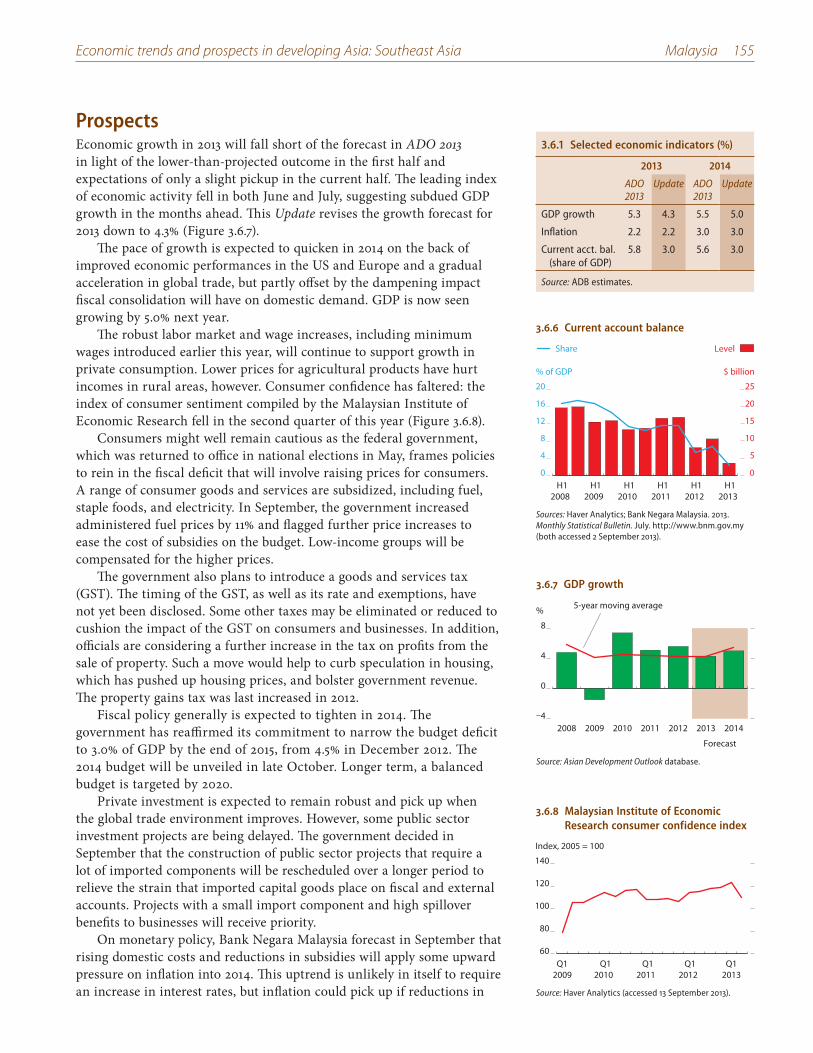
Economic trends and prospects in developing Asia: Southeast Asia Malaysia 155
ProspectsEconomic growth in 2013 will fall short of the forecast in ADO 2013 in light of the lower-than-projected outcome in the first half and expectations of only a slight pickup in the current half. The leading index of economic activity fell in both June and July, suggesting subdued GDP growth in the months ahead. This Update revises the growth forecast for 2013 down to 4.3% (Figure 3.6.7).
The pace of growth is expected to quicken in 2014 on the back of improved economic performances in the US and Europe and a gradual acceleration in global trade, but partly offset by the dampening impact fiscal consolidation will have on domestic demand. GDP is now seen growing by 5.0% next year.
The robust labor market and wage increases, including minimum wages introduced earlier this year, will continue to support growth in private consumption. Lower prices for agricultural products have hurt incomes in rural areas, however. Consumer confidence has faltered: the index of consumer sentiment compiled by the Malaysian Institute of Economic Research fell in the second quarter of this year (Figure 3.6.8).
Consumers might well remain cautious as the federal government, which was returned to office in national elections in May, frames policies to rein in the fiscal deficit that will involve raising prices for consumers. A range of consumer goods and services are subsidized, including fuel, staple foods, and electricity. In September, the government increased administered fuel prices by 11% and flagged further price increases to ease the cost of subsidies on the budget. Low-income groups will be compensated for the higher prices.
The government also plans to introduce a goods and services tax (GST). The timing of the GST, as well as its rate and exemptions, have not yet been disclosed. Some other taxes may be eliminated or reduced to cushion the impact of the GST on consumers and businesses. In addition, officials are considering a further increase in the tax on profits from the sale of property. Such a move would help to curb speculation in housing, which has pushed up housing prices, and bolster government revenue. The property gains tax was last increased in 2012.
Fiscal policy generally is expected to tighten in 2014. The government has reaffirmed its commitment to narrow the budget deficit to 3.0% of GDP by the end of 2015, from 4.5% in December 2012. The 2014 budget will be unveiled in late October. Longer term, a balanced budget is targeted by 2020.
Private investment is expected to remain robust and pick up when the global trade environment improves. However, some public sector investment projects are being delayed. The government decided in September that the construction of public sector projects that require a lot of imported components will be rescheduled over a longer period to relieve the strain that imported capital goods place on fiscal and external accounts. Projects with a small import component and high spillover benefits to businesses will receive priority.
On monetary policy, Bank Negara Malaysia forecast in September that rising domestic costs and reductions in subsidies will apply some upward pressure on inflation into 2014. This uptrend is unlikely in itself to require an increase in interest rates, but inflation could pick up if reductions in
3.6.6 Current account balance
0
4
8
12
16
20
0
5
10
15
20
25
Share Level
H12013
H12012
H12011
H12010
H12009
H12008
% of GDP $ billion
Sources: Haver Analytics; Bank Negara Malaysia. 2013. Monthly Statistical Bulletin. July. http://www.bnm.gov.my (both accessed 2 September 2013).
3.6.7 GDP growth
–4
0
4
8
2014201320122011201020092008
Forecast
% 5-year moving average
Source: Asian Development Outlook database.
3.6.8 Malaysian Institute of Economic Research consumer confidence index
60
80
100
120
140
Q12013
Q12012
Q12011
Q12010
Q12009
Index, 2005 = 100
Source: Haver Analytics (accessed 13 September 2013).
3.6.1 Selected economic indicators (%)
2013 2014
ADO 2013
Update ADO 2013
Update
GDP growth 5.3 4.3 5.5 5.0
Inflation 2.2 2.2 3.0 3.0
Current acct. bal. (share of GDP)
5.8 3.0 5.6 3.0
Source: ADB estimates.
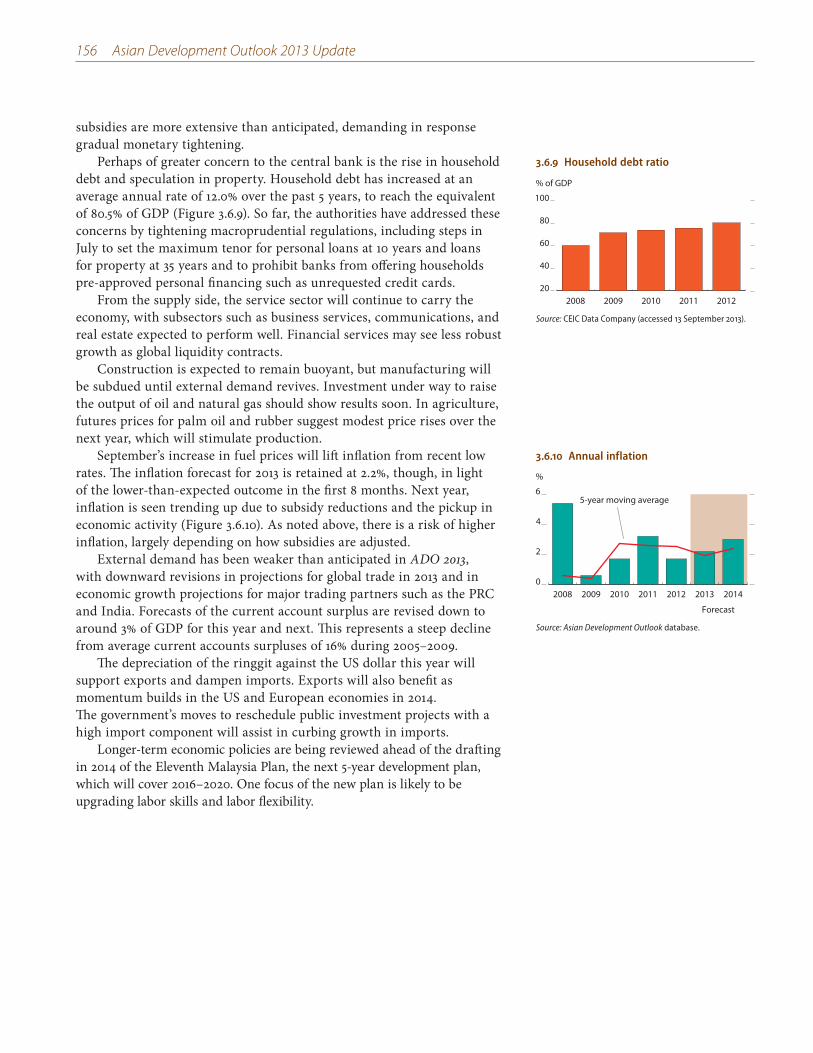
156 Asian Development Outlook 2013 Update
subsidies are more extensive than anticipated, demanding in response gradual monetary tightening.
Perhaps of greater concern to the central bank is the rise in household debt and speculation in property. Household debt has increased at an average annual rate of 12.0% over the past 5 years, to reach the equivalent of 80.5% of GDP (Figure 3.6.9). So far, the authorities have addressed these concerns by tightening macroprudential regulations, including steps in July to set the maximum tenor for personal loans at 10 years and loans for property at 35 years and to prohibit banks from offering households pre-approved personal financing such as unrequested credit cards.
From the supply side, the service sector will continue to carry the economy, with subsectors such as business services, communications, and real estate expected to perform well. Financial services may see less robust growth as global liquidity contracts.
Construction is expected to remain buoyant, but manufacturing will be subdued until external demand revives. Investment under way to raise the output of oil and natural gas should show results soon. In agriculture, futures prices for palm oil and rubber suggest modest price rises over the next year, which will stimulate production.
September’s increase in fuel prices will lift inflation from recent low rates. The inflation forecast for 2013 is retained at 2.2%, though, in light of the lower-than-expected outcome in the first 8 months. Next year, inflation is seen trending up due to subsidy reductions and the pickup in economic activity (Figure 3.6.10). As noted above, there is a risk of higher inflation, largely depending on how subsidies are adjusted.
External demand has been weaker than anticipated in ADO 2013, with downward revisions in projections for global trade in 2013 and in economic growth projections for major trading partners such as the PRC and India. Forecasts of the current account surplus are revised down to around 3% of GDP for this year and next. This represents a steep decline from average current accounts surpluses of 16% during 2005–2009.
The depreciation of the ringgit against the US dollar this year will support exports and dampen imports. Exports will also benefit as momentum builds in the US and European economies in 2014. The government’s moves to reschedule public investment projects with a high import component will assist in curbing growth in imports.
Longer-term economic policies are being reviewed ahead of the drafting in 2014 of the Eleventh Malaysia Plan, the next 5-year development plan, which will cover 2016–2020. One focus of the new plan is likely to be upgrading labor skills and labor flexibility.
3.6.9 Household debt ratio
20
40
60
80
100
20122011201020092008
% of GDP
Source: CEIC Data Company (accessed 13 September 2013).
3.6.10 Annual inflation
0
2
4
6
2014201320122011201020092008
5-year moving average
%
Forecast
Source: Asian Development Outlook database.
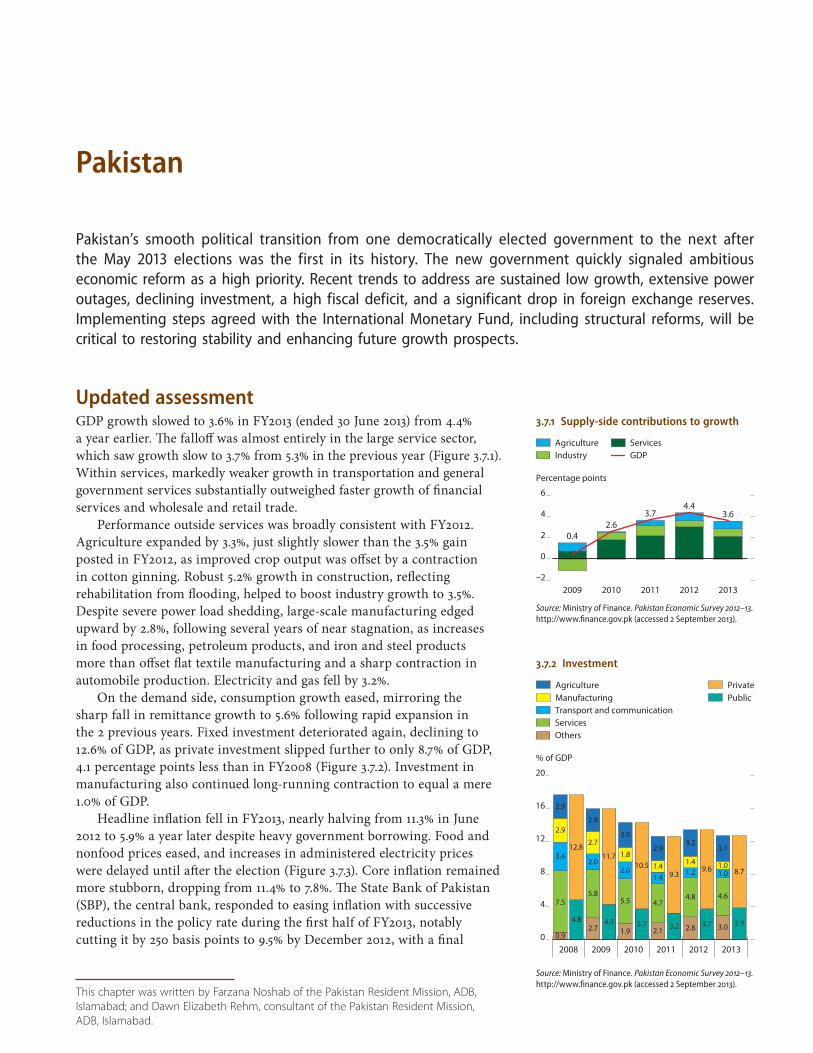
This chapter was written by Farzana Noshab of the Pakistan Resident Mission, ADB,
Islamabad; and Dawn Elizabeth Rehm, consultant of the Pakistan Resident Mission,
ADB, Islamabad.
3.7.1 Supply-side contributions to growth
0.42.6
3.74.4
3.6
–2
0
2
4
6
2009 2010 2011 2012 2013
Percentage points
AgricultureIndustry
ServicesGDP
Source: Ministry of Finance. Pakistan Economic Survey 2012–13. http://www.finance.gov.pk (accessed 2 September 2013).
Pakistan
Pakistan’s smooth political transition from one democratically elected government to the next after the May 2013 elections was the first in its history. The new government quickly signaled ambitious economic reform as a high priority. Recent trends to address are sustained low growth, extensive power outages, declining investment, a high fiscal deficit, and a significant drop in foreign exchange reserves. Implementing steps agreed with the International Monetary Fund, including structural reforms, will be critical to restoring stability and enhancing future growth prospects.
Updated assessment GDP growth slowed to 3.6% in FY2013 (ended 30 June 2013) from 4.4% a year earlier. The falloff was almost entirely in the large service sector, which saw growth slow to 3.7% from 5.3% in the previous year (Figure 3.7.1). Within services, markedly weaker growth in transportation and general government services substantially outweighed faster growth of financial services and wholesale and retail trade.
Performance outside services was broadly consistent with FY2012. Agriculture expanded by 3.3%, just slightly slower than the 3.5% gain posted in FY2012, as improved crop output was offset by a contraction in cotton ginning. Robust 5.2% growth in construction, reflecting rehabilitation from flooding, helped to boost industry growth to 3.5%. Despite severe power load shedding, large-scale manufacturing edged upward by 2.8%, following several years of near stagnation, as increases in food processing, petroleum products, and iron and steel products more than offset flat textile manufacturing and a sharp contraction in automobile production. Electricity and gas fell by 3.2%.
On the demand side, consumption growth eased, mirroring the sharp fall in remittance growth to 5.6% following rapid expansion in the 2 previous years. Fixed investment deteriorated again, declining to 12.6% of GDP, as private investment slipped further to only 8.7% of GDP, 4.1 percentage points less than in FY2008 (Figure 3.7.2). Investment in manufacturing also continued long-running contraction to equal a mere 1.0% of GDP.
Headline inflation fell in FY2013, nearly halving from 11.3% in June 2012 to 5.9% a year later despite heavy government borrowing. Food and nonfood prices eased, and increases in administered electricity prices were delayed until after the election (Figure 3.7.3). Core inflation remained more stubborn, dropping from 11.4% to 7.8%. The State Bank of Pakistan (SBP), the central bank, responded to easing inflation with successive reductions in the policy rate during the first half of FY2013, notably cutting it by 250 basis points to 9.5% by December 2012, with a final
3.7.2 Investment
% of GDP
ManufacturingTransport and communicationServicesOthers
AgriculturePublicPrivate
0.92.7 1.9 2.1 2.8 3.0
7.55.8
5.5 4.74.8 4.6
3.42.0
2.01.4
1.2 1.0
2.9
2.7
1.81.4 1.4 1.0
2.9
2.8
3.0
2.93.2
3.1
4.8 4.3 3.7 3.2 3.7 3.9
12.811.7
10.59.3
9.6 8.7
0
4
8
12
16
20
2008 2009 2010 2011 2012 2013
Source: Ministry of Finance. Pakistan Economic Survey 2012–13. http://www.finance.gov.pk (accessed 2 September 2013).
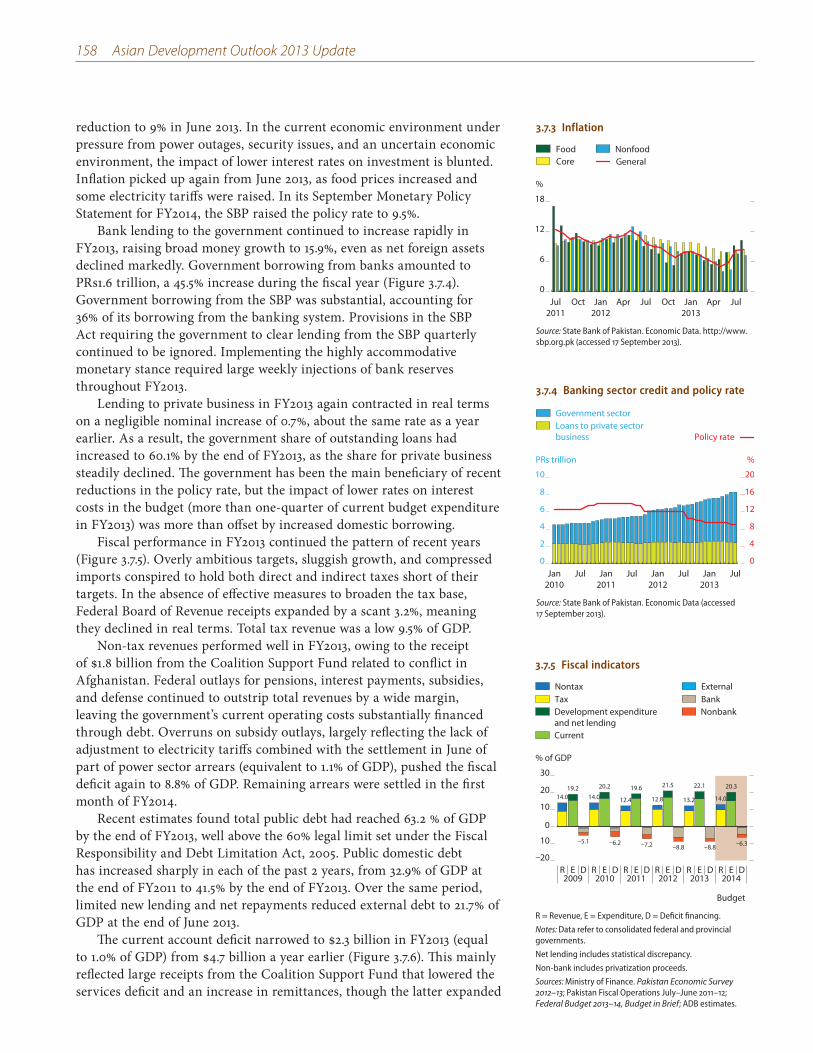
158 Asian Development Outlook 2013 Update
reduction to 9% in June 2013. In the current economic environment under pressure from power outages, security issues, and an uncertain economic environment, the impact of lower interest rates on investment is blunted. Inflation picked up again from June 2013, as food prices increased and some electricity tariffs were raised. In its September Monetary Policy Statement for FY2014, the SBP raised the policy rate to 9.5%.
Bank lending to the government continued to increase rapidly in FY2013, raising broad money growth to 15.9%, even as net foreign assets declined markedly. Government borrowing from banks amounted to PRs1.6 trillion, a 45.5% increase during the fiscal year (Figure 3.7.4). Government borrowing from the SBP was substantial, accounting for 36% of its borrowing from the banking system. Provisions in the SBP Act requiring the government to clear lending from the SBP quarterly continued to be ignored. Implementing the highly accommodative monetary stance required large weekly injections of bank reserves throughout FY2013.
Lending to private business in FY2013 again contracted in real terms on a negligible nominal increase of 0.7%, about the same rate as a year earlier. As a result, the government share of outstanding loans had increased to 60.1% by the end of FY2013, as the share for private business steadily declined. The government has been the main beneficiary of recent reductions in the policy rate, but the impact of lower rates on interest costs in the budget (more than one-quarter of current budget expenditure in FY2013) was more than offset by increased domestic borrowing.
Fiscal performance in FY2013 continued the pattern of recent years (Figure 3.7.5). Overly ambitious targets, sluggish growth, and compressed imports conspired to hold both direct and indirect taxes short of their targets. In the absence of effective measures to broaden the tax base, Federal Board of Revenue receipts expanded by a scant 3.2%, meaning they declined in real terms. Total tax revenue was a low 9.5% of GDP.
Non-tax revenues performed well in FY2013, owing to the receipt of $1.8 billion from the Coalition Support Fund related to conflict in Afghanistan. Federal outlays for pensions, interest payments, subsidies, and defense continued to outstrip total revenues by a wide margin, leaving the government’s current operating costs substantially financed through debt. Overruns on subsidy outlays, largely reflecting the lack of adjustment to electricity tariffs combined with the settlement in June of part of power sector arrears (equivalent to 1.1% of GDP), pushed the fiscal deficit again to 8.8% of GDP. Remaining arrears were settled in the first month of FY2014.
Recent estimates found total public debt had reached 63.2 % of GDP by the end of FY2013, well above the 60% legal limit set under the Fiscal Responsibility and Debt Limitation Act, 2005. Public domestic debt has increased sharply in each of the past 2 years, from 32.9% of GDP at the end of FY2011 to 41.5% by the end of FY2013. Over the same period, limited new lending and net repayments reduced external debt to 21.7% of GDP at the end of June 2013.
The current account deficit narrowed to $2.3 billion in FY2013 (equal to 1.0% of GDP) from $4.7 billion a year earlier (Figure 3.7.6). This mainly reflected large receipts from the Coalition Support Fund that lowered the services deficit and an increase in remittances, though the latter expanded
3.7.3 Inflation
0
6
12
18
NonfoodCore GeneralFood
JulAprJan2013
OctJulAprJan2012
OctJul2011
%
Source: State Bank of Pakistan. Economic Data. http://www.sbp.org.pk (accessed 17 September 2013).
3.7.4 Banking sector credit and policy rate
0
2
4
6
8
10
0
4
8
12
16
20
Government sectorLoans to private sector business Policy rate
JulJan2013
JulJan2012
JulJan2011
JulJan2010
PRs trillion %
Source: State Bank of Pakistan. Economic Data (accessed 17 September 2013).
3.7.5 Fiscal indicators
14.0 14.0 12.4 12.8 13.2 14.0
19.2 20.2 19.6 21.5 22.1 20.3
–5.1 –6.2 –7.2 –8.8 –8.8 –6.3
–20
10
0
10
20
R E D R E D R E R E D R E D R E D2009 2010 2011 2012 2013 2014
% of GDP
D
30
Budget
TaxDevelopment expenditureand net lendingCurrent
NontaxBankNonbank
External
R = Revenue, E = Expenditure, D = Deficit financing.
Notes: Data refer to consolidated federal and provincial governments.
Net lending includes statistical discrepancy.
Non-bank includes privatization proceeds.
Sources: Ministry of Finance. Pakistan Economic Survey 2012–13; Pakistan Fiscal Operations July–June 2011–12; Federal Budget 2013–14, Budget in Brief; ADB estimates.
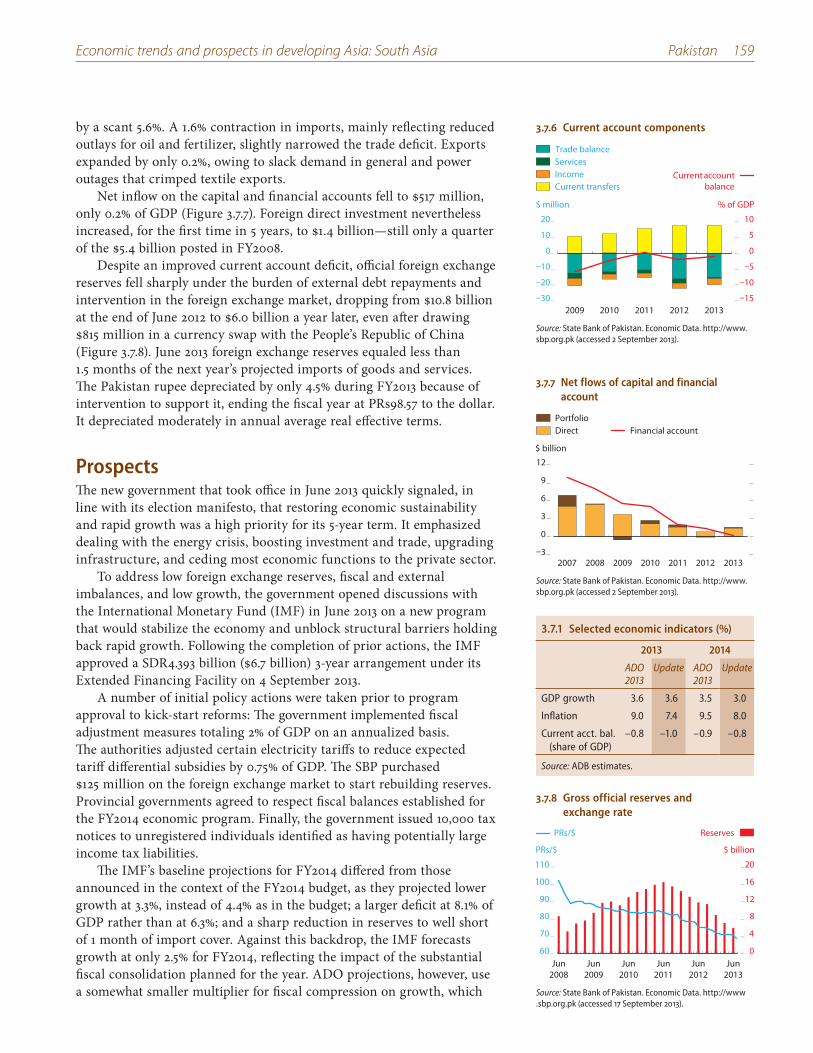
Economic trends and prospects in developing Asia: South Asia Pakistan 159
3.7.1 Selected economic indicators (%)
2013 2014
ADO 2013
Update ADO 2013
Update
GDP growth 3.6 3.6 3.5 3.0
Inflation 9.0 7.4 9.5 8.0
Current acct. bal. (share of GDP)
–0.8 –1.0 –0.9 –0.8
Source: ADB estimates.
by a scant 5.6%. A 1.6% contraction in imports, mainly reflecting reduced outlays for oil and fertilizer, slightly narrowed the trade deficit. Exports expanded by only 0.2%, owing to slack demand in general and power outages that crimped textile exports.
Net inflow on the capital and financial accounts fell to $517 million, only 0.2% of GDP (Figure 3.7.7). Foreign direct investment nevertheless increased, for the first time in 5 years, to $1.4 billion—still only a quarter of the $5.4 billion posted in FY2008.
Despite an improved current account deficit, official foreign exchange reserves fell sharply under the burden of external debt repayments and intervention in the foreign exchange market, dropping from $10.8 billion at the end of June 2012 to $6.0 billion a year later, even after drawing $815 million in a currency swap with the People’s Republic of China (Figure 3.7.8). June 2013 foreign exchange reserves equaled less than 1.5 months of the next year’s projected imports of goods and services. The Pakistan rupee depreciated by only 4.5% during FY2013 because of intervention to support it, ending the fiscal year at PRs98.57 to the dollar. It depreciated moderately in annual average real effective terms.
Prospects The new government that took office in June 2013 quickly signaled, in line with its election manifesto, that restoring economic sustainability and rapid growth was a high priority for its 5-year term. It emphasized dealing with the energy crisis, boosting investment and trade, upgrading infrastructure, and ceding most economic functions to the private sector.
To address low foreign exchange reserves, fiscal and external imbalances, and low growth, the government opened discussions with the International Monetary Fund (IMF) in June 2013 on a new program that would stabilize the economy and unblock structural barriers holding back rapid growth. Following the completion of prior actions, the IMF approved a SDR4.393 billion ($6.7 billion) 3-year arrangement under its Extended Financing Facility on 4 September 2013.
A number of initial policy actions were taken prior to program approval to kick-start reforms: The government implemented fiscal adjustment measures totaling 2% of GDP on an annualized basis. The authorities adjusted certain electricity tariffs to reduce expected tariff differential subsidies by 0.75% of GDP. The SBP purchased $125 million on the foreign exchange market to start rebuilding reserves. Provincial governments agreed to respect fiscal balances established for the FY2014 economic program. Finally, the government issued 10,000 tax notices to unregistered individuals identified as having potentially large income tax liabilities.
The IMF’s baseline projections for FY2014 differed from those announced in the context of the FY2014 budget, as they projected lower growth at 3.3%, instead of 4.4% as in the budget; a larger deficit at 8.1% of GDP rather than at 6.3%; and a sharp reduction in reserves to well short of 1 month of import cover. Against this backdrop, the IMF forecasts growth at only 2.5% for FY2014, reflecting the impact of the substantial fiscal consolidation planned for the year. ADO projections, however, use a somewhat smaller multiplier for fiscal compression on growth, which
3.7.6 Current account components
Trade balanceServicesIncome Current transfers
–15
–10
–5
0
5
10
–30
–20
–10
0
10
20
2009 2010 2011 2012 2013
% of GDP$ million
Current accountbalance
Source: State Bank of Pakistan. Economic Data. http://www.sbp.org.pk (accessed 2 September 2013).
3.7.7 Net flows of capital and financial account
–3
0
3
6
9
12
2007 2008 2009 2010 2011 2012 2013
$ billion
PortfolioDirect Financial account
Source: State Bank of Pakistan. Economic Data. http://www.sbp.org.pk (accessed 2 September 2013).
3.7.8 Gross official reserves and exchange rate
60
70
80
90
100
110
0
4
8
12
16
20
ReservesPRs/$
Jun2013
Jun2012
Jun2011
Jun2010
Jun2009
Jun2008
PRs/$ $ billion
Source: State Bank of Pakistan. Economic Data. http://www .sbp.org.pk (accessed 17 September 2013).
160 Asian Development Outlook 2013 Update
3.7.1 Key structural reform measures in the energy sector
The government issued in July 2013 an energy policy covering all elements of the energy supply chain, along with demand management and pricing policies.Pricing policies. The elimination of tariff subsidies is required for fiscal sustainability and sector efficiency. Electricity tariff subsidies will be eliminated for all but the smallest consumers. The first round of increases was implemented in August 2013, eliminating subsidies for industrial consumers and reducing subsidies for commercial and bulk customers. A second round of increases planned for 1 October 2013 will reduce or eliminate subsidies to a second group of consumers, including domestic consumers using more than 200 kilowatt-hours. Over the second and third years of the program, subsidies will be completely phased out for users of more than 200 kilowatt-hours and reduced for all but the smallest consumers below that threshold. The impact on the most vulnerable will be cushioned through existing income support programs. Arrears. Arrears owed within the sector were cleared in June and July. To prevent the accumulation of new arrears, the government will hire professional teams to conduct technical and financial audits of the system toward designing and implementing a policy roadmap for reform. Monitoring and enforcement measures. The program will address the current inability to collect enough good information on available power supplies to curtail unscheduled load shedding. Distribution companies will be empowered to make commercial decisions on power allocation, including differential outages for neighborhoods with low payment rates. Measures to ensure compliance with usage restrictions will be put in place, and power theft will be made a crime.Demand- and supply-side management. Demand and supply management, combined with
projects GDP up by 3% in FY2014. The settlement of PRs408.1 billion (about $410 billion) in accumulated arrears in the power sector should provide a number of independent power contractors with sufficient working capital to purchase enough fuel to operate at full capacity, somewhat mitigating the need for load shedding in early FY2014. Official reserves under the program are targeted to increase to $9.6 billion in FY2014, which would provide 2.2 months of import cover.
Fiscal policies under the 3-year program focus on eliminating power subsidies, strengthening Pakistan’s notoriously weak revenue base, ending the drain on the budget imposed by loss-making state-owned enterprises, and compressing other non-salary current expenditure. In the first year, FY2014, the deficit is to be reduced to 5.8% of GDP excluding grants. Major deficit reduction measures include increasing the goods and services tax from 16% to 17% for most goods as enacted in the original budget with some rates increasing to 19% in measures implemented at end-September 2013; reining in power subsidies by raising certain tariffs; and levying a new tax on natural gas. Contingency measures have been identified in the event that planned fiscal consolidation falls short.
Further fiscal consolidation over the second and third years of the program is programmed at 1.5 percentage points of GDP in each year, drawing increasingly on the revenue side with steps that include targeting 300,000 potential income tax taxpayers, eliminating most of the plethora of ad hoc exemptions that hold down tax revenues, and reforming the civil service. The government has already taken steps to prevent further ad hoc exemptions without parliamentary approval, and, by FY2015, all ad hoc exemptions granted under statutory regulatory orders will be either eliminated or codified. Over the program period, the fiscal deficit is expected to shrink to 3.6% of GDP.
Quantitative performance criteria under the program set a floor for net international reserves and limits on swap transactions, and they place ceilings on the net domestic assets of the SBP, net government borrowing from the SBP, and the overall budget deficit. The program’s monetary and exchange rate policies aim to rebuild foreign exchange reserves, including by the SBP making direct purchases. It envisions inflation averaging 8.0% in FY2014. Policy parameters do not target inflation, to avoid exacerbating the impact of fiscal consolidation on economic activity, and interest and exchange rates will adjust to economic conditions. Amendments to the SBP Act to enhance the central bank’s independence, particularly giving it operational independence in pursuit of price stability as its main objective, are planned for the end of March 2014.
Lower growth in FY2014, the first year of the program, is expected to combine with some nominal exchange rate depreciation (by 8.7% by 24 September) and expected inflows from remittances and the Coalition Support Fund to hold the current account deficit to 0.8% of GDP in FY2014, slightly larger than the IMF projections reflecting ADO’s smaller compression of growth from fiscal contraction. The program envisages improved capital and financial account net inflows stemming in part from higher program financing from official creditors mobilized by the IMF. Over the program period, gross official reserves are expected to strengthen to $18 billion, or more than 3 months of import cover.
Economic trends and prospects in developing Asia: South Asia Pakistan 161
3.7.1 continued
appropriate incentives to invest in lower-cost energy sources, is key to holding down costs. On the demand side, equipment standards set in the Pakistan Energy Efficiency and Conservation Act will be approved and enforced. Supply-side management will address the increasingly unaffordable share of fuel oil in the energy mix, including by prioritizing the use of coal and gas. The continued rehabilitation of generating companies and upgrading of transmission and distribution facilities, and efficiency testing for all generating companies, will reduce currently large technical losses. Governance and regulatory improvement. The independence, accountability, and administrative capacity of the National Electric Power Regulatory Authority will be strengthened. Tariff determination will be shortened from 8–10 months to 90 days, with a new tariff determined by the end of October 2013 and notified within the next 15 days. The Central Power Purchasing Agency will be separated from the National Transmission and Dispatch Company, taking over the payment and settlement system by the end of December 2013. Reform of state-owned enterprises in the power sector. The institutional capacity of these organizations needs to be strengthened if they eventually are to work as independent and efficient competitive entities. The governance of distribution companies and of the National Transmission and Dispatch Company are to be transferred to new boards of directors and management by the end of December 2013. The Water and Power Development Authority will be strengthened, and tariffs will be adjusted to include the cost for capital investment.Oil and gas sector. Current gas supply meets only half of unconstrained demand, so supply will be augmented through imports of liquefied natural gas and increased exploration and development of domestic sources. Pricing will be adjusted semiannually to encourage new investment.
Structural reform mandated under the program is critical to stabilizing the economy and improving its growth prospects. The unrelenting crisis in the power sector has taken an estimated 2 percentage points off growth annually, deepened the investment drought, caused exports to stagnate, and undermined business confidence. Energy reforms are at the core of the program, consistent with the government energy policy announced in July 2013. The reform package looks, first, to easing liquidity constraints in the power sector; then to managing demand and supply, including imports and the exploration of new fields (supported by appropriate pricing policies); and finally to changing management and governance to put sector entities on a competitive commercial footing that would ensure needed investment (Box 3.7.1).
Beyond the energy sector, reform extends to restructuring 65 public enterprises, aiming to privatize many of them. The completion and implementation of restructuring plans for Pakistan Steel Mills, Pakistan International Airlines, and Pakistan Railways will eliminate the need for sustained support to these enterprises. Plans for the airline include stripping the unviable components into a separate public enterprise, which will be liquidated by the end of June 2014 as 26% of airline shares are to be privatized by the same date. New restructuring plans for the steel mills are expected by the end of September 2013 and for the railway by the end of March 2014.
New legislation is needed to remedy gaps and inconsistencies in the regulatory and supervisory frameworks governing the financial sector, including a draft securities bill to strengthen the supervisory and enforcement powers of the regulator and amendments to the Security and Exchange Commission of Pakistan to act as an integrated regulator. Ongoing consultations on a new bankruptcy law aim to improve the legal framework for rehabilitating viable enterprises and liquidating those determined not to be viable. A draft law is expected by the end of September 2014, for enactment by the end of December 2015. The Ministry of Finance and the SBP plan to introduce deposit insurance to strengthen the long-term stability of the banking system. It would be managed by a deposit protection fund established as a subsidiary of the SBP.
There are risks to the program. Most of the required reforms have political and governance dimensions that have posed formidable barriers in the past. These barriers stifle reform that would replace Pakistan’s woefully inadequate revenue base with one capable of meeting the country’s needs; limit the implementation of needed reform to the energy sector; and hinder the appropriate restructuring, corporatization, and privatization of state-owned enterprises. If these barriers remain, Pakistan will not have the active and vibrant private sector that it needs for growth and job generation. Pakistan is at a turning point where political will determines whether or not the future holds further deterioration or enhanced growth prospects.
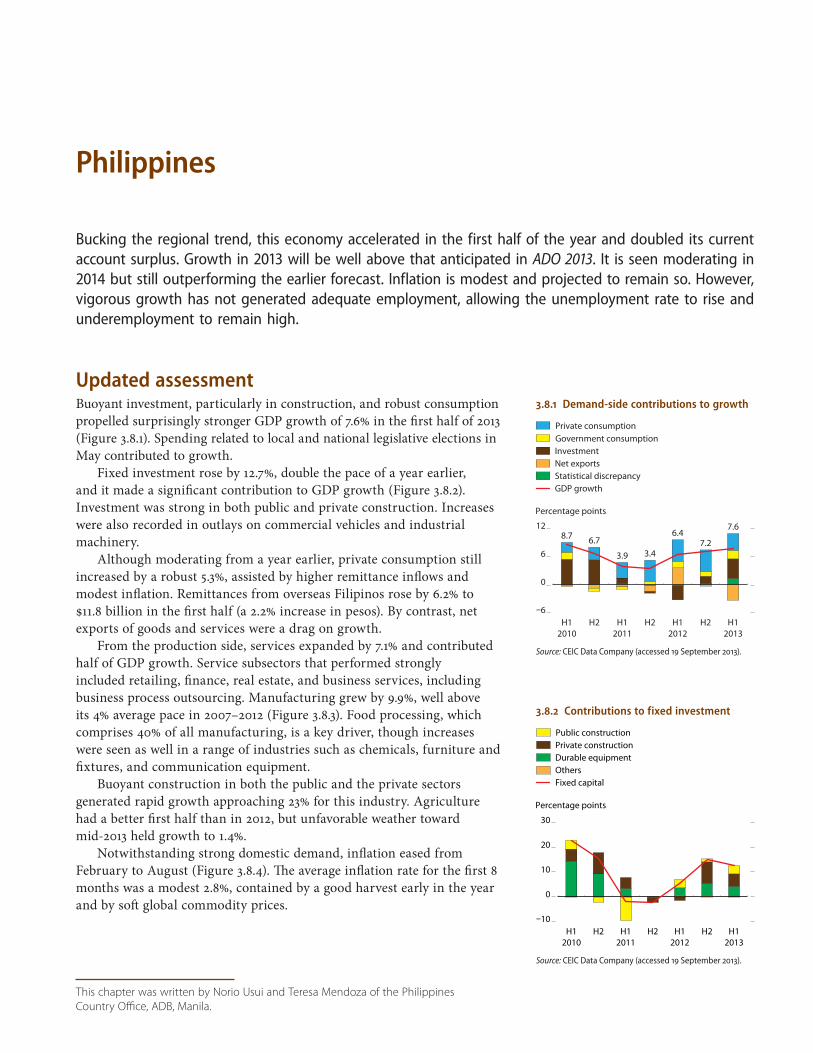
This chapter was written by Norio Usui and Teresa Mendoza of the Philippines
Country Office, ADB, Manila.
3.8.1 Demand-side contributions to growth
8.7 6.7
3.9 3.4
6.47.2
7.6
–6
0
6
12
H12010
H2 H12011
H2 H12012
H2 H12013
Percentage points
Government consumptionInvestmentNet exportsStatistical discrepancyGDP growth
Private consumption
Source: CEIC Data Company (accessed 19 September 2013).
3.8.2 Contributions to fixed investment
–10
0
10
20
30
H12010
H2 H12011
H2 H12012
H2 H12013
Percentage points
Public constructionPrivate constructionDurable equipmentOthersFixed capital
Source: CEIC Data Company (accessed 19 September 2013).
Philippines
Bucking the regional trend, this economy accelerated in the first half of the year and doubled its current account surplus. Growth in 2013 will be well above that anticipated in ADO 2013. It is seen moderating in 2014 but still outperforming the earlier forecast. Inflation is modest and projected to remain so. However, vigorous growth has not generated adequate employment, allowing the unemployment rate to rise and underemployment to remain high.
Updated assessmentBuoyant investment, particularly in construction, and robust consumption propelled surprisingly stronger GDP growth of 7.6% in the first half of 2013 (Figure 3.8.1). Spending related to local and national legislative elections in May contributed to growth.
Fixed investment rose by 12.7%, double the pace of a year earlier, and it made a significant contribution to GDP growth (Figure 3.8.2). Investment was strong in both public and private construction. Increases were also recorded in outlays on commercial vehicles and industrial machinery.
Although moderating from a year earlier, private consumption still increased by a robust 5.3%, assisted by higher remittance inflows and modest inflation. Remittances from overseas Filipinos rose by 6.2% to $11.8 billion in the first half (a 2.2% increase in pesos). By contrast, net exports of goods and services were a drag on growth.
From the production side, services expanded by 7.1% and contributed half of GDP growth. Service subsectors that performed strongly included retailing, finance, real estate, and business services, including business process outsourcing. Manufacturing grew by 9.9%, well above its 4% average pace in 2007–2012 (Figure 3.8.3). Food processing, which comprises 40% of all manufacturing, is a key driver, though increases were seen as well in a range of industries such as chemicals, furniture and fixtures, and communication equipment.
Buoyant construction in both the public and the private sectors generated rapid growth approaching 23% for this industry. Agriculture had a better first half than in 2012, but unfavorable weather toward mid-2013 held growth to 1.4%.
Notwithstanding strong domestic demand, inflation eased from February to August (Figure 3.8.4). The average inflation rate for the first 8 months was a modest 2.8%, contained by a good harvest early in the year and by soft global commodity prices.
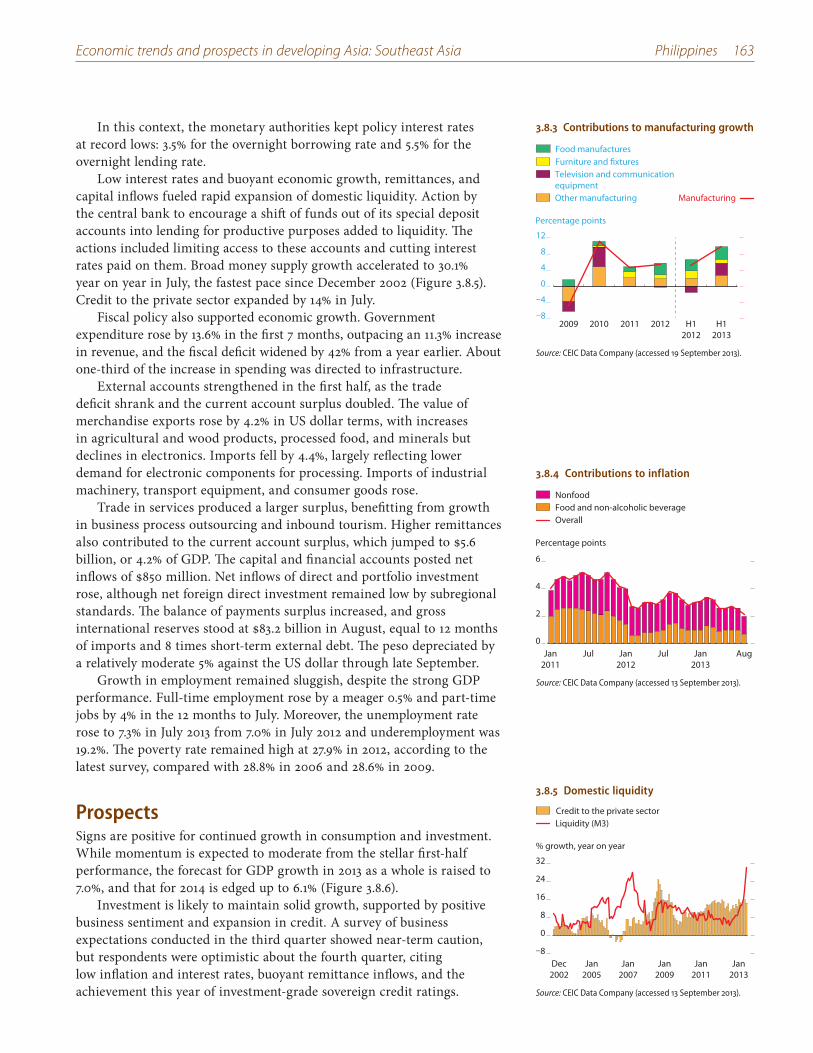
Economic trends and prospects in developing Asia: Southeast Asia Philippines 163
In this context, the monetary authorities kept policy interest rates at record lows: 3.5% for the overnight borrowing rate and 5.5% for the overnight lending rate.
Low interest rates and buoyant economic growth, remittances, and capital inflows fueled rapid expansion of domestic liquidity. Action by the central bank to encourage a shift of funds out of its special deposit accounts into lending for productive purposes added to liquidity. The actions included limiting access to these accounts and cutting interest rates paid on them. Broad money supply growth accelerated to 30.1% year on year in July, the fastest pace since December 2002 (Figure 3.8.5). Credit to the private sector expanded by 14% in July.
Fiscal policy also supported economic growth. Government expenditure rose by 13.6% in the first 7 months, outpacing an 11.3% increase in revenue, and the fiscal deficit widened by 42% from a year earlier. About one-third of the increase in spending was directed to infrastructure.
External accounts strengthened in the first half, as the trade deficit shrank and the current account surplus doubled. The value of merchandise exports rose by 4.2% in US dollar terms, with increases in agricultural and wood products, processed food, and minerals but declines in electronics. Imports fell by 4.4%, largely reflecting lower demand for electronic components for processing. Imports of industrial machinery, transport equipment, and consumer goods rose.
Trade in services produced a larger surplus, benefitting from growth in business process outsourcing and inbound tourism. Higher remittances also contributed to the current account surplus, which jumped to $5.6 billion, or 4.2% of GDP. The capital and financial accounts posted net inflows of $850 million. Net inflows of direct and portfolio investment rose, although net foreign direct investment remained low by subregional standards. The balance of payments surplus increased, and gross international reserves stood at $83.2 billion in August, equal to 12 months of imports and 8 times short-term external debt. The peso depreciated by a relatively moderate 5% against the US dollar through late September.
Growth in employment remained sluggish, despite the strong GDP performance. Full-time employment rose by a meager 0.5% and part-time jobs by 4% in the 12 months to July. Moreover, the unemployment rate rose to 7.3% in July 2013 from 7.0% in July 2012 and underemployment was 19.2%. The poverty rate remained high at 27.9% in 2012, according to the latest survey, compared with 28.8% in 2006 and 28.6% in 2009.
ProspectsSigns are positive for continued growth in consumption and investment. While momentum is expected to moderate from the stellar first-half performance, the forecast for GDP growth in 2013 as a whole is raised to 7.0%, and that for 2014 is edged up to 6.1% (Figure 3.8.6).
Investment is likely to maintain solid growth, supported by positive business sentiment and expansion in credit. A survey of business expectations conducted in the third quarter showed near-term caution, but respondents were optimistic about the fourth quarter, citing low inflation and interest rates, buoyant remittance inflows, and the achievement this year of investment‐grade sovereign credit ratings.
3.8.3 Contributions to manufacturing growth
Furniture and fixturesTelevision and communication equipmentOther manufacturing
Food manufactures
Manufacturing
–8
–4
0
4
8
12
2009 2010 2011 2012 H12012
H12013
Percentage points
Source: CEIC Data Company (accessed 19 September 2013).
3.8.4 Contributions to inflation
0
2
4
6
NonfoodFood and non-alcoholic beverageOverall
AugJan2013
JulJan2012
JulJan2011
Percentage points
Source: CEIC Data Company (accessed 13 September 2013).
3.8.5 Domestic liquidity
–8
0
8
16
24
32
Credit to the private sectorLiquidity (M3)
Jan2013
Jan2011
Jan2009
Jan2007
Jan2005
Dec2002
% growth, year on year
Source: CEIC Data Company (accessed 13 September 2013).
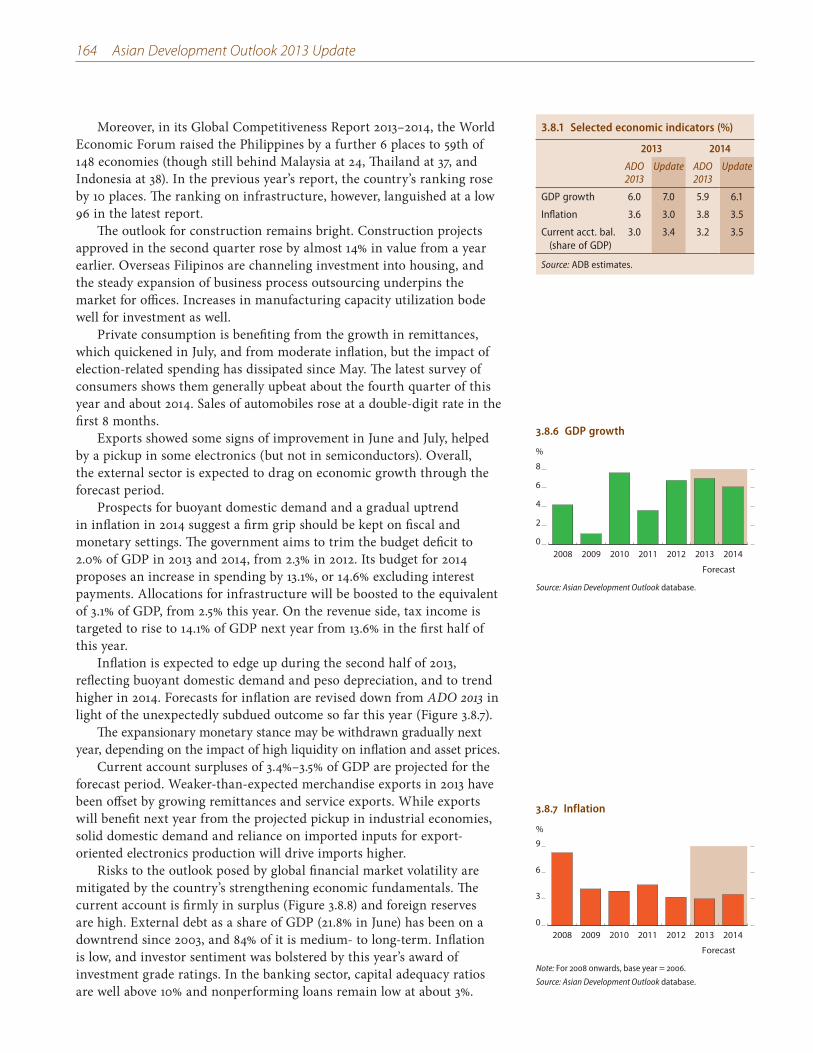
164 Asian Development Outlook 2013 Update
Moreover, in its Global Competitiveness Report 2013–2014, the World Economic Forum raised the Philippines by a further 6 places to 59th of 148 economies (though still behind Malaysia at 24, Thailand at 37, and Indonesia at 38). In the previous year’s report, the country’s ranking rose by 10 places. The ranking on infrastructure, however, languished at a low 96 in the latest report.
The outlook for construction remains bright. Construction projects approved in the second quarter rose by almost 14% in value from a year earlier. Overseas Filipinos are channeling investment into housing, and the steady expansion of business process outsourcing underpins the market for offices. Increases in manufacturing capacity utilization bode well for investment as well.
Private consumption is benefiting from the growth in remittances, which quickened in July, and from moderate inflation, but the impact of election-related spending has dissipated since May. The latest survey of consumers shows them generally upbeat about the fourth quarter of this year and about 2014. Sales of automobiles rose at a double-digit rate in the first 8 months.
Exports showed some signs of improvement in June and July, helped by a pickup in some electronics (but not in semiconductors). Overall, the external sector is expected to drag on economic growth through the forecast period.
Prospects for buoyant domestic demand and a gradual uptrend in inflation in 2014 suggest a firm grip should be kept on fiscal and monetary settings. The government aims to trim the budget deficit to 2.0% of GDP in 2013 and 2014, from 2.3% in 2012. Its budget for 2014 proposes an increase in spending by 13.1%, or 14.6% excluding interest payments. Allocations for infrastructure will be boosted to the equivalent of 3.1% of GDP, from 2.5% this year. On the revenue side, tax income is targeted to rise to 14.1% of GDP next year from 13.6% in the first half of this year.
Inflation is expected to edge up during the second half of 2013, reflecting buoyant domestic demand and peso depreciation, and to trend higher in 2014. Forecasts for inflation are revised down from ADO 2013 in light of the unexpectedly subdued outcome so far this year (Figure 3.8.7).
The expansionary monetary stance may be withdrawn gradually next year, depending on the impact of high liquidity on inflation and asset prices.
Current account surpluses of 3.4%–3.5% of GDP are projected for the forecast period. Weaker-than-expected merchandise exports in 2013 have been offset by growing remittances and service exports. While exports will benefit next year from the projected pickup in industrial economies, solid domestic demand and reliance on imported inputs for export-oriented electronics production will drive imports higher.
Risks to the outlook posed by global financial market volatility are mitigated by the country’s strengthening economic fundamentals. The current account is firmly in surplus (Figure 3.8.8) and foreign reserves are high. External debt as a share of GDP (21.8% in June) has been on a downtrend since 2003, and 84% of it is medium- to long-term. Inflation is low, and investor sentiment was bolstered by this year’s award of investment grade ratings. In the banking sector, capital adequacy ratios are well above 10% and nonperforming loans remain low at about 3%.
3.8.6 GDP growth
0
2
4
6
8
2014201320122011201020092008
%
Forecast
Source: Asian Development Outlook database.
3.8.1 Selected economic indicators (%)
2013 2014
ADO 2013
Update ADO 2013
Update
GDP growth 6.0 7.0 5.9 6.1
Inflation 3.6 3.0 3.8 3.5
Current acct. bal. (share of GDP)
3.0 3.4 3.2 3.5
Source: ADB estimates.
3.8.7 Inflation
0
3
6
9
2014201320122011201020092008
%
Forecast
Note: For 2008 onwards, base year = 2006.
Source: Asian Development Outlook database.
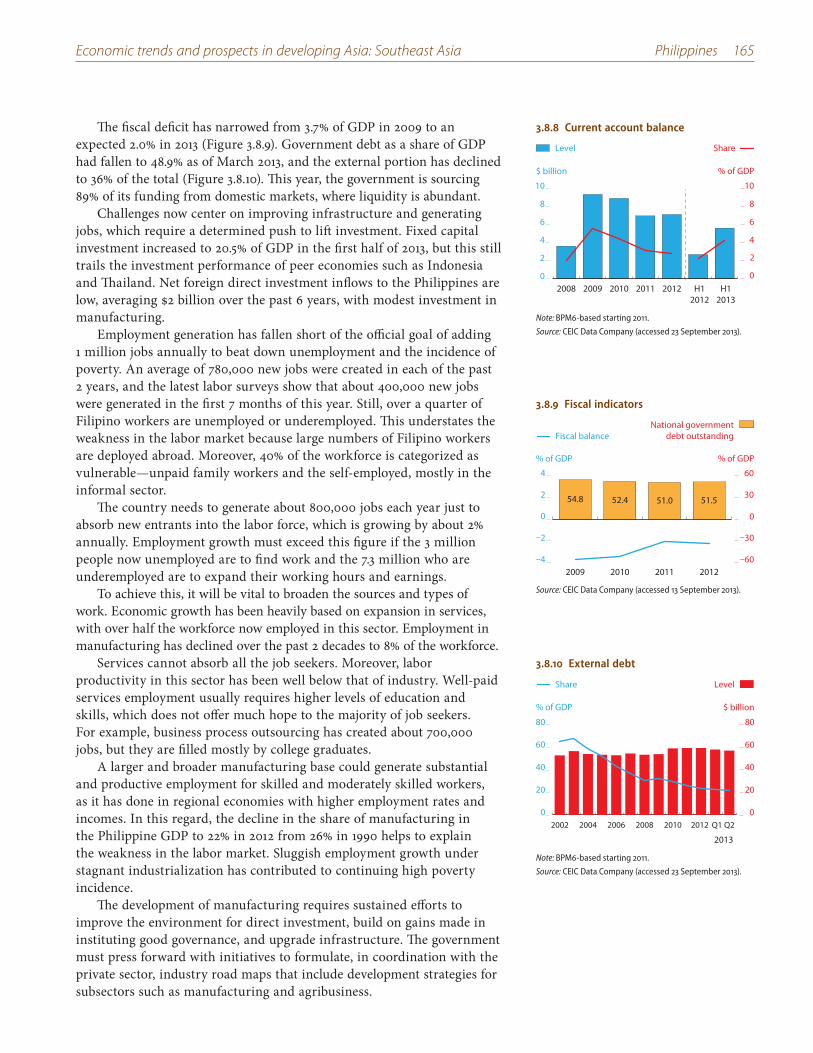
Economic trends and prospects in developing Asia: Southeast Asia Philippines 165
The fiscal deficit has narrowed from 3.7% of GDP in 2009 to an expected 2.0% in 2013 (Figure 3.8.9). Government debt as a share of GDP had fallen to 48.9% as of March 2013, and the external portion has declined to 36% of the total (Figure 3.8.10). This year, the government is sourcing 89% of its funding from domestic markets, where liquidity is abundant.
Challenges now center on improving infrastructure and generating jobs, which require a determined push to lift investment. Fixed capital investment increased to 20.5% of GDP in the first half of 2013, but this still trails the investment performance of peer economies such as Indonesia and Thailand. Net foreign direct investment inflows to the Philippines are low, averaging $2 billion over the past 6 years, with modest investment in manufacturing.
Employment generation has fallen short of the official goal of adding 1 million jobs annually to beat down unemployment and the incidence of poverty. An average of 780,000 new jobs were created in each of the past 2 years, and the latest labor surveys show that about 400,000 new jobs were generated in the first 7 months of this year. Still, over a quarter of Filipino workers are unemployed or underemployed. This understates the weakness in the labor market because large numbers of Filipino workers are deployed abroad. Moreover, 40% of the workforce is categorized as vulnerable—unpaid family workers and the self-employed, mostly in the informal sector.
The country needs to generate about 800,000 jobs each year just to absorb new entrants into the labor force, which is growing by about 2% annually. Employment growth must exceed this figure if the 3 million people now unemployed are to find work and the 7.3 million who are underemployed are to expand their working hours and earnings.
To achieve this, it will be vital to broaden the sources and types of work. Economic growth has been heavily based on expansion in services, with over half the workforce now employed in this sector. Employment in manufacturing has declined over the past 2 decades to 8% of the workforce.
Services cannot absorb all the job seekers. Moreover, labor productivity in this sector has been well below that of industry. Well-paid services employment usually requires higher levels of education and skills, which does not offer much hope to the majority of job seekers. For example, business process outsourcing has created about 700,000 jobs, but they are filled mostly by college graduates.
A larger and broader manufacturing base could generate substantial and productive employment for skilled and moderately skilled workers, as it has done in regional economies with higher employment rates and incomes. In this regard, the decline in the share of manufacturing in the Philippine GDP to 22% in 2012 from 26% in 1990 helps to explain the weakness in the labor market. Sluggish employment growth under stagnant industrialization has contributed to continuing high poverty incidence.
The development of manufacturing requires sustained efforts to improve the environment for direct investment, build on gains made in instituting good governance, and upgrade infrastructure. The government must press forward with initiatives to formulate, in coordination with the private sector, industry road maps that include development strategies for subsectors such as manufacturing and agribusiness.
3.8.9 Fiscal indicators
–4
–2
0
2
4
–60
–30
0
30
60
National governmentdebt outstandingFiscal balance
2012201120102009
% of GDP % of GDP
54.8 51.551.052.4
Source: CEIC Data Company (accessed 13 September 2013).
3.8.10 External debt
0
20
40
60
80
0
20
40
60
80
LevelShare
Q2 Q1201220102008200620042002
% of GDP $ billion
2013
Note: BPM6-based starting 2011.
Source: CEIC Data Company (accessed 23 September 2013).
3.8.8 Current account balance
0
2
4
6
8
10
0
2
4
6
8
10
H12013
H12012
20122011201020092008
$ billion % of GDP
ShareLevel
Note: BPM6-based starting 2011.
Source: CEIC Data Company (accessed 23 September 2013).
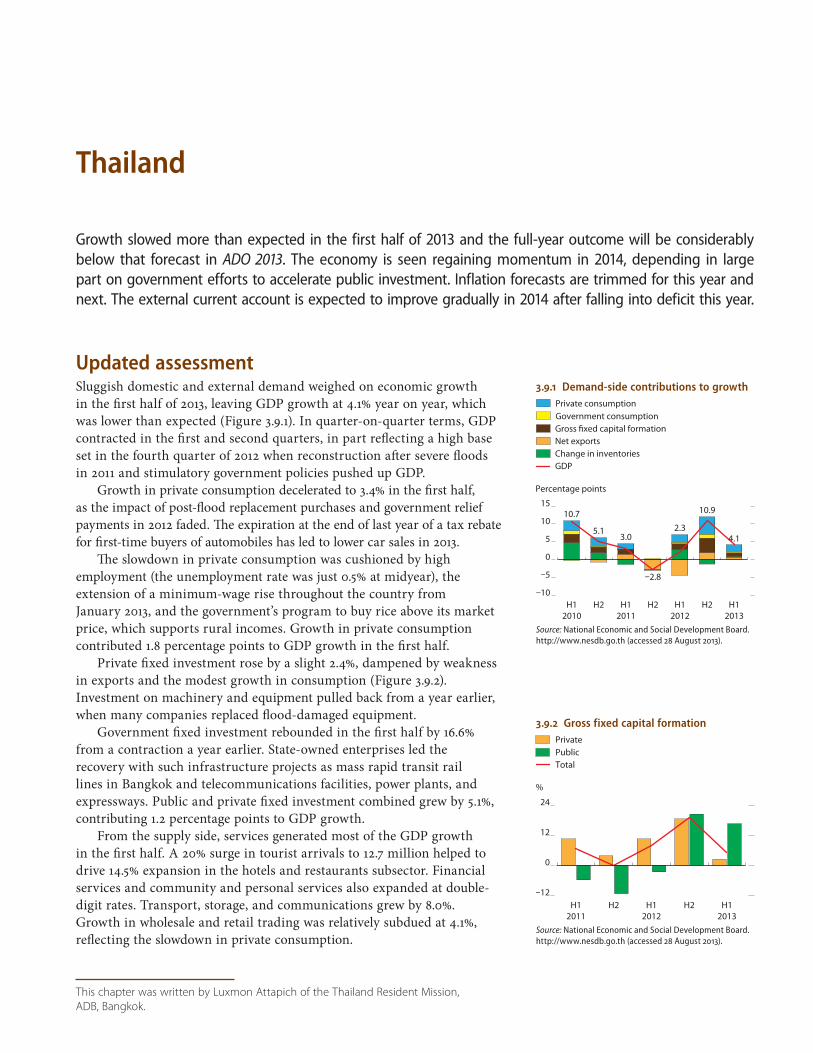
This chapter was written by Luxmon Attapich of the Thailand Resident Mission,
ADB, Bangkok.
3.9.1 Demand-side contributions to growth
Percentage points
Government consumptionGross fixed capital formationNet exportsChange in inventoriesGDP
Private consumption
10.7
5.13.0
–2.8
2.3
10.9
4.1
–10
–5
0
5
10
15
H12010
H2 H12011
H2 H12012
H2 H12013
Source: National Economic and Social Development Board. http://www.nesdb.go.th (accessed 28 August 2013).
Thailand
Growth slowed more than expected in the first half of 2013 and the full-year outcome will be considerably below that forecast in ADO 2013. The economy is seen regaining momentum in 2014, depending in large part on government efforts to accelerate public investment. Inflation forecasts are trimmed for this year and next. The external current account is expected to improve gradually in 2014 after falling into deficit this year.
Updated assessmentSluggish domestic and external demand weighed on economic growth in the first half of 2013, leaving GDP growth at 4.1% year on year, which was lower than expected (Figure 3.9.1). In quarter-on-quarter terms, GDP contracted in the first and second quarters, in part reflecting a high base set in the fourth quarter of 2012 when reconstruction after severe floods in 2011 and stimulatory government policies pushed up GDP.
Growth in private consumption decelerated to 3.4% in the first half, as the impact of post-flood replacement purchases and government relief payments in 2012 faded. The expiration at the end of last year of a tax rebate for first-time buyers of automobiles has led to lower car sales in 2013.
The slowdown in private consumption was cushioned by high employment (the unemployment rate was just 0.5% at midyear), the extension of a minimum-wage rise throughout the country from January 2013, and the government’s program to buy rice above its market price, which supports rural incomes. Growth in private consumption contributed 1.8 percentage points to GDP growth in the first half.
Private fixed investment rose by a slight 2.4%, dampened by weakness in exports and the modest growth in consumption (Figure 3.9.2). Investment on machinery and equipment pulled back from a year earlier, when many companies replaced flood-damaged equipment.
Government fixed investment rebounded in the first half by 16.6% from a contraction a year earlier. State-owned enterprises led the recovery with such infrastructure projects as mass rapid transit rail lines in Bangkok and telecommunications facilities, power plants, and expressways. Public and private fixed investment combined grew by 5.1%, contributing 1.2 percentage points to GDP growth.
From the supply side, services generated most of the GDP growth in the first half. A 20% surge in tourist arrivals to 12.7 million helped to drive 14.5% expansion in the hotels and restaurants subsector. Financial services and community and personal services also expanded at double-digit rates. Transport, storage, and communications grew by 8.0%. Growth in wholesale and retail trading was relatively subdued at 4.1%, reflecting the slowdown in private consumption.
3.9.2 Gross fixed capital formation
–12
0
12
24
PublicPrivate
Total
H12013
H2H12012
H2H12011
%
Source: National Economic and Social Development Board. http://www.nesdb.go.th (accessed 28 August 2013).
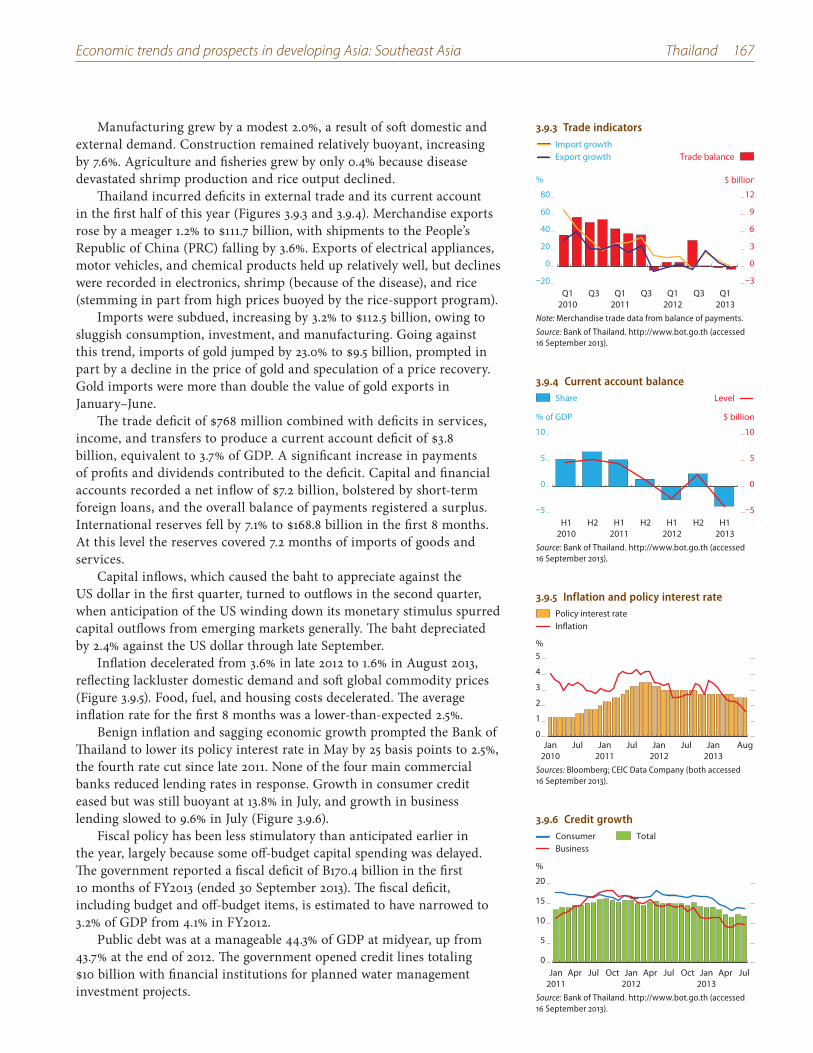
Economic trends and prospects in developing Asia: Southeast Asia Thailand 167
Manufacturing grew by a modest 2.0%, a result of soft domestic and external demand. Construction remained relatively buoyant, increasing by 7.6%. Agriculture and fisheries grew by only 0.4% because disease devastated shrimp production and rice output declined.
Thailand incurred deficits in external trade and its current account in the first half of this year (Figures 3.9.3 and 3.9.4). Merchandise exports rose by a meager 1.2% to $111.7 billion, with shipments to the People’s Republic of China (PRC) falling by 3.6%. Exports of electrical appliances, motor vehicles, and chemical products held up relatively well, but declines were recorded in electronics, shrimp (because of the disease), and rice (stemming in part from high prices buoyed by the rice-support program).
Imports were subdued, increasing by 3.2% to $112.5 billion, owing to sluggish consumption, investment, and manufacturing. Going against this trend, imports of gold jumped by 23.0% to $9.5 billion, prompted in part by a decline in the price of gold and speculation of a price recovery. Gold imports were more than double the value of gold exports in January–June.
The trade deficit of $768 million combined with deficits in services, income, and transfers to produce a current account deficit of $3.8 billion, equivalent to 3.7% of GDP. A significant increase in payments of profits and dividends contributed to the deficit. Capital and financial accounts recorded a net inflow of $7.2 billion, bolstered by short-term foreign loans, and the overall balance of payments registered a surplus. International reserves fell by 7.1% to $168.8 billion in the first 8 months. At this level the reserves covered 7.2 months of imports of goods and services.
Capital inflows, which caused the baht to appreciate against the US dollar in the first quarter, turned to outflows in the second quarter, when anticipation of the US winding down its monetary stimulus spurred capital outflows from emerging markets generally. The baht depreciated by 2.4% against the US dollar through late September.
Inflation decelerated from 3.6% in late 2012 to 1.6% in August 2013, reflecting lackluster domestic demand and soft global commodity prices (Figure 3.9.5). Food, fuel, and housing costs decelerated. The average inflation rate for the first 8 months was a lower-than-expected 2.5%.
Benign inflation and sagging economic growth prompted the Bank of Thailand to lower its policy interest rate in May by 25 basis points to 2.5%, the fourth rate cut since late 2011. None of the four main commercial banks reduced lending rates in response. Growth in consumer credit eased but was still buoyant at 13.8% in July, and growth in business lending slowed to 9.6% in July (Figure 3.9.6).
Fiscal policy has been less stimulatory than anticipated earlier in the year, largely because some off-budget capital spending was delayed. The government reported a fiscal deficit of B170.4 billion in the first 10 months of FY2013 (ended 30 September 2013). The fiscal deficit, including budget and off-budget items, is estimated to have narrowed to 3.2% of GDP from 4.1% in FY2012.
Public debt was at a manageable 44.3% of GDP at midyear, up from 43.7% at the end of 2012. The government opened credit lines totaling $10 billion with financial institutions for planned water management investment projects.
3.9.3 Trade indicators
–20
0
20
40
60
80
–3
0
3
6
9
12
Trade balanceImport growthExport growth
Q12013
Q3 Q12012
Q3 Q12011
Q3 Q12010
% $ billion
Note: Merchandise trade data from balance of payments.
Source: Bank of Thailand. http://www.bot.go.th (accessed 16 September 2013).
3.9.4 Current account balance
–5
0
5
10
–5
0
5
10
Share Level
H12013
H2H12012
H2H12011
H2H12010
$ billion% of GDP
Source: Bank of Thailand. http://www.bot.go.th (accessed 16 September 2013).
3.9.5 Inflation and policy interest rate
0
1
2
3
4
5
Policy interest rateInflation
AugJan2013
JulJan2012
JulJan2011
JulJan2010
%
Sources: Bloomberg; CEIC Data Company (both accessed 16 September 2013).
3.9.6 Credit growth
0
5
10
15
20
ConsumerBusiness
Total
JulAprJan2013
OctJulAprJan2012
OctJulAprJan2011
%
Source: Bank of Thailand. http://www.bot.go.th (accessed 16 September 2013).
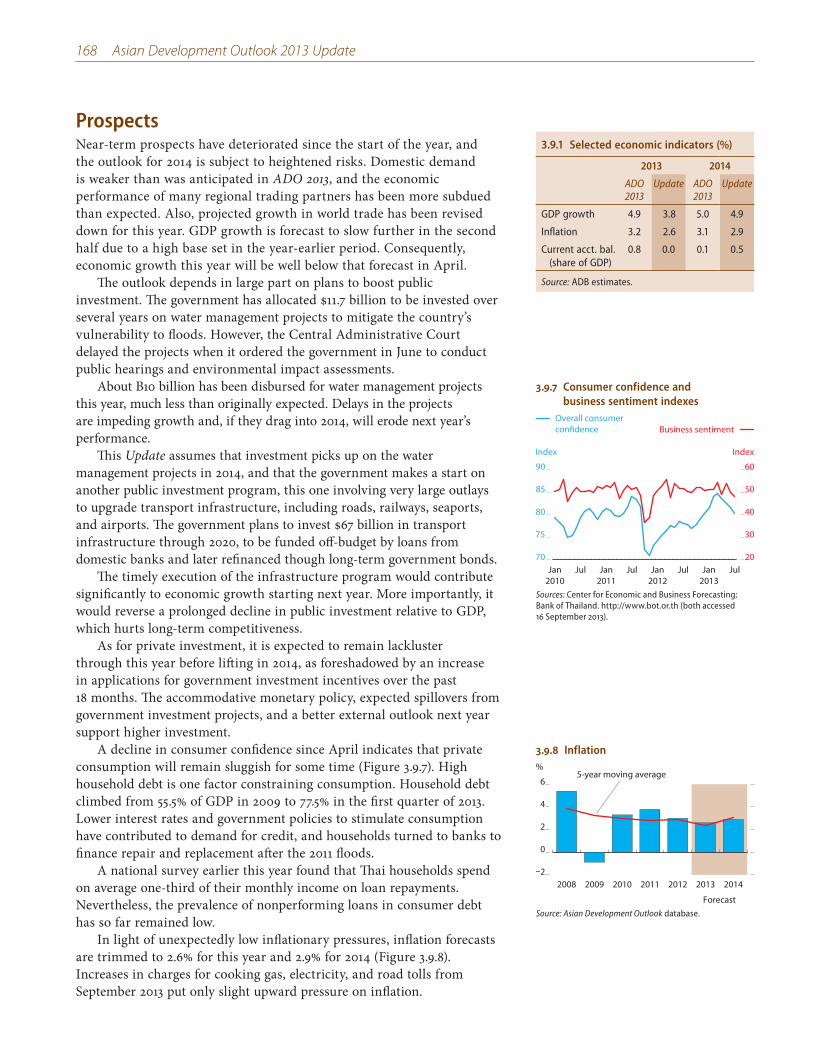
168 Asian Development Outlook 2013 Update
ProspectsNear-term prospects have deteriorated since the start of the year, and the outlook for 2014 is subject to heightened risks. Domestic demand is weaker than was anticipated in ADO 2013, and the economic performance of many regional trading partners has been more subdued than expected. Also, projected growth in world trade has been revised down for this year. GDP growth is forecast to slow further in the second half due to a high base set in the year-earlier period. Consequently, economic growth this year will be well below that forecast in April.
The outlook depends in large part on plans to boost public investment. The government has allocated $11.7 billion to be invested over several years on water management projects to mitigate the country’s vulnerability to floods. However, the Central Administrative Court delayed the projects when it ordered the government in June to conduct public hearings and environmental impact assessments.
About B10 billion has been disbursed for water management projects this year, much less than originally expected. Delays in the projects are impeding growth and, if they drag into 2014, will erode next year’s performance.
This Update assumes that investment picks up on the water management projects in 2014, and that the government makes a start on another public investment program, this one involving very large outlays to upgrade transport infrastructure, including roads, railways, seaports, and airports. The government plans to invest $67 billion in transport infrastructure through 2020, to be funded off-budget by loans from domestic banks and later refinanced though long-term government bonds.
The timely execution of the infrastructure program would contribute significantly to economic growth starting next year. More importantly, it would reverse a prolonged decline in public investment relative to GDP, which hurts long-term competitiveness.
As for private investment, it is expected to remain lackluster through this year before lifting in 2014, as foreshadowed by an increase in applications for government investment incentives over the past 18 months. The accommodative monetary policy, expected spillovers from government investment projects, and a better external outlook next year support higher investment.
A decline in consumer confidence since April indicates that private consumption will remain sluggish for some time (Figure 3.9.7). High household debt is one factor constraining consumption. Household debt climbed from 55.5% of GDP in 2009 to 77.5% in the first quarter of 2013. Lower interest rates and government policies to stimulate consumption have contributed to demand for credit, and households turned to banks to finance repair and replacement after the 2011 floods.
A national survey earlier this year found that Thai households spend on average one-third of their monthly income on loan repayments. Nevertheless, the prevalence of nonperforming loans in consumer debt has so far remained low.
In light of unexpectedly low inflationary pressures, inflation forecasts are trimmed to 2.6% for this year and 2.9% for 2014 (Figure 3.9.8). Increases in charges for cooking gas, electricity, and road tolls from September 2013 put only slight upward pressure on inflation.
3.9.1 Selected economic indicators (%)
2013 2014
ADO 2013
Update ADO 2013
Update
GDP growth 4.9 3.8 5.0 4.9
Inflation 3.2 2.6 3.1 2.9
Current acct. bal. (share of GDP)
0.8 0.0 0.1 0.5
Source: ADB estimates.
3.9.7 Consumer confidence and business sentiment indexes
70
75
80
85
90
20
30
40
50
60
Business sentimentOverall consumerconfidence
JulJan2013
JulJan2012
JulJan2011
JulJan2010
Index Index
Sources: Center for Economic and Business Forecasting; Bank of Thailand. http://www.bot.or.th (both accessed 16 September 2013).
3.9.8 Inflation
–2
0
2
4
6
2014201320122011201020092008
5-year moving average
Forecast
%
Source: Asian Development Outlook database.
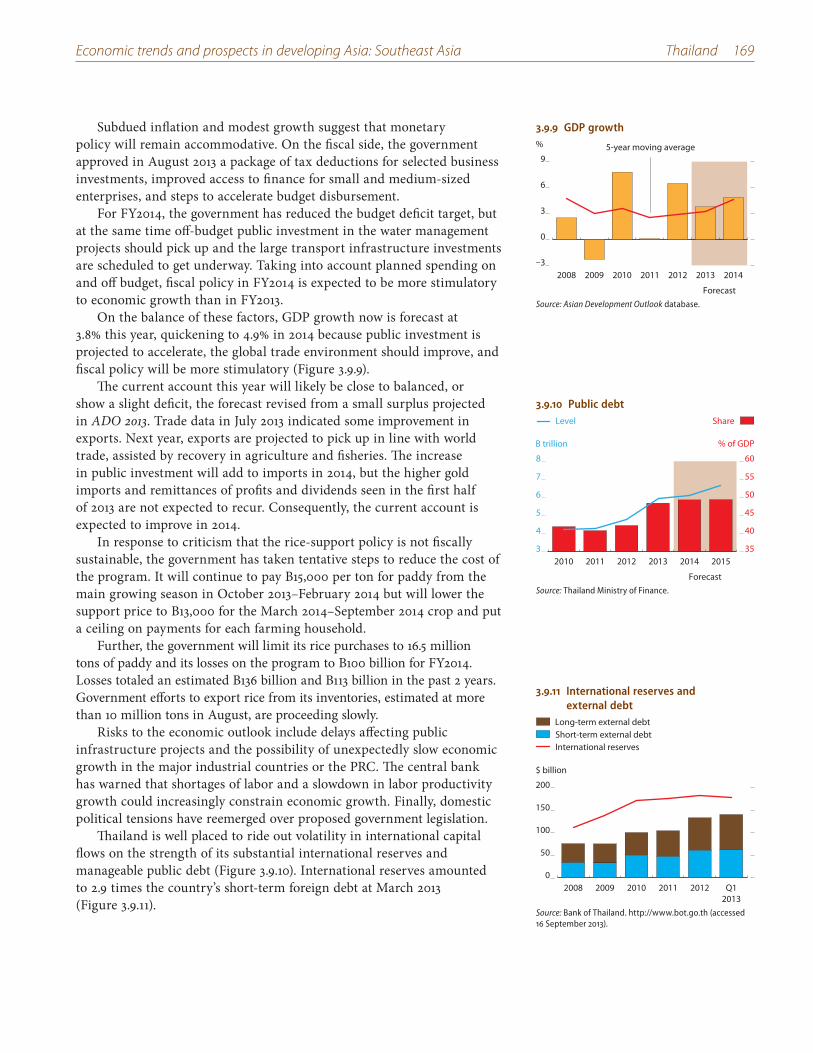
Economic trends and prospects in developing Asia: Southeast Asia Thailand 169
Subdued inflation and modest growth suggest that monetary policy will remain accommodative. On the fiscal side, the government approved in August 2013 a package of tax deductions for selected business investments, improved access to finance for small and medium-sized enterprises, and steps to accelerate budget disbursement.
For FY2014, the government has reduced the budget deficit target, but at the same time off-budget public investment in the water management projects should pick up and the large transport infrastructure investments are scheduled to get underway. Taking into account planned spending on and off budget, fiscal policy in FY2014 is expected to be more stimulatory to economic growth than in FY2013.
On the balance of these factors, GDP growth now is forecast at 3.8% this year, quickening to 4.9% in 2014 because public investment is projected to accelerate, the global trade environment should improve, and fiscal policy will be more stimulatory (Figure 3.9.9).
The current account this year will likely be close to balanced, or show a slight deficit, the forecast revised from a small surplus projected in ADO 2013. Trade data in July 2013 indicated some improvement in exports. Next year, exports are projected to pick up in line with world trade, assisted by recovery in agriculture and fisheries. The increase in public investment will add to imports in 2014, but the higher gold imports and remittances of profits and dividends seen in the first half of 2013 are not expected to recur. Consequently, the current account is expected to improve in 2014.
In response to criticism that the rice-support policy is not fiscally sustainable, the government has taken tentative steps to reduce the cost of the program. It will continue to pay B15,000 per ton for paddy from the main growing season in October 2013–February 2014 but will lower the support price to B13,000 for the March 2014–September 2014 crop and put a ceiling on payments for each farming household.
Further, the government will limit its rice purchases to 16.5 million tons of paddy and its losses on the program to B100 billion for FY2014. Losses totaled an estimated B136 billion and B113 billion in the past 2 years. Government efforts to export rice from its inventories, estimated at more than 10 million tons in August, are proceeding slowly.
Risks to the economic outlook include delays affecting public infrastructure projects and the possibility of unexpectedly slow economic growth in the major industrial countries or the PRC. The central bank has warned that shortages of labor and a slowdown in labor productivity growth could increasingly constrain economic growth. Finally, domestic political tensions have reemerged over proposed government legislation.
Thailand is well placed to ride out volatility in international capital flows on the strength of its substantial international reserves and manageable public debt (Figure 3.9.10). International reserves amounted to 2.9 times the country’s short-term foreign debt at March 2013 (Figure 3.9.11).
3.9.9 GDP growth
–3
0
3
6
9
2014201320122011201020092008
5-year moving average%
ForecastSource: Asian Development Outlook database.
3.9.10 Public debt
3
4
5
6
7
8
35
40
45
50
55
60
ShareLevel
201520142013201220112010
B trillion % of GDP
ForecastSource: Thailand Ministry of Finance.
3.9.11 International reserves and external debt
0
50
100
150
200
Long-term external debtShort-term external debtInternational reserves
Q12013
20122011201020092008
$ billion
Source: Bank of Thailand. http://www.bot.go.th (accessed 16 September 2013).
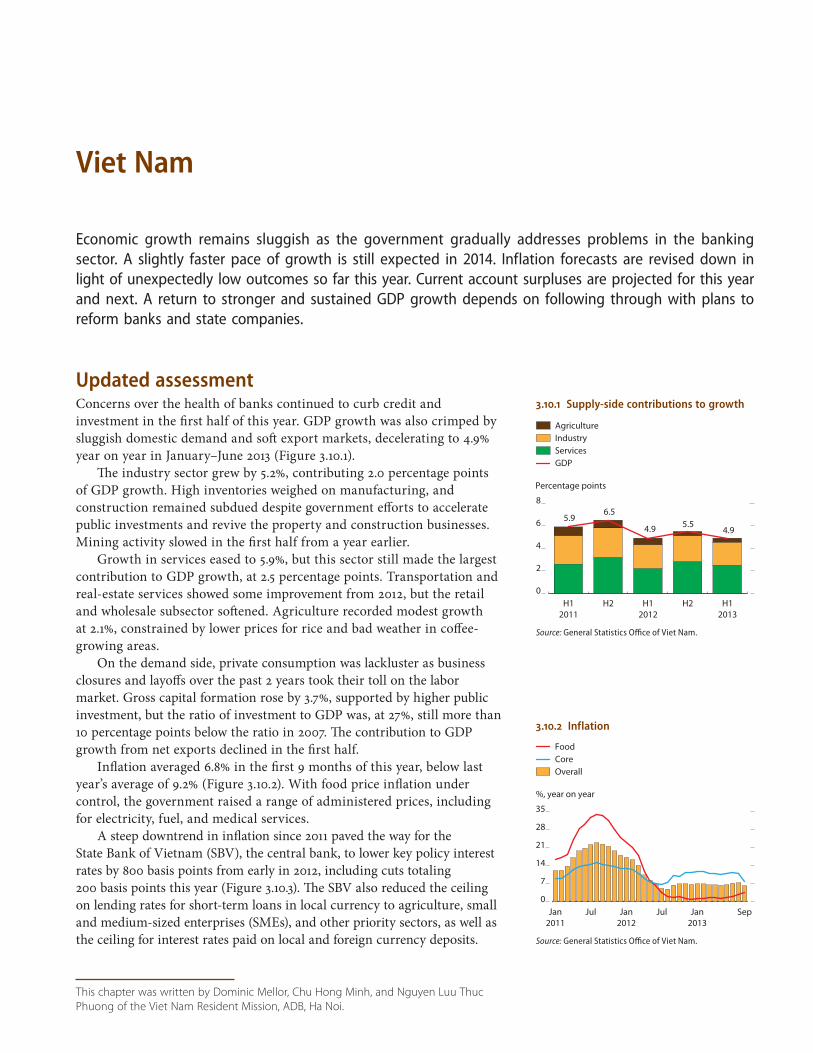
This chapter was written by Dominic Mellor, Chu Hong Minh, and Nguyen Luu Thuc
Phuong of the Viet Nam Resident Mission, ADB, Ha Noi.
3.10.1 Supply-side contributions to growth
0
2
4
6
8
H12013
H2H12012
H2H12011
Percentage points
5.94.9
5.54.9
6.5
AgricultureIndustryServicesGDP
Source: General Statistics Office of Viet Nam.
3.10.2 Inflation
0
7
14
21
28
35
Sep Jan2013
Jul Jan2012
Jul Jan2011
%, year on year
Overall
FoodCore
Source: General Statistics Office of Viet Nam.
Viet Nam
Economic growth remains sluggish as the government gradually addresses problems in the banking sector. A slightly faster pace of growth is still expected in 2014. Inflation forecasts are revised down in light of unexpectedly low outcomes so far this year. Current account surpluses are projected for this year and next. A return to stronger and sustained GDP growth depends on following through with plans to reform banks and state companies.
Updated assessmentConcerns over the health of banks continued to curb credit and investment in the first half of this year. GDP growth was also crimped by sluggish domestic demand and soft export markets, decelerating to 4.9% year on year in January–June 2013 (Figure 3.10.1).
The industry sector grew by 5.2%, contributing 2.0 percentage points of GDP growth. High inventories weighed on manufacturing, and construction remained subdued despite government efforts to accelerate public investments and revive the property and construction businesses. Mining activity slowed in the first half from a year earlier.
Growth in services eased to 5.9%, but this sector still made the largest contribution to GDP growth, at 2.5 percentage points. Transportation and real-estate services showed some improvement from 2012, but the retail and wholesale subsector softened. Agriculture recorded modest growth at 2.1%, constrained by lower prices for rice and bad weather in coffee-growing areas.
On the demand side, private consumption was lackluster as business closures and layoffs over the past 2 years took their toll on the labor market. Gross capital formation rose by 3.7%, supported by higher public investment, but the ratio of investment to GDP was, at 27%, still more than 10 percentage points below the ratio in 2007. The contribution to GDP growth from net exports declined in the first half.
Inflation averaged 6.8% in the first 9 months of this year, below last year’s average of 9.2% (Figure 3.10.2). With food price inflation under control, the government raised a range of administered prices, including for electricity, fuel, and medical services.
A steep downtrend in inflation since 2011 paved the way for the State Bank of Vietnam (SBV), the central bank, to lower key policy interest rates by 800 basis points from early in 2012, including cuts totaling 200 basis points this year (Figure 3.10.3). The SBV also reduced the ceiling on lending rates for short-term loans in local currency to agriculture, small and medium-sized enterprises (SMEs), and other priority sectors, as well as the ceiling for interest rates paid on local and foreign currency deposits.
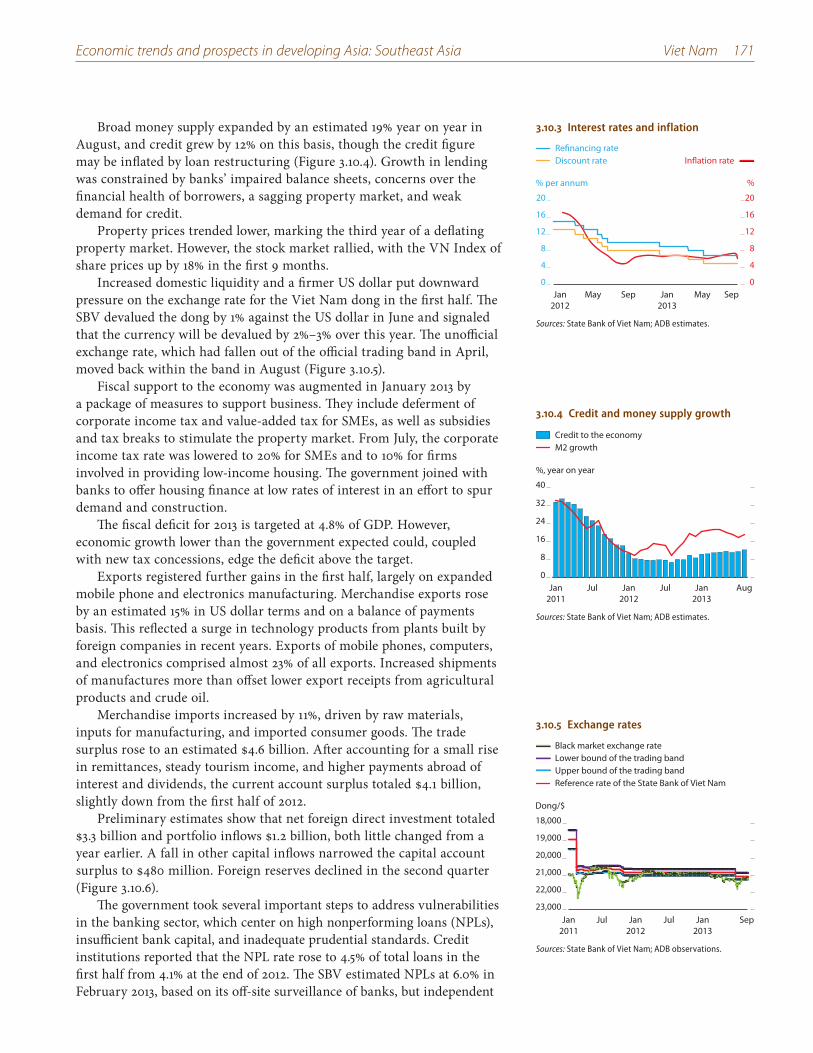
Economic trends and prospects in developing Asia: Southeast Asia Viet Nam 171
Broad money supply expanded by an estimated 19% year on year in August, and credit grew by 12% on this basis, though the credit figure may be inflated by loan restructuring (Figure 3.10.4). Growth in lending was constrained by banks’ impaired balance sheets, concerns over the financial health of borrowers, a sagging property market, and weak demand for credit.
Property prices trended lower, marking the third year of a deflating property market. However, the stock market rallied, with the VN Index of share prices up by 18% in the first 9 months.
Increased domestic liquidity and a firmer US dollar put downward pressure on the exchange rate for the Viet Nam dong in the first half. The SBV devalued the dong by 1% against the US dollar in June and signaled that the currency will be devalued by 2%–3% over this year. The unofficial exchange rate, which had fallen out of the official trading band in April, moved back within the band in August (Figure 3.10.5).
Fiscal support to the economy was augmented in January 2013 by a package of measures to support business. They include deferment of corporate income tax and value-added tax for SMEs, as well as subsidies and tax breaks to stimulate the property market. From July, the corporate income tax rate was lowered to 20% for SMEs and to 10% for firms involved in providing low-income housing. The government joined with banks to offer housing finance at low rates of interest in an effort to spur demand and construction.
The fiscal deficit for 2013 is targeted at 4.8% of GDP. However, economic growth lower than the government expected could, coupled with new tax concessions, edge the deficit above the target.
Exports registered further gains in the first half, largely on expanded mobile phone and electronics manufacturing. Merchandise exports rose by an estimated 15% in US dollar terms and on a balance of payments basis. This reflected a surge in technology products from plants built by foreign companies in recent years. Exports of mobile phones, computers, and electronics comprised almost 23% of all exports. Increased shipments of manufactures more than offset lower export receipts from agricultural products and crude oil.
Merchandise imports increased by 11%, driven by raw materials, inputs for manufacturing, and imported consumer goods. The trade surplus rose to an estimated $4.6 billion. After accounting for a small rise in remittances, steady tourism income, and higher payments abroad of interest and dividends, the current account surplus totaled $4.1 billion, slightly down from the first half of 2012.
Preliminary estimates show that net foreign direct investment totaled $3.3 billion and portfolio inflows $1.2 billion, both little changed from a year earlier. A fall in other capital inflows narrowed the capital account surplus to $480 million. Foreign reserves declined in the second quarter (Figure 3.10.6).
The government took several important steps to address vulnerabilities in the banking sector, which center on high nonperforming loans (NPLs), insufficient bank capital, and inadequate prudential standards. Credit institutions reported that the NPL rate rose to 4.5% of total loans in the first half from 4.1% at the end of 2012. The SBV estimated NPLs at 6.0% in February 2013, based on its off-site surveillance of banks, but independent
3.10.3 Interest rates and inflation
0
4
8
12
16
20
0
4
Jan2012
Jan2013
MayMay Sep Sep
8
12
16
20
% per annum %
Discount rate Refinancing rate
Inflation rate
Sources: State Bank of Viet Nam; ADB estimates.
3.10.4 Credit and money supply growth
Credit to the economyM2 growth
0
8
16
24
32
40
Aug Jan2013
Jul Jan2012
Jul Jan2011
%, year on year
Sources: State Bank of Viet Nam; ADB estimates.
3.10.5 Exchange rates
23,000
22,000
21,000
20,000
19,000
18,000
Dong/$
SepJan2013
JulJan2012
JulJan2011
Reference rate of the State Bank of Viet NamUpper bound of the trading bandLower bound of the trading bandBlack market exchange rate
Sources: State Bank of Viet Nam; ADB observations.
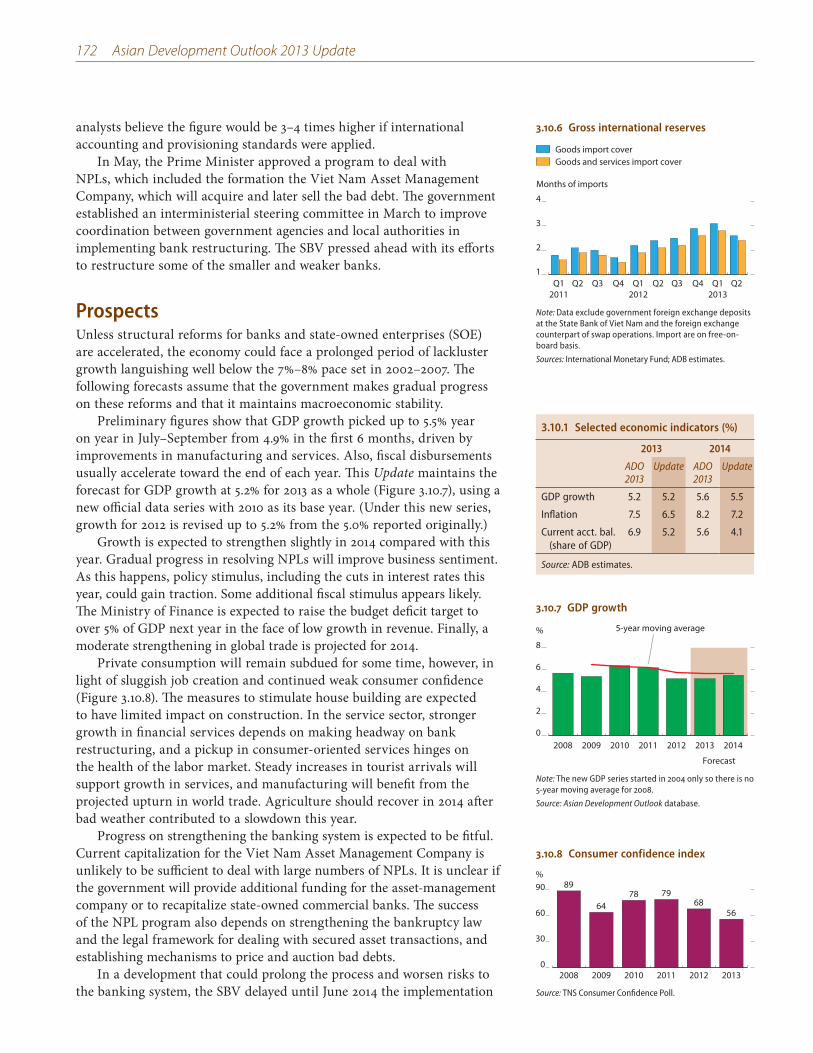
172 Asian Development Outlook 2013 Update
analysts believe the figure would be 3–4 times higher if international accounting and provisioning standards were applied.
In May, the Prime Minister approved a program to deal with NPLs, which included the formation the Viet Nam Asset Management Company, which will acquire and later sell the bad debt. The government established an interministerial steering committee in March to improve coordination between government agencies and local authorities in implementing bank restructuring. The SBV pressed ahead with its efforts to restructure some of the smaller and weaker banks.
ProspectsUnless structural reforms for banks and state-owned enterprises (SOE) are accelerated, the economy could face a prolonged period of lackluster growth languishing well below the 7%–8% pace set in 2002–2007. The following forecasts assume that the government makes gradual progress on these reforms and that it maintains macroeconomic stability.
Preliminary figures show that GDP growth picked up to 5.5% year on year in July–September from 4.9% in the first 6 months, driven by improvements in manufacturing and services. Also, fiscal disbursements usually accelerate toward the end of each year. This Update maintains the forecast for GDP growth at 5.2% for 2013 as a whole (Figure 3.10.7), using a new official data series with 2010 as its base year. (Under this new series, growth for 2012 is revised up to 5.2% from the 5.0% reported originally.)
Growth is expected to strengthen slightly in 2014 compared with this year. Gradual progress in resolving NPLs will improve business sentiment. As this happens, policy stimulus, including the cuts in interest rates this year, could gain traction. Some additional fiscal stimulus appears likely. The Ministry of Finance is expected to raise the budget deficit target to over 5% of GDP next year in the face of low growth in revenue. Finally, a moderate strengthening in global trade is projected for 2014.
Private consumption will remain subdued for some time, however, in light of sluggish job creation and continued weak consumer confidence (Figure 3.10.8). The measures to stimulate house building are expected to have limited impact on construction. In the service sector, stronger growth in financial services depends on making headway on bank restructuring, and a pickup in consumer-oriented services hinges on the health of the labor market. Steady increases in tourist arrivals will support growth in services, and manufacturing will benefit from the projected upturn in world trade. Agriculture should recover in 2014 after bad weather contributed to a slowdown this year.
Progress on strengthening the banking system is expected to be fitful. Current capitalization for the Viet Nam Asset Management Company is unlikely to be sufficient to deal with large numbers of NPLs. It is unclear if the government will provide additional funding for the asset-management company or to recapitalize state-owned commercial banks. The success of the NPL program also depends on strengthening the bankruptcy law and the legal framework for dealing with secured asset transactions, and establishing mechanisms to price and auction bad debts.
In a development that could prolong the process and worsen risks to the banking system, the SBV delayed until June 2014 the implementation
3.10.1 Selected economic indicators (%)
2013 2014
ADO 2013
Update ADO 2013
Update
GDP growth 5.2 5.2 5.6 5.5
Inflation 7.5 6.5 8.2 7.2
Current acct. bal. (share of GDP)
6.9 5.2 5.6 4.1
Source: ADB estimates.
3.10.6 Gross international reserves
Goods and services import coverGoods import cover
1
2
3
4
Q2 Q12013
Q4Q3 Q2Q12012
Q4Q3 Q2 Q12011
Months of imports
Note: Data exclude government foreign exchange deposits at the State Bank of Viet Nam and the foreign exchange counterpart of swap operations. Import are on free-on-board basis.
Sources: International Monetary Fund; ADB estimates.
3.10.7 GDP growth
0
2
4
6
8
2014201320122011201020092008
5-year moving average%
Forecast
Note: The new GDP series started in 2004 only so there is no 5-year moving average for 2008.
Source: Asian Development Outlook database.
3.10.8 Consumer confidence index
0
30
60
90
201320122011201020092008
%89
5668
797864
Source: TNS Consumer Confidence Poll.
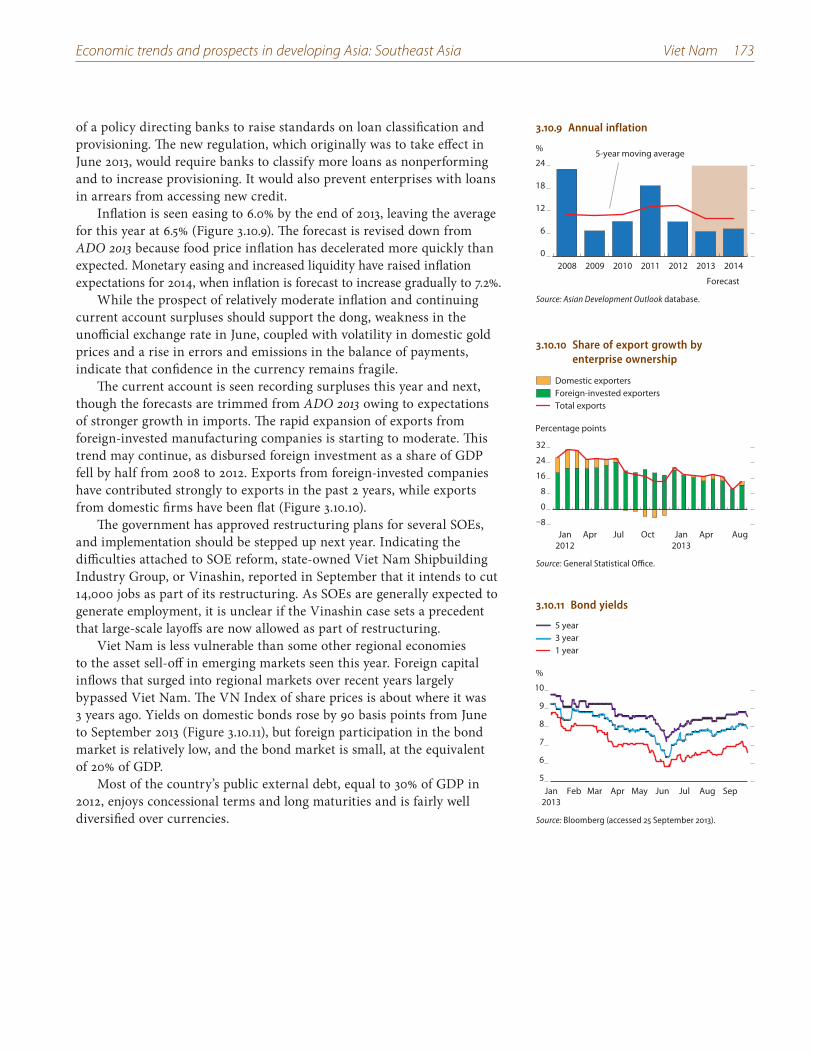
Economic trends and prospects in developing Asia: Southeast Asia Viet Nam 173
of a policy directing banks to raise standards on loan classification and provisioning. The new regulation, which originally was to take effect in June 2013, would require banks to classify more loans as nonperforming and to increase provisioning. It would also prevent enterprises with loans in arrears from accessing new credit.
Inflation is seen easing to 6.0% by the end of 2013, leaving the average for this year at 6.5% (Figure 3.10.9). The forecast is revised down from ADO 2013 because food price inflation has decelerated more quickly than expected. Monetary easing and increased liquidity have raised inflation expectations for 2014, when inflation is forecast to increase gradually to 7.2%.
While the prospect of relatively moderate inflation and continuing current account surpluses should support the dong, weakness in the unofficial exchange rate in June, coupled with volatility in domestic gold prices and a rise in errors and emissions in the balance of payments, indicate that confidence in the currency remains fragile.
The current account is seen recording surpluses this year and next, though the forecasts are trimmed from ADO 2013 owing to expectations of stronger growth in imports. The rapid expansion of exports from foreign-invested manufacturing companies is starting to moderate. This trend may continue, as disbursed foreign investment as a share of GDP fell by half from 2008 to 2012. Exports from foreign-invested companies have contributed strongly to exports in the past 2 years, while exports from domestic firms have been flat (Figure 3.10.10).
The government has approved restructuring plans for several SOEs, and implementation should be stepped up next year. Indicating the difficulties attached to SOE reform, state-owned Viet Nam Shipbuilding Industry Group, or Vinashin, reported in September that it intends to cut 14,000 jobs as part of its restructuring. As SOEs are generally expected to generate employment, it is unclear if the Vinashin case sets a precedent that large-scale layoffs are now allowed as part of restructuring.
Viet Nam is less vulnerable than some other regional economies to the asset sell-off in emerging markets seen this year. Foreign capital inflows that surged into regional markets over recent years largely bypassed Viet Nam. The VN Index of share prices is about where it was 3 years ago. Yields on domestic bonds rose by 90 basis points from June to September 2013 (Figure 3.10.11), but foreign participation in the bond market is relatively low, and the bond market is small, at the equivalent of 20% of GDP.
Most of the country’s public external debt, equal to 30% of GDP in 2012, enjoys concessional terms and long maturities and is fairly well diversified over currencies.
3.10.9 Annual inflation
0
6
12
18
24
2014201320122011201020092008
5-year moving average%
Forecast
Source: Asian Development Outlook database.
3.10.10 Share of export growth by enterprise ownership
–8
0
8
16
24
32
Jan2012
Apr Jul Oct Jan2013
Apr Aug
Percentage points
Domestic exportersForeign-invested exportersTotal exports
Source: General Statistical Office.
3.10.11 Bond yields
1 year3 year5 year
5
6
7
8
9
10
SepAugJulJunMayAprMarFebJan2013
%
Source: Bloomberg (accessed 25 September 2013).


Statisticalappendix
Statistical notes and tables
The statistical appendix presents selected economic indicators for 45 developing member economies of the Asian Development Bank (ADB) in three tables: gross domestic product (GDP) growth, inflation, and current account balance as a percentage of GDP. The economies are grouped into five subregions: Central Asia, East Asia, South Asia, Southeast Asia, and the Pacific. The tables contain historical data for 2010 to 2012 and forecasts for 2013 and 2014.
The data were standardized to the degree possible in order to allow comparability over time and across economies, but differences in statistical methodology, definitions, coverage, and practices make full comparability impossible. The national income accounts section is based on the United Nations System of National Accounts, while the balance of-payments data are based on International Monetary Fund (IMF) accounting standards. Historical data were obtained from official sources, statistical publications, and databases, and documents of ADB, IMF, and World Bank. Projections for 2013 and 2014 are generally staff estimates made on the basis of available quarterly or monthly data, although some projections are from governments.
Most countries report on a calendar-year basis, while South Asian countries (except for the Maldives and Sri Lanka) report all variables on a fiscal year basis. Regional and subregional averages are provided for the three tables.
The averages are computed using weights derived from levels of gross national income (GNI) in current United States dollars (US$) following the World Bank Atlas method. The GNI data for 2010–2011 were obtained from the World Bank’s World Development Indicators Online. Weights for 2011 were carried over through 2014. The GNI data for Cook Islands and Tuvalu were estimated using the Atlas conversion factor. Myanmar and Nauru have no GNI data, and data for these two countries are excluded from the computation of all subregional averages and totals. The following paragraphs discuss the three tables in greater detail.
Table A1: Growth rate of GDP (% per year). The table shows annual growth rates of GDP valued at constant market prices, factor costs, or basic prices. GDP at market prices is the aggregation of the value added of all resident producers at producers’ prices including taxes less subsidies on imports plus all nondeductible value-added or similar taxes. Constant factor cost measures differ from market price measures in that they exclude taxes on production and include subsidies. Basic price valuation

Statistical appendix 177
is the factor cost plus some taxes on production, such as property and payroll taxes, and less some subsidies, such as labor-related subsidies but not product-related subsidies. Most countries use constant market price valuation. Fiji, India, Pakistan, and Sri Lanka use constant factor costs, while the Maldives and Nepal use basic prices.
Table A2: Inflation (% per year). Data on inflation rates represent period averages. Except for India, which reports the wholesale price index, inflation rates presented are based on consumer price indexes. The consumer price indexes of the following countries are for a given city or group of consumers only: Afghanistan is for Kabul until 2010, Cambodia is for Phnom Penh, theMaldives is for Male, Marshall Islands is for Majuro, Solomon Islands is for Honiara, and Nepal is for urban consumers.
Table A3: Current account balance (% of GDP). The current account balance is the sum of the balance of trade for merchandise, net trade in services, factor or primary income, and transfers or secondary income. The values reported are divided by GDP at current prices in US dollars. In the case of Cambodia, the Lao PDR, and Viet Nam, official transfers are excluded from the current account balance.
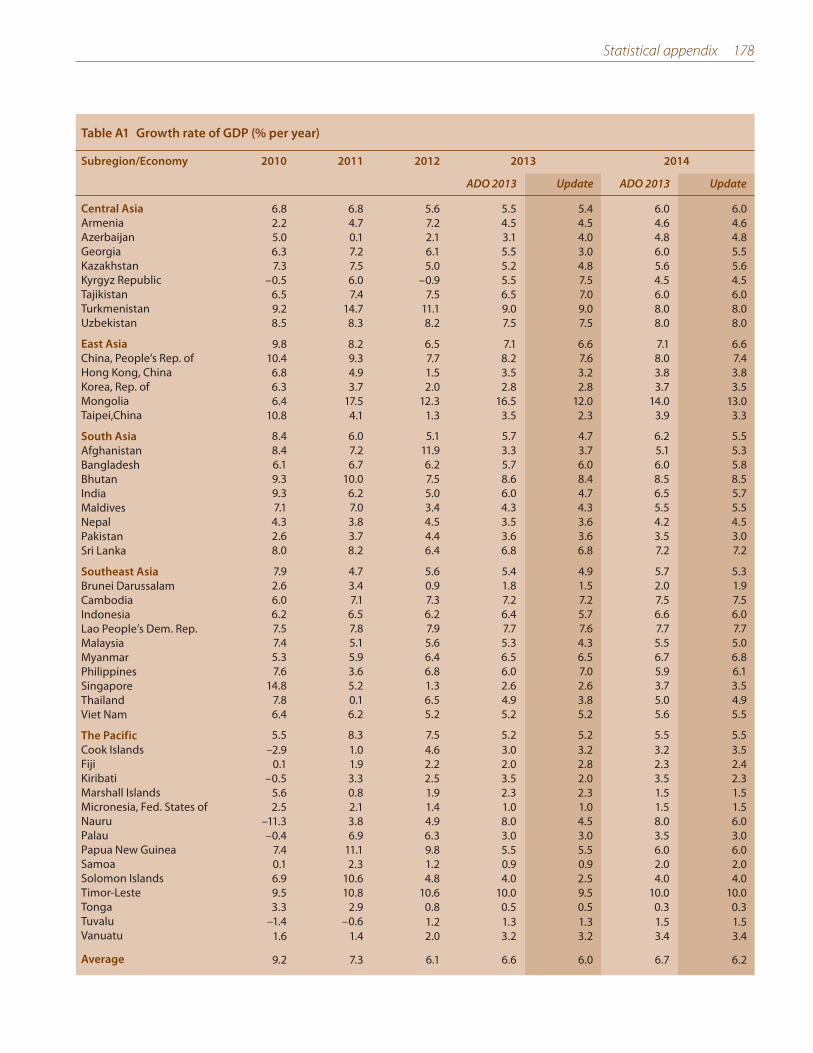
Statistical appendix 178
Table A1 Growth rate of GDP (% per year)
Subregion/Economy 2010 2011 2012 2013 2014
ADO 2013 Update ADO 2013 Update
Central Asia
ArmeniaAzerbaijanGeorgiaKazakhstanKyrgyz RepublicTajikistanTurkmenistanUzbekistan
East Asia
China, People’s Rep. ofHong Kong, ChinaKorea, Rep. ofMongoliaTaipei,China
South Asia
AfghanistanBangladeshBhutanIndiaMaldivesNepalPakistanSri Lanka
Southeast Asia
Brunei DarussalamCambodiaIndonesiaLao People’s Dem. Rep.MalaysiaMyanmarPhilippinesSingaporeThailandViet Nam
The Pacific
Cook IslandsFijiKiribatiMarshall IslandsMicronesia, Fed. States ofNauruPalauPapua New GuineaSamoaSolomon IslandsTimor-LesteTongaTuvaluVanuatu
Average
6.8 6.8 5.6 5.5 5.4 6.0 6.02.2 4.7 7.2 4.5 4.5 4.6 4.65.0 0.1 2.1 3.1 4.0 4.8 4.86.3 7.2 6.1 5.5 3.0 6.0 5.57.3 7.5 5.0 5.2 4.8 5.6 5.6
–0.5 6.0 –0.9 5.5 7.5 4.5 4.56.5 7.4 7.5 6.5 7.0 6.0 6.09.2 14.7 11.1 9.0 9.0 8.0 8.08.5 8.3 8.2 7.5 7.5 8.0 8.0
9.8 8.2 6.5 7.1 6.6 7.1 6.610.4 9.3 7.7 8.2 7.6 8.0 7.4
6.8 4.9 1.5 3.5 3.2 3.8 3.86.3 3.7 2.0 2.8 2.8 3.7 3.56.4 17.5 12.3 16.5 12.0 14.0 13.0
10.8 4.1 1.3 3.5 2.3 3.9 3.3
8.4 6.0 5.1 5.7 4.7 6.2 5.58.4 7.2 11.9 3.3 3.7 5.1 5.36.1 6.7 6.2 5.7 6.0 6.0 5.89.3 10.0 7.5 8.6 8.4 8.5 8.59.3 6.2 5.0 6.0 4.7 6.5 5.77.1 7.0 3.4 4.3 4.3 5.5 5.54.3 3.8 4.5 3.5 3.6 4.2 4.52.6 3.7 4.4 3.6 3.6 3.5 3.08.0 8.2 6.4 6.8 6.8 7.2 7.2
7.9 4.7 5.6 5.4 4.9 5.7 5.32.6 3.4 0.9 1.8 1.5 2.0 1.96.0 7.1 7.3 7.2 7.2 7.5 7.56.2 6.5 6.2 6.4 5.7 6.6 6.07.5 7.8 7.9 7.7 7.6 7.7 7.77.4 5.1 5.6 5.3 4.3 5.5 5.05.3 5.9 6.4 6.5 6.5 6.7 6.87.6 3.6 6.8 6.0 7.0 5.9 6.1
14.8 5.2 1.3 2.6 2.6 3.7 3.57.8 0.1 6.5 4.9 3.8 5.0 4.96.4 6.2 5.2 5.2 5.2 5.6 5.5
5.5 8.3 7.5 5.2 5.2 5.5 5.5–2.9 1.0 4.6 3.0 3.2 3.2 3.5
0.1 1.9 2.2 2.0 2.8 2.3 2.4–0.5 3.3 2.5 3.5 2.0 3.5 2.3
5.6 0.8 1.9 2.3 2.3 1.5 1.52.5 2.1 1.4 1.0 1.0 1.5 1.5
–11.3 3.8 4.9 8.0 4.5 8.0 6.0–0.4 6.9 6.3 3.0 3.0 3.5 3.0
7.4 11.1 9.8 5.5 5.5 6.0 6.00.1 2.3 1.2 0.9 0.9 2.0 2.06.9 10.6 4.8 4.0 2.5 4.0 4.09.5 10.8 10.6 10.0 9.5 10.0 10.03.3 2.9 0.8 0.5 0.5 0.3 0.3
–1.4 –0.6 1.2 1.3 1.3 1.5 1.51.6 1.4 2.0 3.2 3.2 3.4 3.4
9.2 7.3 6.1 6.6 6.0 6.7 6.2
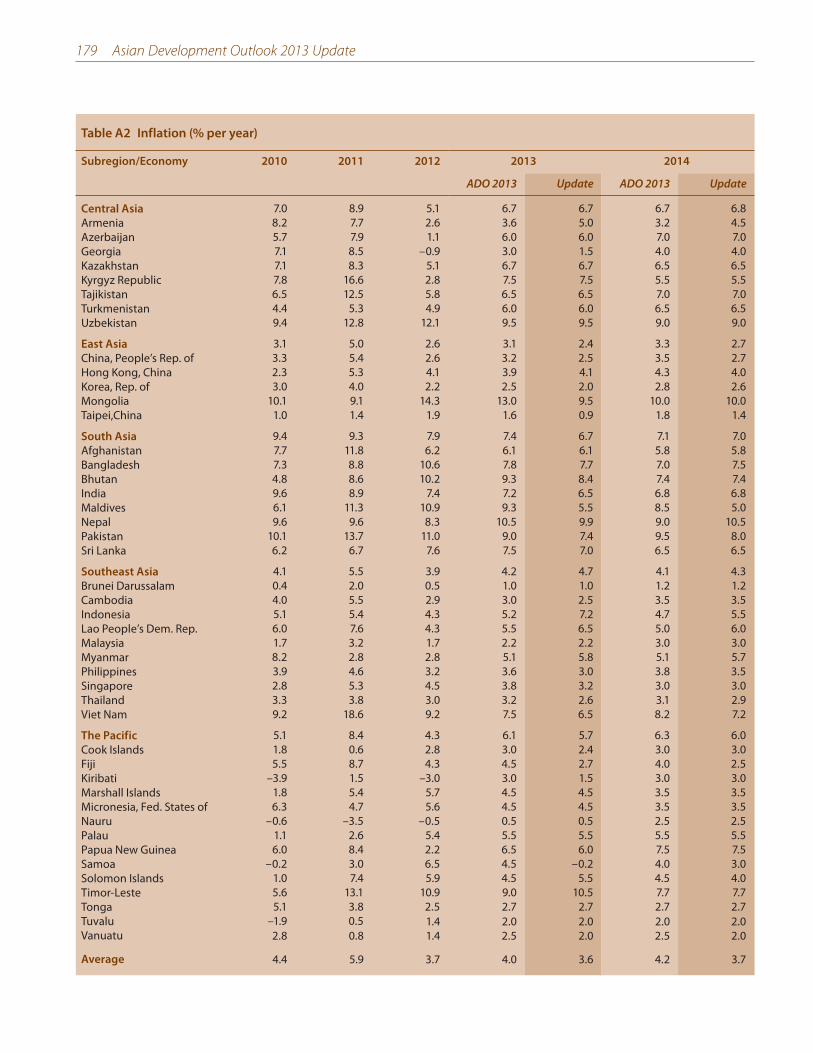
179 Asian Development Outlook 2013 Update
Table A2 Inflation (% per year)
Subregion/Economy 2010 2011 2012 2013 2014
ADO 2013 Update ADO 2013 Update
Central Asia
ArmeniaAzerbaijanGeorgiaKazakhstanKyrgyz RepublicTajikistanTurkmenistanUzbekistan
East Asia
China, People’s Rep. ofHong Kong, ChinaKorea, Rep. ofMongoliaTaipei,China
South Asia
AfghanistanBangladeshBhutanIndiaMaldivesNepalPakistanSri Lanka
Southeast Asia
Brunei DarussalamCambodiaIndonesiaLao People’s Dem. Rep.MalaysiaMyanmarPhilippinesSingaporeThailandViet Nam
The Pacific
Cook IslandsFijiKiribatiMarshall IslandsMicronesia, Fed. States ofNauruPalauPapua New GuineaSamoaSolomon IslandsTimor-LesteTongaTuvaluVanuatu
Average
7.0 8.9 5.1 6.7 6.7 6.7 6.88.2 7.7 2.6 3.6 5.0 3.2 4.55.7 7.9 1.1 6.0 6.0 7.0 7.07.1 8.5 –0.9 3.0 1.5 4.0 4.07.1 8.3 5.1 6.7 6.7 6.5 6.57.8 16.6 2.8 7.5 7.5 5.5 5.56.5 12.5 5.8 6.5 6.5 7.0 7.04.4 5.3 4.9 6.0 6.0 6.5 6.59.4 12.8 12.1 9.5 9.5 9.0 9.0
3.1 5.0 2.6 3.1 2.4 3.3 2.73.3 5.4 2.6 3.2 2.5 3.5 2.72.3 5.3 4.1 3.9 4.1 4.3 4.03.0 4.0 2.2 2.5 2.0 2.8 2.6
10.1 9.1 14.3 13.0 9.5 10.0 10.01.0 1.4 1.9 1.6 0.9 1.8 1.4
9.4 9.3 7.9 7.4 6.7 7.1 7.07.7 11.8 6.2 6.1 6.1 5.8 5.87.3 8.8 10.6 7.8 7.7 7.0 7.54.8 8.6 10.2 9.3 8.4 7.4 7.49.6 8.9 7.4 7.2 6.5 6.8 6.86.1 11.3 10.9 9.3 5.5 8.5 5.09.6 9.6 8.3 10.5 9.9 9.0 10.5
10.1 13.7 11.0 9.0 7.4 9.5 8.06.2 6.7 7.6 7.5 7.0 6.5 6.5
4.1 5.5 3.9 4.2 4.7 4.1 4.30.4 2.0 0.5 1.0 1.0 1.2 1.24.0 5.5 2.9 3.0 2.5 3.5 3.55.1 5.4 4.3 5.2 7.2 4.7 5.56.0 7.6 4.3 5.5 6.5 5.0 6.01.7 3.2 1.7 2.2 2.2 3.0 3.08.2 2.8 2.8 5.1 5.8 5.1 5.73.9 4.6 3.2 3.6 3.0 3.8 3.52.8 5.3 4.5 3.8 3.2 3.0 3.03.3 3.8 3.0 3.2 2.6 3.1 2.99.2 18.6 9.2 7.5 6.5 8.2 7.2
5.1 8.4 4.3 6.1 5.7 6.3 6.01.8 0.6 2.8 3.0 2.4 3.0 3.05.5 8.7 4.3 4.5 2.7 4.0 2.5
–3.9 1.5 –3.0 3.0 1.5 3.0 3.01.8 5.4 5.7 4.5 4.5 3.5 3.56.3 4.7 5.6 4.5 4.5 3.5 3.5
–0.6 –3.5 –0.5 0.5 0.5 2.5 2.51.1 2.6 5.4 5.5 5.5 5.5 5.56.0 8.4 2.2 6.5 6.0 7.5 7.5
–0.2 3.0 6.5 4.5 –0.2 4.0 3.01.0 7.4 5.9 4.5 5.5 4.5 4.05.6 13.1 10.9 9.0 10.5 7.7 7.75.1 3.8 2.5 2.7 2.7 2.7 2.7
–1.9 0.5 1.4 2.0 2.0 2.0 2.02.8 0.8 1.4 2.5 2.0 2.5 2.0
4.4 5.9 3.7 4.0 3.6 4.2 3.7
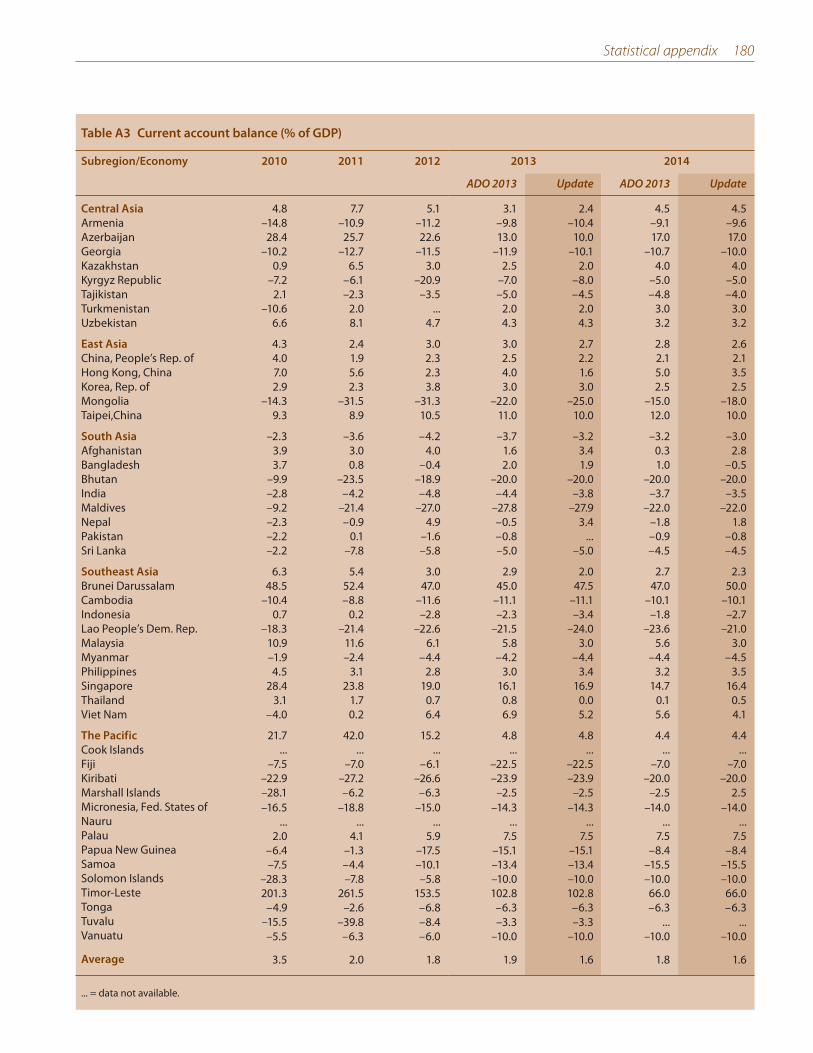
Statistical appendix 180
Table A3 Current account balance (% of GDP)
Subregion/Economy 2010 2011 2012 2013 2014
ADO 2013 Update ADO 2013 Update
Central Asia
ArmeniaAzerbaijanGeorgiaKazakhstanKyrgyz RepublicTajikistanTurkmenistanUzbekistan
East Asia
China, People’s Rep. ofHong Kong, ChinaKorea, Rep. ofMongoliaTaipei,China
South Asia
AfghanistanBangladeshBhutanIndiaMaldivesNepalPakistanSri Lanka
Southeast Asia
Brunei DarussalamCambodiaIndonesiaLao People’s Dem. Rep.MalaysiaMyanmarPhilippinesSingaporeThailandViet Nam
The Pacific
Cook IslandsFijiKiribatiMarshall IslandsMicronesia, Fed. States ofNauruPalauPapua New GuineaSamoaSolomon IslandsTimor-LesteTongaTuvaluVanuatu
Average
... = data not available.
4.8 7.7 5.1 3.1 2.4 4.5 4.5–14.8 –10.9 –11.2 –9.8 –10.4 –9.1 –9.628.4 25.7 22.6 13.0 10.0 17.0 17.0
–10.2 –12.7 –11.5 –11.9 –10.1 –10.7 –10.00.9 6.5 3.0 2.5 2.0 4.0 4.0
–7.2 –6.1 –20.9 –7.0 –8.0 –5.0 –5.02.1 –2.3 –3.5 –5.0 –4.5 –4.8 –4.0
–10.6 2.0 ... 2.0 2.0 3.0 3.06.6 8.1 4.7 4.3 4.3 3.2 3.2
4.3 2.4 3.0 3.0 2.7 2.8 2.64.0 1.9 2.3 2.5 2.2 2.1 2.17.0 5.6 2.3 4.0 1.6 5.0 3.52.9 2.3 3.8 3.0 3.0 2.5 2.5
–14.3 –31.5 –31.3 –22.0 –25.0 –15.0 –18.09.3 8.9 10.5 11.0 10.0 12.0 10.0
–2.3 –3.6 –4.2 –3.7 –3.2 –3.2 –3.03.9 3.0 4.0 1.6 3.4 0.3 2.83.7 0.8 –0.4 2.0 1.9 1.0 –0.5
–9.9 –23.5 –18.9 –20.0 –20.0 –20.0 –20.0–2.8 –4.2 –4.8 –4.4 –3.8 –3.7 –3.5–9.2 –21.4 –27.0 –27.8 –27.9 –22.0 –22.0–2.3 –0.9 4.9 –0.5 3.4 –1.8 1.8–2.2 0.1 –1.6 –0.8 ... –0.9 –0.8–2.2 –7.8 –5.8 –5.0 –5.0 –4.5 –4.5
6.3 5.4 3.0 2.9 2.0 2.7 2.348.5 52.4 47.0 45.0 47.5 47.0 50.0
–10.4 –8.8 –11.6 –11.1 –11.1 –10.1 –10.10.7 0.2 –2.8 –2.3 –3.4 –1.8 –2.7
–18.3 –21.4 –22.6 –21.5 –24.0 –23.6 –21.010.9 11.6 6.1 5.8 3.0 5.6 3.0–1.9 –2.4 –4.4 –4.2 –4.4 –4.4 –4.54.5 3.1 2.8 3.0 3.4 3.2 3.5
28.4 23.8 19.0 16.1 16.9 14.7 16.43.1 1.7 0.7 0.8 0.0 0.1 0.5
–4.0 0.2 6.4 6.9 5.2 5.6 4.1
21.7 42.0 15.2 4.8 4.8 4.4 4.4... ... ... ... ... ... ...
–7.5 –7.0 –6.1 –22.5 –22.5 –7.0 –7.0–22.9 –27.2 –26.6 –23.9 –23.9 –20.0 –20.0–28.1 –6.2 –6.3 –2.5 –2.5 –2.5 2.5–16.5 –18.8 –15.0 –14.3 –14.3 –14.0 –14.0
... ... ... ... ... ... ...2.0 4.1 5.9 7.5 7.5 7.5 7.5
–6.4 –1.3 –17.5 –15.1 –15.1 –8.4 –8.4–7.5 –4.4 –10.1 –13.4 –13.4 –15.5 –15.5
–28.3 –7.8 –5.8 –10.0 –10.0 –10.0 –10.0201.3 261.5 153.5 102.8 102.8 66.0 66.0
–4.9 –2.6 –6.8 –6.3 –6.3 –6.3 –6.3–15.5 –39.8 –8.4 –3.3 –3.3 ... ...–5.5 –6.3 –6.0 –10.0 –10.0 –10.0 –10.0
3.5 2.0 1.8 1.9 1.6 1.8 1.6

Asian Development Outlook 2013 Update
Growth in developing Asia is hindered by moderation in the People’s Republic of China and India—the region’s two giants—and by steady but slow recovery in the major industrialized economies that has yet to revitalize exports from the region.
As developing Asia has instituted macroeconomic and financial reforms in the decade and a half since the Asian financial crisis, and as many regional economies run current account surpluses and hold large foreign reserves, the region is in a strong position to weather financial markets shocks, in particular from the anticipated tapering of quantitative easing in the United States.
This Asian Development Outlook 2013 Update looks at governance in developing Asia. Even as the region energetically closes its income gap with advanced economies, a wide gap in governance remains. Yet governance is key to sustaining development momentum, and improving public service delivery can be an entry point for better governance.
About the Asian Development Bank
ADB’s vision is an Asia and Pacific region free of poverty. Its mission is to help its developing member countries reduce poverty and improve the quality of life of their people. Despite the region’s many successes, it remains home to two-thirds of the world’s poor: 1.7 billion people who live on less than $2 a day, with 828 million struggling on less than $1.25 a day. ADB is committed to reducing poverty through inclusive economic growth, environmentally sustainable growth, and regional integration.
Based in Manila, ADB is owned by 67 members, including 48 from the region. Its main instruments for helping its developing member countries are policy dialogue, loans, equity investments, guarantees, grants, and technical assistance.
Printed on recycled paper
Asian Development Bank6 ADB Avenue, Mandaluyong City1550 Metro Manila, Philippineswww.adb.org
Printed in the Philippines