Embed Size (px)
Citation preview
MONGOLIA
2

GDP growth contributions (supply side)
3
• The economy grew by 5.3% in the
first half of 2017, recovering strongly
from only 1.2% growth in 2016.
• Services lifted GDP by 4.3 percentage
points, and agriculture by 1.0 point.
• Coal production soared, with coal
exports increasing by more than
fourfold.
• However, mining as a whole slumped
as copper concentrate production
languished, causing the larger
industry sector to subtract marginally
from growth. -10%
-5%
0%
5%
10%
15%
20%
I II III IV I II III IV I II III IV I II III IV I II
2013 2014 2015 2016 2017
Agriculture Industry, constructionServices Net taxes on productsGDP
Sources: National Statistical Office. 2017. Monthly Statistical Bulletin.
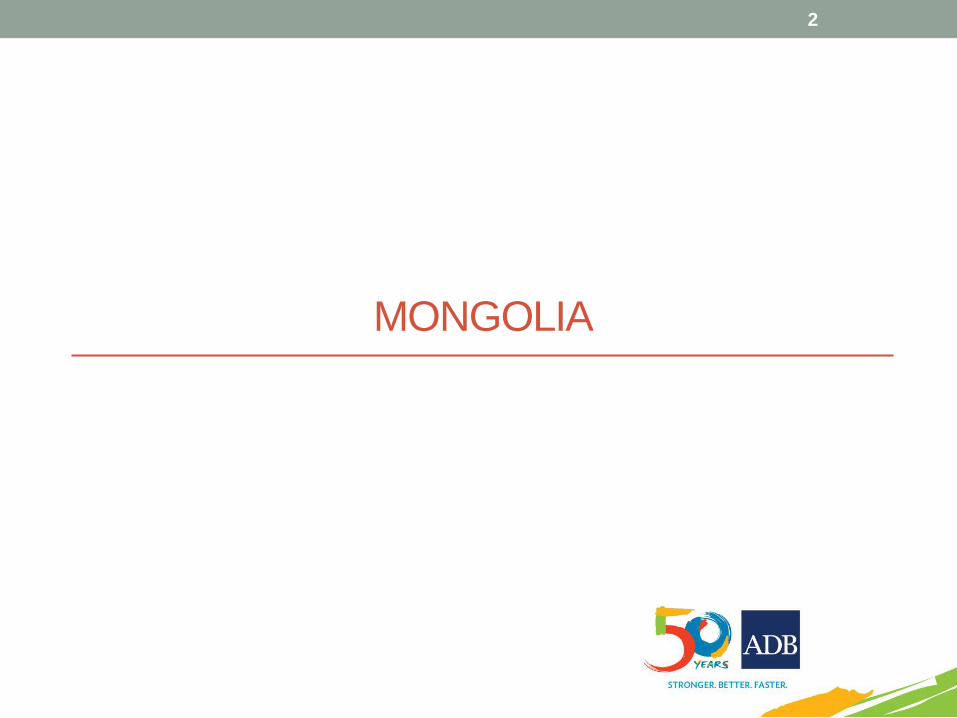
Coking coal prices unstable
4

Demand side contributions
5
• Investment, mainly into mining,
contributed 13.2 percentage
points to growth, and consumption
added 1.6 points.
• Net exports subtracted 9.6 points
as imports rose by 37.4% in
tandem with mining investment.
-40%
-20%
0%
20%
40%
I II III IV I II III IV I II III IV I II III IV I II
2013 2014 2015 2016 2017
Household consumption*** Government consumption
Gross fixed capital formation Changes in inventories****
Net exports GDP
Sources: National Statistical Office. 2017. Monthly Statistical Bulletin.

Inflation picks up but modest
• Inflation averaged 3.0% in the first half of the year as
togrog depreciation by 24.8% last year began to affect
prices.
• In June, the Bank of Mongolia, the central bank, lowered
its policy rate by 2.0 percentage points to 12.0% as terms
of trade improved and short-term external debt pressures
eased.
6
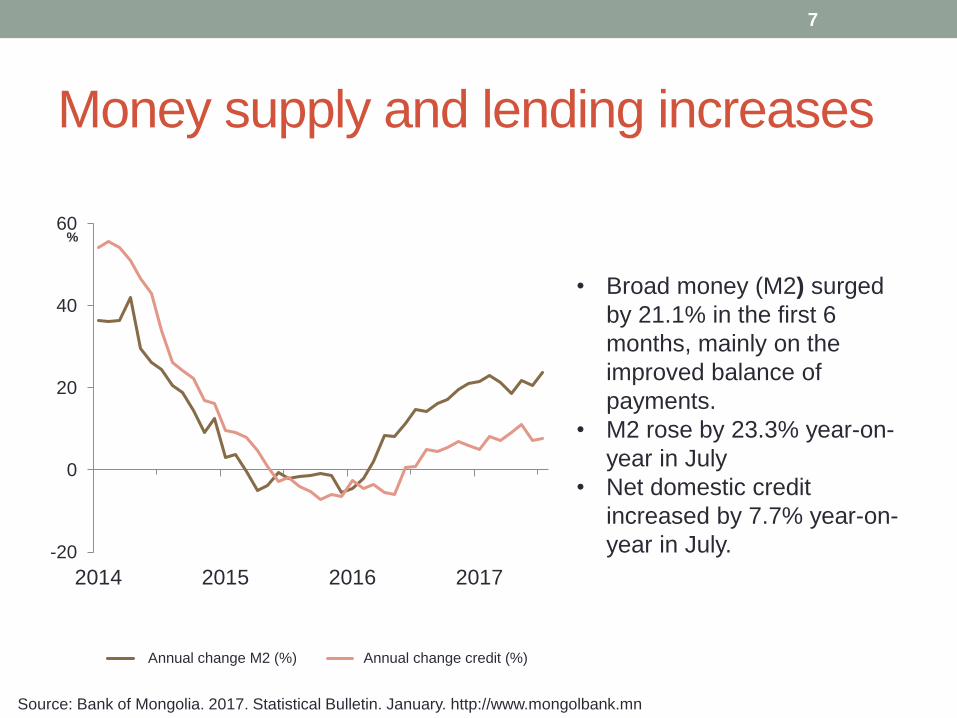
Money supply and lending increases
7
Source: Bank of Mongolia. 2017. Statistical Bulletin. January. http://www.mongolbank.mn
• Broad money (M2) surged
by 21.1% in the first 6
months, mainly on the
improved balance of
payments.
• M2 rose by 23.3% year-on-
year in July
• Net domestic credit
increased by 7.7% year-on-
year in July.-20
0
20
40
60
2014 2015 2016 2017
%
Annual change M2 (%) Annual change credit (%)
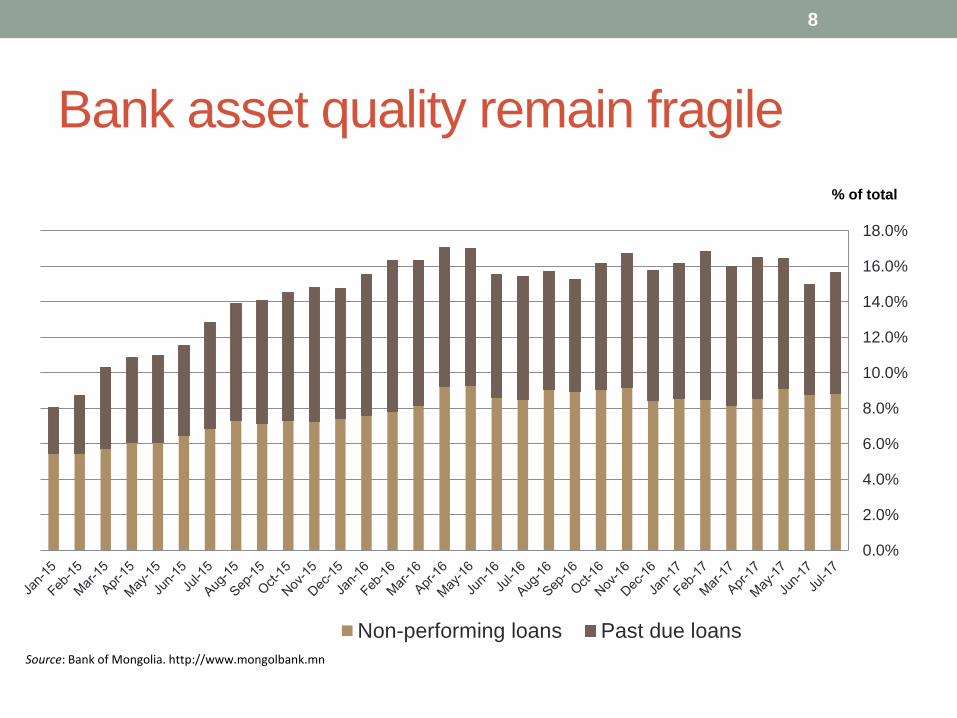
Bank asset quality remain fragile
8
0.0%
2.0%
4.0%
6.0%
8.0%
10.0%
12.0%
14.0%
16.0%
18.0%
Non-performing loans Past due loans
% of total
Source: Bank of Mongolia. http://www.mongolbank.mn
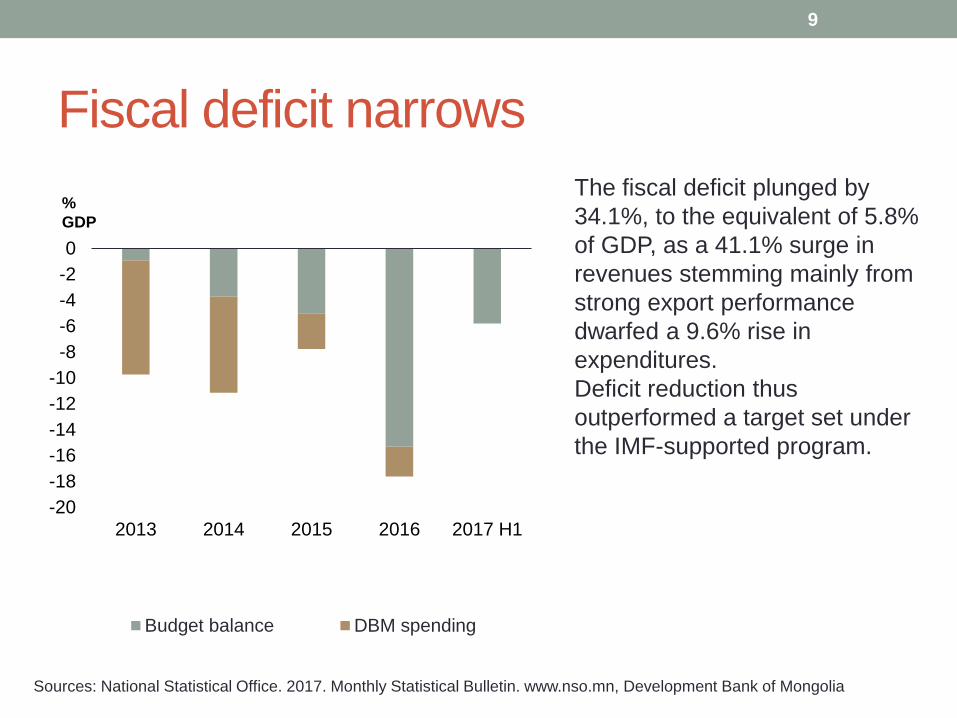
Fiscal deficit narrows
9
• The fiscal deficit plunged by
34.1%, to the equivalent of 5.8%
of GDP, as a 41.1% surge in
revenues stemming mainly from
strong export performance
dwarfed a 9.6% rise in
expenditures.
• Deficit reduction thus
outperformed a target set under
the IMF-supported program.
Sources: National Statistical Office. 2017. Monthly Statistical Bulletin. www.nso.mn, Development Bank of Mongolia
-20
-18
-16
-14
-12
-10
-8
-6
-4
-2
0
2013 2014 2015 2016 2017 H1
Budget balance DBM spending
%
GDP
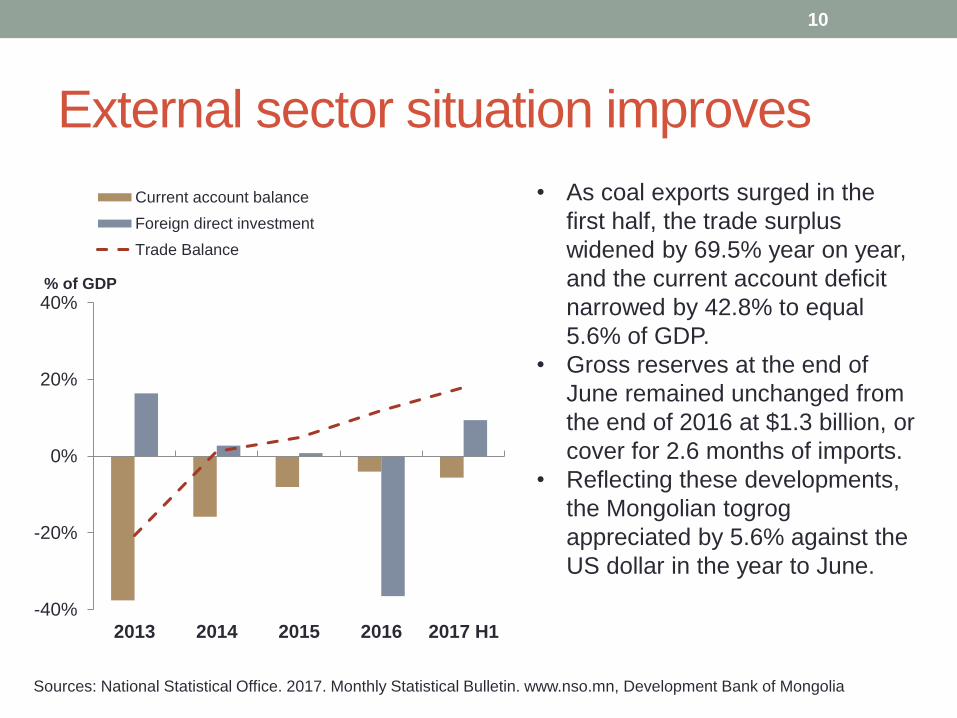
External sector situation improves
10
• As coal exports surged in the
first half, the trade surplus
widened by 69.5% year on year,
and the current account deficit
narrowed by 42.8% to equal
5.6% of GDP.
• Gross reserves at the end of
June remained unchanged from
the end of 2016 at $1.3 billion, or
cover for 2.6 months of imports.
• Reflecting these developments,
the Mongolian togrog
appreciated by 5.6% against the
US dollar in the year to June.
Sources: National Statistical Office. 2017. Monthly Statistical Bulletin. www.nso.mn, Development Bank of Mongolia
-40%
-20%
0%
20%
40%
2013 2014 2015 2016 2017 H1
% of GDP
Current account balance
Foreign direct investment
Trade Balance
Forecast
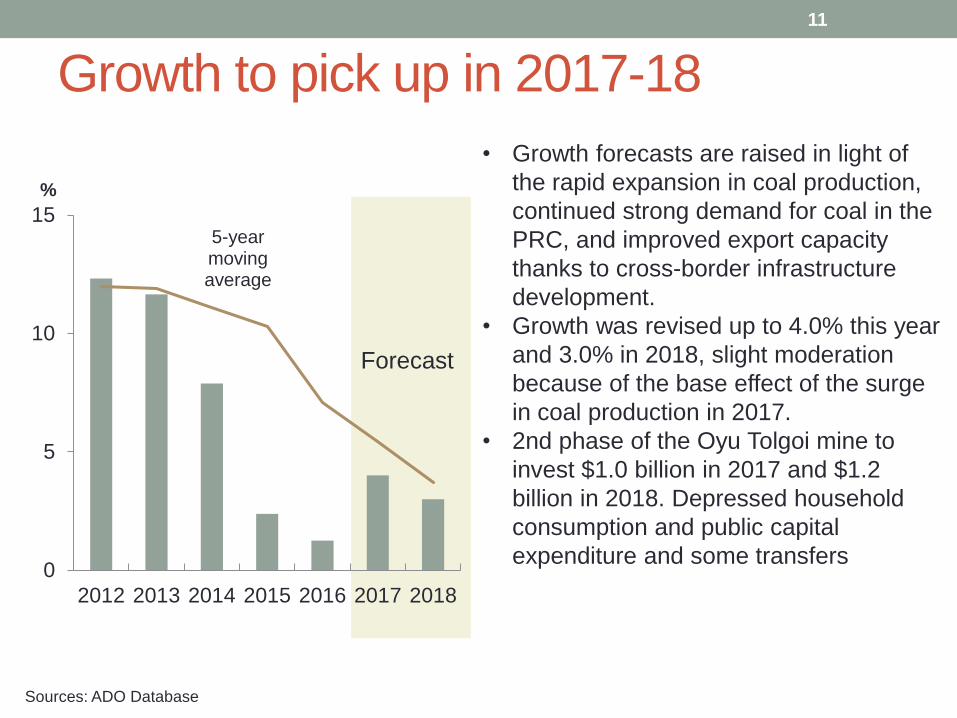
Growth to pick up in 2017-18
11
• Growth forecasts are raised in light of
the rapid expansion in coal production,
continued strong demand for coal in the
PRC, and improved export capacity
thanks to cross-border infrastructure
development.
• Growth was revised up to 4.0% this year
and 3.0% in 2018, slight moderation
because of the base effect of the surge
in coal production in 2017.
• 2nd phase of the Oyu Tolgoi mine to
invest $1.0 billion in 2017 and $1.2
billion in 2018. Depressed household
consumption and public capital
expenditure and some transfers
5-year moving average
0
5
10
15
2012 2013 2014 2015 2016 2017 2018
%
Sources: ADO Database
Forecast
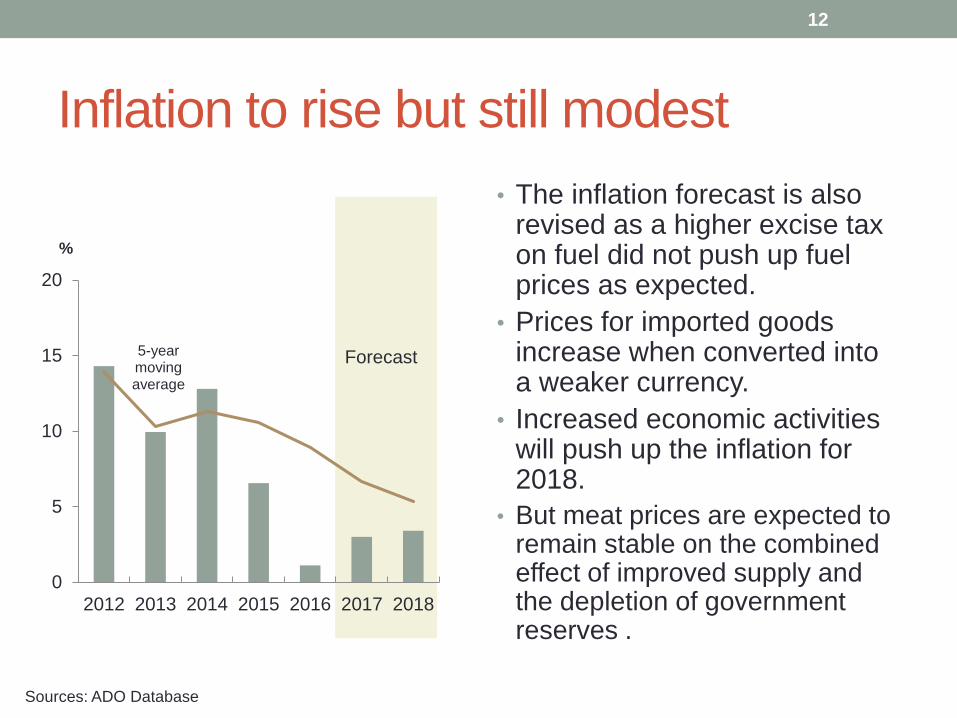
Inflation to rise but still modest
12
5-year moving average
0
5
10
15
20
2012 2013 2014 2015 2016 2017 2018
%
Sources: ADO Database
• The inflation forecast is also revised as a higher excise tax on fuel did not push up fuel prices as expected.
• Prices for imported goods increase when converted into a weaker currency.
• Increased economic activities will push up the inflation for 2018.
• But meat prices are expected to remain stable on the combined effect of improved supply and the depletion of government reserves .

Forecast
Current account deficit to increase with
capital imports
• The current account deficit was revised up to 6.4% of GDP in 2017 on strong mining related imports and widen further to 8.9% in 2018 as imports continue to expand while exports stabilize.
• The expected pickup in foreign direct investment will ease pressure on the balance of payments.
13
-40%
-35%
-30%
-25%
-20%
-15%
-10%
-5%
0%
2013 2014 2015 2016 2017 2018%GDP
Sources: ADO Database
Risks remain
• Downside risks to the baseline forecasts include the economy’s vulnerability to commodity price swings and prevailing drought that may affect crop and livestock production;
• Political instability has caused some uncertainty around stabilization program;
• Upside risks are stronger growth in the PRC, shocks affecting its domestic coal supply, and rising copper prices;
• The same factors could undermine forecasts for inflation and the current account balance.
14
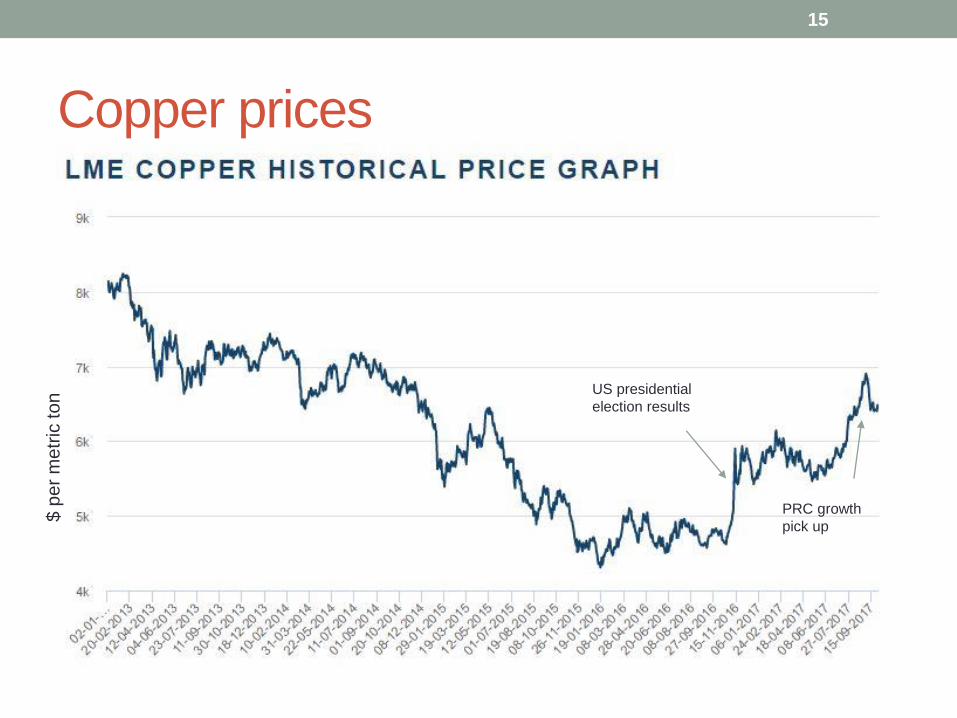
Copper prices
15
US presidential
election results
PRC growth
pick up
$ p
er
me
tric
to
n
PEOPLE’S REPUBLIC OF CHINA
16

Rebalancing progress amid controlled growth moderation
17
4
6
8
10
12
Q1 2015 Q3 Q1 2016 Q3 Q1 2017
%
Economic growth
Gross domestic product
Industrial sector value added
Retail sales
0
5
10
15
20
25
30
Jan2015 Jul Jan2016 Jul Jan2017 Aug
ytd, yoy %
Growth of fixed asset investment
Manufacturing Real Estate
0
2
4
6
8
10
2012 2013 2014 2015 2016 2017H1
Percentage points
Supply-side contributions to growth
Services
Industry
Agriculture
Gross domestic product
-3
0
3
6
9
2012 2013 2014 2015 2016 2017H1
Percentage points
Demand-side contributions to growth
Net exports
Investment
Consumption
Gross domestic product
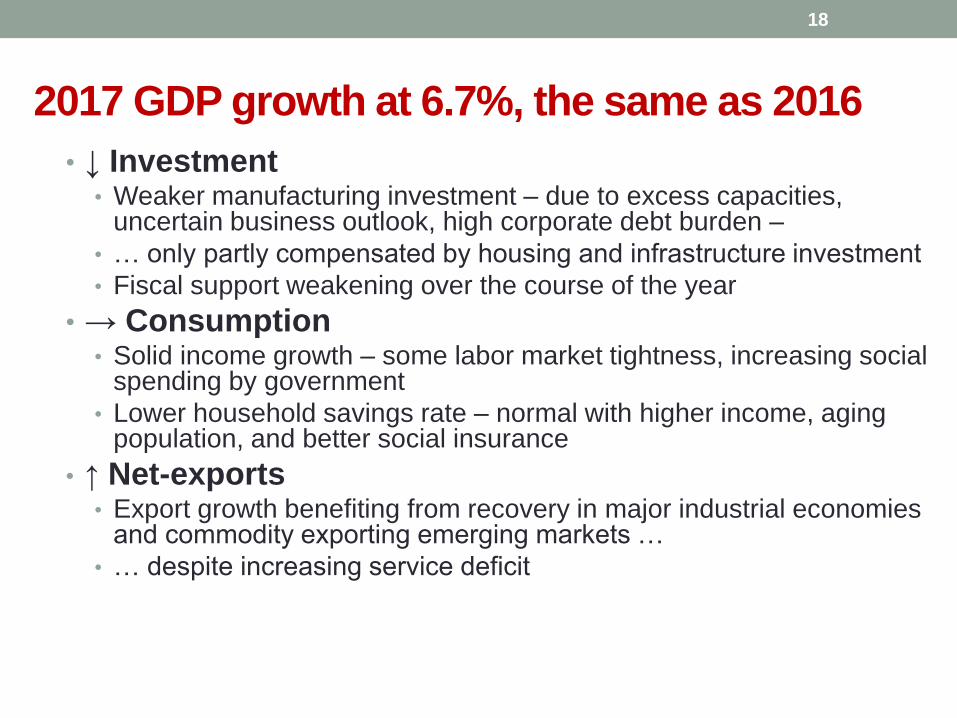
2017 GDP growth at 6.7%, the same as 2016
• ↓ Investment• Weaker manufacturing investment – due to excess capacities,
uncertain business outlook, high corporate debt burden –
• … only partly compensated by housing and infrastructure investment
• Fiscal support weakening over the course of the year
• → Consumption• Solid income growth – some labor market tightness, increasing social
spending by government
• Lower household savings rate – normal with higher income, aging population, and better social insurance
• ↑ Net-exports• Export growth benefiting from recovery in major industrial economies
and commodity exporting emerging markets …
• … despite increasing service deficit
18
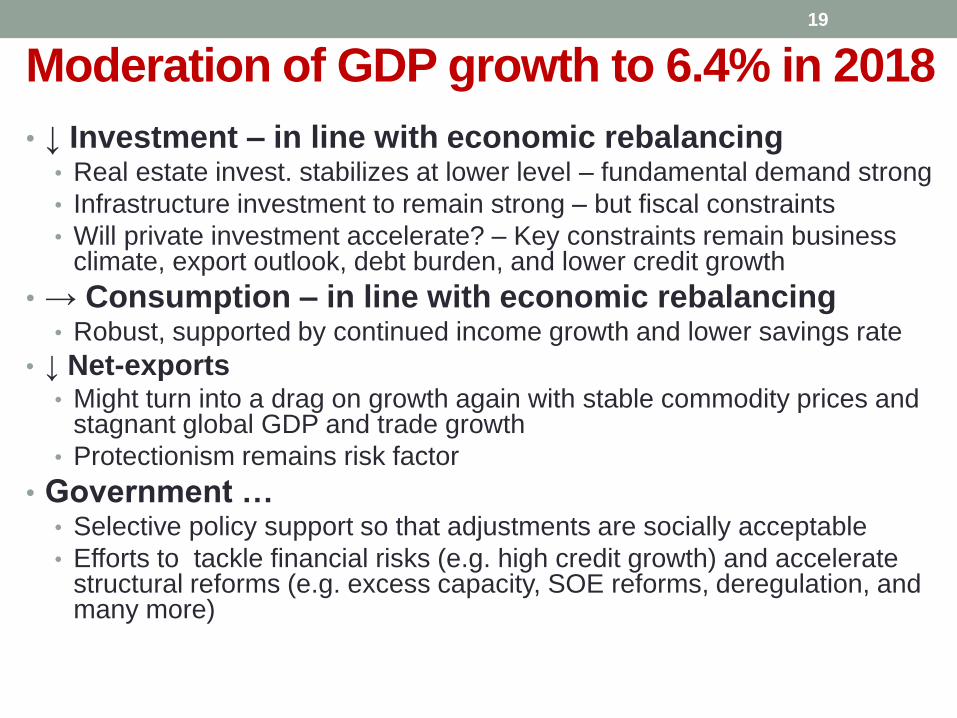
Moderation of GDP growth to 6.4% in 2018
• ↓ Investment – in line with economic rebalancing • Real estate invest. stabilizes at lower level – fundamental demand strong
• Infrastructure investment to remain strong – but fiscal constraints
• Will private investment accelerate? – Key constraints remain business climate, export outlook, debt burden, and lower credit growth
• → Consumption – in line with economic rebalancing• Robust, supported by continued income growth and lower savings rate
• ↓ Net-exports• Might turn into a drag on growth again with stable commodity prices and
stagnant global GDP and trade growth
• Protectionism remains risk factor
• Government … • Selective policy support so that adjustments are socially acceptable
• Efforts to tackle financial risks (e.g. high credit growth) and accelerate structural reforms (e.g. excess capacity, SOE reforms, deregulation, and many more)
19