Embed Size (px)
Citation preview

WORKING CAPITAL MANAGEMENT
Submitted by : Geeti Gourav Pati

What is working capital?
• Working capital is that it is the flow of capital required for the day-to-day running of operations. Generally, the longer the business cycle the more working capital you require.
• Working capital is required to ensure that a firm is able to continue its operations and has sufficient funds to satisfy both maturing short-term debt and upcoming operational expenses.

CONCEPT
• Gross working capital:Gross working capital is the total cash and cash equivalents, that a business has on-hand.
• Net working capital:Net working capital refers to its current assets minus its current liabilities. The result measures the current liquidity of the company and its ability to repay creditors.

OBJECTIVE
• Study the level of current assets and current liabilities year to year basis.
• Study the level of working capital.
• Study the liquidity and profitability position of the company.
• Study the pattern of financing of the company (whether conservative or aggressive).
• Comment on the effectiveness of working capital management with respect to Inventory and receivables management.
TATA MOTORS MARUTI SUZUKI
V/S

TATA MOTORS
1 2 3 4 5 6 7 8 9 100.00
50,000.00
100,000.00
150,000.00
200,000.00
250,000.00
WCSALES

ITR V/S INVENTORY
1 2 3 4 5 6 7 8 9 100.00
2.00
4.00
6.00
8.00
10.00
12.00
14.00
ITR
ITR
1 2 3 4 5 6 7 8 9 100.00
5,000.00
10,000.00
15,000.00
20,000.00
25,000.00
30,000.00
INVENTORY
INVENTORY

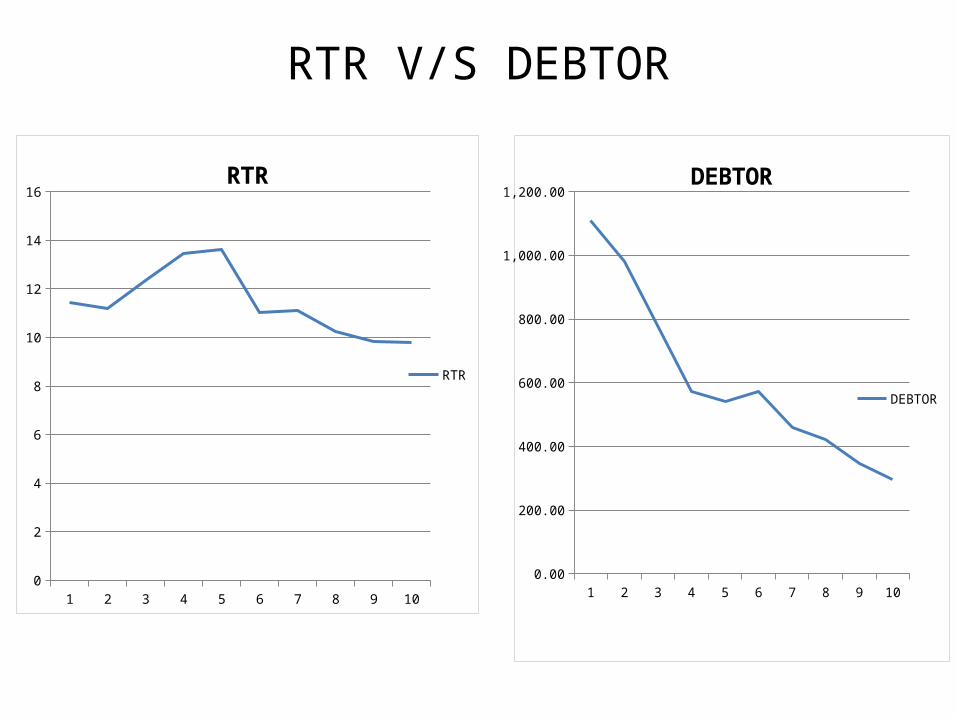
RTR V/S DEBTOR
1 2 3 4 5 6 7 8 9 100
5
10
15
20
25RTR
RTR
1 2 3 4 5 6 7 8 9 100.00
2,000.00
4,000.00
6,000.00
8,000.00
10,000.00
12,000.00DEBTOR
DEBTOR

1 2 3 4 5 6 7 8 9 10
-0.2
0
0.2
0.4
0.6
0.8
1
CRNET PROFIT MARGIN
NET PROFIT MARGIN V/S CR

LIQUDITY V/S PROFITABILITY
1 2 3 4 5 6 7 8 9 100
5000
10000
15000
20000
25000
30000
35000
40000
45000LIQUIDITY
LIQUIDITY
1 2 3 4 5 6 7 8 9 100
0.02
0.04
0.06
0.08
0.1
0.12
0.14
0.16PROFITABILITY
PROFITABILITY

MARUTI SUZUKI
1 2 3 4 5 6 7 8 9 100.00
5,000.00
10,000.00
15,000.00
20,000.00
25,000.00
30,000.00
35,000.00
40,000.00
45,000.00
50,000.00
WCSALES

ITR V/S INVENTORY
1 2 3 4 5 6 7 8 9 100.00
500.00
1,000.00
1,500.00
2,000.00
2,500.00
ITRINVENTORY

RTS V/S DEBTOR
1 2 3 4 5 6 7 8 9 100.00
200.00
400.00
600.00
800.00
1,000.00
1,200.00
1,400.00
1,600.00
RTRDEBTOR

NET PROFIT MARGIN V/S CR
1 2 3 4 5 6 7 8 9 100
0.2
0.4
0.6
0.8
1
1.2
1.4
NET PROFIT MARGINCR

LIQUDITY V/S PROFITABILITY
1 2 3 4 5 6 7 8 9 100
500
1000
1500
2000
2500
3000
3500
4000
PROFITABILITY LIQUIDITY

ASIAN PAINTS AND
BERGER PAINTS

ASIAN PAINTS
1 2 3 4 5 6 7 8 9 10
-4,000.00
-2,000.00
0.00
2,000.00
4,000.00
6,000.00
8,000.00
10,000.00
12,000.00
14,000.00
SALESWORKING CAPITAL

ITR V/S INVENTORY
1 2 3 4 5 6 7 8 9 100
1
2
3
4
5
6
7
8
9 ITR
ITR
1 2 3 4 5 6 7 8 9 100.00
500.00
1,000.00
1,500.00
2,000.00
2,500.00INV
INV
RTR V/S DEBTOR
1 2 3 4 5 6 7 8 9 100
2
4
6
8
10
12
14
16RTR
RTR
1 2 3 4 5 6 7 8 9 100.00
200.00
400.00
600.00
800.00
1,000.00
1,200.00DEBTOR
DEBTOR

NET PROFIT MARGIN V/S CR
1 2 3 4 5 6 7 8 9 100
0.1
0.2
0.3
0.4
0.5
0.6
NET PRO MARGINCR

BERGER PAINTS
1 2 3 4 5 6 7 8 9 10
-500.00
0.00
500.00
1,000.00
1,500.00
2,000.00
2,500.00
3,000.00
3,500.00
4,000.00
4,500.00
SALESWORKING CAPITAL

NET PROFIT MARGIN V/S CR
1 2 3 4 5 6 7 8 9 100
0.2
0.4
0.6
0.8
1
1.2
1.4
1.6
NET PRO MARGINCR

MAHINDRA INDIA AND
BAJAJ AUTO INDIA

MAHINDRA INDIA
1 2 3 4 5 6 7 8 9 10
-10,000.00
0.00
10,000.00
20,000.00
30,000.00
40,000.00
50,000.00
60,000.00
70,000.00
80,000.00
SALES WORKING CAPITAL

NET PROFIT MARGIN V/S CR
1 2 3 4 5 6 7 8 9 100
0.5
1
1.5
2
2.5
NET PRO MARGINCR

NET PROFIT MARGIN V/S CR
1 2 3 4 5 6 7 8 90
0.2
0.4
0.6
0.8
1
1.2
1.4
NET PRO MARGINCR

AIRTEL AND
RELIANCE TELECOM

AIRTEL
1 2 3 4 5 6 7 8 9 10
-35,000.00
-30,000.00
-25,000.00
-20,000.00
-15,000.00
-10,000.00
-5,000.00
0.00
WC
WC
1 2 3 4 5 6 7 8 9 100.00
10,000.00
20,000.00
30,000.00
40,000.00
50,000.00
60,000.00
70,000.00
80,000.00
90,000.00
100,000.00
SALES
SALES

ITR V/S INVENTORY
1 2 3 4 5 6 7 8 9 100
100
200
300
400
500
600
700
800
900
1000
ITRINVENTORY

RTR V/S DEBTOR
1 2 3 4 5 6 7 8 9 100
2
4
6
8
10
12
14
16
RTR
RTR
1 2 3 4 5 6 7 8 9 100.00
1,000.00
2,000.00
3,000.00
4,000.00
5,000.00
6,000.00
7,000.00DEBTOR
DEBTOR

NET PROFIT MARGIN V/S CR
1 2 3 4 5 6 7 8 9 100
0.1
0.2
0.3
0.4
0.5
0.6
NET PROFIT MARGINCR
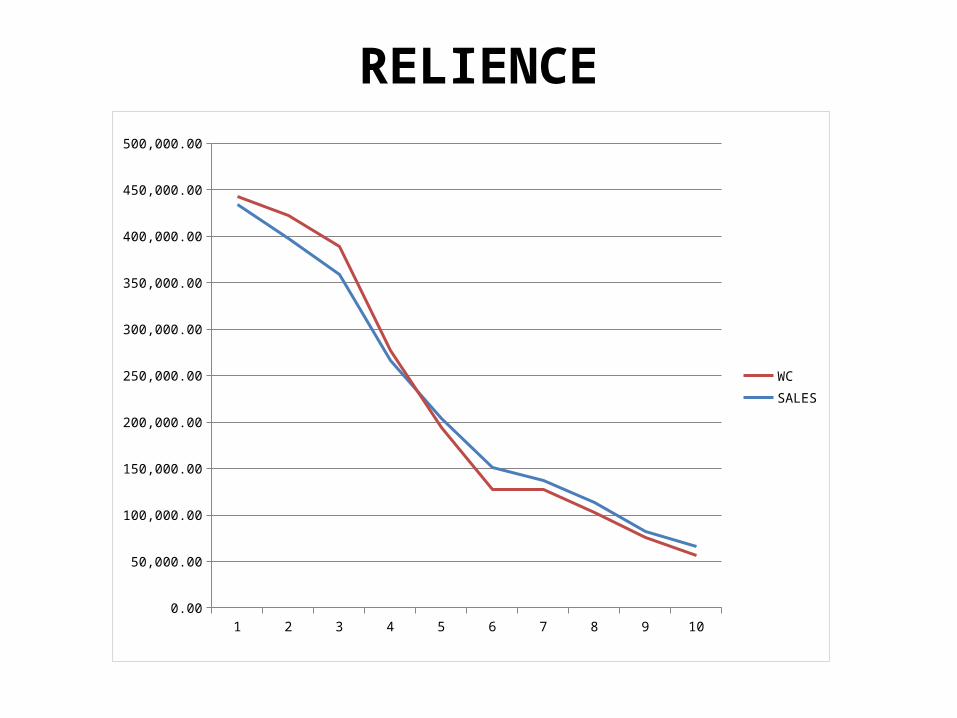
RELIENCE
1 2 3 4 5 6 7 8 9 100.00
50,000.00
100,000.00
150,000.00
200,000.00
250,000.00
300,000.00
350,000.00
400,000.00
450,000.00
500,000.00
WCSALES

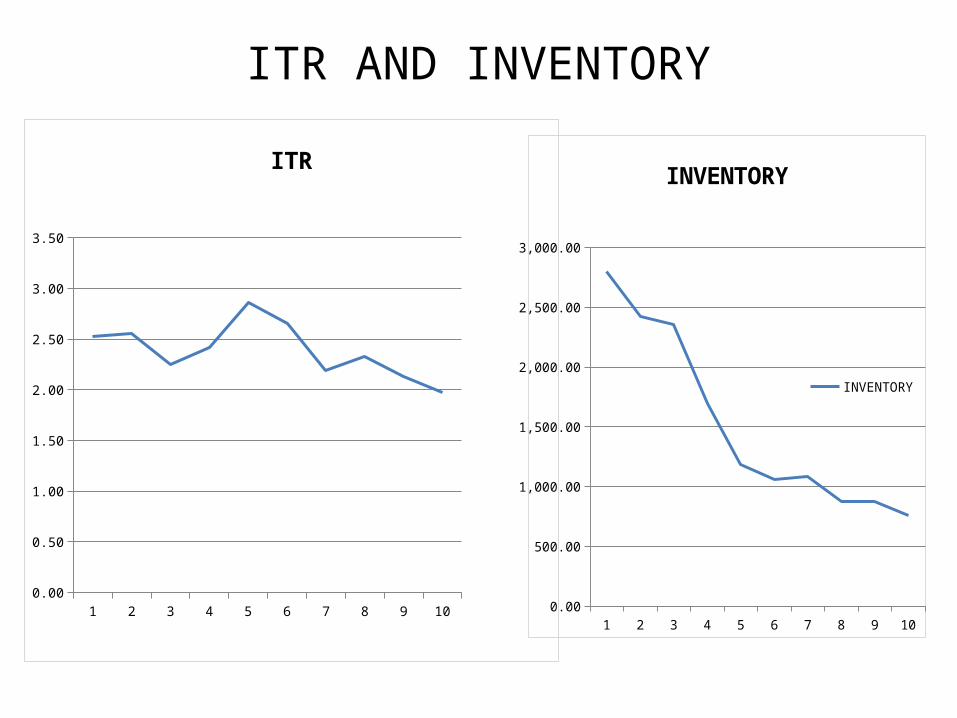
ITR V/s INVENTORY
1 2 3 4 5 6 7 8 9 100.00
10,000.00
20,000.00
30,000.00
40,000.00
50,000.00
60,000.00
INVENTORY
INVENTORY
1 2 3 4 5 6 7 8 9 100
1
2
3
4
5
6
7
8
9
10
ITR
ITR

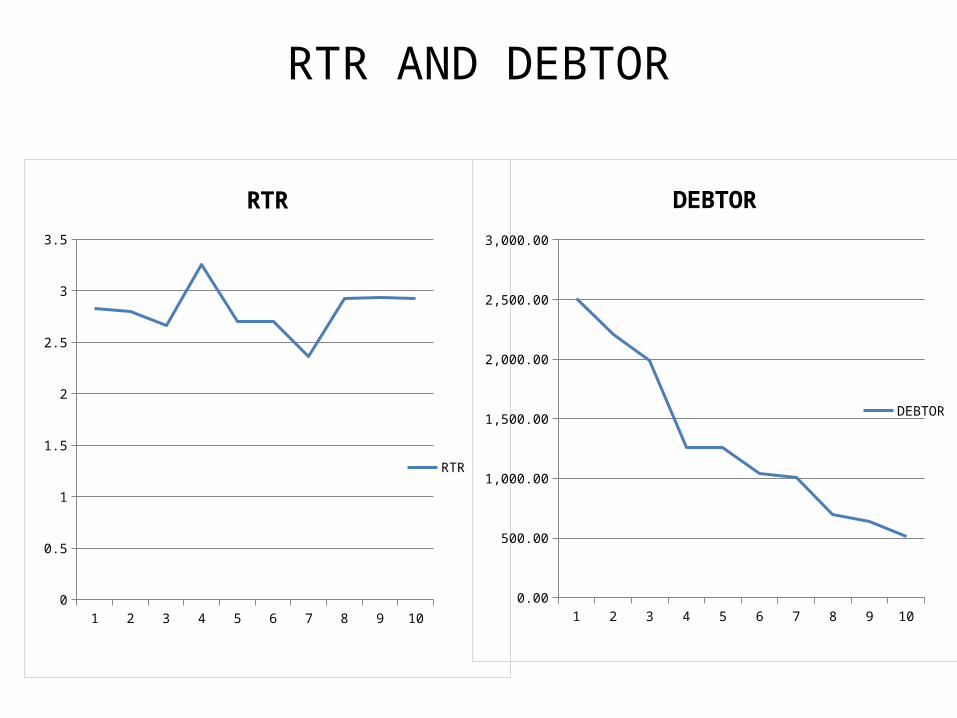
RTR AND DEBTOR
1 2 3 4 5 6 7 8 9 100.00
2,000.00
4,000.00
6,000.00
8,000.00
10,000.00
12,000.00
14,000.00
16,000.00
18,000.00
RTRDEBTOR
1 2 3 4 5 6 7 8 9 100.00
2,000.00
4,000.00
6,000.00
8,000.00
10,000.00
12,000.00
14,000.00
16,000.00
18,000.00
DEBTOR
DEBTOR

Dabur and
P&G

DABUR
1 2 3 4 5 6 7 8 9 100.00
1,000.00
2,000.00
3,000.00
4,000.00
5,000.00
6,000.00
7,000.00
8,000.00
9,000.00
WCSALES

ITR AND INVENTORY
1 2 3 4 5 6 7 8 9 100.00
1.00
2.00
3.00
4.00
5.00
6.00
7.00
8.00
9.00
10.00ITR
ITR
1 2 3 4 5 6 7 8 9 100
200
400
600
800
1000
1200INVENTORY
INVENTORY

RTR AND DEBTOR
1 2 3 4 5 6 7 8 9 100
100
200
300
400
500
600
700
800
DEBTORRTR

CR AND NET PROFIT MARGIN
1 2 3 4 5 6 7 8 9 100
0.2
0.4
0.6
0.8
1
1.2
1.4
1.6
1.8
CRNET PROFIT MARGIN

P&G
1 2 3 4 5 6 7 8 9 10
-10,000.00
-8,000.00
-6,000.00
-4,000.00
-2,000.00
0.00
2,000.00
4,000.00
6,000.00
8,000.00
SALESWC
ITR AND INVENTORY
1 2 3 4 5 6 7 8 9 100.00
0.50
1.00
1.50
2.00
2.50
3.00
3.50
ITR
ITR
1 2 3 4 5 6 7 8 9 100.00
500.00
1,000.00
1,500.00
2,000.00
2,500.00
3,000.00
INVENTORY
INVENTORY
RTR AND DEBTOR
1 2 3 4 5 6 7 8 9 100
0.5
1
1.5
2
2.5
3
3.5
RTR
RTR
1 2 3 4 5 6 7 8 9 100.00
500.00
1,000.00
1,500.00
2,000.00
2,500.00
3,000.00
DEBTOR
DEBTOR

NET PROFIT MARGIN AND CR
1 2 3 4 5 6 7 8 9 10
-0.5
0
0.5
1
1.5
2
CRNET PROFIT MARGIN

CONCLUSION
Thus working capital management is the most prominent function of the company because it wakeup the firms operations for long term or short term purpose. Cash on hand is not a big deal but proper utilization of the capital becomes the overcome of all the issues faced by the company.

THANK YOU