Embed Size (px)
DESCRIPTION
Part 2 of Valuation for Beginners. A presentation which gives you extensive insight in valuation techniques, like mulitple valuation both on comparable companies as well as comparable transactions, leverage buy-out, working capital. In addition, it explains the importance of interest bearing debt calculations. See also: Valuation for Beginners - Check Mate! > Part 1 Author: Eva Hukshorn, EFactor
Citation preview

Valuation for Beginners – check mate again
Authors: Eva Hukshorn, Hein Verloop, ABN AMRO / RBS

Agenda
Session 1: • Introduction • Introduction to value • Basic accounting • Discounted Cash Flow valuation
Session 2: • Multiples valuation • Leveraged Buy Out valuation • Capita Selecta • Conclusion

We aim to understand a range of valuation techniques – Company X
Indicative and preliminary valuation range of EUR 1.9 billion to EUR 2.1 billion at this early stage of due diligence
EV EV/EBITDA 2006
1.8b - 2.2b 9.5x - 11.5x
1.9b - 2.1b 10.0x - 11.0x
1.8b - 2.3n 9.4x - 12.2x
1.5b - 1.7b 7.9x - 9.0x
Indicative, preliminary valuation range
1,400 1,600 1,800 2,000 2,200 2,400
CCA
DCF
LBO
CTA
In EUR million

We focused on Discounted Cash Flow…
i.e. we need some basic understanding of accounting
To understand cash flows, we also need to understand the profit & loss statement and the balance sheet
To understand Free Cash Flows, we need to understand cash flows
In order to derive to a Discounted Cash Flow, we need to develop an understanding about discounting (WACC) and about Free Cash Flows
We applied a ‘bottom-up’ approach is assessing DCF

...and by now understand the DCF overview
Notes: 1) including non-operating investments 2) including underfunded pension plans
Enterprise value is the equivalent of Value of Operations
= input = output
MV of interest-
bearing debt
MV of minority interests
Corporate value
MV of financial
fixed assets1
Value of Operations
Free Cash Flow
WACC
Terminal value
Equity value
MV of other financial liabilities2
MV preferred equity
Excess cash & marketable
securities
B/S
P&L
Cash Flow
Accounting

Background on net debt and other adjustments

Net interest bearing debt
Net interest bearing debt = Interest bearing debt - Cash
Net interest bearing debt is also known as Financial net debt
Generally:
short- and long-term interest bearing debt: • Loans • Bonds • Notes • Commercial paper • Overdrafts • Redeemable preference
shares • Finance leases • Convertibles • Interest rate swaps
Generally:
cash and cash equivalents: • Marketable securities • current assets held for
sale Short-term deposits • Commercial paper • Treasury bills

Adjustments to Net interest bearing debt (NIBD)
Adjusted NIBD to cater for limitations of Financial net debt • Financial NIBD : IBD - Cash • Adjusted NIBD : IBD + other debt like items – Cash
Adjustments - when do we use them? • Mostly used during high-level execution analyses
Adjustments serve to identify potential claims other than straight debt • Other debt like items are usually not easy to recognise and have to be derived through additional
calculations (check “Notes to financial statements” in Annual Reports)

Some examples of other debt like items
• Pension adjustments for under- (or over-)funded pension liabilities – Underfunded pension plans in some case represent very significant liabilities – Only applicable for Defined Benefit plans, not for Defined Contribution plans
• Operating (and rental) lease obligations – Future lease payments could be considered as debt. NPV of future obligation should be added to
IBD
• Industry specific Long-term liabilities – E.g. nuclear decommissioning liabilities for energy companies
All items above have an impact on a company’s total debt. Be aware interest is paid to compensate debt providers. Equally, implied interest shall be payable for above items. Implied interest should be added to EBITDA and EBIT!

Other debt-like items
• Other debt-like items could be: – Bank overdrafts – Tax accruals – Assets due to financial liabilities – Employee stock options – Preferred equity – Golden parachutes – Other debt / semi - equity instruments – Potential claims – Contingent liabilities – Litigation – Provisions – Other liabilities
All debt-like items can be included in net debt under certain circumstances. Including or excluding items should be consistent throughout the peer group in comparable analyses

2 Multiples valuation
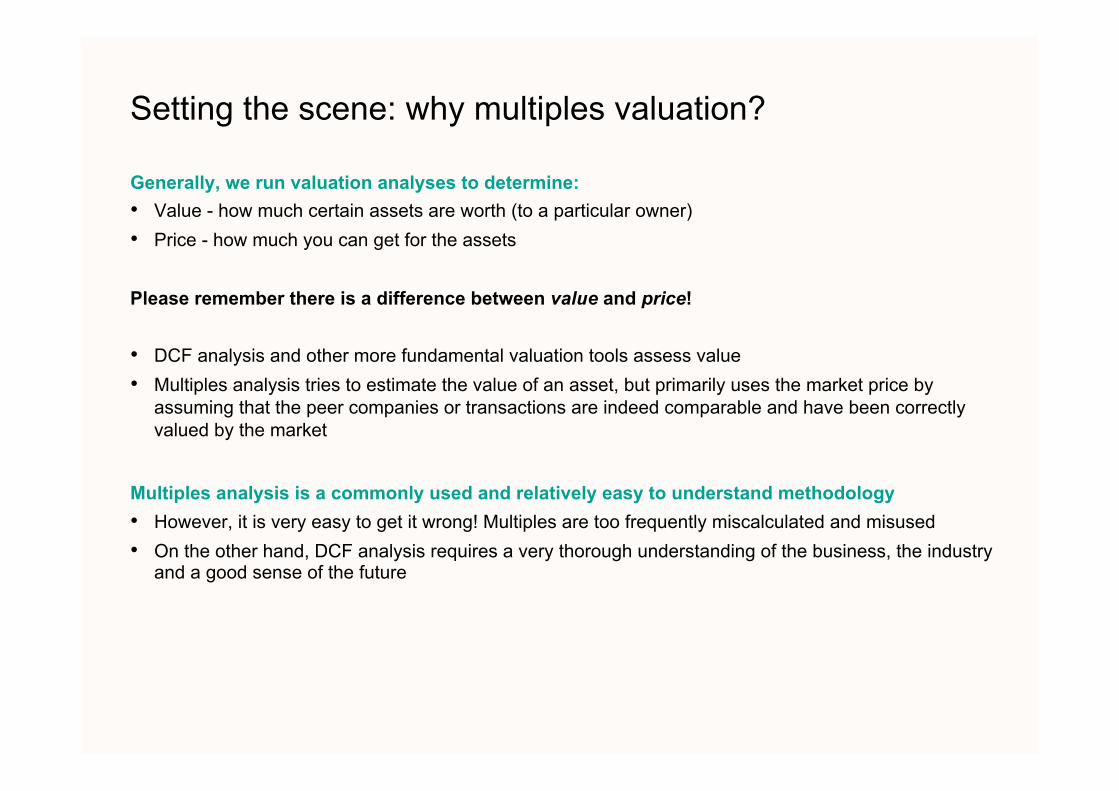
Setting the scene: why multiples valuation?
Generally, we run valuation analyses to determine: • Value - how much certain assets are worth (to a particular owner) • Price - how much you can get for the assets Please remember there is a difference between value and price! • DCF analysis and other more fundamental valuation tools assess value • Multiples analysis tries to estimate the value of an asset, but primarily uses the market price by
assuming that the peer companies or transactions are indeed comparable and have been correctly valued by the market
Multiples analysis is a commonly used and relatively easy to understand methodology • However, it is very easy to get it wrong! Multiples are too frequently miscalculated and misused • On the other hand, DCF analysis requires a very thorough understanding of the business, the industry
and a good sense of the future

Advantages and issues of multiples valuation compared to a DCF valuation Advantages • Fewer explicit assumptions required • Sensitive to market movements: allows comparison to recent market and transaction evidence • Easy to understand • Analysis can be carried out relatively quickly (although this is not always the case)
Issues • Assumes comparables are correctly valued: no value gaps exist for any peer, nor the company being
valued • Can be misinterpreted easily, easy to think you have understood • Subjective
– easy to influence the outcome through composition of peer group and selective interpretation of outputs
– wide range of multiples can “support” nearly any presumed value
Theoretically: DCF is the preferred methodology

Comparable Company Analysis

Comparable company analysis - introduction
• Main purposes of the Comparable Companies Analysis (‘CCA’) are:
1. to estimate the value of a non-listed company 2. to compare listed companies in one industry (relative valuation)
• Often used alongside the stand-alone DCF as sanity check
• Other purpose CCA: Sum-of-the-Parts (SOTP) analysis – Business units with different characteristics should not be valued through an overall comparable
analysis
• It’s a comparison of peers AT THIS MOMENT IN TIME!

Step 1: Peer selection
Peer selection criteria • Similarity of product mix • Geographical spread of business • Comparable financial ratios such as ‘sales growth’
– companies that seem very similar in terms of the business they conduct, can still show deviations in their multiples
• Financial ratio analysis can help filter out the right peers – Be mindful that peers may be similar in their operations, but under or outperform other peers
representative of the specific industry – Analyse where the target ranks
• Clear outliers can be excluded, e.g. companies in financial distress
Position your target within the peer group you selected!

Step 2: Collecting financials
Market data • Current share price • Number of shares outstanding (including dilution) • Net debt (and all its components)
Accounting data for last available reporting years • P&L and Balance Sheet
Forecast data for at least two to three forecast years • Forecast of Income Statement; available in analyst reports (“Research”)
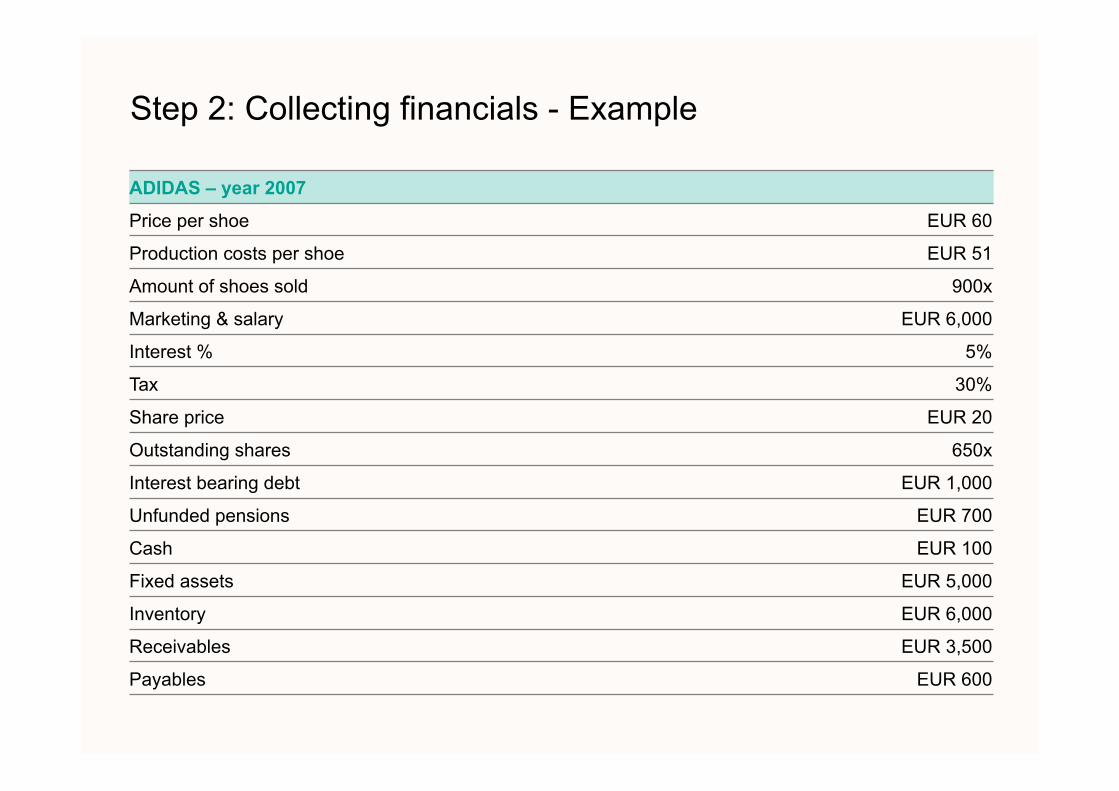
ADIDAS – year 2007
Price per shoe EUR 60
Production costs per shoe EUR 51
Amount of shoes sold 900x
Marketing & salary EUR 6,000
Interest % 5%
Tax 30%
Share price EUR 20
Outstanding shares 650x
Interest bearing debt EUR 1,000
Unfunded pensions EUR 700
Cash EUR 100
Fixed assets EUR 5,000
Inventory EUR 6,000
Receivables EUR 3,500
Payables EUR 600
Step 2: Collecting financials - Example

X EUR Adidas
Sales xx
COGS xx
Gross margn xx
SG&A xx
EBIT xx
Interest xx
PBT xx
Tax xx
Net profit xx
Step 2: Collecting financials – Example (cont’d)

Step 2: Collecting financials – Example (cont’d)
X EUR Adidas
Sales 54,000
COGS 45,900
Bruto Winst 8,100
SG&A 6,000
EBIT 2,100
Interest 50
EBT 2,050
Tax 615
Net profit 1,435

Step 2: Collecting financials – Example (cont’d)
ACTIVA (= DEBET) PASSIVA (= CREDIT)
Fixed assets: XXX Equity XXX
Current Assets: XXX Liabilities XXX
Total Activa XXX Total Equity + Liabilities XXX
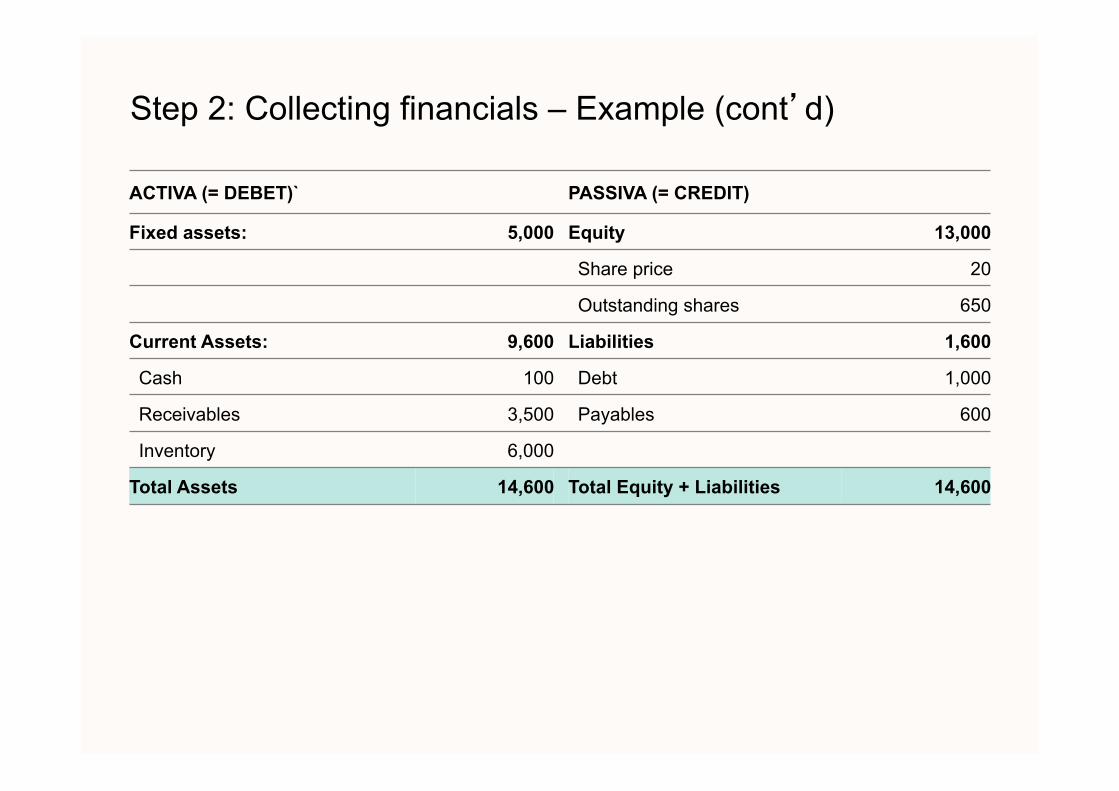
Step 2: Collecting financials – Example (cont’d) ACTIVA (= DEBET)` PASSIVA (= CREDIT)
Fixed assets: 5,000 Equity 13,000
Share price 20
Outstanding shares 650
Current Assets: 9,600 Liabilities 1,600
Cash 100 Debt 1,000
Receivables 3,500 Payables 600
Inventory 6,000
Total Assets 14,600 Total Equity + Liabilities 14,600

Notes: 1) including non-operating investments 2) including underfunded pension plans
Step 3: Calculating multiples – Enterprise value
MV of financial fixed assets 1
Excess cash & marketable securities
MV of interest-bearing debt
MV of minority interests
Equity value
MV of other financial liabilities 2
MV preferred equity
+
+
+
+
Enterprise value –
–

Step 3: Calculating multiples
Year 2007 Adidas
Enterprise Value xx
Sales xx
EBIT xx
Sales multiple xx
EBIT multiple xx
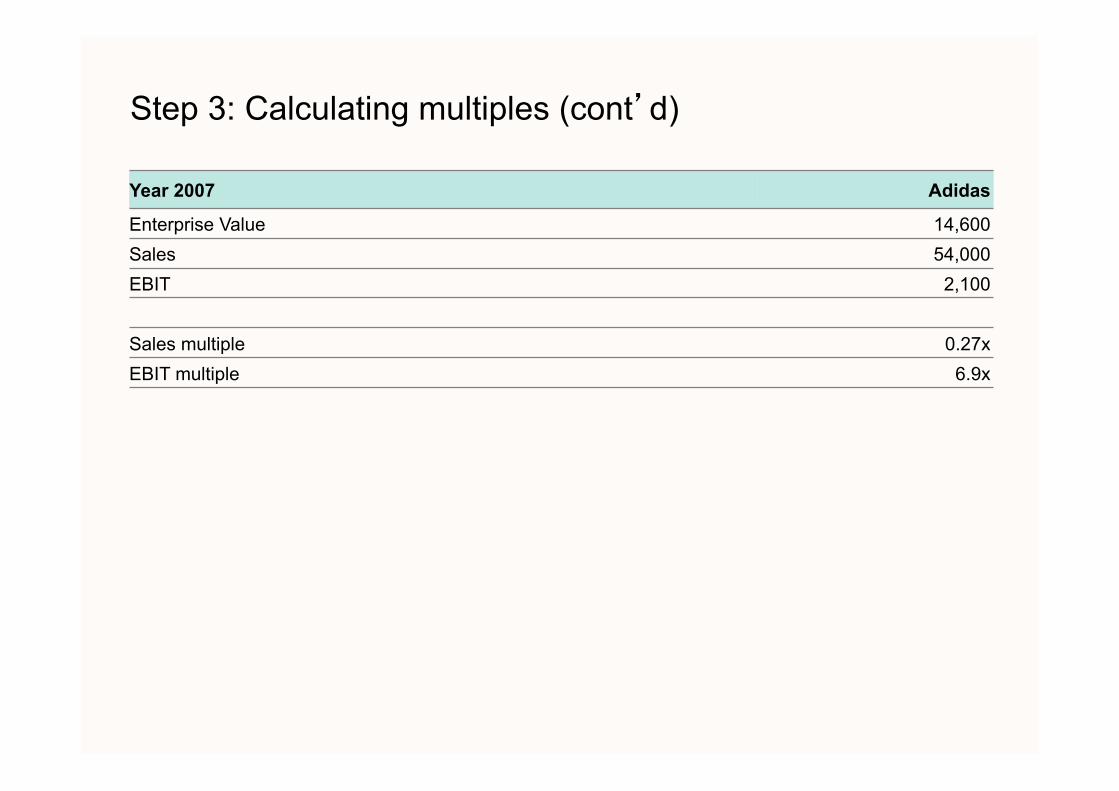
Step 3: Calculating multiples (cont’d)
Year 2007 Adidas
Enterprise Value 14,600 Sales 54,000 EBIT 2,100
Sales multiple 0.27x EBIT multiple 6.9x
EBITDA OpFCFCAGR CAGR05 - 08 2005 2006 2007 2008 05 - 08 2005 2006 2007 2008
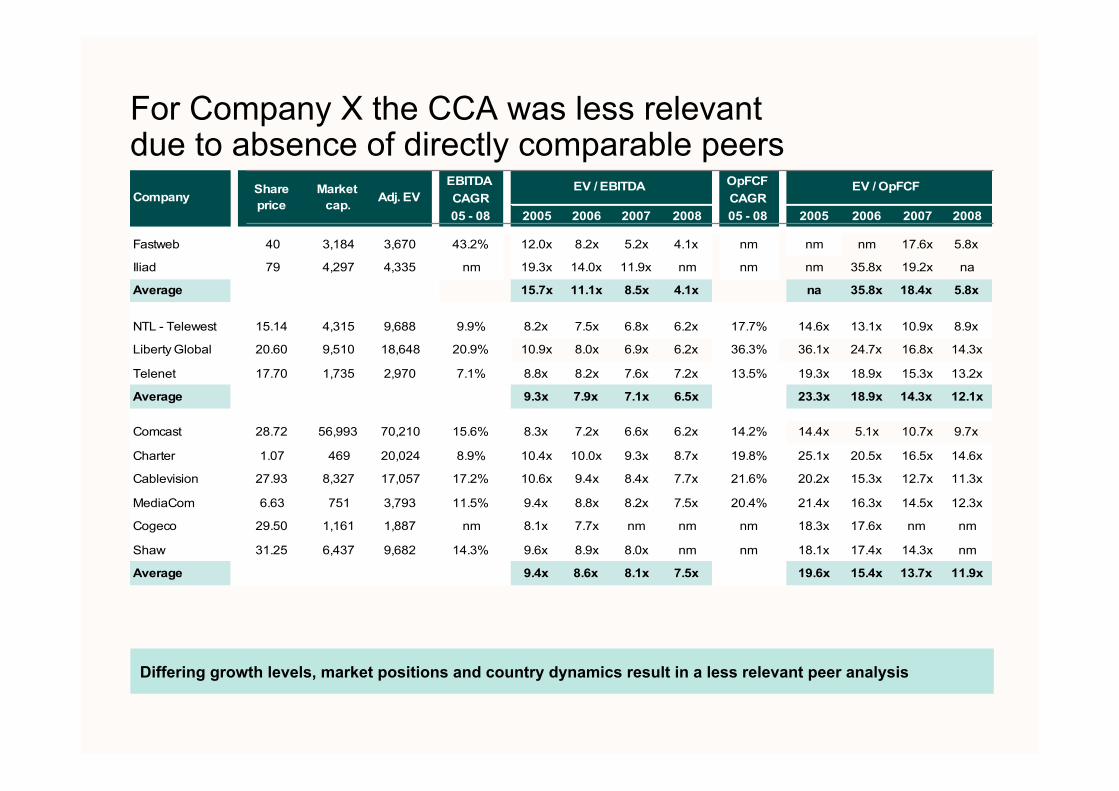
Fastweb 40 3,184 3,670 43.2% 12.0x 8.2x 5.2x 4.1x nm nm nm 17.6x 5.8x
Iliad 79 4,297 4,335 nm 19.3x 14.0x 11.9x nm nm nm 35.8x 19.2x na
Average 15.7x 11.1x 8.5x 4.1x na 35.8x 18.4x 5.8x
NTL - Telewest 15.14 4,315 9,688 9.9% 8.2x 7.5x 6.8x 6.2x 17.7% 14.6x 13.1x 10.9x 8.9x
Liberty Global 20.60 9,510 18,648 20.9% 10.9x 8.0x 6.9x 6.2x 36.3% 36.1x 24.7x 16.8x 14.3x
Telenet 17.70 1,735 2,970 7.1% 8.8x 8.2x 7.6x 7.2x 13.5% 19.3x 18.9x 15.3x 13.2x
Average 9.3x 7.9x 7.1x 6.5x 23.3x 18.9x 14.3x 12.1x
Comcast 28.72 56,993 70,210 15.6% 8.3x 7.2x 6.6x 6.2x 14.2% 14.4x 5.1x 10.7x 9.7x
Charter 1.07 469 20,024 8.9% 10.4x 10.0x 9.3x 8.7x 19.8% 25.1x 20.5x 16.5x 14.6x
Cablevision 27.93 8,327 17,057 17.2% 10.6x 9.4x 8.4x 7.7x 21.6% 20.2x 15.3x 12.7x 11.3x
MediaCom 6.63 751 3,793 11.5% 9.4x 8.8x 8.2x 7.5x 20.4% 21.4x 16.3x 14.5x 12.3x
Cogeco 29.50 1,161 1,887 nm 8.1x 7.7x nm nm nm 18.3x 17.6x nm nm
Shaw 31.25 6,437 9,682 14.3% 9.6x 8.9x 8.0x nm nm 18.1x 17.4x 14.3x nm
Average 9.4x 8.6x 8.1x 7.5x 19.6x 15.4x 13.7x 11.9x
Casema 18.3% 54.4%
EV / OpFCFCompany Share
priceMarket
cap. Adj. EVEV / EBITDA
For Company X the CCA was less relevant due to absence of directly comparable peers
Differing growth levels, market positions and country dynamics result in a less relevant peer analysis
Comparable Transaction Analysis

Comparable Transaction Analysis - introduction
• The Comparable Transactions Analysis (‘CTA’) model follows logic of CCA (difference: historic vs. forward looking inputs)
• Often used alongside the stand-alone DCF
• It’s a comparison of transactions THROUGH OUT HISTORY!

What are comparable transactions?
• In accordance with the comparable companies model, the criteria are: – Transactions with similar geographical spread of business – Transactions with similar product mix – Transactions with similar deal size (10 mln. vs. 1 bln.) – Comparable financial ratios (exclude companies in financial distress) – Time frame (I.e. Internet 1 year & steel company 5 years back)
• Advantage CTA: it puts a market value on non-listed companies, and is indicative of exit premiums paid in take-overs
• Disadvantage CTA: lack of comparable transactions or data
• Little data equates to little meaning

CTA - Example
Adidas Nike
Company sold in year 2004 2006
Selling price: EUR 15,000 EUR 1,4000
Sales 2007 EUR 54,000 EUR 65,000
Sales 2006 EUR 50,000 EUR 63,000
Sales 2005 EUR 48,000 EUR 61,000
Sales 2004 EUR 45,000 EUR 58,000
EBIT 2007 EUR 2,100 EUR 1,500
EBIT 2006 EUR 2,000 EUR 1,700
EBIT 2005 EUR 1,900 EUR 1,200
EBIT 2004 EUR 1,800 EUR 1,100
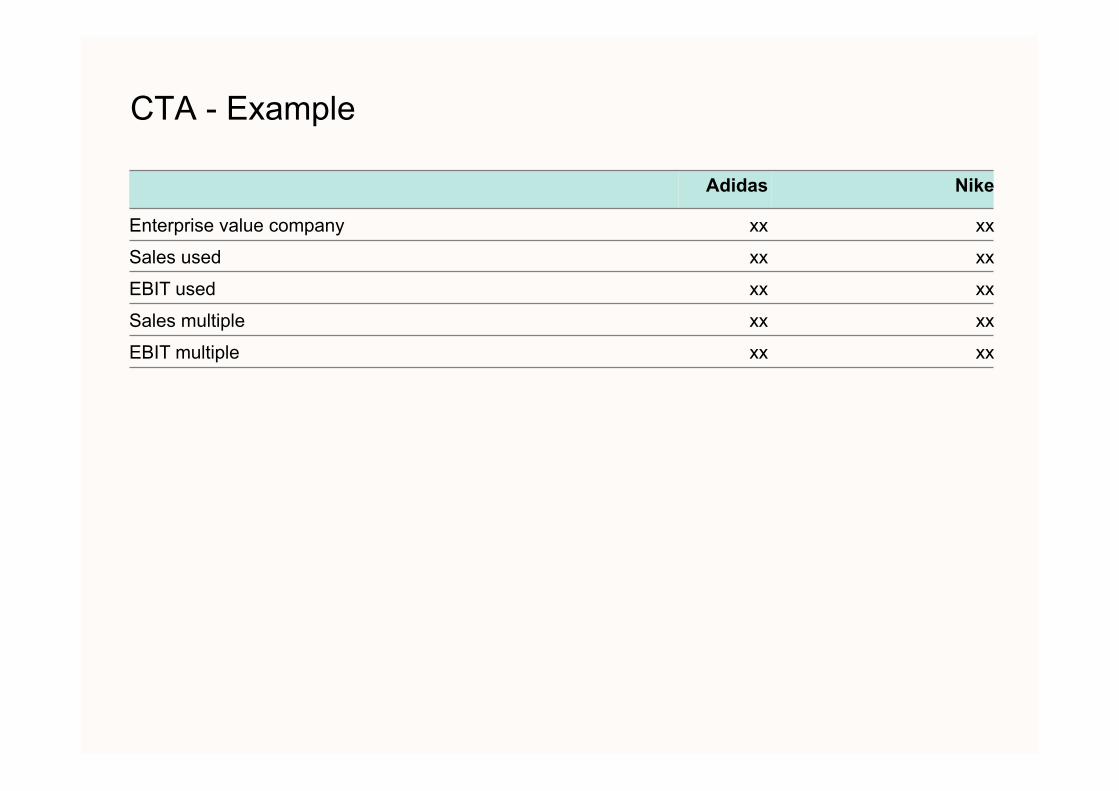
CTA - Example
Adidas Nike
Enterprise value company xx xx
Sales used xx xx
EBIT used xx xx
Sales multiple xx xx
EBIT multiple xx xx
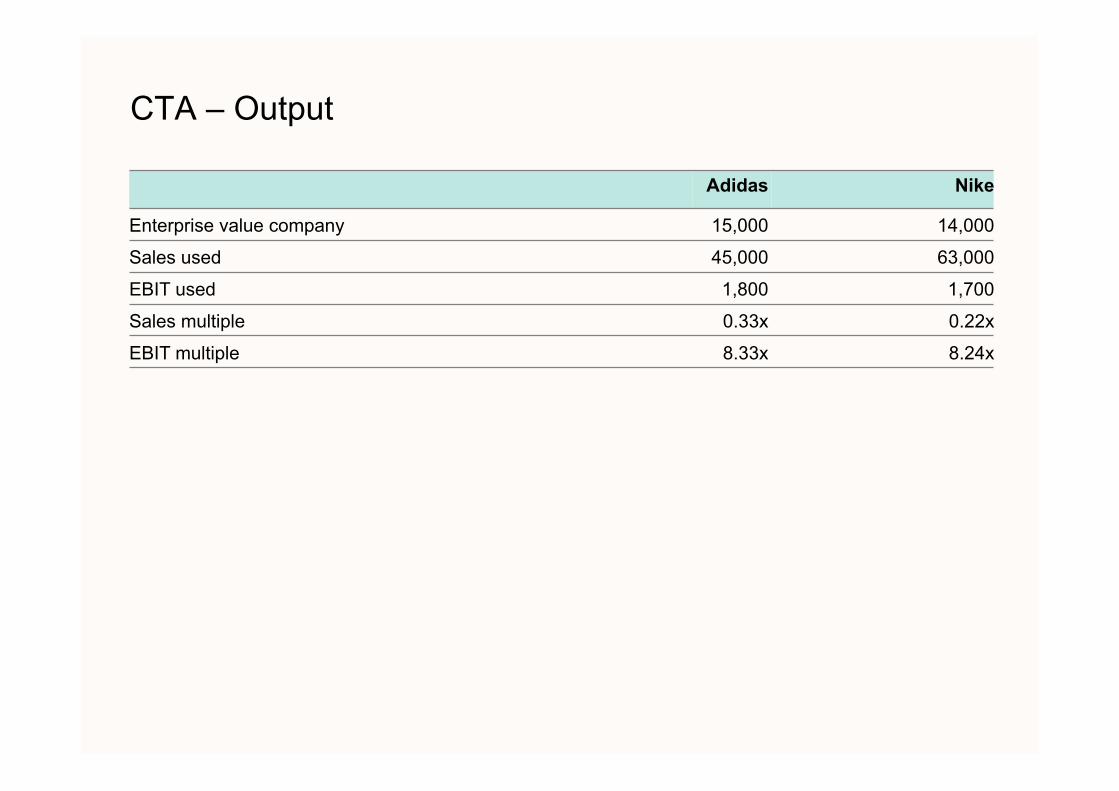
CTA – Output
Adidas Nike
Enterprise value company 15,000 14,000
Sales used 45,000 63,000
EBIT used 1,800 1,700
Sales multiple 0.33x 0.22x
EBIT multiple 8.33x 8.24x

Company X CTA indicates 9.5 – 11.5x 2006 EBITDA
Comparable transactions imply a valuation range of EUR 1.8bn to EUR 2.2bn
Date Acquirer Target Currency Enterprise Value EBITDA CAGRmillion Historic Forward Historic Forward 05-'07
2006 transactions
05-Apr-06 Carlyle/Providence UPC Sverige EUR 349 4.7x na 9.3x na 21.7%23-Mar-06 Altice/Cinven UPC France EUR 1,250 na na 11.4x na n/a07-Feb-06 Sonaecom-SGPS, SA PT Multimedia EUR 2,896 4.6x 4.3x 14.8x 13.3x n/a
Average 4.6x 4.3x 11.8x 13.3x 21.7%Median 4.6x 4.3x 11.4x 13.3x 21.7%
2005 transactions
19-Dec-05 Candover UPC Norway EUR 445 4.7x 4.0x 12.2x 10.2x 19.5%08-Dec-05 Providence KDG EUR 3,200 3.2x na 8.6x 8.0x n/a08-Dec-05 Mid Europa Partners Aster City EUR 410 6.6x na 13.2x 11.1x n/a05-Dec-05 Carlyle/Providence ComHem EUR 1,105 6.6x 5.4x 18.1x 14.2x 36.1%05-Dec-05 Alethia/AA Capital EWT EUR 675 na na na 7.5x n/a17-Nov-05 Cinven (consortium) AlticeOne EUR 525 7.0x 6.0x 12.7x 10.1x 21.2%06-Oct-05 Warburg Pincus Multikabel EUR 515 6.0x na 10.2x 8.7x n/a03-Oct-05 NTL (merger) Telewest GBP 3,446 2.8x 2.1x 6.7x 6.5x 6.0%30-Sep-05 Liberty Global Inc Cablecom CHF 4,536 6.2x 5.3x 14.3x 12.8x 16.0%29-Jul-05 Ono Auna EUR 2,250 1.9x 1.7x 14.0x 8.1x n/a22-Jul-05 Liberty Global Inc Astral USD 405 na na na 7.8x n/a09-May-05 UnitedGlobalCom NTL Group (Ireland) EUR 325 3.0x na na 8.6x n/a14-Mar-05 Iesy/Apollo Ish NRW EUR 1,550 na 3.8x na 8.4x n/a
Average 4.8x 4.0x 12.2x 9.4x 19.8%
Median 5.3x 4.0x 12.7x 8.6x 19.5%
Highlighted most comparable transactions Average 5.9x 5.2x 12.8x 11.2x 22.9%Median 6.1x 5.4x 12.4x 10.2x 21.2%
Implied EBITDA (2006) multiples: Casema EUR 9.5x 10.3x 10.4x 11.2x 19.9%
EV/Revenue EV/EBITDA

4 Leveraged Buy Out valuation

4a Introduction

Immediate causes for a Leveraged Buyout
• Business is considered to be non core by the mother company
• Underperformance of the business under current ownership
• Retirement of owner / manager leading to succession issue
• Investment cycle of current owner is ending (secondary / tertiary buyouts)
• Shareholder Pressure in the case of listed companies
LBO – VALUATION: • Debt is cheaper than equity • Calculate the maximum affordable consideration by financial sponsor given a certain return
e.g Internal Rate of Retunr (IRR)

First calculate target’s debt capacity which results from forecasted financials (bankers case)
+ +
Maximum debt capacity
Debt financing + Forecasted cash flows
Historic financials Bankers’ case Covenants

Second, the return for equity providers can be calculated depending on equity structure & consideration
Internal Rate of Return
+ Forecasted financials Equity structure Consideration Exit multiple + +

4b What really happens

Shareholder structure
General structure of LBO: shareholder structure
Remarks • Equity providers (sponsor and management)
together form an acquisition vehicle NewCo which makes the offer for the target
• Management might hold 5-15% of ordinary shares and will be expected to invest 1-2x annual salary / bonus depending on “pain level”
• NewCo is a clean vehicle and often set up in a tax-friendly jurisdiction
Private Equity (ordinaries:
85-95%)
Management (ordinaries:
5-15%)
Newco
TARGET
100%
100%
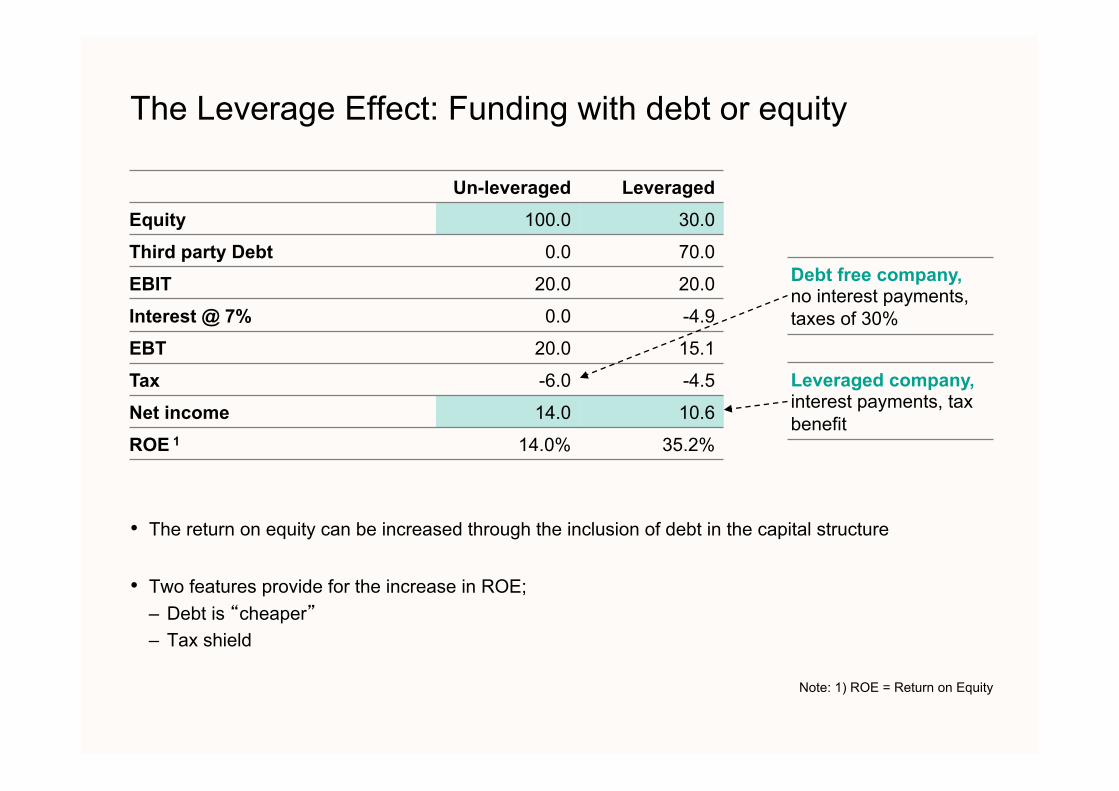
Un-leveraged Leveraged Equity 100.0 30.0
Third party Debt 0.0 70.0
EBIT 20.0 20.0
Interest @ 7% 0.0 -4.9
EBT 20.0 15.1
Tax -6.0 -4.5
Net income 14.0 10.6
ROE 1 14.0% 35.2%
The Leverage Effect: Funding with debt or equity
• The return on equity can be increased through the inclusion of debt in the capital structure
• Two features provide for the increase in ROE; – Debt is “cheaper” – Tax shield
Note: 1) ROE = Return on Equity
Debt free company, no interest payments, taxes of 30%
Leveraged company, interest payments, tax benefit

A risk reward trade-off
Notes: For example revolver, capex- and/or acquisition facility 1) Pricing of vendor and shareholder loan typically not in line with the risk-profile
2) Shareholder loan will be discussed under LBO equity funding
Introduction to LBO debt financing: overview of instruments
Return
Risk
Senior Bank Debt (Term loan A / Facilities1)
Stretch / Institutional Senior (Term loan B and C)
Second lien
Mezzanine
PIK / PIYC Notes
High yield bonds/notes
Vendor/shareholder loan2
Senior debt
(50-55%)
Subordinated debt
(20-25%)
Quasi- equity3
(25-30%)

Typical debt structuring
Introduction to LBO debt financing: debt structuring
Debt funding: • NewCo and target is funded
with debt (65-75%) and equity (25-35%)
• Subordinated debt primarily used for goodwill financing of NewCo
• Senior debt will be pushed down to OpCo’s as much as possible because collateral / security is in OpCo’s
• Maximum debt levels at NewCo to be guaranteed by OpCo’s is subject to legal restrictions (free distributable reserves of OpCo’s)
NewCo
Senior Debt
Subordinated Debt
100%
100%
Senior A/B/C Facilities
Private Equity (85-95%)
Management (5-15%)
OPCO’s

4c basic calculations

Internal Rate of Return (IRR)
• IRR is that rate of return at which the NPV of an investment equals zero • Compounded average growth rate at which your cash flows grow every year • In LBO’s, IRR is the most important return measure for equity investors
So if IRR represents the discount rate at which investment = return e.g no profit is made, 2 questions are raised: 1. On what are you making a profit then? 2. Why calculate an IRR?
Year 0 1 2 3 4 Cash flow (400) 110 121 133 146 Discounted at (1+IRR)^0 (1+IRR)^1 (1+IRR)^2 (1+IRR)^3 (1+IRR)^4
1.00 1.10 1.21 1.33 1.46 PV (Cash flow) (400) 100 100 100 100 NPV 0 IRR 10%

1. On what are you making a profit then?
– In the DCF you have created you have assumed in what direction the future cash flows will go – Based on that you have calculated an Enterprise value – Now translate this into a multiple
• This is called your ENTRY MULTIPLE, e.g the multipe against which you buy the company
• Your EXIT MULTIPLE is the multiple against which you expect to sell the business in 2-6 years
• If you translate this back again into an Enterprise value than your profit is the difference between the Enterprise value you bought the company for AND the Enterprise value against which you sell the company for

2. Why calculate an IRR?
4
4
Case 1 2008 2009 2010 2011 2012 EBITDA 100 110 121 133 146 IRR 10.0% 10.0% 10.0% 10.0% PV cash flow 100 100 100 100 Enterprise value 2007 400 NPV 0 Calculated entry multiple 4.0x = ( 400 / 100) Estimated exit multiple 4.0x Enterprise value 2011 584 = ( 4 * 146) Profit 184 = 584 - 400
Case 2 2008 2009 2010 2011 2012 EBITDA 100 130 169 220 286 IRR 30.0% 30.0% 30.0% 30.0% PV cash flow 100 100 100 100 Enterprise value 2007 400 NPV 0 Calculated entry multiple 4.0x = ( 400 / 100) Estimated exit multiple 4.0x Enterprise value 2011 1,144 = ( 4 * 286) Profit 744 = 1,144 - 400
The higher the IRR, the higher your EBITDA will be after 2-6 years, the higher the absolute amount you will receive for the business
4d What about management?

Management incentive program - Envy ratio
• Success of a buy-out depends largely on the quality and commitment of management
• Management is therefore offered / required to participate in the Buy-out
• As an incentive, management is offered the opportunity to invest at a discount compared to the Financial Sponsor
• This sweetener is expressed in a ratio - the Envy ratio (the higher this is, the more beneficial the offer to management)
Envy between management and financial buyer
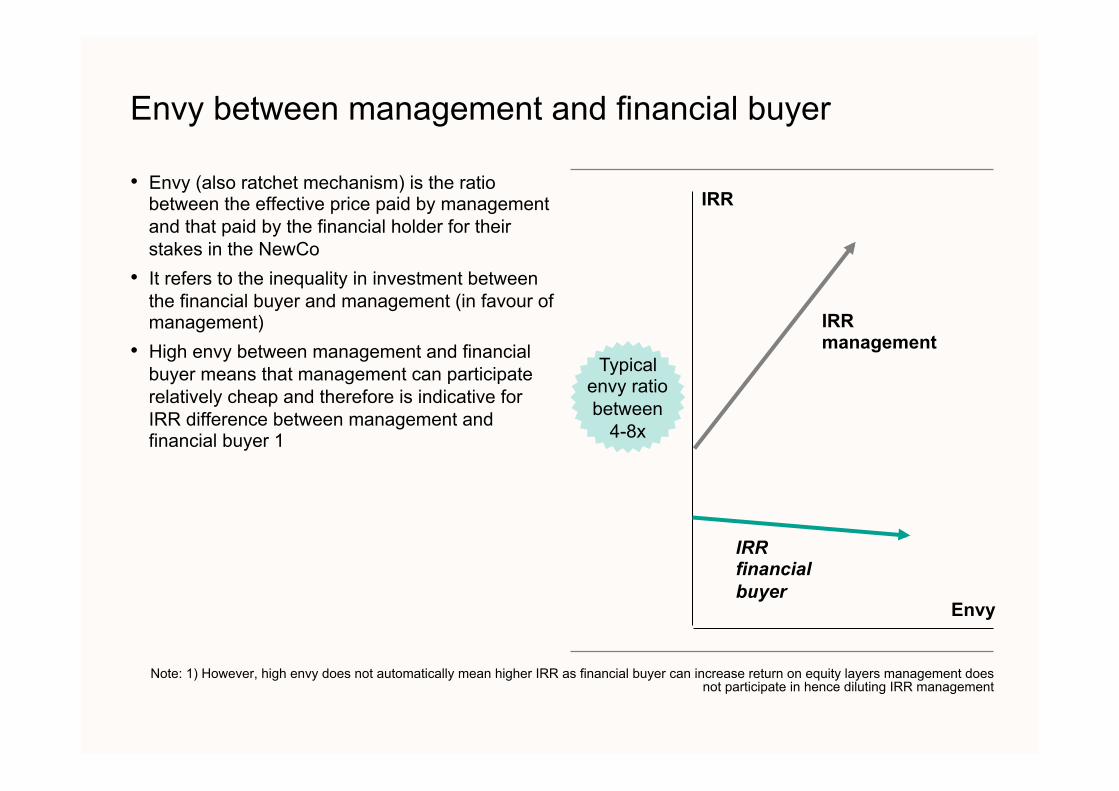
• Envy (also ratchet mechanism) is the ratio between the effective price paid by management and that paid by the financial holder for their stakes in the NewCo
• It refers to the inequality in investment between the financial buyer and management (in favour of management)
• High envy between management and financial buyer means that management can participate relatively cheap and therefore is indicative for IRR difference between management and financial buyer 1
Note: 1) However, high envy does not automatically mean higher IRR as financial buyer can increase return on equity layers management does not participate in hence diluting IRR management
Envy
IRR management
IRR financial buyer
IRR
Typical envy ratio between
4-8x

Example of envy-calculation
Envy ratio - example
In a flat priced deal, the envy on the ordinary shares is 1.0
Management Investment Percentage Financial buyer Investment Percentage
Ordinary shares EUR 3.0 10% Ordinary
shares EUR 27.0 90%
Preferred shares EUR 5.0 5% Preferred
shares EUR 95.0 95%
Shareholder loan EUR 200.0 100%
Total EUR 8.0 Total EUR 322.0
ENVY ordinary shares 1.0x ENVY ordinaries plus prefs 1.7x ENVY total equity contribution 4.5x
Management is offered the opportunity to invest in the equity at 4.5x more favorable terms than the financial buyer
5 Capita Selecta

5a Introduction
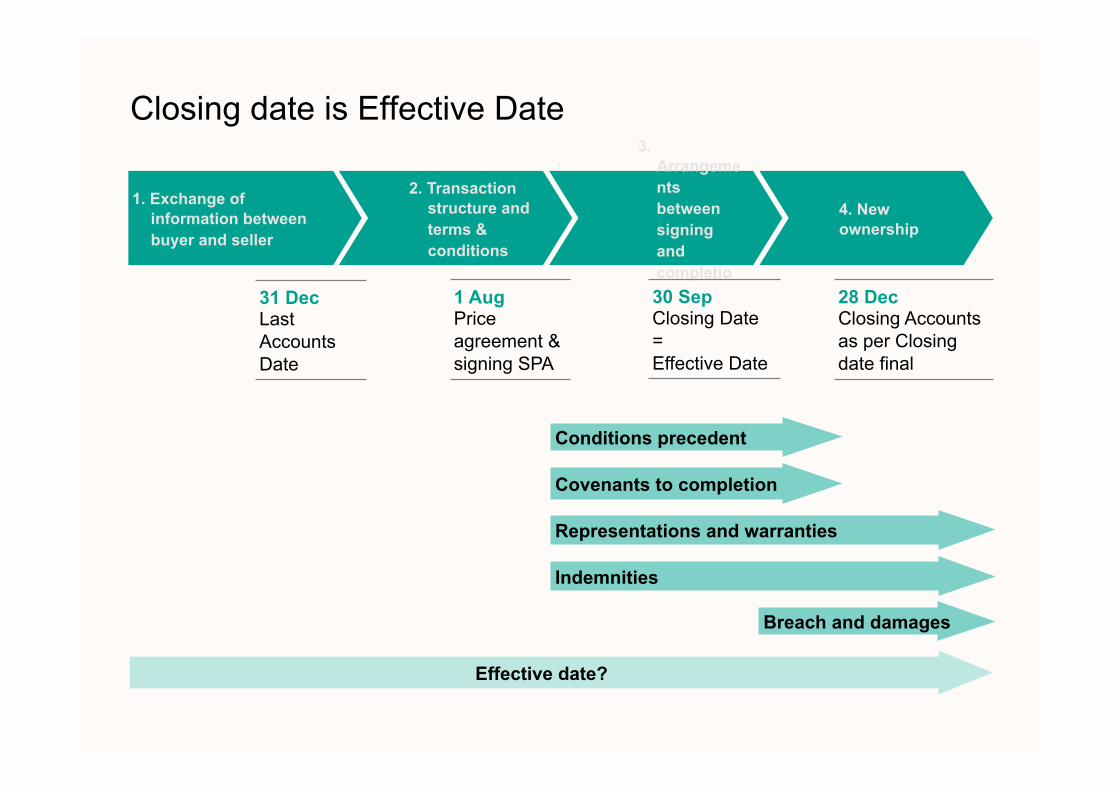
Closing date is Effective Date
2. Transaction structure and terms & conditions
4. New ownership
3. Arrangements between signing and completion
1. Exchange of information between buyer and seller
Conditions precedent
Covenants to completion
Representations and warranties
Indemnities
Breach and damages
Effective date?
31 Dec Last Accounts Date
1 Aug Price agreement & signing SPA
30 Sep Closing Date = Effective Date
28 Dec Closing Accounts as per Closing date final

How to get to a target price…
• The buyer makes assumptions on the assets and the cash flows of the company both historically as well as in the future
• Based on this it will create a fundamental model (DCF)
• In addition, it will do a “sanity check” using multiple analysis
• The above will lead to the so-called target price
HOWEVER: • The only information available at signing are the last audited accounts, management estimates and
budgets
Purchase Price Adjustments: Why?
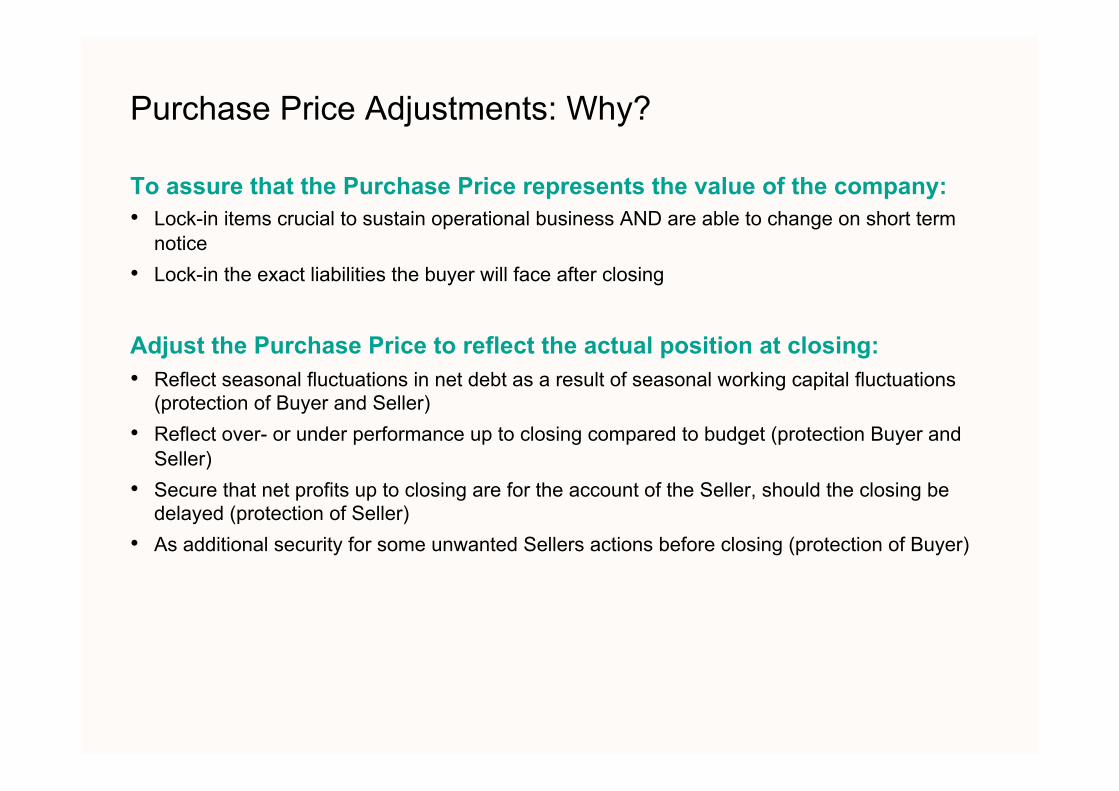
To assure that the Purchase Price represents the value of the company: • Lock-in items crucial to sustain operational business AND are able to change on short term
notice • Lock-in the exact liabilities the buyer will face after closing
Adjust the Purchase Price to reflect the actual position at closing: • Reflect seasonal fluctuations in net debt as a result of seasonal working capital fluctuations
(protection of Buyer and Seller) • Reflect over- or under performance up to closing compared to budget (protection Buyer and
Seller) • Secure that net profits up to closing are for the account of the Seller, should the closing be
delayed (protection of Seller) • As additional security for some unwanted Sellers actions before closing (protection of Buyer)

How does this work?
Equity Value offer • In case of an Equity Value offer, the purchase price to be paid is not influenced by changes in the net
debt or working capital, but only by changes in the book value of the equity as per effective date
Enterprise Value offer
• The purchase prices for the shares is in theory calculated as: – The Enterprise Value is an amount which is agreed upon as a fixed price based on certain
working capital assumptions – The net debt can change over time and is influenced by a changing level of working capital as per
effective date
Enterprise Value a Net Debt b – Other adjustments c +/- Equity Value X

Leading to terms and conditions in the SPA
• Although the offer price will be negotiated, it is generally subject to the following financing conditions: – working capital mechanism, normal working capital level – working capital definitions (what is included, what is the basis and how to avoid disputes) – Performance relative to budget – net debt definitions (what is included) – other
• Terms and conditions will be negotiated in the SPA

5b Working capital
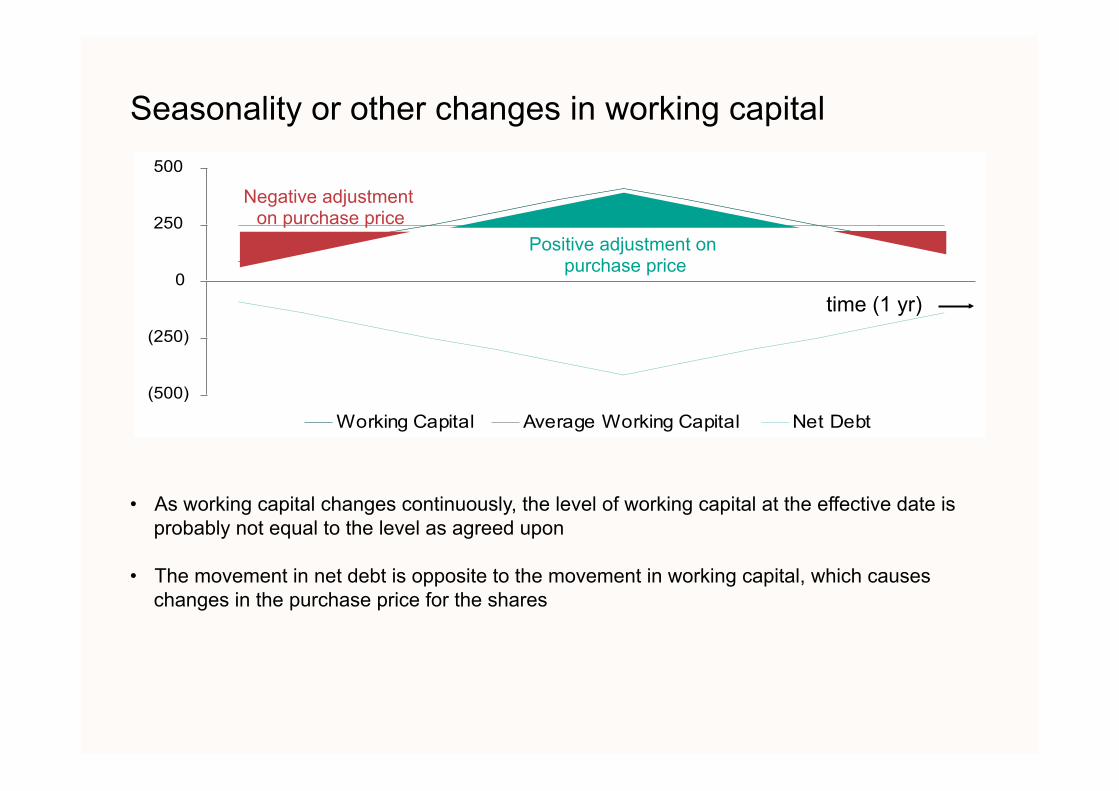
Seasonality or other changes in working capital
• As working capital changes continuously, the level of working capital at the effective date is probably not equal to the level as agreed upon
• The movement in net debt is opposite to the movement in working capital, which causes changes in the purchase price for the shares
(500)
(250)
0
250
500
Working Capital Average Working Capital Net Debt
time (1 yr)
Negative adjustment on purchase price
Positive adjustment on purchase price
The impact of working capital…
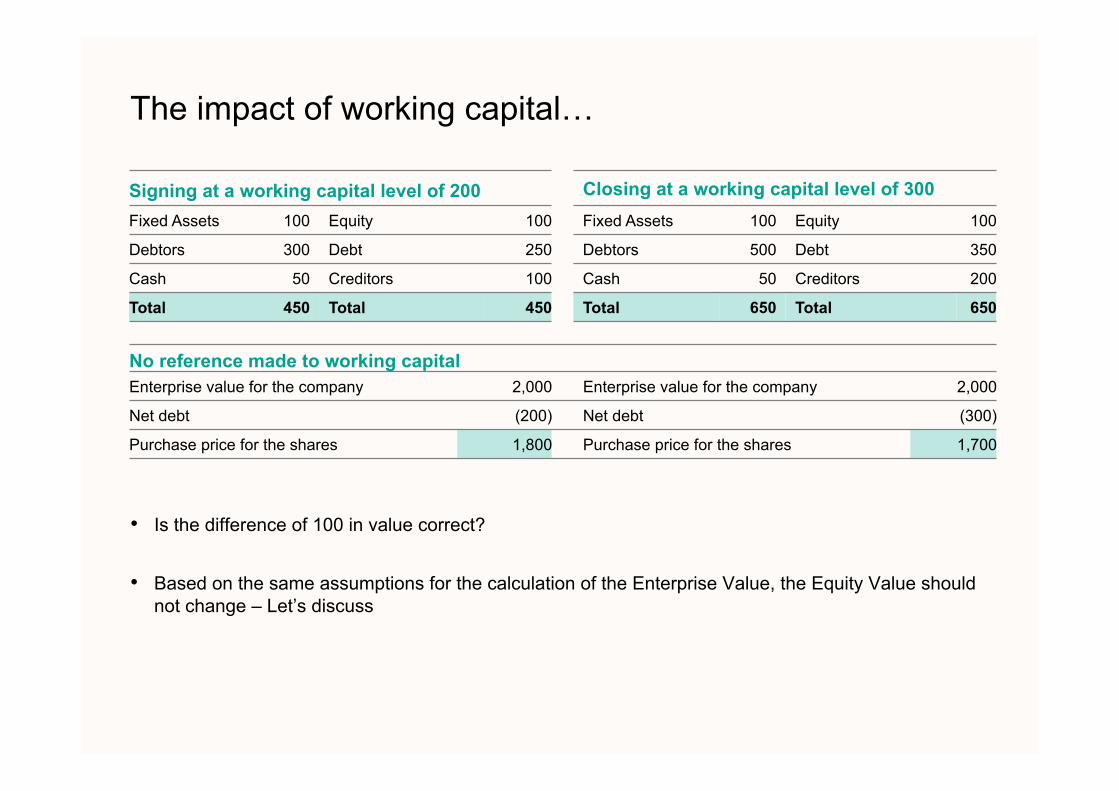
• Is the difference of 100 in value correct?
• Based on the same assumptions for the calculation of the Enterprise Value, the Equity Value should not change – Let’s discuss
Signing at a working capital level of 200 Closing at a working capital level of 300 Fixed Assets 100 Equity 100 Fixed Assets 100 Equity 100
Debtors 300 Debt 250 Debtors 500 Debt 350
Cash 50 Creditors 100 Cash 50 Creditors 200
Total 450 Total 450 Total 650 Total 650
No reference made to working capital Enterprise value for the company 2,000 Enterprise value for the company 2,000
Net debt (200) Net debt (300)
Purchase price for the shares 1,800 Purchase price for the shares 1,700

…demonstrates the importance to make agreements on the working capital level
• Enterprise Value and (base) working capital are interrelated and therefore should be agreed upon simultaneously during negotiations
• The base working capital assumption used in calculating the Enterprise Value should be agreed upon together with the Enterprise Value as part of the deal
0
100
200
300
400
500
year 0 year 1 year 2 year 3 year 4
Working Capital level year end Base Working CapitalWorking Capital movement
Adjustments should be made for any deviations from the assumptions

Date of acquisition Date of acquisition
Movement of working capital
• Although working capital can be stable throughout the year, it is more likely that the working capital level will fluctuate within a year
• Secondly, a seller can pro-actively influence the working capital level just to increase the purchase price for the shares (for example ask clients to pay their bills earlier, reduce the inventory or postpone payments to suppliers)
0
50
100
150
200
250
300
350
year 0 year 1Working Capital level year endWorking Capital movementBase Working Capital
Date of acquisition
0
50
100
150
200
250
300
350
year 0 year 1Working Capital level year endWorking Capital movementBase Working Capital

Pre-agreement on WC level solves the issues
• To have a reference to the working capital level prevents the buyer from any (unwanted) actions by the seller to adjust the net debt level and consequently the purchase price
• Normal business related fluctuations in working capital level will also be adjusted for • Disputes can arise in case definitions of working capital are not clear: provide (and negotiate) clear
definitions
Signing at a working capital level of 200 Closing at a working capital level of 300 Fixed Assets 100 Equity 100 Fixed Assets 100 Equity 100
Debtors 300 Debt 250 Debtors 500 Debt 350
Cash 50 Creditors 100 Cash 50 Creditors 200
Total 450 Total 450 Total 650 Total 650
No reference made to working capital Enterprise value for the company 2,000 Enterprise value for the company 2,000
Net debt (200) Net debt (300)
Actual WC -/- reference WC (50) Actual WC -/- reference WC 50
Purchase price for the shares 1,750 Purchase price for the shares 1,750

5c Net debt
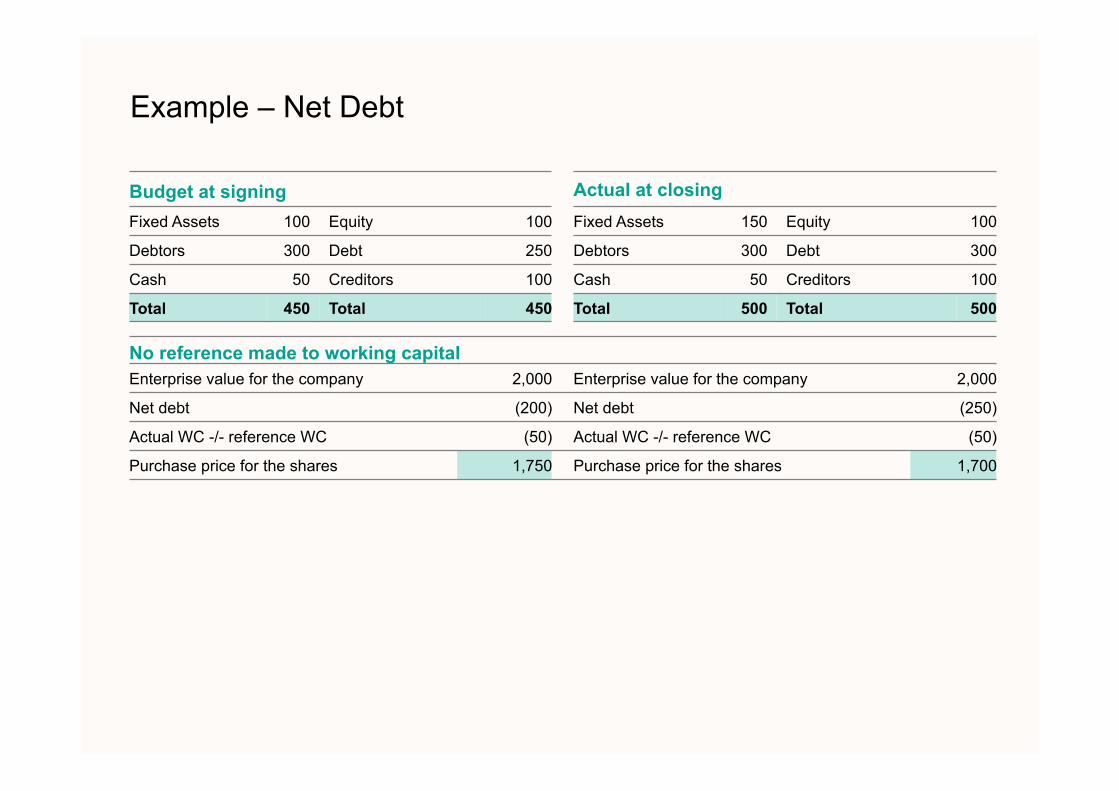
Example – Net Debt
Budget at signing Actual at closing Fixed Assets 100 Equity 100 Fixed Assets 150 Equity 100
Debtors 300 Debt 250 Debtors 300 Debt 300
Cash 50 Creditors 100 Cash 50 Creditors 100
Total 450 Total 450 Total 500 Total 500
No reference made to working capital Enterprise value for the company 2,000 Enterprise value for the company 2,000
Net debt (200) Net debt (250)
Actual WC -/- reference WC (50) Actual WC -/- reference WC (50)
Purchase price for the shares 1,750 Purchase price for the shares 1,700
5d Performance relative to budget

Performance relative to budget
• The Buyer will want cash net profits earned over and above the budget before Closing to be for his account
• The Seller will want the shortfall of cash net profits earned to be for the account of the Buyer • This is covered on a Euro-for-Euro basis if actual (net) debt at closing is deducted from a fixed
enterprise value
Budget at signing Actual at closing Fixed Assets 100 Equity 100 Fixed Assets 100 Equity 130
Debtors 300 Debt 250 Debtors 300 Debt 220
Cash 50 Creditors 100 Cash 50 Creditors 100
Total 450 Total 450 Total 450 Total 450
Reference made to working capital of 250 Enterprise value for the company 2,000 Enterprise value for the company 2,000
Net debt (200) Net debt (170)
Actual WC -/- reference WC (50) Actual WC -/- reference WC (50)
Purchase price for the shares 1,750 Purchase price for the shares 1,780

Performance relative to budget
• A more aggressive way of dealing with over- or under performance up to closing would be to adjust the Enterprise Value using multiples, based on the actual profitability realized up to closing (e.g EBITDA or EBIT)
• Note that this is a far more aggressive way of adjusting the purchase price, especially if the period on which one bases itself is short
– If a period of less than a year is at hand, make sure to use multiples proportionally – For example: if the EBITDA multiple is 8 and the period over which the performance is measured
is 3 months the EBITDA multiple would be 32 (!)

5c Unwanted sellers’ actions

Unwanted sellers’ actions
• In principle, pre-closing covenants deal with unwanted Seller’s actions
• Nonetheless, purchase price adjustment mechanisms can provide a backstop to some of these actions
• Examples: – Paying out 50 million in dividends – Accelerated collecting of 100 million in debtors – Stop paying creditors for a benefit of 100 million – Stop the budgeted 50 million in investments
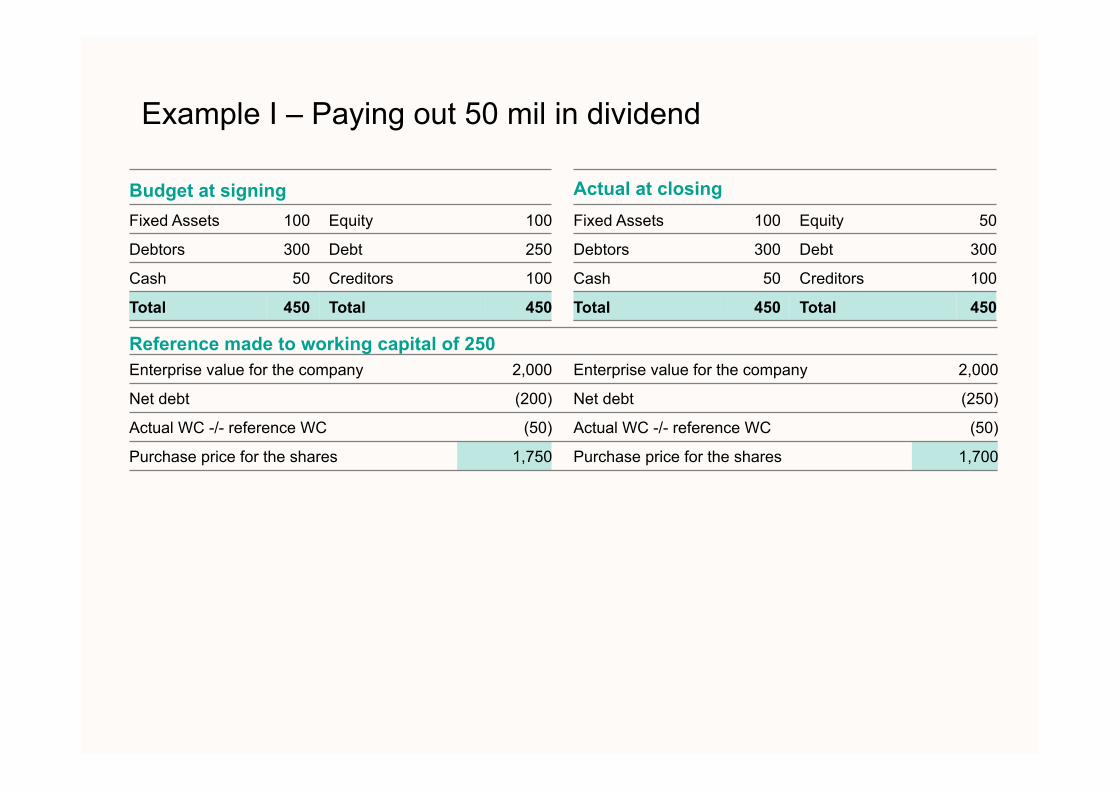
Example I – Paying out 50 mil in dividend
Budget at signing Actual at closing Fixed Assets 100 Equity 100 Fixed Assets 100 Equity 50
Debtors 300 Debt 250 Debtors 300 Debt 300
Cash 50 Creditors 100 Cash 50 Creditors 100
Total 450 Total 450 Total 450 Total 450
Reference made to working capital of 250 Enterprise value for the company 2,000 Enterprise value for the company 2,000
Net debt (200) Net debt (250)
Actual WC -/- reference WC (50) Actual WC -/- reference WC (50)
Purchase price for the shares 1,750 Purchase price for the shares 1,700

Example II – Accelerated collecting of EUR 100m in debtors Budget at signing Actual at closing Fixed Assets 100 Equity 100 Fixed Assets 100 Equity 100
Debtors 300 Debt 250 Debtors 200 Debt 150
Cash 50 Creditors 100 Cash 50 Creditors 100
Total 450 Total 450 Total 350 Total 350
Reference made to working capital of 250 Enterprise value for the company 2,000 Enterprise value for the company 2,000
Net debt (200) Net debt (100)
Actual WC -/- reference WC (50) Actual WC -/- reference WC (150)
Purchase price for the shares 1,750 Purchase price for the shares 1,750

Budget at signing Actual at closing Fixed Assets 100 Equity 100 Fixed Assets 50 Equity 100
Debtors 300 Debt 250 Debtors 300 Debt 200
Cash 50 Creditors 100 Cash 50 Creditors 100
Total 450 Total 450 Total 400 Total 400
Reference made to working capital of 250 Enterprise value for the company 2,000 Enterprise value for the company 2,000
Net debt (200) Net debt (150)
Actual WC -/- reference WC (50) Actual WC -/- reference WC (50)
Purchase price for the shares 1,750 Purchase price for the shares 1,800
Example III – Stop paying creditors for a benefit of EUR 100m

Budget at signing Actual at closing Fixed Assets 100 Equity 100 Fixed Assets 100 Equity 100
Debtors 300 Debt 250 Debtors 300 Debt 150
Cash 50 Creditors 100 Cash 50 Creditors 200
Total 450 Total 450 Total 450 Total 450
Reference made to working capital of 250 Enterprise value for the company 2,000 Enterprise value for the company 2,000
Net debt (200) Net debt (100)
Actual WC -/- reference WC (50) Actual WC -/- reference WC (150)
Purchase price for the shares 1,750 Purchase price for the shares 1,750
Example IV – Stop the budgeted EUR 50m investments

Unwanted sellers’ actions (cont’d)
Stop the budgeted EUR 5m in investments • Buyer is not protected with a simple (net) debt and reference working capital adjustment • Possible (additional) protection mechanisms:
– Keep the period between signing and closing as short as possible – Don’t allow the seller to be able to postpone the closing – Pre-closing covenants (ordinary course of business); – Pre-closing covenants (seller to procure to make investments); – Adjust on reference fixed assets (as well as all reference working capital and (net) debt)

5d Other

Delay or postponing of closing
• The Buyer will want cash net profits earned before Closing to be for his account
• This is covered on a Euro-for-Euro basis if actual (net) debt at closing is deducted from a fixed enterprise value in the contract
5e Adjustments
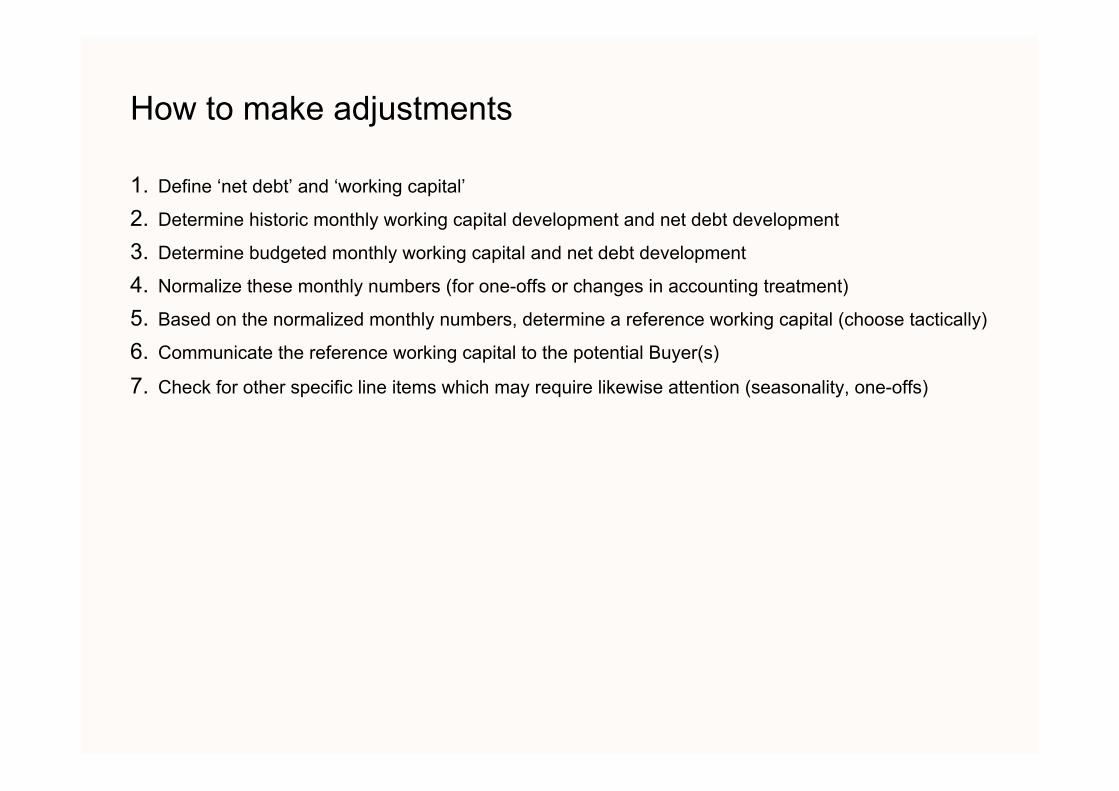
How to make adjustments
1. Define ‘net debt’ and ‘working capital’
2. Determine historic monthly working capital development and net debt development
3. Determine budgeted monthly working capital and net debt development
4. Normalize these monthly numbers (for one-offs or changes in accounting treatment)
5. Based on the normalized monthly numbers, determine a reference working capital (choose tactically)
6. Communicate the reference working capital to the potential Buyer(s)
7. Check for other specific line items which may require likewise attention (seasonality, one-offs)

6 Role financial advisor
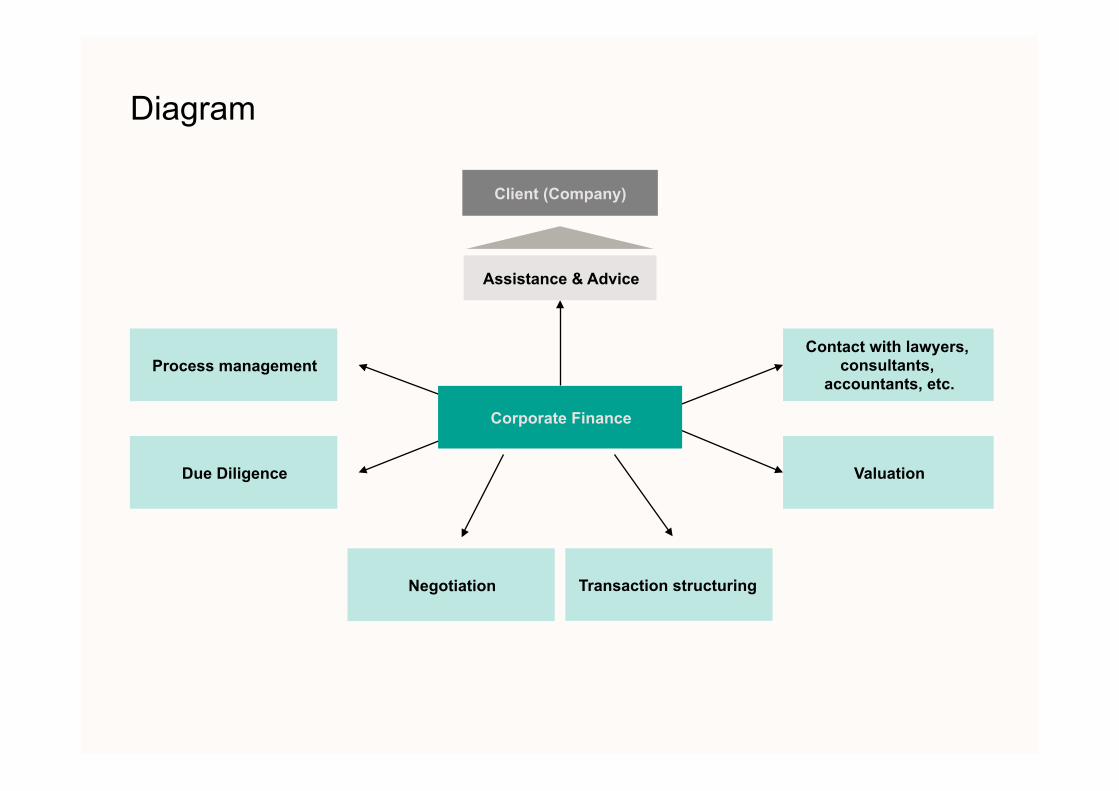
Diagram
Negotiation
Process management Contact with lawyers,
consultants, accountants, etc.
Due Diligence Valuation
Transaction structuring
Client (Company)
Assistance & Advice
Corporate Finance

The end