Embed Size (px)
Citation preview

Unemployment Insurance in FinlandA Review of Recent Changes and Empirical Evidence on
Behavioral Responses
Tomi Kyyra, Hanna Pesola, and Aarne Rissanen
VATT Institute for Economic Research
January 24, 2017

The aim of the background report
1. To provide an overview of the Finnish UI system
I Changes in eligibility conditions, benefit levels and benefitduration since 2000
I How these have changed overall generosity of UI over time
2. To summarize what we know about the effects of UI in theFinnish labor market
I Employment conditionI Benefit levelsI Potential benefit durationI Extended benefits for the older unemployed (“unemployment
tunnel” scheme)
Some new results using data from FIVA, Kela, ETK and TEM
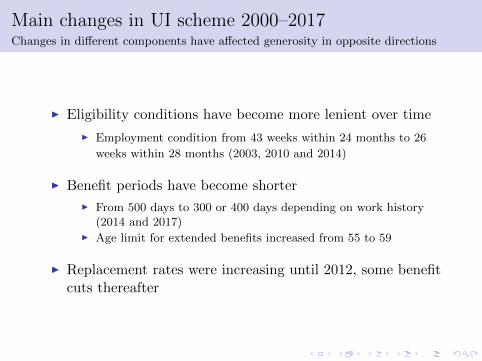
Main changes in UI scheme 2000–2017Changes in different components have affected generosity in opposite directions
I Eligibility conditions have become more lenient over time
I Employment condition from 43 weeks within 24 months to 26
weeks within 28 months (2003, 2010 and 2014)
I Benefit periods have become shorter
I From 500 days to 300 or 400 days depending on work history(2014 and 2017)
I Age limit for extended benefits increased from 55 to 59
I Replacement rates were increasing until 2012, some benefitcuts thereafter

Replacement rate as a function of past wage(replacement rate = benefit / wage)
On top of the increases shown in the graph, higher benefits paid for those withlong work history (2003–2016) and for duration of ALMPs since 2005
0.3
0.4
0.5
0.6
0.7
0.8
0.9
1000 1500 2000 2500 3000 3500 4000 4500 5000
Re
pla
cem
en
t ra
te
Monthly wage
2012-2014
2015-2017
2000-2001
2002-2009
2010-2011

Distribution of replacement rates in 2003, 2008 and 2013(replacement rate = benefit / wage)
0
1
2
3
4
5
Ker
nel d
ensi
ty e
stim
ate
0.0 0.2 0.4 0.6 0.8 1.0Replacement rate
2003 20082013
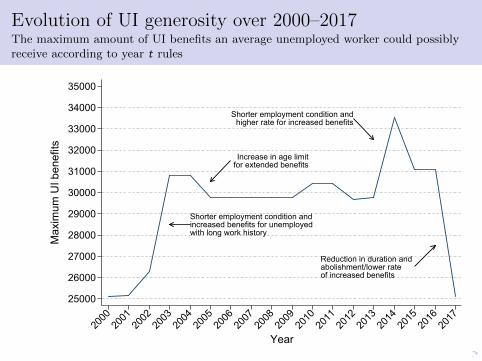
Evolution of UI generosity over 2000–2017The maximum amount of UI benefits an average unemployed worker could possiblyreceive according to year t rules
Shorter employment condition andincreased benefits for unemployedwith long work history
Shorter employment condition andhigher rate for increased benefits
Reduction in duration andabolishment/lower rateof increased benefits
Increase in age limitfor extended benefits
25000
26000
27000
28000
29000
30000
31000
32000
33000
34000
35000
Max
imum
UI b
enef
its
2000
2001
2002
2003
2004
2005
2006
2007
2008
2009
2010
2011
2012
2013
2014
2015
2016
2017
Year

Behavioral effects of UI
1. Employment condition and unemployment inflow
I Shorter employment condition may increase unemploymentinflow
I No evidence of such an effect for the 2003 reform
2. Effects of UI benefits on unemployed
I Higher benefits and longer benefit periods lead to longerunemployment spells
I .... but may also lead to better matches between job seekersand vacant jobs
I Longer unemployment spells are less problematic if theylead to better job matches
I The effects of benefits on the quality of post-unemploymentjobs are also important

Re-employment rate as a function of benefit entitlement25–54 years old UI recipients who became unemployed 2001–2004 due to job loss
One week = 5 benefit days
0.00
0.02
0.04
0.06
0.08
Weeks until UI benefit expires
Wee
kly
exit
rate
100 90 80 70 60 50 40 30 20 10 0 −10 −20

Effects of benefit level and benefit duration
A 10% increase in
benefit level(a benefit duration(b
... will change:
unemployment duration 8% or 15-20% 5%
next wage -10% 0.5%
duration of next job 10% 2%
earnings within 2-year period -10%
a)Uusitalo & Verho (2010) and Kyyra & Pesola (2016)
b)These are new results
These are accurately estimated and relatively robust effects
Summary
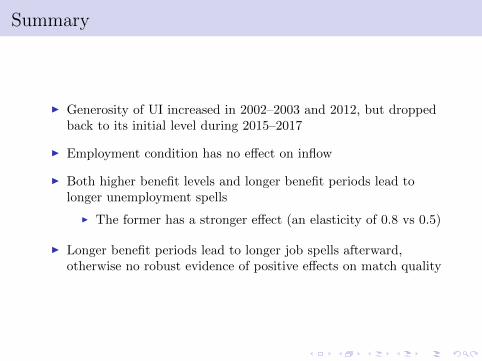
I Generosity of UI increased in 2002–2003 and 2012, but droppedback to its initial level during 2015–2017
I Employment condition has no effect on inflow
I Both higher benefit levels and longer benefit periods lead tolonger unemployment spells
I The former has a stronger effect (an elasticity of 0.8 vs 0.5)
I Longer benefit periods lead to longer job spells afterward,otherwise no robust evidence of positive effects on match quality

Employment condition and unemployment inflowDistribution of contribution weeks before and after the 2003 reform
I Contribution weeks = number of employment weeks within past 24 monthsI Those who became unemployed 2000–2001
0
2
4
6
8
Contribution weeks
Sha
re o
f spe
lls, %
4 20 34 43 60 80 104
Pre−reform spellsPost−reform spells
Old threshold of 43 weeks
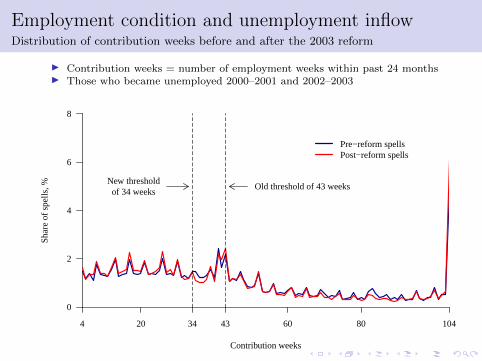
Employment condition and unemployment inflowDistribution of contribution weeks before and after the 2003 reform
I Contribution weeks = number of employment weeks within past 24 monthsI Those who became unemployed 2000–2001 and 2002–2003
0
2
4
6
8
Contribution weeks
Sha
re o
f spe
lls, %
4 20 34 43 60 80 104
Pre−reform spellsPost−reform spells
New thresholdof 34 weeks
Old threshold of 43 weeks

Employment condition and unemployment inflowDistribution of contribution weeks before and after the 2003 reform
I Contribution weeks = number of employment weeks within past 24 monthsI Those who became unemployed 2000–2001 without June spells
0
2
4
6
8
Contribution weeks
Sha
re o
f spe
lls, %
4 20 34 43 60 80 104
Pre−reform spellsPost−reform spells
New thresholdof 34 weeks
Old threshold of 43 weeks
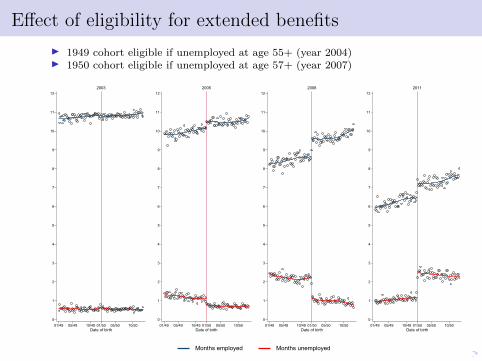
Effect of eligibility for extended benefits
I 1949 cohort eligible if unemployed at age 55+ (year 2004)I 1950 cohort eligible if unemployed at age 57+ (year 2007)
0
1
2
3
4
5
6
7
8
9
10
11
12
01/49 05/49 10/49 01/50 05/50 10/50Date of birth
2003
0
1
2
3
4
5
6
7
8
9
10
11
12
01/49 05/49 10/49 01/50 05/50 10/50Date of birth
2005
0
1
2
3
4
5
6
7
8
9
10
11
12
01/49 05/49 10/49 01/50 05/50 10/50Date of birth
2008
0
1
2
3
4
5
6
7
8
9
10
11
12
01/49 05/49 10/49 01/50 05/50 10/50Date of birth
2011
Months employed Months unemployed