Embed Size (px)
Citation preview

Full year results 2011.
Profitable Growth.
Analysts´ Conference Call
09 March 2012

2
Disclaimer
This presentation contains forward-looking statements about Linde AG (“Linde”) and their respective subsidiaries and businesses. These include, without limitation, those concerning the strategy of an integrated group, future growth potential of markets and products, profitability in specific areas, the future product portfolio, anti-trust risks, development of and competition in economies and markets of the group.
These forward looking statements involve known and unknown risks, uncertainties and other factors, many of which are outside of Linde’s control, are difficult to predict and may cause actual results to differ significantly from any future results expressed or implied in the forward-looking statements in this presentation.
While Linde believes that the assumptions made and the expectations reflected in this presentation are reasonable, no assurance can be given that such assumptions or expectations will prove to have been correct and no guarantee of whatsoever nature is assumed in this respect. The uncertainties include, inter alia, the risk of a change in general economic conditions and government and regulatory actions. These known, unknown and uncertain factors are not exhaustive, and other factors, whether known, unknown or unpredictable, could cause the group’s actual results or ratings to differ materially from those assumed hereinafter. Linde undertakes no obligation to update or revise the forward-looking statements in this presentation whether as a result of new information, future events or otherwise.

3
Agenda
Part 1 Prof. Dr Wolfgang Reitzle
1. 2011 Highlights and Divisional Performance
2. Strategic Focus:
— High Performance Organisation
— Growth Potential Mega-trends
3. 2012 Outlook
Part 2 Georg Denoke
1. Operational Performance
2. Project Pipeline and Capex
3. Financial Performance
Appendix

4
Highlights 2011Profitable Growth.
Group sales and profit again on record levels
Group sales increased by 7.1% and the operating profit grew at a faster pace by 9.7%
Group operating margin has further improved by 60 bp to 23.3%
Gases operating margin increased by 50 bp to 27.5%
Adjusted* EPS increased by 11.9% to € 7.71
Adjusted* ROCE is up by 50 bp to 13.0%
Net debt down by € 403 m to € 5.094 bn
Resilient business model and implementation of HPO initiatives drive profitable growth
Solid contribution from Mature Markets and further increased share from Growth Markets Improvement of Gases operating margin in all operating segments supported by HPO
Outlook
Mid-term targets for 2014 confirmed
*please see definitions on page 53

5
Group, sales by DivisionsContinued growth in all areas
Gases Division
— Growth track continued in 2011 in all regions led by Asia/Pacific
— Growth in all product areas led by Tonnage and Bulk
Engineering Division
— Order intake well balanced between Growth Markets and Mature Markets
— Order backlog remains on solid level
Gases
Engineering
in € million, as reported
+7.1%
Other/Cons.
2011
13,787
195
2,531
11,061
2010
12,868
179
2,461
10,228+8.1%
+2.8%
Group

6
Group, operating profit by DivisionsProfitable Growth. - Group margin further improved
Gases Division
— Growth of operating profit* continued
— Operating margin further improved by 50 bp to 27.5%
Engineering Division
— Operating margin of 12.0% on exceptional high level ahead of mid-term target of 8%
— Margin development driven by successful execution of individual projects
Engineering
Other/Cons.
Op. margin
in € million, as reported
Gases
on reported basis
*EBITDA incl. share of net income from associates and joint ventures
2011
3,210
-135304
3,041
2010
2,925
-112271
2,766
+9.7%
+9.9%
+12.2%
Group
22.7% 23.3% 60 bp

7
Gases Division, sales by product areasBalanced mix as basis for profitable growth
Solid growth in Healthcare
— The Mega-trend growth opportunities continue
— Acquisition will strengthen Homecare portfolio
Continuous growth in Tonnage again above previous record level
— Increased contribution from Growth Markets in 2011
— Numerous important take-or-pay contract wins in Growth Markets
— Continuous contribution from project ramp-ups
Positive performance of the merchant business
— Strong growth in Bulk supported by merchant LNG
— Recovery of late cyclical cylinder business in H1 2011
in € million, comparable* (consolidated)
Cylinder
Bulk
Tonnage
Healthcare
2011
11,061
4,494
2,683
2,695
1,189
2,472
2,484
1,132
2010
4,208
10,296
*excluding currency, natural gas price and consolidation effect
+5.0%
+8.5%
+8.5%
+6.8%
+7.4%*

88
Engineering Division, key figuresOrder intake well balanced
— Order intake increased by 3.5% to € 2.235 bn— Order backlog stays strong at € 3.600 bn (year-end 2010: € 3.965 bn)— Exceptional operating profit* margin in 2011 of 12.0% — Operating profit margin in 2012 of at least 10% due to continuation of positive effects from
successful execution of individual projects
8
32.4%
44.1%
23.5%
2011
EMEA
ASIA/PACIFIC
AMERICAS
Order Intake by Region
Air Separation Plants
Hydrogen/Synthesis Gas Plants
Olefin Plants
Natural Gas Plants
Other
25.7%
21.5%
15.8%
23.4%
13.6%
Order Intake by Plant Type2011
Order Backlog by Plant Type
Other7.4%
Olefin Plants 28.6%
Natural GasPlants20.4%
Hydrogen/Synthesis Gas Plants18.9%
Air Separation Plants24.7%
€ 3.6 bn
*EBITDA incl. share of net income from associates and joint ventures

9
HPO (High Performance Organisation)Covering the full value chain in all regions
— HPO is fully on track with savings – additional savings of ~ € 160 m
— Initiatives have been launched and rolled out in all relevant areas
— Contribution expected also in 2013 ff.
— Gross cost savings increased to € 620 m
Accumulated gross cost savings
in € million
2010 20122009 2011
300
160
650-800
~25%
~25%
~15%
Cylinder Supply Chain
Bulk Supply Chain
Procurement/Others
SG&A
160
~35%

10
Mega-trendsLeveraging growth with our Gas & Engineering set-up
Leveraging Gases & Engineering business synergies
Energy/Environment HealthcareGrowth Markets

11
Mega-trend Growth Markets Industrial gases market 2011 vs. 2020 in € bn
Source: Linde database, figures excl. Japan, equipment, healthcare and major impact out of future growth markets of the energy/environment sector
Mature MarketsGrowth Markets
2011
2020
2011
2020
2.2
~20 ~23~5
~2
~0.5
~1
~16
Market leader in 4 out of 5 Growth Markets
# 2 # 1
# 1# 1
# 1
~5
~2
~23
~16
~5~5
~2
~10
~13
~5~5
~2
~1~0.5
~16
~16
~6
~10
~4
~1~2

12
Mega-trend Growth Markets Strong investments in future growth
Growth Market sales (% of Gases sales)
Majority of Capex 2011 invested in Growth Markets
Growth Markets exposurefurther increased
2011
1.4
0.8
0.6
2010
1.3
0.6
0.7
2009
1.0
0.4
0.6
2008
1.5
0.7
0.8
2007
0.5
0.6
1.1
Gases Capex 2007 – 2011 in € bn
2011
36%
35%
2010
34%
33%
200920082007
29%
32% 32%
Growth MarketsMature MarketsIncl. JVsExcl. JVs

13
Mega-trend Growth MarketsComprehensive strategy to capture growth potential in Asia
Second ASU in Giheung, Korea- Investment ~€ 120 m for Samsung; largest investment in Korea
Construction of ASU in Map Ta Phut, Thailand (largest ASU)- Investment ~ € 78 m, on-stream date 2013*
Signed contract with PT Krakatau POSCO, Indonesia (largest ASU)- Investment ~€ 80 m, on-stream date 2013*
Jilin, China (Q4/2011)- On-site supply contract with Evonik Industries and Jilshen- Hydrogen plant (SMR): ~€ 42 m capex, on stream date 2013/2014*
Wu´an, China (Q4/2011)- On-site supply contract with Hebei Puyang Iron and Steel Ltd. - Decaptivation of 7 ASUs with energy efficiency upgrade and
construction of a new ASU: ~ € 120 m capex, on stream date 2014*
Yantai, China (Q3/2011)- On-site supply contract with Wanhua Polyurethanes Co., Ltd. - Two large scale ASUs: ~€ 130 m capex, on stream date 2013/2014*
Chongqing, China (Q2/2011)- On-site supply contracts with CCPHC and BASF- Large scale HYCO plant: ~€ 200 m capex, on stream date 2014*
Chongqing, China: - On-site supply contract with Sinopec, on stream date Q2/2011
975
701
861
5762011
2011
2010
2010
GreaterChina
South & East Asia
Pakistan
India
Bangladesh
Korea
Philippines
Indonesia
Singapore
VietnamThailand
MalaysiaSri Lanka
#1
#1
#1
#1#1
#1
#1
#1
China #1
Taiwan
* to be expected
+13%
+22%
Major investment commitments in 2011Consolidates sales in Asia in € m

14
Mega-trend Energy/EnvironmentLeadIng joint capabilities & access to Energy/Environment sector
Engineering Division Gases Division
Technology Know-How
Energy: LNG (Merchant/Floating), EOR/EGR, Coal-to-X, Gas-to-X, Bio-to-X, Geothermal
Environment: OxyFuel, Post-combustion CO2-capture and handling, H2-fueling
Efficiency & Applications: Higher energy efficiency of plants, REBOX® oxy-fuel, WASTOX®
Long-term Customer Relations
Plant Sales
for
captive customer
Commodity Customers
with focus on price/energy efficiency (TCO) and reliability
Competitive Products and Services
Mega-projectsProven technology and project execution
Proven long-term operations track record

15
Mega-trend Energy/EnvironmentImportance of new technologies & industrial gases applications
Annual market revenue in the respective year Pilot projects and small volumes
*Assuming 100% Build Own Operate and excluding sale of equipment and plants
CO2
emis
sion
redu
ctio
n
Energy/Environment annual market revenue estimates*
2015 2020 2030
€ 5 -7 bn
LNG
EOR (N2 / NRU / CO2)
H2 FUELING
CO2 HANDLING
CLEAN COAL
€ 14 -19 bn
€ 80 -140 bn
RENEWABLES (e.g. BIOMASS GASIFICATION, PHOTOVOLTAIC)
Increasing energy consumption & CO2 emission
2010 2015
100
500
300
2020
700
— Fossil resources remain dominant energy source
— Fossil resources becoming scarce
— CO2-emissions steadily increasing
— Importance of renewable energy increasing but still limited reach
Nuclear
Petroleum Liquids
Renewables
Coal
Natural Gas
Source: U.S. Energy Information Administration2030
Global energy consumption*
(Please find assumptions for estimates on page 49)
* in quadrillion British Thermal Units (equals around 1027 Joules)

1616
Mega-trend Energy/EnvironmentOpportunities in shale gas business: Example US
Bcf = billion cubic feet Source: EIA, “Oil and Gas Field Maps”; Linde database; Navigant
Engineering— Total order intake since 2010 > € 400 m— Opportunities within the field of shale gas:
— Natural gas processing plants: driven by the necessity of gas treatment for pipeline and bulk use — Small-mid-scale LNG plants: driven by increasing demand for merchant LNG— Ethane cracker: feasible for gas fields without petrochemical clusters
Gases— Potential leverage of our operation experience into the area of shale gas— Based on shale gas new chemical clusters develop with the need for industrial gases supply
BarnettFayetteville
WoodfordHaynesville
Marcellus
5.5
4.5
2.0
8.0
4.5
Natural gas processing plantActive major shale gas fields
in the USAExpected development of US shale gas production in the next decade (in Bcf)

17
Mega-trend HealthcareMarket environment and drivers
2.2
~5.8~1.8
~5.8
~8.1 ~3.9
~5.7
~2.2~1.0
Source: Linde database, figures incl. gas therapies and intermediate care
Mature Markets2011
2020
Growth Markets2011
2020
Market environment
Increasing and ageing population
Increasing wealth in Growth Markets
Healthcare budget pressure and regulation
Drivers of developmentNew and innovative pharmaceutical gases and services
Value creation by cost-effective and reliable products and services
Quality and optimum care for patients
Regional expansion
Relevant Healthcare markets 2011 vs. 2020 in € bn

18
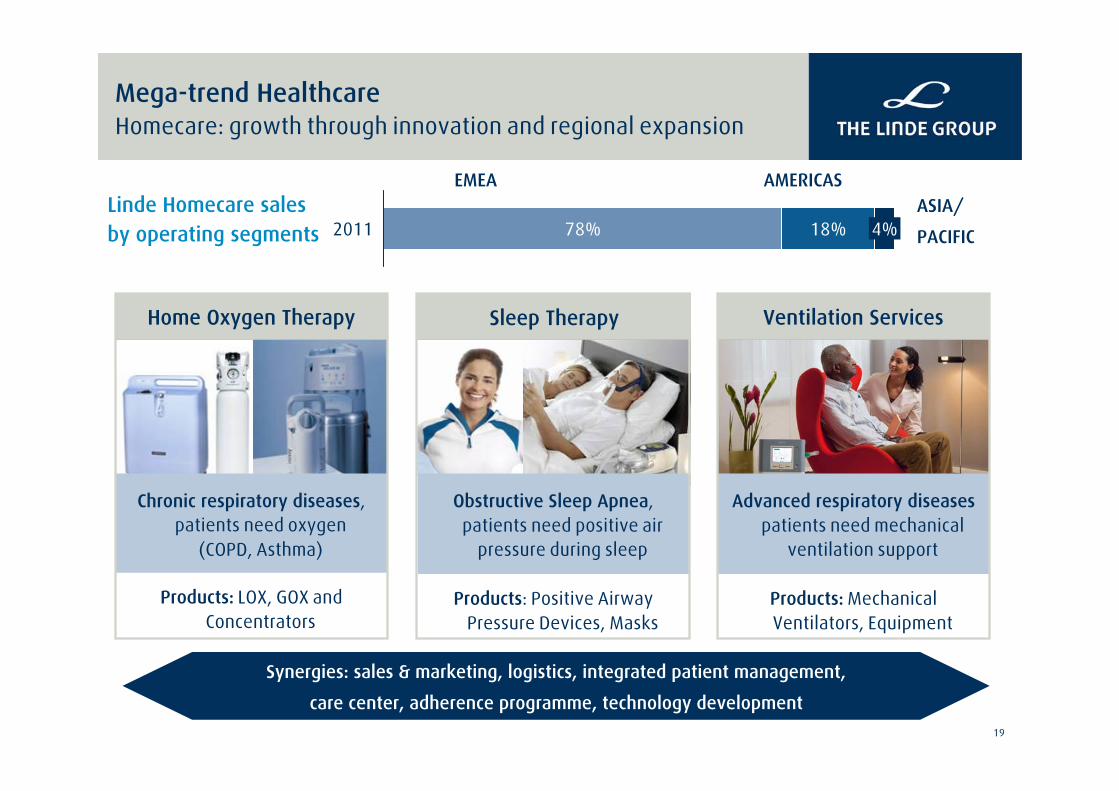
Mega-trend HealthcareFrom medical gas provider to solutions & service provider
— Bulk supply and technical assistance
— Logistics and installation
— Customer Service
— Hospital & medical gas services
— Patient centered care
— REMEO: treatment and care of chronic patients with mechanical ventilation needs
— Home oxygen therapies
— Ventilation services
— Sleep therapies
— Other service
— Pulmonary hypertension & cardio-thoracic surgery
— Oxygen & Heliox therapies
— Pain relief
Development of new therapies and applications
Integrated service provider
Homecare
Intermediate Care
Gas Therapies
Hospital Care
Cost
eas
e to
Hea
lthca
re b
udge
ts
19
Chronic respiratory diseases, patients need oxygen
(COPD, Asthma)
Home Oxygen Therapy
Products: LOX, GOX and Concentrators
Obstructive Sleep Apnea, patients need positive air
pressure during sleep
Sleep Therapy
Products: Positive Airway Pressure Devices, Masks
Advanced respiratory diseasespatients need mechanical
ventilation support
Ventilation Services
Products: Mechanical Ventilators, Equipment
2011 78% 18% 4%
EMEA AMERICASASIA/
PACIFIC
Synergies: sales & marketing, logistics, integrated patient management,
care center, adherence programme, technology development
Mega-trend HealthcareHomecare: growth through innovation and regional expansion
Linde Homecare salesby operating segments

20
Group
OutlookProfitable Growth.
Group
Engineering
2012
2014
— Growth in sales and operating profit vs. 2011— Confirmation of HPO-programme: € 650-800 m of gross cost
savings in 2009-2012
— Sales increase vs. 2011— Continuous improvement of productivity
— Average capex/sales ratio 13% plus— Revenue increase above market growth — Further increase in productivity
— Sales at the same level as in 2011— Operating margin of at least 10%
— Operating profit of at least € 4 bn— Adjusted* ROCE of 14% or above
Gases
Gases
*please see definitions on page 54

21
Agenda
Part 1 Prof. Dr Wolfgang Reitzle
1. 2011 Highlights and Divisional Performance
2. Strategic Focus:
— High Performance Organisation
— Growth Potential Mega-trends
3. 2012 Outlook
Part 2 Georg Denoke
1. Operational Performance
2. Project Pipeline and Capex
3. Financial Performance
Appendix

22
Group Financial key indicators again on record levels
Profitable growth for our shareholders
— adjusted EPS up by 11.9%
— adjusted ROCE further improved by 50 bp
Adjusted* EPS Adjusted* ROCE Operating Cash Flowin € m, as reported
€6.89
€5.46
€4.58
20112009
7.71€
4.58€
2010
6.89€
13.0%
20112010
10.4%
2009
12.5%
2,426
2009 2010
2,422
2,142
2011
*please see definitions on page 53

23
Gases Division, Q4 sales by product areasQ4 development above market average
in € million, comparable* (consolidated)
Cylinder
Bulk
Tonnage
Healthcare
Q4 2011
2,791
1,112
690
680
309
Q4 2010
2,645
1,060
644
647
294
*excluding currency, natural gas price and consolidation effect
+5.1%
+5.1%
+7.2%
+4.9%
+5.5%* Continued growth in Healthcare
— New tender wins
Sound growth in Tonnage
— Scheduled maintenance shut downs
— Less start-ups than in previous quarters
Positive performance of the merchant business
— Positive contribution from pricing initiatives
— Solid volume growth in Bulk, despite base effect
— Seasonal lower CO2-sales

24
2010 2011
Q1 Q2 Q3 Q4 Q1 Q2 Q3 Q4 Q1 Q2 Q3 Q4
Cylinder
20092009 2010 2011
Q1 Q2 Q3 Q4 Q1 Q2 Q3 Q4 Q1 Q2 Q3 Q4
2009 2010 2011
Q1 Q2 Q3 Q4 Q1 Q2 Q3 Q4 Q1 Q2 Q3 Q4
2009 2010 2011
Q1 Q2 Q3 Q4 Q1 Q2 Q3 Q4 Q1 Q2 Q3 Q4
Tonnage
Bulk
Healthcare12.1
5.1
10.013.3
10.311.1
-1.7
-6.5-4.4
5.1
10.7
6.5
Gases Division, product areas Comparable* year-on-year growth in percent
-6.9
9.9
5.2
0.5
6.3
-11.1-7.9
11.48.4
5.17.27.3
4.2 5.15.86.55.5 5.72.7 3.7 4.0
1.55.05.8
3.25.3
0.0
-9.1-9.1-12.2
-5.5
4.8 6.48.4
4.97.5
*excluding currency, natural gas price and consolidation effect

25
Gases Division, sales by operating segmentGrowth in all regions led by Asia/Pacific and Americas
*excluding currency, natural gas price and consolidation effect
in € million
— Healthcare growth supports double digit growth in South America
— Highest growth rates inNorth America in Tonnage
— Growth in Asian regions led by China and India
— Bulk continued solid growth trend in all regions
— Solid growth in all regions
— Growth driven by cylinderand bulk business in Continental Europe
Asia/PacificEMEA Americas
+9.2%*+5.7%* +9.1%*
2011
5,672
2010
5,330
2011
3,076
2010
2,692
2011
2,384
2010
2,279+14.3%
+6.4%
+4.6%
Mature Markets Growth Markets
2011 65% 35%

26
Gases Division, operating profit by operating segmentProfitable Growth continued in 2011
in € million
Asia/PacificEMEA Americas
2011
1,634
2010
1,513
754872
2010 2011
499 535
20112010
+15.6%
+8.0%
+7.2%
Mature Markets Growth Markets
2011 68% 32%
28.4%28.8%
28.0%28.3% 21.9% 22.4%
— Continuous implementation of HPO supports margin development in all regions
— Positive margin track record in EMEA continued
— Despite investments in future structural growth in Asia the margin exceeds level of 2010

27
Gases Division, Split of CapexGrowth Markets Capex increased to above 50 percent
Split Capex by markets
Asia/Pacific
1,439
2011
Americas
EMEA
225
492
616
218
1,326
2010
627
587
in € million
+1.8%
+19.3%
+3.2%
+8.5%
Mature Markets
Growth Markets
54% 54%46% 46%
Split Capex by operating segments
2011
2010

28
Gases Division, project pipelineGood basis for sustainable growth
— € 4.1 bn investments between 2009-2013 (thereof € 0.6 bn in JVs @ share)
— Project amount for 2012 and 2013 further increased by around € 200 m
— 2014 project amount already at around € 550 m
— Around 70% of total project-Capex allocated to Growth Markets
— Amount of project opportunities remains with € 4.3 bn on a high level
Project amount by on-stream date (incl. JVs) in € m
(Projects > € 10 m)
2013
~550~500
~65050
150
2012
~750
20102009
~800
2011
~800
700
2014

29
Gases, Capex Development Capex Sales Ratio 2007 - 2011
Data 2007-2011 @ actual average fx rates at the end of the respective year
1,451
1,062
2007 2009
1,029
~1,800
2008 20112010
average2011-201413% plus*
12%
15%
11%
1,326
Capex/Sales Ratio
Capex in € million
* plus: additional potential for mega-projects
1,439
13% 13%
2012

30
Group, solid financial positionSound financial strategy
Net debt (€ m) Net debt/EBITDA
2011
5,094
2010
6,119
2009
5,497
2008
6,423
2007
6,427
2006
9,933
30/09/2006
12,815
0
1
2
3
4
5
2006 2007
4.8
2.7
2008
2.5
2011
1.6
2010
1.9
2009
2.6
Credit Ratings — Standard&Poor‘s: A-/A-2 with stable outlook (27/10/2011*)— Moody´s: A3/P-2 with stable outlook (12/10/2011*)
* Date of latest rating report

31
Group, solid financial position Net debt reduction of € 403 million
FX & Fair Value Accounting
5,094
Other
12
Net interestDividends
757
Operating cash flow
2,426
Cash flow from investment
activitiesexcl. inv. in
liquidity reserve
1,254
Net debt31/12/2010
5,497
in € million

32
Group, solid financial positionEarly refinancing of existing financial debt
Continuous efforts to extend the Group’s maturity profile— ~€ 360 m partial bond buyback and issuance of € 600 m notes due in 2021— Issuance of € 750 m senior notes due in 2018— More than 80% of total financial debt is due beyond 2012— Approx. 56% of total financial debt has a longer maturity than 5 years
Balanced mix of various financing instruments— Strong focus on long-term bond financing— Strategic funding in EUR, GBP, USD and AUD
Subordinated Bonds
Other Bonds
Commercial Paper
Bank Loans
2%
Financial debt, by instrument
Financial debt, by maturity (in € m)
(*callable in 2013/2016)
67%
10%1%19%
72%
7%
> 5 years
4,344
1,461
2,880
3
1 - 5 years
2,147
1,923
224
< 1 year
1,277
796132
349
2%

33
Group, PensionsPerformance and key figures 2011
Net obligation
Pension plan assets portfolio structure
5594,8425,40131/12/2011
-14-19-33Other
–200
182
-1
88
504
Net obligation
Contributions/payments
Actuarial losses/gains
Net financing
Service costs
01/01/2011
–13
153
254
4,467
Plan asset
–213
335
253
88
4,971
DBOin € million
1%
57% 25%
20%
12%
12% 64%2011
2010
3%
5%1%
Others Insurance PropertyFixed-intrest securities Equities
11.6%12.3%
United Kingdom
2009
-20
11 a
vg.
2011
act
ual
2011
exp
ecte
d
Performance of major pension plans
6.0%
12.8%
14.6%
Germany
2009
-20
11 a
vg.
2011
act
ual
2011
exp
ecte
d
5.0%

34
GroupFinancial Result and Tax Rate
Financial Result (in € million) Tax Rate
291280
329
385
2009 2010 20112008
22.9%
2010
23.2%
2011
22.1%23.9%
20092008

35
€1.50
€ 1.70
€ 1.80 € 1.80
2008
+5.9%
Group, dividendsProposed dividend increased by 13.6% to € 2.50
stable
+13.3%
+5.4%+18.1%* -6.7%
Change in Operating
Profit
* Comparable change: prior year figures including twelve months of BOC
€ 2.20
+22.2%
€ 2.50
20072006 2009 2010 2011
+13.6%
+22.6%
+9.7%

36
SummaryProfitable Growth.
New record levels achieved in 2011
Group sales and profit on record levels
Group operating margin and Gases operating margin further improved
Net debt reduced to a net debt/EBITDA ratio of 1.6x
Resilient business model and competitive set-up for sustainable profitable growth
More than a third of revenues from Growth Markets
Focus on Mega-trends Healthcare and Energy/Environment
Leveraging business synergies of Gases & Engineering
Sustainable cash flow generation and further optimised long-term financing
Capex/Sales ratio 13% plus
Resilience of business model further optimised
Implementation of High Performance Organisation on track

37
Agenda
Part 1 Prof. Dr Wolfgang Reitzle
1. 2011 Highlights and Divisional Performance
2. Strategic Focus:
— High Performance Organisation
— Growth Potential Mega-trends
3. 2012 Outlook
Part 2 Georg Denoke
1. Operational Performance
2. Project Pipeline and Capex
3. Financial Performance
Appendix

38
Group, FY 2011Key P&L items
16.91,2441,064Net income
6.89
5.94
1,005
-335
-280
1,679
-254
1,933
22.7%
2,925
12,868
2010
11.97.71Adjusted EPS in €
15.86.88EPS in €
16.81,174Net income – Part of shareholders Linde AG
11.9-375Taxes
3.9-291Financial Results
13.81,910EBIT
-5.0-242PPA depreciation
11.32,152EBIT before PPA depreciation
+60 bp23.3%Margin
9.73,210Operating Profit
7.113,787Sales
∆ in %2011in € million
39
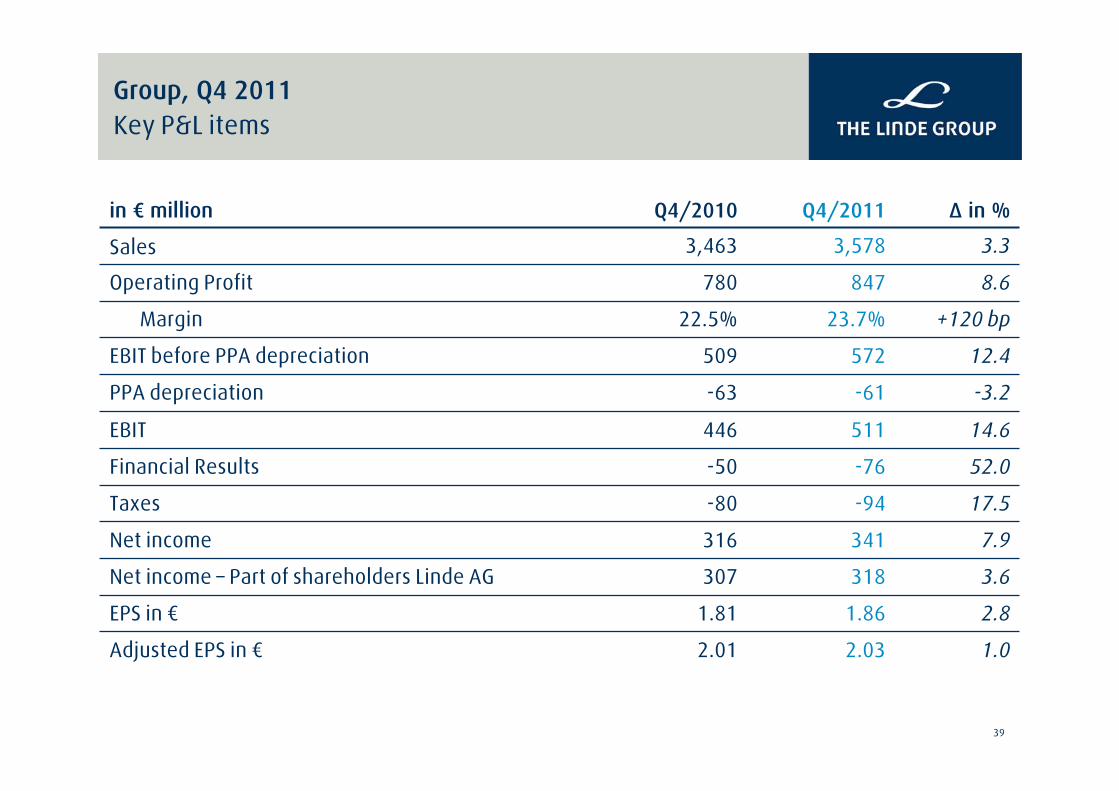
Group, Q4 2011Key P&L items
7.9341316Net income
1.02.032.01Adjusted EPS in €
2.81.861.81EPS in €
3.6318307Net income – Part of shareholders Linde AG
17.5-94-80Taxes
52.0-76-50Financial Results
14.6511446EBIT
-3.2-61-63PPA depreciation
12.4572509EBIT before PPA depreciation
+120 bp23.7%22.5%Margin
8.6847780Operating Profit
3.33,5783,463Sales
∆ in %Q4/2011Q4/2010in € million

40
-238
-11
-56
305
-422
53
-23
-452
727
-159
39
847
Q4 11*
-245
-7
-123
375
-347
40
-41
-346
722
-142
60
804
Q3 11*
-779
-280
-298
1,357
-1,065
195
-68
-1,192
2,422
-587
84
2,925
2010
-429240-186Net debt increase (+)/decrease (-)
-405-385-2Dividends and other changes
-338-114-45Interests and swaps
1,172259233Free Cash Flow before Financing
-1,254-278-207Investment Cash Flow
1693343Other
-78-1-13Acquisitions/Financial investments
-1,345-310-237Investments in tangibles/intangibles
2,426537440Operating Cash Flow
-709-267-141Other changes
-756-180Change in Working Capital
3,210798761Operating profit
2011*Q2 11Q1 11in € million
Group, FY 2011 Cash Flow Statement
* excluding investments in securities of € 600 m in Q3 and € 1,052 m in Q4

41
GroupFree Cash Flow before Financing (2011 vs. 2010)
Q1
Q2
Q3
206233
260
259
404
Free CF 2011 vs. 2010
2011
2010
in € million
727
722
537
440
889
631
505
397
2,422
2,426
-1,065
-1,254*
-402
-422*
-227
-347*
-245
-278
-191
-2072011
2010
2011
2010
Q42011
2010
Investing CF Operating CF
487305
Total2011
2010
13.1%
-0.4%
-7.2%
-37.4%
-13.6%
375
1,357
1,172
* excluding investments in securities of € 600 m in Q3 and € 1,052 m in Q4

42
Group, solid financial positionLiquidity reserve again further strengthened
Liquidity reserve
3,897
Revolving credit facility
2,500
Current securities and strategic liquidity
reserve of € 600 m
1,674
Cash and cash equivalents
1,000
Short-term financial debt
-1,277
€ 2.5 bn committed revolving credit facility— Arranged in May 2010 with 25 national
and international banks— Maturing in 2015— No financial covenants — Fully undrawn
More than € 2.6 bn cash and securities
in € million (31/12/2011)

43
Division Gases, sales bridgeFY 2011 sales increased by 7.4% on comparable basis
FY 2011
11,061
Price/VolumeNatural GasCurrencyConsolidationFY 2010
10,228
in € million
+0.3% -0.2% +0.6%
+7.4%

44
Gases DivisionJoint ventures
in € million
Proportionate Sales*(not incl. in the Group top-line)
Share of Net Income(contribution to operating profit)
398
20112010
453
+13.8%
85
20112010
89
+4.2%
* Adjusted for local accounted joint ventures

45
Engineering Division, key figuresOrder intake up by 3.5%
*EBITDA incl. share of net income from associates and joint ventures
Order Intake
2011
2,235
2010
2,159
+3.5%
Sales
2011
2,531
2010
2,461
+2.8%
Operating Profit*
2011
304
2010
271
+12.3%
Operating Margin
2011
12.0%
2010
11.0%
+100 bp
in € million
in € million
in € million

4646
Engineering DivisionFY 2011 order intake by plant type and region
Air SeparationPlants
28.3% 25.7%
Hydrogen/Synthesis Gas
Plants16.2% 21.5%
Olefin Plants28.5%
15.8%
Natural Gas Plants16.7%
23.4%
Other10.3% 13.6%
2010 2011
Order Intake by Plant Type
EMEA57.2% 32.4%
44.1%
27.2%
ASIA/PACIFIC
AMERICAS15.6%
23.5%
2010 2011
Order Intake by Region

47
Order backlog by plant type (31/12/2011)
Engineering DivisionSolid and diversified order backlog
Other: 7.4%(2010: 4.6%)
Olefin Plants: 28.6%(2010: 43.5%)
Natural Gas Plants: 20.4%(2010: 12.5%)
Synthesis Gas Plants: 18.9%(2010: 14.7%)
Air Separation Plants: 24.7%(2010: 24.7%)

48
— xxx
Better use of fossil resources:
Existing growth markets
Renewable energy:
Developing growth markets
Clean energy:
Future growth markets
Higher efficiency in energy use: Sustained growth in traditional end marketsREBOX® oxy-fuel (steel), WASTOX® (aluminium), Oxygen burner (glass), Water Treatment, …
Enhanced Oil& Gas Recovery
Refinery Hydrogen
Coalliquefaction
Coal-to-Gas
Liquified Natural Gas (LNG)
Pemex Cantarell project, Mexico Adnoc Joint Venture, Abu Dhabi
Tonnage contract with Bayer/SCCC1 in China
Statoil plant, Hammerfest, Floating LNG
ASUs and Rectisol for coalgasifications in China
Gas-To-Liquid (GTL)
Tonnage contracts with Shell,EMAP, Chevron, CITGO,…
Pearl GTL project, Qatar Shell GTL LTd
CO2 scrubbing RECTISOL® CO2 wash, usedat Hammerfest LNG plant
Photo-voltaic
Biomass-Conversion
AutomotiveHydrogen
Signed Gases contracts for 6 GWp of nominal capacity
Choren/Sun Fuel PilotProject, Germany
Bio to Liquids Waste Management JV plant started up in 2009
H2 Mobility Initiative launchedwith key industrial partners
Post-comb.CO2 capture
OxyFuelVattenfall Pilot Project,Schwarze Pumpe, Germany
RWE/BASF Pilot Project,Niederaussem, Germany
CO2 handlingRecycling CO2 (OCAP, Nld)CO2SINK, Ketzin, GermanyStatoil LNG plant, Norway
1 Shanghai Cooking & Chemical Corporation
Mega-trend Energy/EnvironmentCurrent and future growth markets for Gases & Engineering
Geothermal Turbines for geothermalproject in France
Business model Linde: Engineering Gas Supply Maturity of business: Existing business Pilot on-going

49
2015 2020 2030 Assumptions for 2030
Range 5 - 7 14 - 19 18-140
LNG 11 – 233 - 4 6 - 10– Based on penetration rate of LNG replacing existing fuels– Merchant LNG projects based on geographical set up and
existing infrastructure– Floating LNG projects
EOR/EGR* 18 – 351.5 4 - 5– Single to double digit number of large N2 EOR/NRU projects– Double digit number of large CO2 EOR projects including
industrial CO2 capture and pipeline (overlapping w/CCS)
H2 fueling 10 – 151small– Installation of a significant fuel station infrastructure – Corresponding annual H2 consumption of some bn tons
p.a.
3Renewables 1 2– Includes mainly gases used for manufacturing of
photovoltaic cells
Clean Coal 20 – 40--- ---– Triple-digit number of 1 GW Carbon Capture
(1.5 Gt/a CO2 at EUR25-40/t)
15 – 25CO2 networks small 1– Installation of significant pipeline network and corresponding
compression(1.5 Gt/a handling fee CO2 at EUR 10-15/t)
* Assuming 100% Build Own Operate and excluding sale of equipment and plants.
Clean Energy market estimation 2020 & 2030 top down
General assumptions:
— Market numbers are directional only and w/o inflation or currency
— Oil price development at 80-100 USD/bll
— Outsourced gases market only (excl. captive market or equipment sales)
Market size in € bn

50
GroupReconciliation of Capital Employed
16,58617,30515,451Average Capital employed
13.0%11.0%12.5%Return on Capital Employed (ROCE)
464649Plus: liabilities from financial lease
352352392Less: receivables from financial lease
2,6742,6741,176Less: Cash, cash equivalents and securities
31/12/201131/12/2010
16,278
552
6,673
10,572
Key FinancialFigures
17,543
611
7,768
12,144
As reported
PPA and disposal effects11,495-649Equity incl. minority interest
7,768Plus: financial debt
611Plus: Net pension obligations
16,894-649Capital employed
Non-GAAP adjustment
EffectsKey FinancialFiguresin € million

51
GroupReconciliation of EPS
1,3151411,1741,167Earnings after taxes and minority interest
PPA2,5122421,9101,933EBIT before special itemsdeferred taxes on PPA
-476-101-375-427Taxes on income
31/12/201131/12/2010
169.3
6.89
Key FinancialFigures
170.6
6.88
As reported
7.71EPS (in €)
170.6Weighted averageno. of shares (in million)
Non-GAAP adjustment
EffectsKey FinancialFiguresin € million

52
GroupPPA – Expected Depreciation & Amortisation
— Development of depreciation and amortisation (in € million)— Impact in 2011: € 242 million
> 175 – 2252012
> 190 - 2102013
…
< 1252022
Expected range
0
100
200
300
400
2006 2008 2010 2012 2014 2016 2018 2020 2022 2024
PPA Depreciation Planning (in € m)

53
Group, Definition of financial key figures
adjustedROCE
adjustedEPS
OperatingProfit
Return Operating profit- depreciation / amortisationexcl. depreciation/amortization from purchase price allocation
Average Capital Employed
Return
Shares
equity (incl. minorities)+ financial debt+ liabilities from financial leases+ net pension obligations- cash, cash equivalents and securities- receivables from financial leases
Return
earnings after tax and minority interests+ depreciation/amortization from purchase price allocation+/- special items
average outstanding shares
EBITDA (incl. IFRIC 4 adjustment)excl. finance costs for pensionsexcl. special itemsincl. share of net income from associates and joint ventures

54
Investor Relations
Contact
Phone: +49 89 357 57 1321eMail: [email protected]: www.linde.com
Financial Calendar
— Interim Report January to March: 4 May 2012
— Annual General Meeting: 4 May 2012
— Interim Report January to June: 27 July 2012
— Interim Report January to September: 29 October 2012


![H1 - The Linde Group€¦ · g HL i g H t s Linde FinanciaL HigHLigHts [H1 – January to June 2014] Linde Financial Highlights January to June 2014 January to June 2013 change sareh](https://img.pdfslide.us/doc/110x75/5ecc228a613e56249d6dc152/h1-the-linde-group-g-hl-i-g-h-t-s-linde-financial-highlights-h1-a-january-to.jpg)


![2012 Determination - Home - Linde España | Linde España · Linde financiaL highLights [1] Linde financiaL highL ights Linde financial highlights January to december 2012 2011 change](https://img.pdfslide.us/doc/110x75/5f9a3ff2e98e362cc85a459b/2012-determination-home-linde-espaa-linde-espaa-linde-financial-highlights.jpg)