Embed Size (px)
Citation preview

2015: Issue 481, Week: 29th June - 2nd July
Bra
nd
sm
c 3
05

Contents
Equity 4-7
Derivatives 8-9
Commodity 10-13
Currency 14
IPO 15
FD Monitor 16
Insurance 17
Mutual Fund 18
SMC RESEARCH TEAM
REGISTERED OFFICES:
11 / 6B, Shanti Chamber, Pusa Road, New Delhi 110005.
Tel: 91-11-30111000, Fax: 91-11-25754365
MUMBAI OFFICE:
Dheeraj Sagar, 1st Floor, Opp. Goregaon sports Club, Link Road
Malad (West), Mumbai 400064
Tel: 91-22-67341600, Fax: 91-22-28805606
KOLKATA OFFICE:
18,Rabindra Sarani, Poddar Court, Gate No-4,5th Floor, Kolkata-700001
Tel : 91-33-39847000 Fax No : 91-33-39847004
AHMEDABAD OFFICE :
10/A, 4th Floor, Kalapurnam Building, Near Municipal Market,
C G Road, Ahmedabad-380009, Gujarat
Tel : 91-79-26424801 - 05, 40049801 - 03
CHENNAI OFFICE:
Salzburg Square, Flat No.1, III rd Floor, Door No.107, Harrington Road,
Chetpet, Chennai - 600031.
Tel: 044-39109100, Fax -044- 39109111
SECUNDERABAD OFFICE:
206, 3rd Floor, above CMR Exclusive, Bhuvana Towers, S.D.Road,
Secunderabad - 500003
Tel: 91-40-30780298/99, 39109536
DUBAI OFFICE:
312, Belshalat Building, Al Karama, Dubai, P.O. Box 117210, U.A.E.
Tel: 97143963120, Mobile : 971502612483
Fax : 9714 3963122
Email ID : [email protected]
Printed and Published on behalf of
Mr. Saurabh Jain @ Publication Address
11/6B, Shanti Chamber, Pusa Road, New Delhi-110005
Website: www.smcindiaonline.com
Investor Grievance : [email protected]
Printed at: S&S MARKETING
102, Mahavirji Complex LSC-3, Rishabh Vihar, New Delhi - 110092 (India)
Ph.: +91-11- 43035012, 43035014, Email: [email protected]
lobal markets in the week gone by remained cautious as investors focused
on the unfolding negotiations surrounding Greece's debt problems. GEuropean market too looked worried as Greece debt crisis stalemate
continued. However Japan's stock market rose to its highest level in more than 18
years on Wednesday buoyed by optimism that Greece is moving closer to a bailout
deal with creditors. As per the recent minutes from the board's meeting on May,
members of the Bank of Japan's monetary policy board are satisfied with the rate of
the country's economic recovery and the recovery is expected to continue.
Consumer prices excluding fresh food rose marginally by 0.1% in the month of May
from a year earlier. Chinese stock markets corrected sharply as market participants
felt that the bull –run is running out of steam.
Back at home, the domestic market witnessed bout of volatility ahead of F&O
expiry. Meanwhile, concerns of a likely spike in food prices have receded due to
above-average rains during the initial part of the June-September southwest
monsoon season and this has also improved the odds for further monetary policy
easing from RBI. In the recent policy meeting, RBI has said that the monsoon and its
impact on food costs will be key to further easing. According to the latest World
Bank forecast, India's economy, Asia's third largest, is expected to grow 7.5 percent
this year. The trends in investment by foreign market players and domestic market
players, the movement of the rupee against the dollar and crude oil price
movement and the progress of the monsoon will dictate the trend of the market.
On the commodities font, CRB gained marginally last week and took support of 220
levels. Meanwhile, rise in dollar index and Greece issue capped the upside. Bullion
counter may continue its volatile movement owing to Greece debt problem,
movement in greenback and fed interest rate hike concerns. Gold can move in the
range of 26200-27400 while silver can move in the range of 35000-37500. Crude oil
may continue to trade on sideways path as US summer driving demand, EIA
inventory position and rig count to give further direction to the prices. In base
metal counter, lower level buying can be seen on China stimulus measures and
expectation of Greece deal. CPI of Germany, German Unemployment Change, Euro-
Zone Consumer Price Index Estimate, GDP of Canada, ISM Manufacturing, Consumer
Confidence, Change in Non-farm Payrolls, Unemployment Rate of US etc. are some
important events, which may pave the path for commodities trends.
From The Desk Of Editor
(Saurabh Jain)
SMC Global Securities Limited is proposing, subject to receipt of requisite approvals, market conditions and other considerations, a further public offering of its equity shares and has filed the Draft Red Herring Prospectus with the Securities and Exchange Board of India (“SEBI”) and the Stock Exchanges. The Draft Red Herring Prospectus is available on the website of SEBI at www.sebi.gov.in and on the websites of the Book Running Lead Manager i.e., ICICI Securities Limited at www.icicisecurities.com and the Co- Book Running Lead Manager i.e., Elara Capital (India) Private Limited at www.elaracapital.com . Investors should note that investment in equity shares involves a high degree of risk and for details relating to the same, please see the section titled “Risk Factors” of the aforementioned offer document.
SMC Global Securities Ltd. (hereinafter referred to as “SMC”) is a registered Member of National Stock Exchange of India Limited, Bombay Stock Exchange Limited and its associate is member of MCX stock Exchange Limited. It is also registered as a Depository Participant with CDSL and NSDL. Its associates merchant banker and Portfolio Manager are registered with SEBI and NBFC registered with RBI. It also has registration with AMFI as a Mutual Fund Distributor.
SMC is in the process of making an application with SEBI for registering as a Research Entity in terms of SEBI (Research Analyst) Regulations, 2014. SMC or its associates has not been debarred/ suspended by SEBI or any other regulatory authority for accessing /dealing in securities Market.
SMC or its associates including its relatives/analyst do not hold any financial interest/beneficial ownership of more than 1% in the company covered by Analyst. SMC or its associates and relatives does not have any material conflict of interest. SMC or its associates/analyst has not received any compensation from the company covered by Analyst during the past twelve months. The subject company has not been a client of SMC during the past twelve months. SMC or its associates has not received any compensation or other benefits from the company covered by analyst or third party in connection with the research report. The Analyst has not served as an officer, director or employee of company covered by Analyst and SMC has not been engaged in market making activity of the company covered by Analyst.
The views expressed are based solely on information available publicly available/internal data/ other reliable sources believed to be true.
SMC does not represent/ provide any warranty express or implied to the accuracy, contents or views expressed herein and investors are advised to independently evaluate the market conditions/risks involved before making any investment decision.
Charts by Spider Software India Ltd
7
EQUITY
Above calls are recommended with a time horizon of 1-2 months
Disclaimer : research. The analysis contained in the analyst research is based on numerous assumptions. Different assumptions could result in materially different results.The analyst, not any of its affiliated companies, not any of their members, directors, employees or agents accepts any liability for any loss or damage arising out of the use of all or any part of the analysis research.
The analyst and its affiliates companies make no representation or warranty in relation to the accuracy, completeness or reliability of the information contained in its
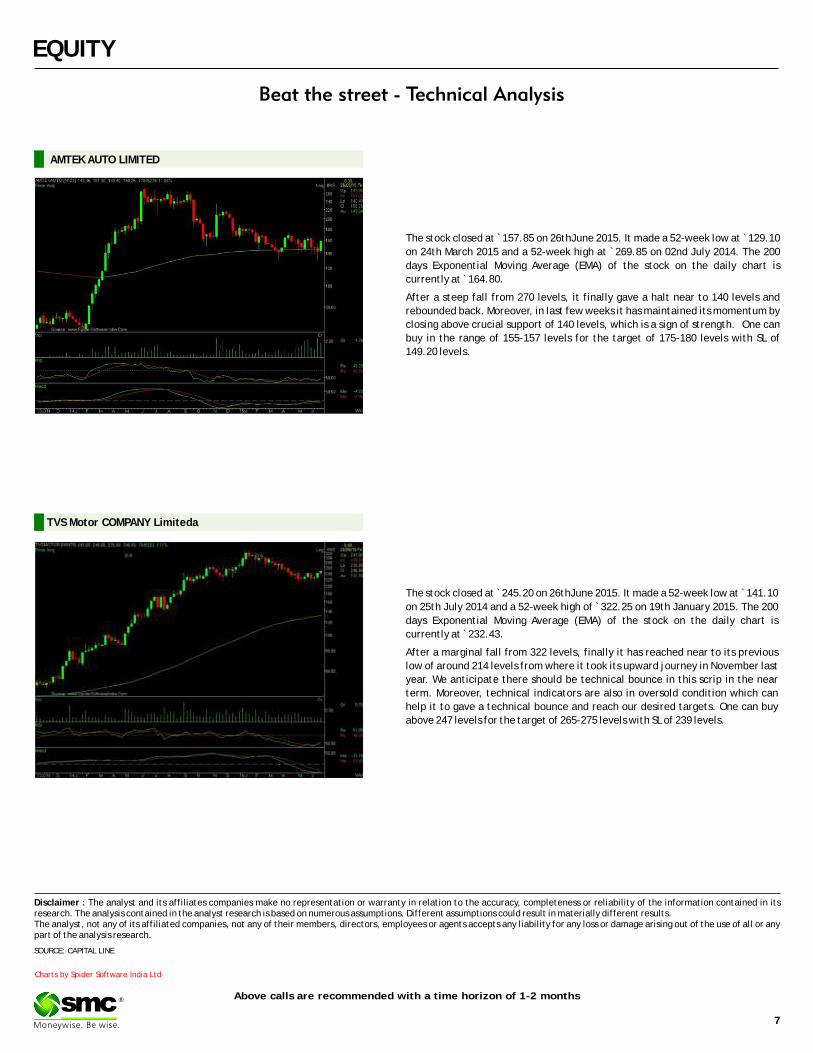
SOURCE: CAPITAL LINE
®
The stock closed at ̀ 157.85 on 26thJune 2015. It made a 52-week low at ̀ 129.10
on 24th March 2015 and a 52-week high at `269.85 on 02nd July 2014. The 200
days Exponential Moving Average (EMA) of the stock on the daily chart is
currently at ̀ 164.80.
After a steep fall from 270 levels, it finally gave a halt near to 140 levels and
rebounded back. Moreover, in last few weeks it has maintained its momentum by
closing above crucial support of 140 levels, which is a sign of strength. One can
buy in the range of 155-157 levels for the target of 175-180 levels with SL of
149.20 levels.
AMTEK AUTO LIMITED
The stock closed at ̀ 245.20 on 26thJune 2015. It made a 52-week low at ̀ 141.10
on 25th July 2014 and a 52-week high of ̀ 322.25 on 19th January 2015. The 200
days Exponential Moving Average (EMA) of the stock on the daily chart is
currently at ̀ 232.43.
After a marginal fall from 322 levels, finally it has reached near to its previous
low of around 214 levels from where it took its upward journey in November last
year. We anticipate there should be technical bounce in this scrip in the near
term. Moreover, technical indicators are also in oversold condition which can
help it to gave a technical bounce and reach our desired targets. One can buy
above 247 levels for the target of 265-275 levels with SL of 239 levels.
TVS Motor COMPANY Limiteda
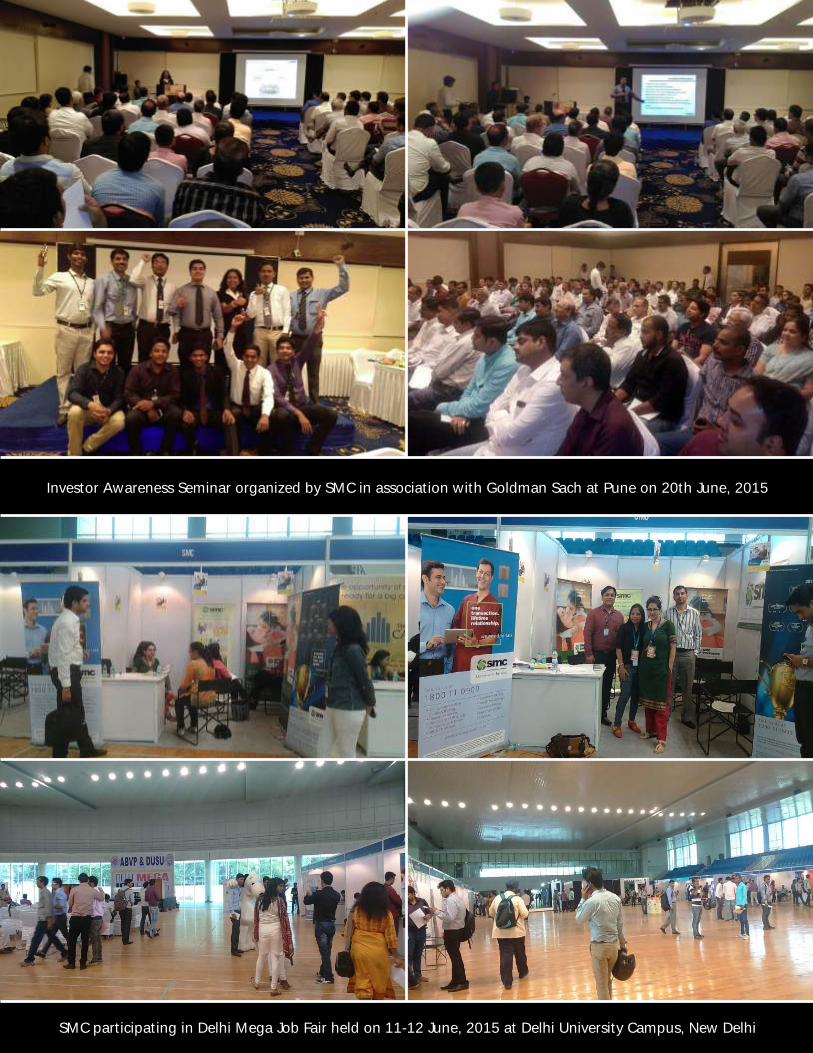
Investor Awareness Seminar organized by SMC in association with Goldman Sach at Pune on 20th June, 2015
SMC participating in Delhi Mega Job Fair held on 11-12 June, 2015 at Delhi University Campus, New Delhi