Embed Size (px)
Citation preview
Contacts: Media Relations
James Fisher 703-433-8677
Investor Relations Kurt Fawkes
800-259-3755 [email protected]
SPRINT NEXTEL REPORTS SECOND QUARTER 2007
RESULTS
Subscriber base increases by nearly 400,000, to 54 million; lower churn contributes to positive post-paid net additions
Higher post-paid ARPU and cost reductions drive strong sequential improvement in profitability
Continued strength in wireless data and Internet Protocol (IP) services
Substantial progress on efforts to enhance core business and launch strategic initiatives
Company stock buyback of $1.1 billion in the quarter
Second Quarter Segment Results
Wireless
▪ Total revenues of $8.8 billion, an increase of 3% year-over-year and 1% sequentially; data revenues increased 40% compared to the year-ago period
▪ Adjusted Operating Income* of $494 million, a decline compared to the second quarter of 2006 but a strong improvement from the first quarter
▪ Adjusted OIBDA* of $2.67 billion exceeds capital investment by $1.3 billion Wireline ▪ Total revenues of $1.6 billion, flat with the year-ago period and an increase of 2%
sequentially; 37% growth in IP revenues year-over-year ▪ Adjusted Operating Income* of $126 million, a decline from the second quarter of 2006,
but a significant increase quarter-over-quarter ▪ Adjusted OIBDA* of $259 million exceeds capital investment by $114 million
RESTON, Va. – Aug. 8, 2007 -- Sprint Nextel Corp. (NYSE: S) today reported second quarter 2007 financial results. In the quarter, the company reported a strong sequential improvement in post-paid net additions and profitability. The company experienced continued strong demand for wireless data services and wireline IP services and growth of the base of PowerSourceTM subscribers. Sprint Nextel also continues to build momentum around its planned WiMAX offering and to achieve
1
key milestones in the development of high-performance push-to-talk services to be delivered on its CDMA network. In the second quarter of 2007, diluted earnings per share (EPS) from continuing operations was 1 cent, compared to 10 cents in the second quarter of 2006, and a loss of 7 cents per share in the first quarter of 2007. Adjusted EPS before Amortization* was 25 cents, compared to 32 cents in the year-ago period and 18 cents in the first quarter of 2007. The yearly decline in earnings per share is due to a lower contribution from operations, start-up costs associated with the WiMAX initiative and increased net interest expense, partially offset by fewer common shares outstanding. The sequential improvement is due to a stronger contribution from operations. Consolidated net operating revenues of $10.2 billion in the second quarter were 2% above the year-ago period and increased 1% sequentially. Consolidated adjusted OIBDA* of $2.9 billion declined 10% from the second quarter of 2006 but increased 12% sequentially. Second quarter capital expenditures were $1.7 billion and free cash flow* was $183 million. Post-paid net additions increased more than 235,000 from the first quarter and were a positive 16,000 for the quarter. In the quarter, Sprint Nextel experienced strong post-paid demand on the CDMA platform. These gains were offset by lower demand for iDEN post-paid services. MVNO partners reported solid growth in what has typically been a seasonally weak quarter. At the end of the period, the company had enrollments of approximately 100,000 subscribers for the trial of the Boost Mobile unlimited local calling plan. These subscribers are reflected in the pre-paid subscriber category. “A year ago, and again in January of this year, we highlighted areas for improvement in our core operations and outlined investments we would be making to address these areas. These investments are focused on improving iDEN network performance, increasing customer retention, enhancing our brand image and reinvigorating our third-party channels,” said Gary Forsee, Sprint Nextel chairman and CEO. “In the second quarter, Sprint began to realize benefits from our increased funding of business operations. We reported a double-digit gain in subscriber acquisitions in our business channels. We met our goal of reducing churn to 2.0%, and network performance continued to improve. Industry-leading average post-paid customer revenues of $60 in the quarter and staffing actions in the first quarter supported a strong sequential improvement in adjusted OIBDA. “Overall we are pleased with the second quarter progress under highly competitive market conditions, and we are reiterating our 2007 targets for revenues, adjusted OIBDA and capital spending,” Forsee said. “Our focus remains on closing churn and customer care gaps, building on our recently-launched Sprint Ahead marketing campaign, and extending the EVDO footprint to meet strong demand for wireless data services. We will also continue to have significant resources assigned to the consolidation of many of our major systems, migrating customers from iDEN to CDMA utilizing PowerSource devices, preparing for the deployment of high-performance push-to-talk on our CDMA network, and cementing our plans for WiMAX deployment. While these initiatives are expected to impact reported results in the near term, we expect they will produce significant value over the long term.” Editor’s Note: In accordance with purchase accounting rules, Sprint Nextel’s reported results herein reflect affiliate acquisitions as of the date of the acquisition or from the start of the month closest to the acquisition date.
2
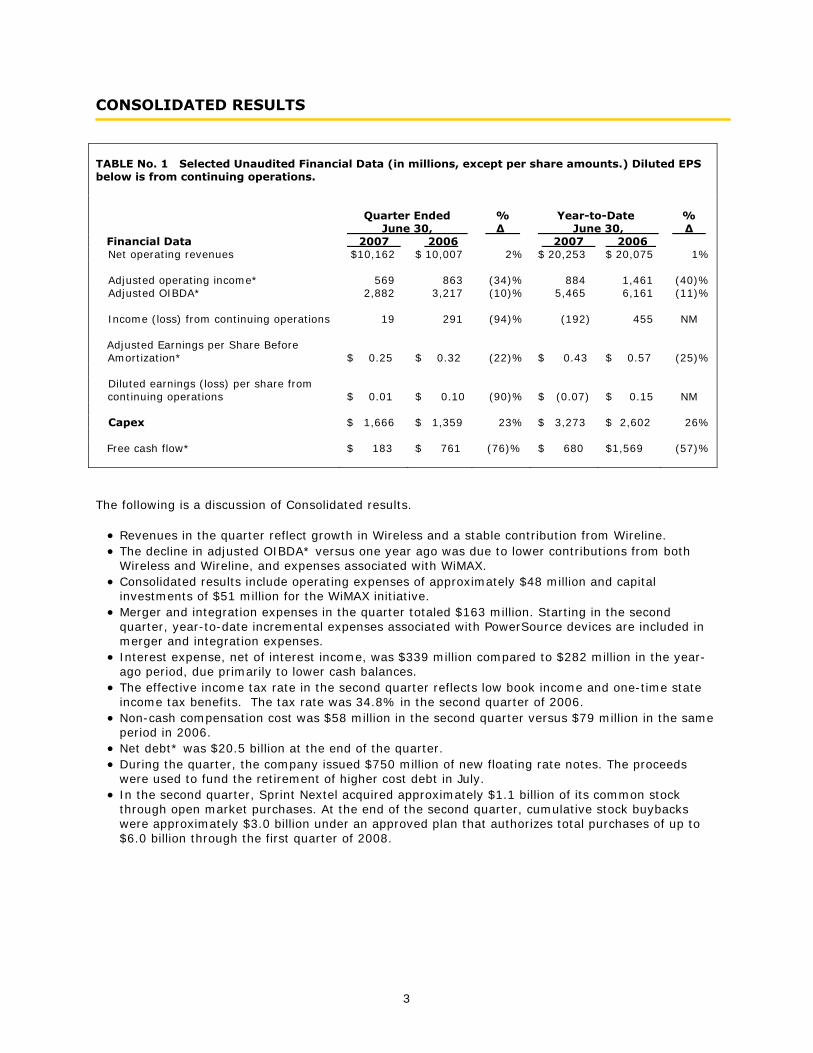
CONSOLIDATED RESULTS TABLE No. 1 Selected Unaudited Financial Data (in millions, except per share amounts.) Diluted EPS below is from continuing operations.
Quarter Ended June 30,
%
∆ Year-to-Date
June 30,
%
∆ Financial Data 2007 2006 2007 2006 Net operating revenues $10,162 $ 10,007 2% $ 20,253 $ 20,075 1%
Adjusted operating income* 569 863
(34)% 884 1,461 (40)% Adjusted OIBDA* 2,882 3,217 (10)% 5,465 6,161 (11)% Income (loss) from continuing operations 19 291 (94)% (192) 455 NM Adjusted Earnings per Share Before
Amortization* $ 0.25 $ 0.32 (22)% $ 0.43 $ 0.57 (25)%
Diluted earnings (loss) per share from continuing operations $ 0.01 $ 0.10 (90)% $ (0.07) $ 0.15 NM
Capex $ 1,666 $ 1,359 23% $ 3,273 $ 2,602 26% Free cash flow* $ 183 $ 761 (76)% $ 680 $1,569 (57)%
The following is a discussion of Consolidated results.
• Revenues in the quarter reflect growth in Wireless and a stable contribution from Wireline. • The decline in adjusted OIBDA* versus one year ago was due to lower contributions from both
Wireless and Wireline, and expenses associated with WiMAX. • Consolidated results include operating expenses of approximately $48 million and capital
investments of $51 million for the WiMAX initiative. • Merger and integration expenses in the quarter totaled $163 million. Starting in the second
quarter, year-to-date incremental expenses associated with PowerSource devices are included in merger and integration expenses.
• Interest expense, net of interest income, was $339 million compared to $282 million in the year-ago period, due primarily to lower cash balances.
• The effective income tax rate in the second quarter reflects low book income and one-time state income tax benefits. The tax rate was 34.8% in the second quarter of 2006.
• Non-cash compensation cost was $58 million in the second quarter versus $79 million in the same period in 2006.
• Net debt* was $20.5 billion at the end of the quarter. • During the quarter, the company issued $750 million of new floating rate notes. The proceeds
were used to fund the retirement of higher cost debt in July. • In the second quarter, Sprint Nextel acquired approximately $1.1 billion of its common stock
through open market purchases. At the end of the second quarter, cumulative stock buybacks were approximately $3.0 billion under an approved plan that authorizes total purchases of up to $6.0 billion through the first quarter of 2008.
3
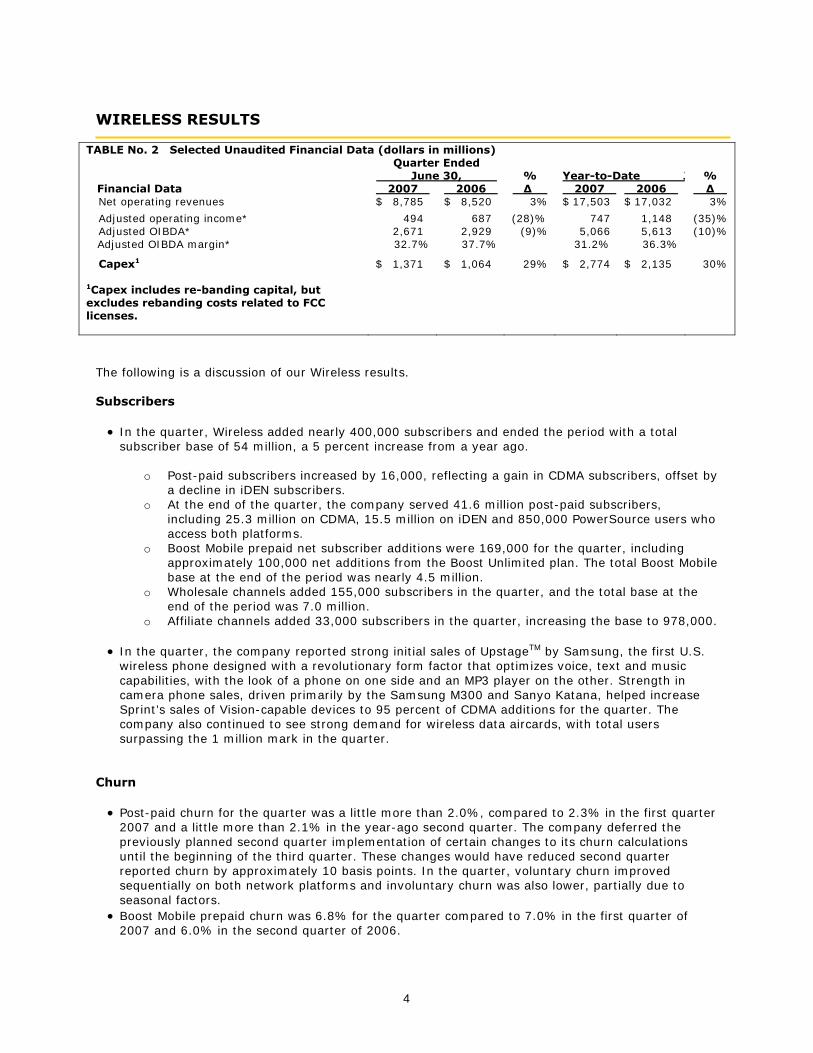
WIRELESS RESULTS
TABLE No. 2 Selected Unaudited Financial Data (dollars in millions) Quarter Ended
June 30, Year-to-Date J Financial Data 2007 2006
%
∆ 2007 2006
%
∆ Net operating revenues $ 8,785 $ 8,520 3% $ 17,503 $ 17,032 3%
Adjusted operating income* 494 687 (28)% 747 1,148 (35)% Adjusted OIBDA* 2,671 2,929 (9)% 5,066 5,613 (10)% Adjusted OIBDA margin* 32.7% 37.7% 31.2% 36.3%
Capex1 $ 1,371 $ 1,064 29% $ 2,774 $ 2,135 30% 1Capex includes re-banding capital, but excludes rebanding costs related to FCC licenses.
The following is a discussion of our Wireless results. Subscribers • In the quarter, Wireless added nearly 400,000 subscribers and ended the period with a total
subscriber base of 54 million, a 5 percent increase from a year ago.
o Post-paid subscribers increased by 16,000, reflecting a gain in CDMA subscribers, offset by a decline in iDEN subscribers.
o At the end of the quarter, the company served 41.6 million post-paid subscribers, including 25.3 million on CDMA, 15.5 million on iDEN and 850,000 PowerSource users who access both platforms.
o Boost Mobile prepaid net subscriber additions were 169,000 for the quarter, including approximately 100,000 net additions from the Boost Unlimited plan. The total Boost Mobile base at the end of the period was nearly 4.5 million.
o Wholesale channels added 155,000 subscribers in the quarter, and the total base at the end of the period was 7.0 million.
o Affiliate channels added 33,000 subscribers in the quarter, increasing the base to 978,000.
• In the quarter, the company reported strong initial sales of UpstageTM by Samsung, the first U.S. wireless phone designed with a revolutionary form factor that optimizes voice, text and music capabilities, with the look of a phone on one side and an MP3 player on the other. Strength in camera phone sales, driven primarily by the Samsung M300 and Sanyo Katana, helped increase Sprint’s sales of Vision-capable devices to 95 percent of CDMA additions for the quarter. The company also continued to see strong demand for wireless data aircards, with total users surpassing the 1 million mark in the quarter.
Churn • Post-paid churn for the quarter was a little more than 2.0%, compared to 2.3% in the first quarter
2007 and a little more than 2.1% in the year-ago second quarter. The company deferred the previously planned second quarter implementation of certain changes to its churn calculations until the beginning of the third quarter. These changes would have reduced second quarter reported churn by approximately 10 basis points. In the quarter, voluntary churn improved sequentially on both network platforms and involuntary churn was also lower, partially due to seasonal factors.
• Boost Mobile prepaid churn was 6.8% for the quarter compared to 7.0% in the first quarter of 2007 and 6.0% in the second quarter of 2006.
4
Revenues/ARPU • Net operating revenues increased 3% compared to the year-ago period. This was due to a 4%
increase in direct service revenues and a 33% increase in wholesale and affiliate revenues, partially offset by a 15% decline in equipment revenues. Direct service revenue growth was due to an increased subscriber base offset by lower average subscriber revenue. The lower equipment revenues are the result of lower gross additions and more competitive pricing, offset by higher customer upgrades.
• Total revenues increased 1% sequentially due to a higher post-paid ARPU and increased wholesale revenues offset by a decline in equipment revenues. Sequentially, gross additions declined.
• Post-paid ARPU in the quarter was a little more than $60, an annual decline of slightly more than 2%. This is an improvement from the 5% annual rate of decline in the first quarter. CDMA ARPU increased from the year-ago period while iDEN ARPU declined. Post-paid ARPU increased 1% sequentially, partially due to seasonality. On a sequential basis, CDMA ARPU increased while iDEN ARPU was flat.
• Pre-paid ARPU was a little under $31 for the quarter, a 9% decline from the year ago period and a 5% decline sequentially. In the quarter, the Boost Unlimited plans contributed only minimal revenues.
• Total data service revenues increased 40% compared to the year-ago period and 4% sequentially. Data contributed approximately $9.75, or 16% of overall post-paid ARPU in the quarter. Data ARPU on the CDMA platform of approximately $12.75 continued to lead the rest of the wireless industry by a substantial margin.
Operating Expenses
• Total operating expenses were $8.5 billion in the quarter, an increase of 8% year-over-year and a
decline of 2% sequentially. • In the quarter, costs of services increased 9% compared to the year-ago period and 2%
sequentially. The increases are due to higher network costs to support a larger footprint for EV-DO. Sprint’s EV-DO revision A network, which is the nation’s largest and fastest mobile broadband network, currently reaches an area where more than 200 million people live or work and is expected to reach approximately 230 million people by year-end 2007.
• Cost of products increased 7% year-over-year and declined 9% sequentially. The major contributors to the annual increase were handset mix and increased upgrade activity, partially offset by lower gross additions. The sequential improvement reflects higher costs in the first quarter associated with restocking Boost Mobile handsets in selected iDEN markets, lower gross additions and the elimination of incremental PowerSource costs.
• SG&A costs increased 11% from the second quarter of 2006 and declined 5% sequentially. The annual increase is mainly due to higher advertising costs, and increased dealer commissions partially offset by lower billing and IT costs. The sequential decline is mainly due to lower headcount as well as cost savings in sales, IT and billing.
• Depreciation expense was 1% below the year-ago period, but increased 4% sequentially due to an increase in the deployed capital asset base.
Capital Spending
In the quarter, Adjusted OIBDA* exceeded capital investment by $1.3 billion, and year-to-date the excess was $2.3 billion. Capital investment in the quarter was $1.4 billion. Capital expenditures continue to be mainly targeted at increasing network capacity and footprint and extending EVDO data coverage.
5
WIRELINE RESULTS
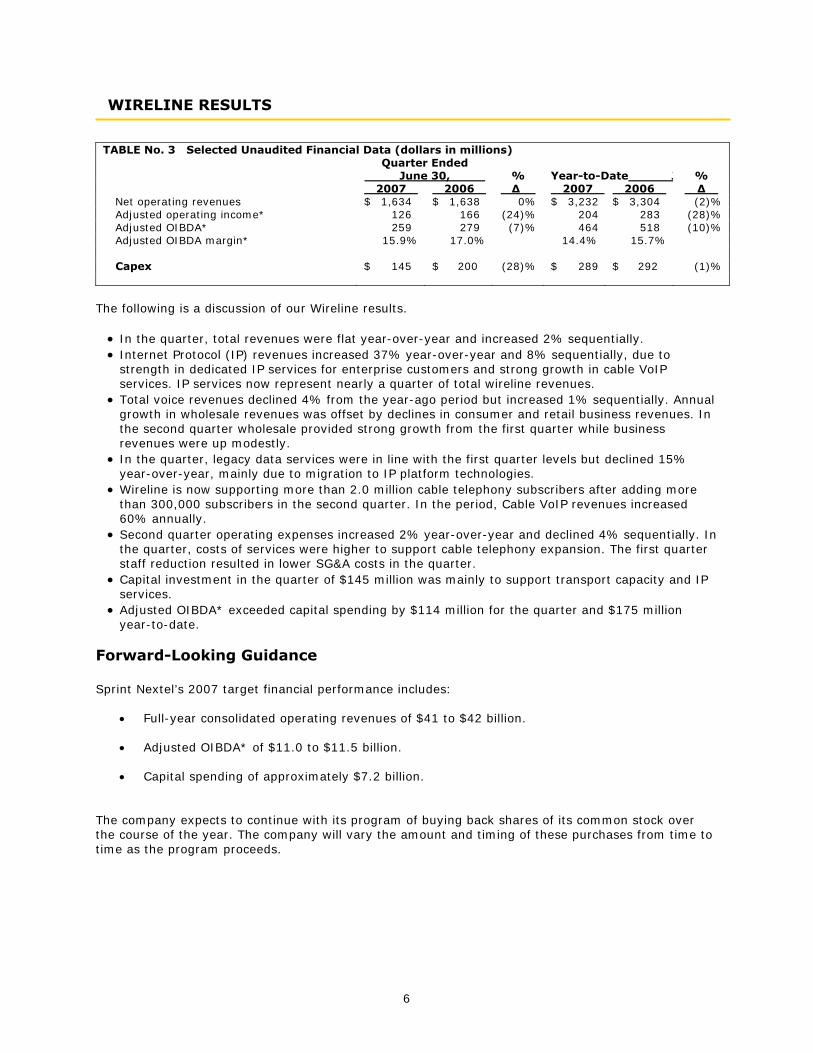
TABLE No. 3 Selected Unaudited Financial Data (dollars in millions)
Quarter Ended June 30, Year-to-Date J
2007 2006
%
∆ 2007 2006
%
∆ Net operating revenues $ 1,634 $ 1,638 0% $ 3,232 $ 3,304 (2)% Adjusted operating income* 126 166 (24)% 204 283 (28)% Adjusted OIBDA* 259 279 (7)% 464 518 (10)% Adjusted OIBDA margin* 15.9% 17.0% 14.4% 15.7% Capex $ 145 $ 200 (28)% $ 289 $ 292 (1)%
The following is a discussion of our Wireline results. • In the quarter, total revenues were flat year-over-year and increased 2% sequentially. • Internet Protocol (IP) revenues increased 37% year-over-year and 8% sequentially, due to
strength in dedicated IP services for enterprise customers and strong growth in cable VoIP services. IP services now represent nearly a quarter of total wireline revenues.
• Total voice revenues declined 4% from the year-ago period but increased 1% sequentially. Annual growth in wholesale revenues was offset by declines in consumer and retail business revenues. In the second quarter wholesale provided strong growth from the first quarter while business revenues were up modestly.
• In the quarter, legacy data services were in line with the first quarter levels but declined 15% year-over-year, mainly due to migration to IP platform technologies.
• Wireline is now supporting more than 2.0 million cable telephony subscribers after adding more than 300,000 subscribers in the second quarter. In the period, Cable VoIP revenues increased 60% annually.
• Second quarter operating expenses increased 2% year-over-year and declined 4% sequentially. In the quarter, costs of services were higher to support cable telephony expansion. The first quarter staff reduction resulted in lower SG&A costs in the quarter.
• Capital investment in the quarter of $145 million was mainly to support transport capacity and IP services.
• Adjusted OIBDA* exceeded capital spending by $114 million for the quarter and $175 million year-to-date.
Forward-Looking Guidance Sprint Nextel’s 2007 target financial performance includes:
• Full-year consolidated operating revenues of $41 to $42 billion.
• Adjusted OIBDA* of $11.0 to $11.5 billion.
• Capital spending of approximately $7.2 billion. The company expects to continue with its program of buying back shares of its common stock over the course of the year. The company will vary the amount and timing of these purchases from time to time as the program proceeds.
6
*FINANCIAL MEASURES
Sprint Nextel provides financial measures generated using generally accepted accounting principles (GAAP) and using adjustments to GAAP (non-GAAP). The non-GAAP financial measures reflect industry conventions, or standard measures of liquidity, profitability or performance commonly used by the investment community for comparability purposes. These non-GAAP measures are not measurements under accounting principles generally accepted in the United States. These measurements should be considered in addition to, but not as a substitute for, the information contained in our financial statements prepared in accordance with GAAP. We have defined below each of the non-GAAP measures we use, but these measures may not be synonymous to similar measurement terms used by other companies. Sprint Nextel provides reconciliations of these non-GAAP measures in its financial reporting. Because Sprint Nextel does not predict special items that might occur in the future, and our forecasts are developed at a level of detail different than that used to prepare GAAP-based financial measures, Sprint Nextel does not provide reconciliations to GAAP of its forward-looking financial measures. The measures used in this release include the following: Adjusted Earnings (Loss) per Share (EPS) is defined as income from continuing operations, before special items, net of tax and the diluted EPS calculated thereon. Adjusted EPS before Amortization is defined as income (loss) from continuing operations before special items and amortization, net of tax, and the diluted EPS calculated thereon. These non-GAAP measures should be used in addition to, but not as a substitute for, the analysis provided in the statement of operations. We believe that these measures are useful because they allow investors to evaluate our performance for different periods on a more comparable basis by excluding items that relate to acquired amortizable intangible assets and not to the ongoing operations of our businesses. Adjusted Net Income (Loss) is defined as income (loss) from continuing operations before special items, net of tax. Adjusted Net Income before Amortization is defined as income (loss) from continuing operations before special items and amortization, net of tax. These non-GAAP measures should be used in addition to, but not as a substitute for, the analysis provided in the statement of operations. We believe that these measures are useful because they allow investors to evaluate our performance for different periods on a more comparable basis by excluding items that do not relate to the ongoing operations of our businesses. Adjusted Operating Income (Loss) is defined as operating income (loss) before special items. This non-GAAP measure should be used in addition to, but not as a substitute for, the analysis provided in the statement of operations. We believe this measure is useful because it allows investors to evaluate our operating results for different periods on a more comparable basis by excluding special items. Adjusted OIBDA is defined as operating income before depreciation, amortization, severance, exit costs and asset impairments, and special items. Adjusted OIBDA Margin represents Adjusted OIBDA divided by non-equipment net operating revenues for Wireless and Adjusted OIBDA divided by net operating revenues for Long Distance. These non-GAAP measures should be used in addition to, but not as a substitute for, the analysis provided in the statement of operations. We believe that Adjusted OIBDA and Adjusted OIBDA Margin provide useful information to investors because they are an indicator of the strength and performance of our ongoing business operations, including our ability to fund discretionary spending such as capital expenditures, spectrum acquisitions and other investments and our ability to incur and service debt. While depreciation and amortization are considered operating costs under generally accepted accounting principles, these expenses primarily represent non-cash current period allocation of costs associated with long-lived assets acquired or constructed in prior periods. Adjusted OIBDA and Adjusted OIBDA Margin are calculations commonly used as a basis for investors, analysts and credit rating agencies to evaluate and compare the periodic and future operating performance and value of companies within the telecommunications industry. Free Cash Flow is defined as the change in cash and cash equivalents less the change in debt, investment in certain securities, proceeds from common stock and other financing activities, net, from
7
continuing operations. This non-GAAP measure should be used in addition to, but not as a substitute for, the analysis provided in the statement of cash flows. We believe that Free Cash Flow provides useful information to investors, analysts and our management about the cash generated by our core operations after interest and dividends and our ability to fund scheduled debt maturities and other financing activities, including discretionary refinancing and retirement of debt and purchase or sale of investments. Net Debt is consolidated debt, including current maturities, less cash and cash equivalents, current marketable securities and restricted cash. This non-GAAP measure should be used in addition to, but not as a substitute for, the analysis provided in the balance sheet and statement of cash flows. We believe that Net Debt provides useful information to investors, analysts and credit rating agencies about the capacity of the company to reduce the debt load and improve its capital structure. SAFE HARBOR This news release includes “forward-looking statements” within the meaning of the securities laws. The statements in this news release regarding the business outlook, expected performance, forward-looking guidance, continuation of our previously announced share buy-back program, as well as other statements that are not historical facts, are forward-looking statements. The words "estimate," "project," ”forecast,” "intend," "expect," "believe," "target," “providing guidance” and similar expressions are intended to identify forward-looking statements. Forward-looking statements are estimates and projections reflecting management's judgment based on currently available information and involve a number of risks and uncertainties that could cause actual results to differ materially from those suggested by the forward-looking statements. With respect to these forward-looking statements, management has made assumptions regarding, among other things, customer and network usage, customer growth and retention, pricing, operating costs, the timing of various events and the economic environment. Future performance cannot be assured. Actual results may differ materially from those in the forward-looking statements. Some factors that could cause actual results to differ include:
• the effects of vigorous competition, including the impact of competition on the price we are
able to charge customers for services we provide and our ability to attract new customers and retain existing customers; the overall demand for our service offerings, including the impact of decisions of new subscribers between our post-paid and prepaid services offerings and between our two network platforms; and the impact of new, emerging and competing technologies on our business;
• the impact of overall wireless market penetration on our ability to attract and retain customers
with good credit standing and the intensified competition among wireless carriers for those customers;
• the impact of difficulties we may encounter in connection with the integration of the pre-
merger Sprint and Nextel businesses, and the integration of the businesses and assets of Nextel Partners, Inc. and the PCS Affiliates that we have acquired, including the risk that these difficulties could prevent or delay our realization of the cost savings and other benefits we expect to achieve as a result of these integration efforts and the risk that we will be unable to continue to retain key employees;
• the uncertainties related to the implementation of our business strategies, investments in our
networks, our systems, and other businesses, including investments required in connection with our planned deployment of a next generation broadband wireless network;
• the costs and business risks associated with providing new services and entering new
geographic markets, including with respect to our development of new services expected to be provided using the next generation broadband wireless network that we plan to deploy;
8
• the impact of potential adverse changes in the ratings afforded our debt securities by ratings
agencies; • the effects of mergers and consolidations and new entrants in the communications industry
and unexpected announcements or developments from others in the communications industry; • unexpected results of litigation filed against us;
• the inability of third parties to perform to our requirements under agreements related to our
business operations, including a significant adverse change in Motorola, Inc.’s ability or willingness to provide handsets and related equipment and software applications, or to develop new technologies or features for our iDEN® network;
• the impact of adverse network performance; • the costs of compliance with regulatory mandates, particularly requirements related to the
Federal Communications Commission’s Report and Order; • equipment failure, natural disasters, terrorist acts, or other breaches of network or information
technology security; • one or more of the markets in which we compete being impacted by changes in political or
other factors such as monetary policy, legal and regulatory changes or other external factors over which we have no control; and
• other risks referenced from time to time in our filings with the Securities and Exchange
Commission, including our Form 10-K for the year ended December 31, 2006, in Part I, Item 1A, “Risk Factors.”
Sprint Nextel believes these forward-looking statements are reasonable; however, you should not place undue reliance on forward-looking statements, which are based on current expectations and speak only as of the date of this release. Sprint Nextel is not obligated to publicly release any revisions to forward-looking statements to reflect events after the date of this release. ABOUT SPRINT NEXTEL Sprint Nextel offers a comprehensive range of wireless and wireline communications services bringing the freedom of mobility to consumers, businesses and government users. Sprint Nextel is widely recognized for developing, engineering and deploying innovative technologies, including two robust wireless networks serving more than 54 million customers at the end of the second quarter 2007; industry-leading mobile data services; instant national and international walkie-talkie capabilities; and a global Tier 1 Internet backbone. For more information, visit www.sprint.com.
9
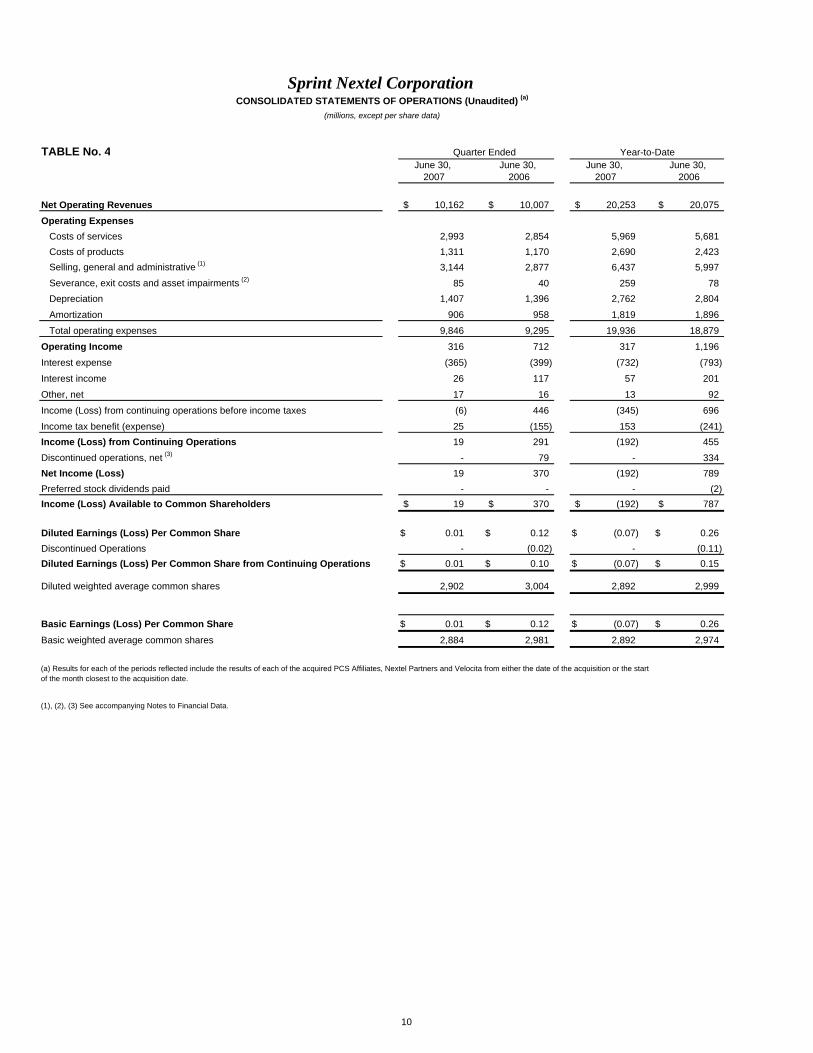
Sprint Nextel CorporationCONSOLIDATED STATEMENTS OF OPERATIONS (Unaudited) (a)
(millions, except per share data)
TABLE No. 4 Quarter Ended Year-to-DateJune 30, June 30, June 30, June 30,
2007 2006 2007 2006
Net Operating Revenues 10,162$ 10,007$ 20,253$ 20,075$
Operating ExpensesCosts of services 2,993 2,854 5,969 5,681 Costs of products 1,311 1,170 2,690 2,423 Selling, general and administrative (1) 3,144 2,877 6,437 5,997 Severance, exit costs and asset impairments (2) 85 40 259 78 Depreciation 1,407 1,396 2,762 2,804
Amortization 906 958 1,819 1,896
Total operating expenses 9,846 9,295 19,936 18,879
Operating Income 316 712 317 1,196
Interest expense (365) (399) (732) (793)
Interest income 26 117 57 201
Other, net 17 16 13 92
Income (Loss) from continuing operations before income taxes (6) 446 (345) 696
Income tax benefit (expense) 25 (155) 153 (241) Income (Loss) from Continuing Operations 19 291 (192) 455 Discontinued operations, net (3) - 79 - 334 Net Income (Loss) 19 370 (192) 789 Preferred stock dividends paid - - - (2) Income (Loss) Available to Common Shareholders 19$ 370$ (192)$ 787$
Diluted Earnings (Loss) Per Common Share 0.01$ 0.12$ (0.07)$ 0.26$ Discontinued Operations - (0.02) - (0.11) Diluted Earnings (Loss) Per Common Share from Continuing Operations 0.01$ 0.10$ (0.07)$ 0.15$
Diluted weighted average common shares 2,902 3,004 2,892 2,999
Basic Earnings (Loss) Per Common Share 0.01$ 0.12$ (0.07)$ 0.26$
Basic weighted average common shares 2,884 2,981 2,892 2,974
(a) Results for each of the periods reflected include the results of each of the acquired PCS Affiliates, Nextel Partners and Velocita from either the date of the acquisition or the start of the month closest to the acquisition date.
(1), (2), (3) See accompanying Notes to Financial Data.
10
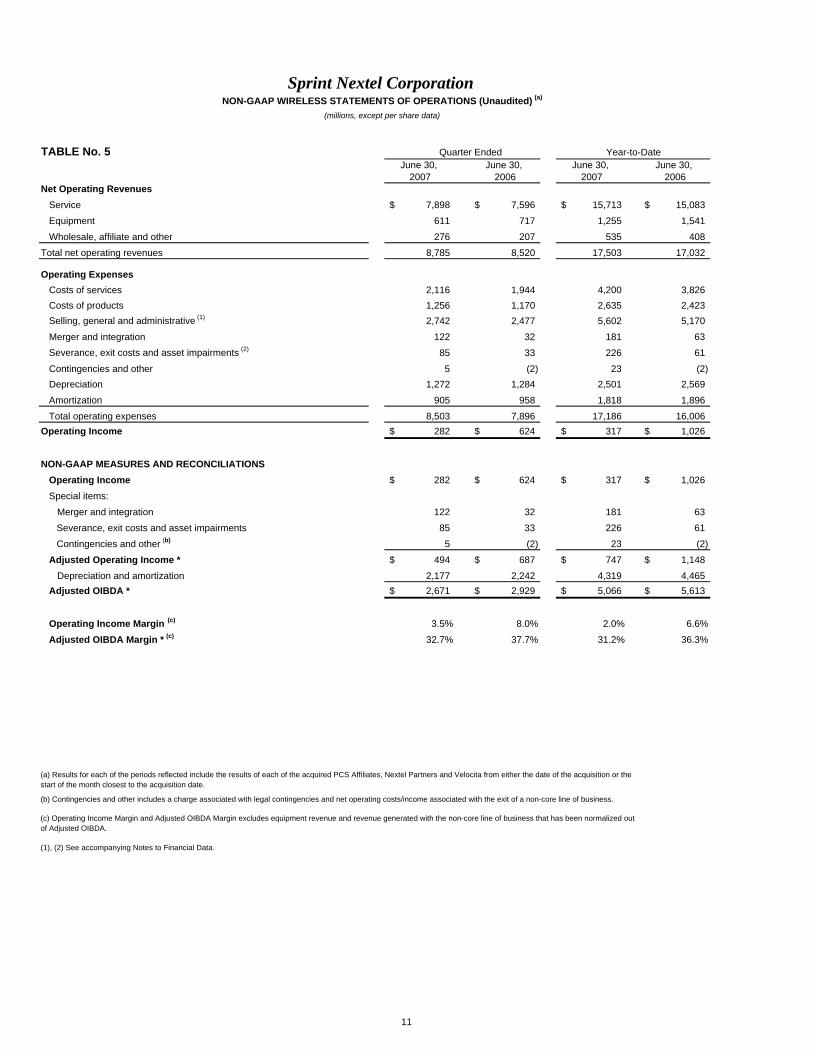
Sprint Nextel CorporationNON-GAAP WIRELESS STATEMENTS OF OPERATIONS (Unaudited) (a)
(millions, except per share data)
TABLE No. 5 Quarter Ended Year-to-DateJune 30, June 30, June 30, June 30,
2007 2006 2007 2006Net Operating Revenues
Service 7,898$ 7,596$ 15,713$ 15,083$
Equipment 611 717 1,255 1,541
Wholesale, affiliate and other 276 207 535 408
Total net operating revenues 8,785 8,520 17,503 17,032
Operating ExpensesCosts of services 2,116 1,944 4,200 3,826 Costs of products 1,256 1,170 2,635 2,423 Selling, general and administrative (1) 2,742 2,477 5,602 5,170
Merger and integration 122 32 181 63 Severance, exit costs and asset impairments (2) 85 33 226 61
Contingencies and other 5 (2) 23 (2) Depreciation 1,272 1,284 2,501 2,569
Amortization 905 958 1,818 1,896
Total operating expenses 8,503 7,896 17,186 16,006 Operating Income 282$ 624$ 317$ 1,026$
NON-GAAP MEASURES AND RECONCILIATIONSOperating Income 282$ 624$ 317$ 1,026$
Special items:
Merger and integration 122 32 181 63
Severance, exit costs and asset impairments 85 33 226 61
Contingencies and other (b) 5 (2) 23 (2)
Adjusted Operating Income * 494$ 687$ 747$ 1,148$
Depreciation and amortization 2,177 2,242 4,319 4,465 Adjusted OIBDA * 2,671$ 2,929$ 5,066$ 5,613$
Operating Income Margin (c) 3.5% 8.0% 2.0% 6.6%
Adjusted OIBDA Margin * (c) 32.7% 37.7% 31.2% 36.3%
(a) Results for each of the periods reflected include the results of each of the acquired PCS Affiliates, Nextel Partners and Velocita from either the date of the acquisition or the start of the month closest to the acquisition date.
(b) Contingencies and other includes a charge associated with legal contingencies and net operating costs/income associated with the exit of a non-core line of business.
(c) Operating Income Margin and Adjusted OIBDA Margin excludes equipment revenue and revenue generated with the non-core line of business that has been normalized out of Adjusted OIBDA.
(1), (2) See accompanying Notes to Financial Data.
11
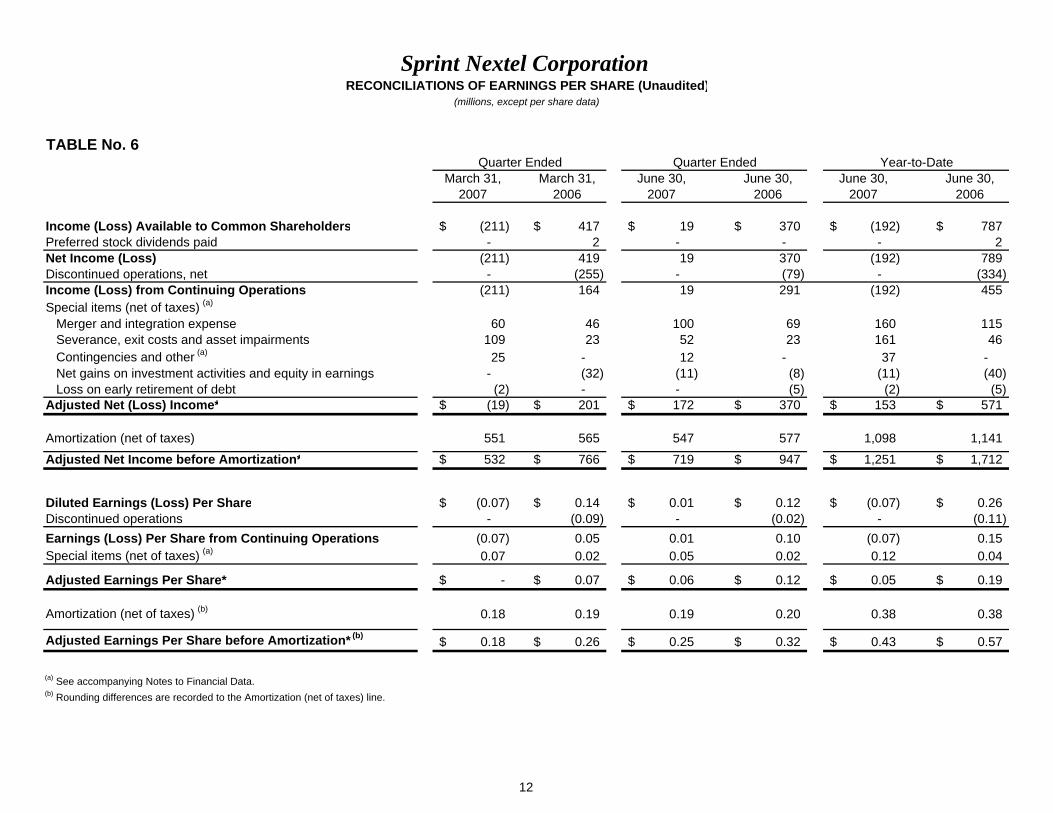
Sprint Nextel CorporationRECONCILIATIONS OF EARNINGS PER SHARE (Unaudited)
(millions, except per share data)
TABLE No. 6Quarter Ended Quarter Ended Year-to-Date
March 31, March 31, June 30, June 30, June 30, June 30,2007 2006 2007 2006 2007 2006
Income (Loss) Available to Common Shareholders (211)$ 417$ 19$ 370$ (192)$ 787$ Preferred stock dividends paid - 2 - - - 2 Net Income (Loss) (211) 419 19 370 (192) 789 Discontinued operations, net - (255) - (79) - (334) Income (Loss) from Continuing Operations (211) 164 19 291 (192) 455 Special items (net of taxes) (a)
Merger and integration expense 60 46 100 69 160 115 Severance, exit costs and asset impairments 109 23 52 23 161 46 Contingencies and other (a) 25 - 12 - 37 - Net gains on investment activities and equity in earnings - (32) (11) (8) (11) (40) Loss on early retirement of debt (2) - - (5) (2) (5)
Adjusted Net (Loss) Income* (19)$ 201$ 172$ 370$ 153$ 571$
Amortization (net of taxes) 551 565 547 577 1,098 1,141 Adjusted Net Income before Amortization* 532$ 766$ 719$ 947$ 1,251$ 1,712$
Diluted Earnings (Loss) Per Share (0.07)$ 0.14$ 0.01$ 0.12$ (0.07)$ 0.26$ Discontinued operations - (0.09) - (0.02) - (0.11) Earnings (Loss) Per Share from Continuing Operations (0.07) 0.05 0.01 0.10 (0.07) 0.15 Special items (net of taxes) (a) 0.07 0.02 0.05 0.02 0.12 0.04
Adjusted Earnings Per Share* -$ 0.07$ 0.06$ 0.12$ 0.05$ 0.19$
Amortization (net of taxes) (b) 0.18 0.19 0.19 0.20 0.38 0.38
Adjusted Earnings Per Share before Amortization* (b) 0.18$ 0.26$ 0.25$ 0.32$ 0.43$ 0.57$
(a) See accompanying Notes to Financial Data.(b) Rounding differences are recorded to the Amortization (net of taxes) line.
12
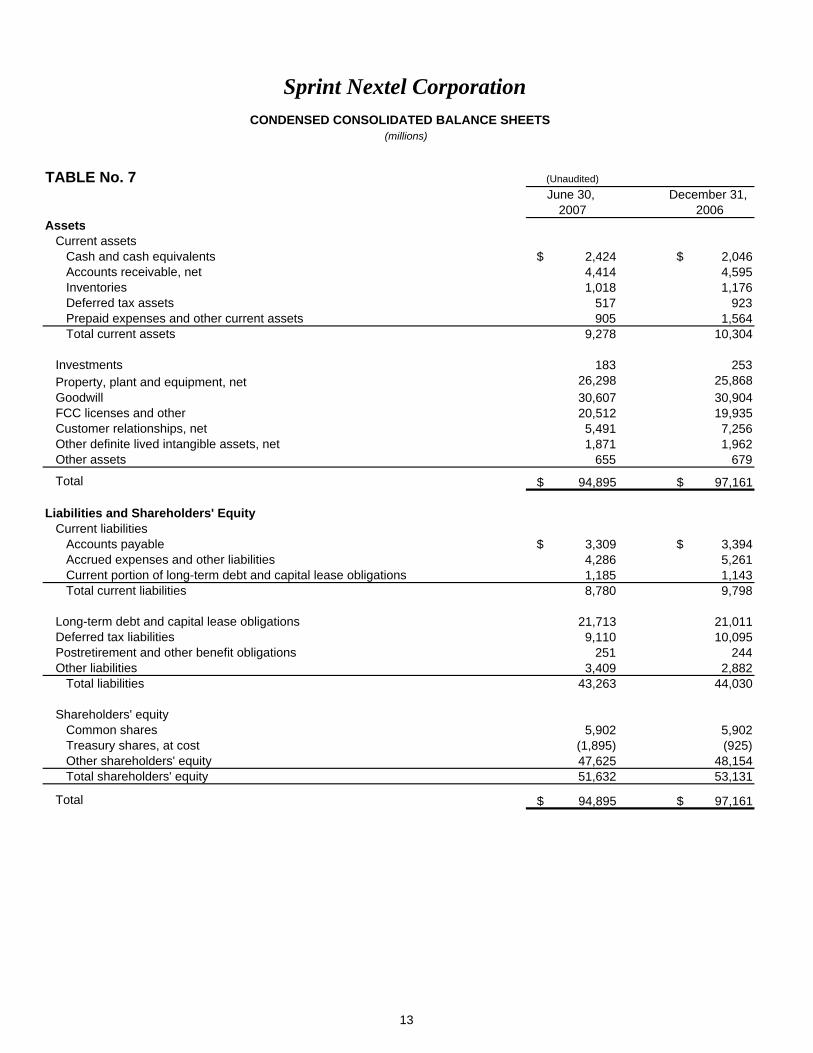
Sprint Nextel CorporationCONDENSED CONSOLIDATED BALANCE SHEETS
(millions)
TABLE No. 7 (Unaudited)June 30, December 31,
2007 2006Assets
Current assetsCash and cash equivalents $ 2,424 $ 2,046 Accounts receivable, net 4,414 4,595 Inventories 1,018 1,176 Deferred tax assets 517 923 Prepaid expenses and other current assets 905 1,564 Total current assets 9,278 10,304
Investments 183 253 Property, plant and equipment, net 26,298 25,868 Goodwill 30,607 30,904 FCC licenses and other 20,512 19,935 Customer relationships, net 5,491 7,256 Other definite lived intangible assets, net 1,871 1,962 Other assets 655 679
Total $ 94,895 $ 97,161
Liabilities and Shareholders' EquityCurrent liabilities
Accounts payable $ 3,309 $ 3,394 Accrued expenses and other liabilities 4,286 5,261 Current portion of long-term debt and capital lease obligations 1,185 1,143 Total current liabilities 8,780 9,798
Long-term debt and capital lease obligations 21,713 21,011 Deferred tax liabilities 9,110 10,095 Postretirement and other benefit obligations 251 244 Other liabilities 3,409 2,882
Total liabilities 43,263 44,030
Shareholders' equityCommon shares 5,902 5,902 Treasury shares, at cost (1,895) (925)Other shareholders' equity 47,625 48,154 Total shareholders' equity 51,632 53,131
Total $ 94,895 $ 97,161
13
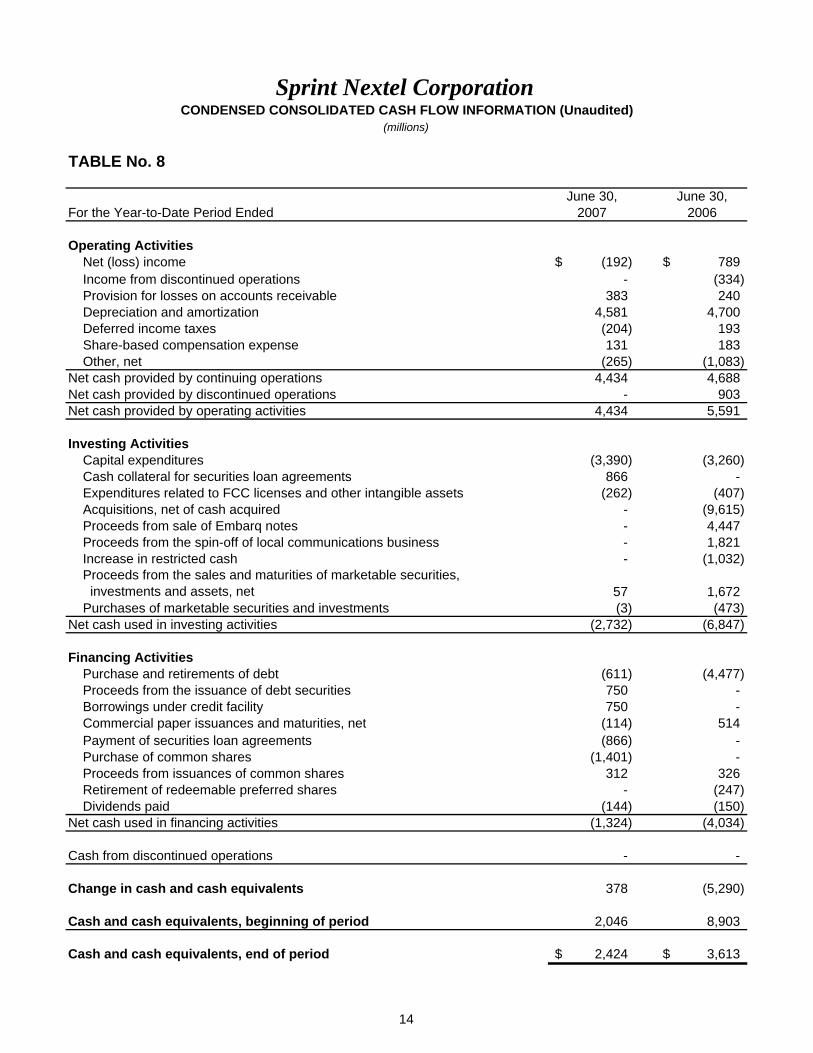
Sprint Nextel CorporationCONDENSED CONSOLIDATED CASH FLOW INFORMATION (Unaudited)
(millions)
TABLE No. 8
June 30, June 30,For the Year-to-Date Period Ended 2007 2006
Operating Activities Net (loss) income (192)$ 789$ Income from discontinued operations - (334) Provision for losses on accounts receivable 383 240 Depreciation and amortization 4,581 4,700 Deferred income taxes (204) 193 Share-based compensation expense 131 183 Other, net (265) (1,083) Net cash provided by continuing operations 4,434 4,688 Net cash provided by discontinued operations - 903 Net cash provided by operating activities 4,434 5,591
Investing Activities Capital expenditures (3,390) (3,260) Cash collateral for securities loan agreements 866 - Expenditures related to FCC licenses and other intangible assets (262) (407) Acquisitions, net of cash acquired - (9,615) Proceeds from sale of Embarq notes - 4,447 Proceeds from the spin-off of local communications business - 1,821 Increase in restricted cash - (1,032) Proceeds from the sales and maturities of marketable securities, investments and assets, net 57 1,672 Purchases of marketable securities and investments (3) (473) Net cash used in investing activities (2,732) (6,847)
Financing Activities Purchase and retirements of debt (611) (4,477) Proceeds from the issuance of debt securities 750 - Borrowings under credit facility 750 - Commercial paper issuances and maturities, net (114) 514 Payment of securities loan agreements (866) - Purchase of common shares (1,401) - Proceeds from issuances of common shares 312 326 Retirement of redeemable preferred shares - (247) Dividends paid (144) (150) Net cash used in financing activities (1,324) (4,034)
Cash from discontinued operations - -
Change in cash and cash equivalents 378 (5,290)
Cash and cash equivalents, beginning of period 2,046 8,903
Cash and cash equivalents, end of period 2,424$ 3,613$
14
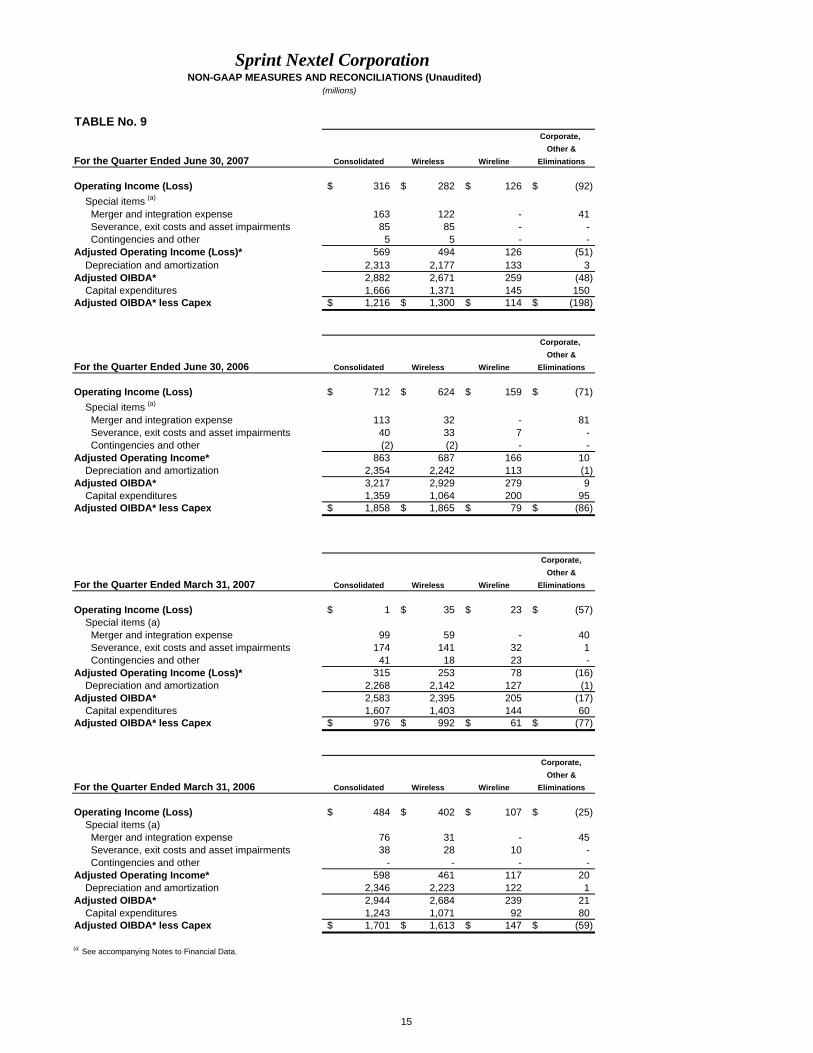
Sprint Nextel CorporationNON-GAAP MEASURES AND RECONCILIATIONS (Unaudited)
(millions)
TABLE No. 9 Corporate,
Other &For the Quarter Ended June 30, 2007 Consolidated Wireless Wireline Eliminations
Operating Income (Loss) 316$ 282$ 126$ (92)$ Special items (a)
Merger and integration expense 163 122 - 41 Severance, exit costs and asset impairments 85 85 - - Contingencies and other 5 5 - - Adjusted Operating Income (Loss)* 569 494 126 (51) Depreciation and amortization 2,313 2,177 133 3 Adjusted OIBDA* 2,882 2,671 259 (48) Capital expenditures 1,666 1,371 145 150 Adjusted OIBDA* less Capex 1,216$ 1,300$ 114$ (198)$
Corporate, Other &
For the Quarter Ended June 30, 2006 Consolidated Wireless Wireline Eliminations
Operating Income (Loss) 712$ 624$ 159$ (71)$ Special items (a)
Merger and integration expense 113 32 - 81 Severance, exit costs and asset impairments 40 33 7 - Contingencies and other (2) (2) - - Adjusted Operating Income* 863 687 166 10 Depreciation and amortization 2,354 2,242 113 (1) Adjusted OIBDA* 3,217 2,929 279 9 Capital expenditures 1,359 1,064 200 95 Adjusted OIBDA* less Capex 1,858$ 1,865$ 79$ (86)$
Corporate,Other &
For the Quarter Ended March 31, 2007 Consolidated Wireless Wireline Eliminations
Operating Income (Loss) 1$ 35$ 23$ (57)$ Special items (a) Merger and integration expense 99 59 - 40 Severance, exit costs and asset impairments 174 141 32 1 Contingencies and other 41 18 23 - Adjusted Operating Income (Loss)* 315 253 78 (16) Depreciation and amortization 2,268 2,142 127 (1) Adjusted OIBDA* 2,583 2,395 205 (17) Capital expenditures 1,607 1,403 144 60 Adjusted OIBDA* less Capex 976$ 992$ 61$ (77)$
Corporate,Other &
For the Quarter Ended March 31, 2006 Consolidated Wireless Wireline Eliminations
Operating Income (Loss) 484$ 402$ 107$ (25)$ Special items (a) Merger and integration expense 76 31 - 45 Severance, exit costs and asset impairments 38 28 10 - Contingencies and other - - - - Adjusted Operating Income* 598 461 117 20 Depreciation and amortization 2,346 2,223 122 1 Adjusted OIBDA* 2,944 2,684 239 21 Capital expenditures 1,243 1,071 92 80 Adjusted OIBDA* less Capex 1,701$ 1,613$ 147$ (59)$
(a) See accompanying Notes to Financial Data.
15
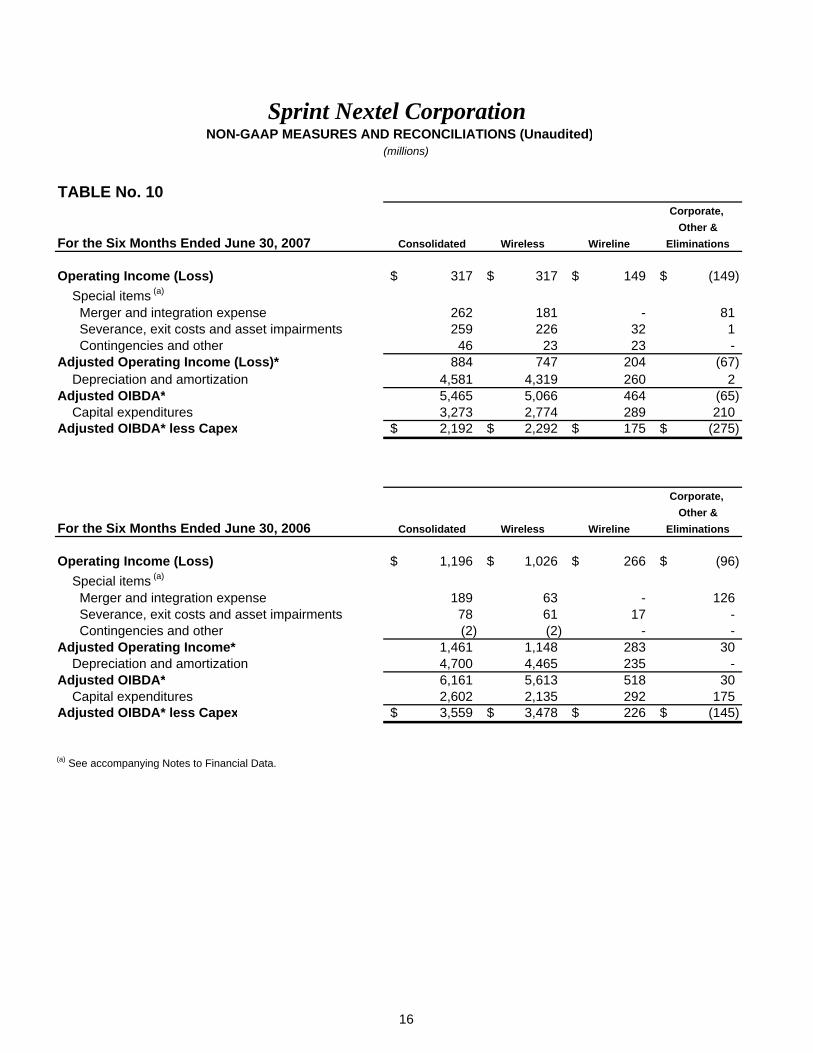
Sprint Nextel CorporationNON-GAAP MEASURES AND RECONCILIATIONS (Unaudited)
(millions)
TABLE No. 10 Corporate,
Other &For the Six Months Ended June 30, 2007 Consolidated Wireless Wireline Eliminations
Operating Income (Loss) 317$ 317$ 149$ (149)$ Special items (a)
Merger and integration expense 262 181 - 81 Severance, exit costs and asset impairments 259 226 32 1 Contingencies and other 46 23 23 - Adjusted Operating Income (Loss)* 884 747 204 (67) Depreciation and amortization 4,581 4,319 260 2 Adjusted OIBDA* 5,465 5,066 464 (65) Capital expenditures 3,273 2,774 289 210 Adjusted OIBDA* less Capex 2,192$ 2,292$ 175$ (275)$
Corporate, Other &
For the Six Months Ended June 30, 2006 Consolidated Wireless Wireline Eliminations
Operating Income (Loss) 1,196$ 1,026$ 266$ (96)$ Special items (a)
Merger and integration expense 189 63 - 126 Severance, exit costs and asset impairments 78 61 17 - Contingencies and other (2) (2) - - Adjusted Operating Income* 1,461 1,148 283 30 Depreciation and amortization 4,700 4,465 235 - Adjusted OIBDA* 6,161 5,613 518 30 Capital expenditures 2,602 2,135 292 175 Adjusted OIBDA* less Capex 3,559$ 3,478$ 226$ (145)$
(a) See accompanying Notes to Financial Data.
16
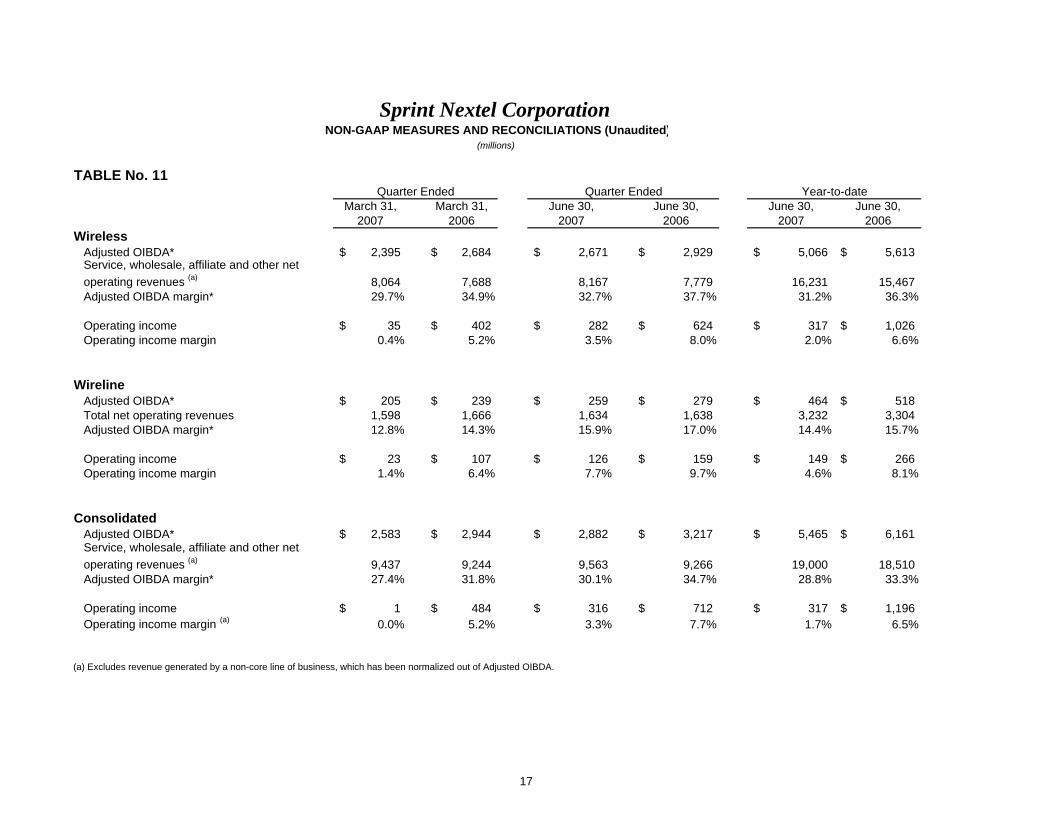
Sprint Nextel CorporationNON-GAAP MEASURES AND RECONCILIATIONS (Unaudited)
(millions)
TABLE No. 11Quarter Ended Quarter Ended Year-to-date
March 31, March 31, June 30, June 30, June 30, June 30,2007 2006 2007 2006 2007 2006
WirelessAdjusted OIBDA* 2,395$ 2,684$ 2,671$ 2,929$ 5,066$ 5,613$ Service, wholesale, affiliate and other net operating revenues (a) 8,064 7,688 8,167 7,779 16,231 15,467 Adjusted OIBDA margin* 29.7% 34.9% 32.7% 37.7% 31.2% 36.3%
Operating income 35$ 402$ 282$ 624$ 317$ 1,026$ Operating income margin 0.4% 5.2% 3.5% 8.0% 2.0% 6.6%
WirelineAdjusted OIBDA* 205$ 239$ 259$ 279$ 464$ 518$ Total net operating revenues 1,598 1,666 1,634 1,638 3,232 3,304 Adjusted OIBDA margin* 12.8% 14.3% 15.9% 17.0% 14.4% 15.7%
Operating income 23$ 107$ 126$ 159$ 149$ 266$ Operating income margin 1.4% 6.4% 7.7% 9.7% 4.6% 8.1%
Consolidated Adjusted OIBDA* 2,583$ 2,944$ 2,882$ 3,217$ 5,465$ 6,161$ Service, wholesale, affiliate and other net operating revenues (a) 9,437 9,244 9,563 9,266 19,000 18,510 Adjusted OIBDA margin* 27.4% 31.8% 30.1% 34.7% 28.8% 33.3%
Operating income 1$ 484$ 316$ 712$ 317$ 1,196$ Operating income margin (a) 0.0% 5.2% 3.3% 7.7% 1.7% 6.5%
(a) Excludes revenue generated by a non-core line of business, which has been normalized out of Adjusted OIBDA.
17
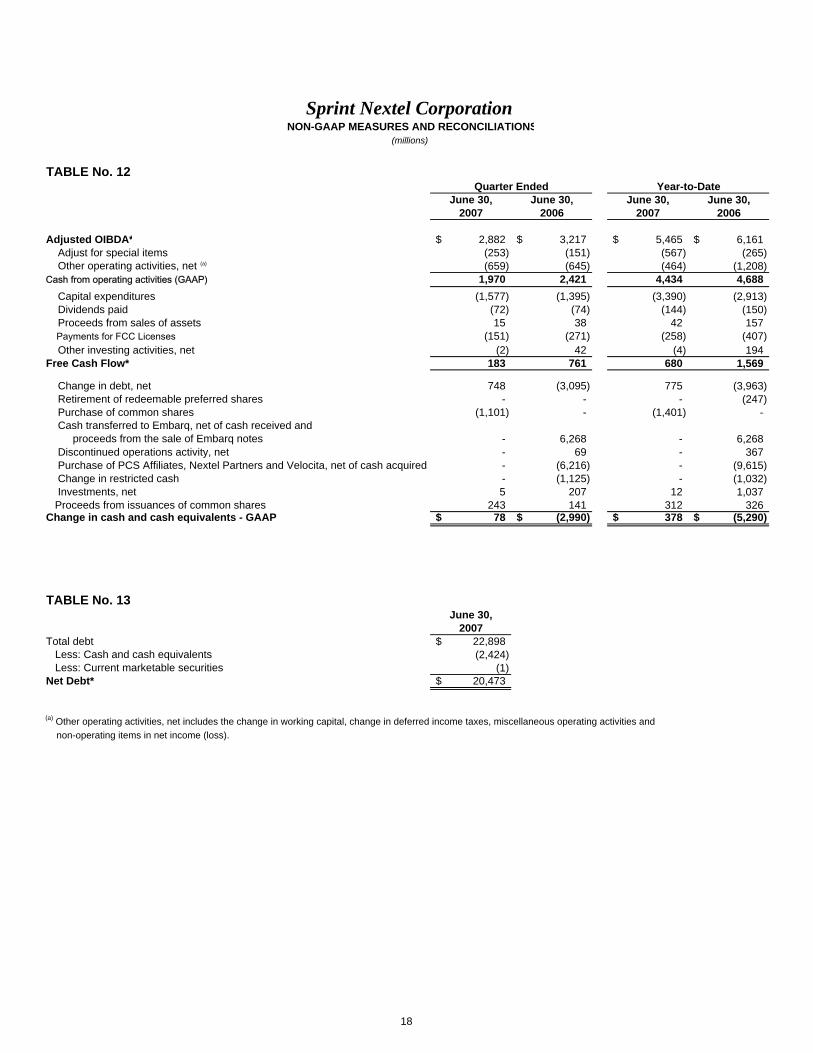
Total debt
Net Debt
(a)
TABLE No. 12
Adjusted OIBDA
Dividends paid
Free Cash Flow*
TABLE No. 13
Adjust for special items
Capital expenditures
Change in debt, net
Investments, net
*
Other operating activities, net
Proceeds from sales of assets Payments for FCC Licenses Other investing activities, net
Purchase of common shares
Change in restricted cash
*
Cash from operating activities (GAAP)
Discontinued operations activity, net
Less: Cash and cash equivalentsLess: Current marketable securities
non-operating items in net income (loss).
Retirement of redeemable preferred shares
proceeds from the sale of Embarq notes
Proceeds from issuances of common sharesChange in cash and cash equivalents - GAAP
Cash transferred to Embarq, net of cash received and
(a)
Purchase of PCS Affiliates, Nextel Partners and Velocita, net of cash acquired
Other operating activities, net includes the change in working capital, change in deferred income taxes, miscellaneous operati
Sprint Nextel CorporationNON-GAAP MEASURES AND RECONCILIATION
(millions)
$
$
June 30,2007
$
$
June 30,2007
22,898
20,473
2,882(253)(659)
1,970(1,577)
(72) 15
(151)(2)
183
748-
(1,101)
- - - - 5
24378
(2,424)(1)
Quarter Ended
S
$
$
June 30,2006
3,217 (151) (645)
2,421(1,395)
(74) 38
(271) 42
761
(3,095)- -
6,268 69
(6,216)(1,125)
207 141
(2,990)
ng activities and
$
$
June 30,2007
5,465(567)(464)
4,434(3,390)
(144)42
(258)(4)
680
775 -
(1,401)
- - - -
12 312 378
Year-to-Date
$
$
June 30,2006
6,161(265)
(1,208)4,688
(2,913)(150)157
(407)194
1,569
(3,963)(247)
-
6,268367
(9,615)(1,032)1,037
326(5,290)
18
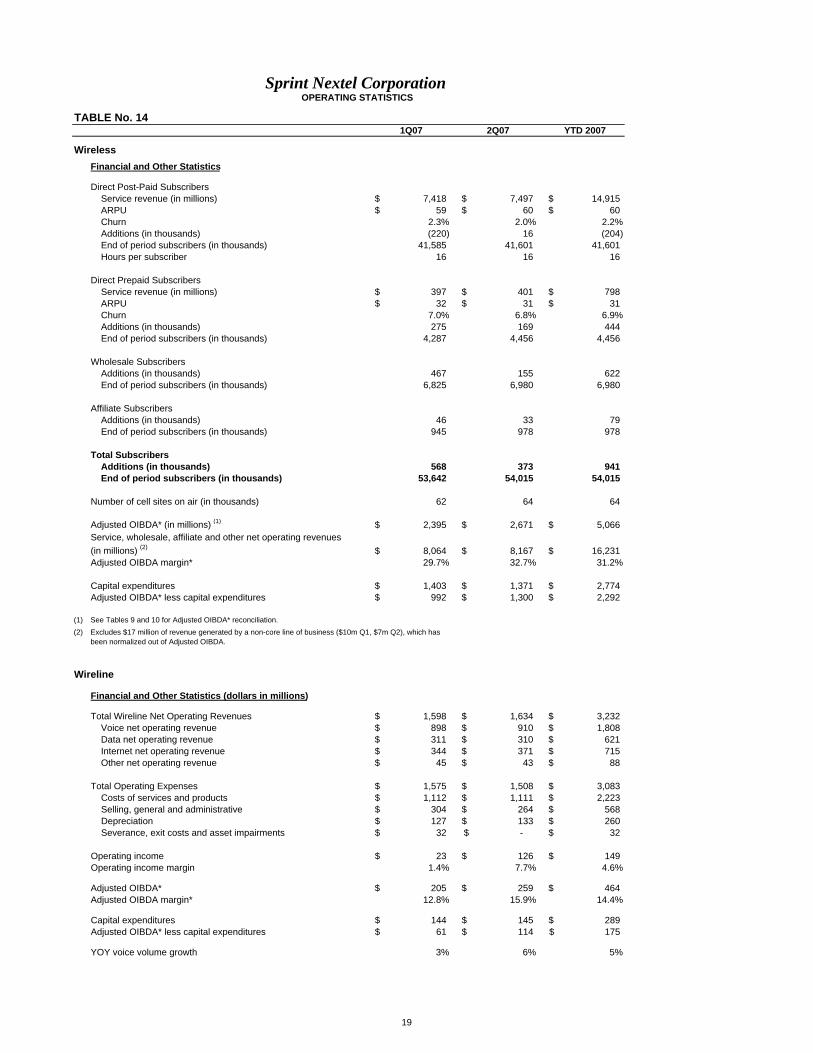
Wireless
Direct Post-Paid Subscribers Service revenue (in millions)
End of period subscribers (in thousands) 41,585 41,601 41,601
Wireline
Financial and Other Statistics (dollars in millions)
Total Wireline Net Operating Revenues 1,598$ 1,634$ 3,232$ Voice net operating revenue 898$ 910$ 1,808$
Adjusted OIBDA* 205$ 259$ 464$ Adjusted OIBDA margin* 12.8% 15.9% 14.4%
YOY voice volume growth 3% 6% 5%
Sprint Nextel CorporationOPERATING STATISTICS
TABLE No. 141Q07 2Q07 YTD 2007
Financial and Other Statistics
7,418$ 7,497$ 14,915$ ARPU 59$ 60$ 60$ Churn Additions (in thousands)
2.3%(220)
2.0%16
2.2%(204)
Hours per subscriber 16 16 16
Direct Prepaid Subscribers Service revenue (in millions) ARPU
$ $
397 $ 32 $
401 $ 31 $
798 31
Churn Additions (in thousands)
7.0%275
6.8%169
6.9%444
End of period subscribers (in thousands) 4 ,287 4,456 4,456
Wholesale Subscribers Additions (in thousands) End of period subscribers (in thousands)
6
467 ,825
155 6,980
622 6,980
Affiliate Subscribers Additions (in thousands) 46 33 79 End of period subscribers (in thousands) 945 978 978
Total Subscribers Additions (in thousands) 568 373 941 End of period subscribers (in thousands) 53 ,642 54,015 54,015
Number of cell sites on air (in thousands) 62 64 64
Adjusted OIBDA* (in millions) (1)
Service, wholesale, affiliate and other net operating revenues2$ ,395 $ 2,671 $ 5,066
(in millions) (2) 8$ ,064 $ 8,167 $ 16,231 Adjusted OIBDA margin* 29.7% 32.7% 31.2%
Capital expenditures 1$ ,403 $ 1,371 $ 2,774 Adjusted OIBDA* less capital expenditures $ 992 $ 1,300 $ 2,292
(1) See Tables 9 and 10 for Adjusted OIBDA* reconciliation.(2) Excludes $17 million of revenue generated by a non-core line of business ($10m Q
been normalized out of Adjusted OIBDA.1, $7m Q2), which has
Data net operating revenue 311$ 310$ 621$ Internet net operating revenue 344$ 371$ 715$ Other net operating revenue 45$ 43$ 88$
Total Operating Expenses 1,575$ 1,508$ 3,083$ Costs of services and products Selling, general and administrative
1,112$ 1,111$ 2,223$ 304$ 264$ 568$
Depreciation 127$ 133$ 260$ Severance, exit costs and asset impairments 32$ -$ 32$
Operating incomeOperating income margin
23$ 126$ 149$ 1.4% 7.7% 4.6%
Capital expenditures 144$ 145$ 289$ Adjusted OIBDA* less capital expenditures 61$ 114$ 175$
19
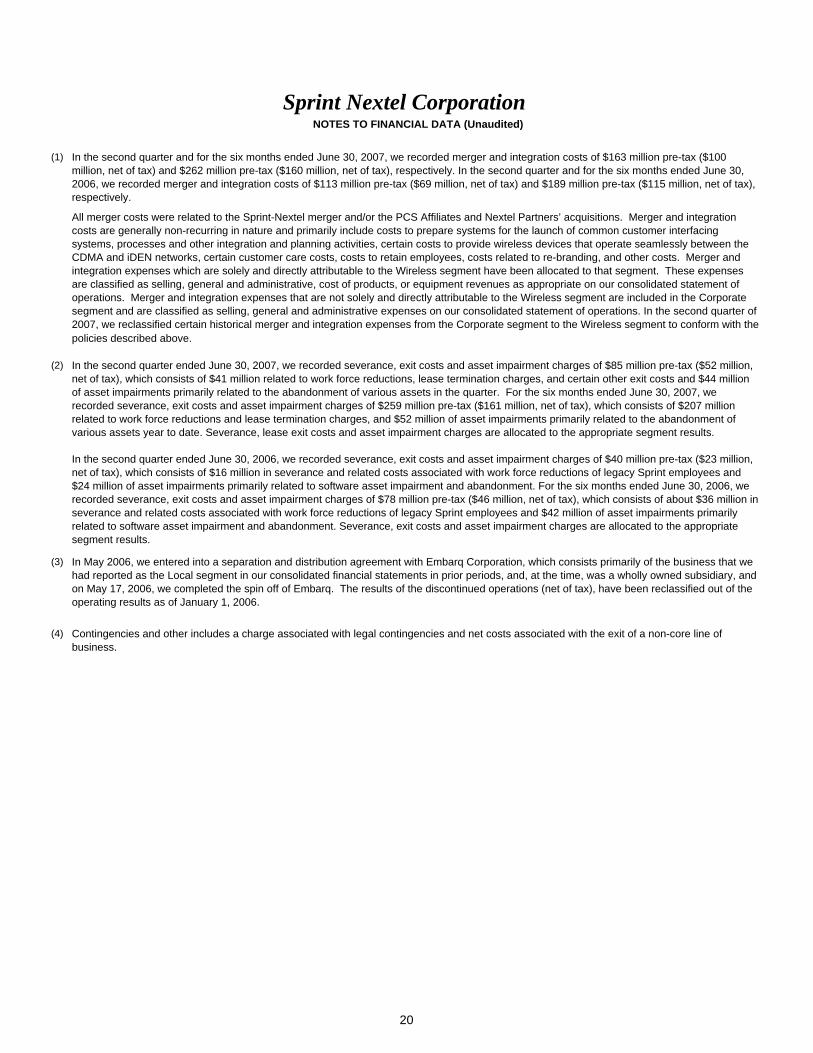
(1)
(2)
(3)
(4)
1
In the second quarter ended June 30, 2007, we recorded severance, exit costs and asset impairment charges of $85 million pre-tax ($52 million,
various assets year to date. Severance, lease exit costs and asset impairment charges are allocated to the appropriate segment results.
mCDMA and iDEN networks, certain customer care costs, costs to retain employees, costs related to re-branding, and other costs. Merger and
t.
2007, we reclassified certain historical merger and integration expenses from the Corporate segment to the Wireless segment to conform with the
x ($23 million, net of tax), which consists of $16 million in severance and related costs associated with work force reductions of legacy Sprint employees and $24 million of asset impairments primarily related to software asset impairment and abandonment. For the six months ended June 30, 2006, we recorded severance, exit costs and asset impairment charges of $78 million pre-tax ($46 million, net of tax), which consists of about $36 million in
on May 17, 2006, we completed the spin off of Embarq. The results of the discontinued operations (net of tax), have been reclassified out of the
Contingencies and other includes a charge associated with legal contingencies and net costs associated with the exit of a non-core line of
Sprint Nextel CorporationNOTES TO FINANCIAL DATA (Unaudited)
In the second quarter and for the six months ended June 30, 2007, we recorded merger and integration costs of $163 million pre-tax ($100 million, net of tax) and $262 million pre-tax ($160 million, net of tax), respectively. In the second quarter and for the six months ended June 30, 2006, we recorded merger and integration costs of $113 million pre-tax ($69 million, net of tax) and $189 million pre-tax ($1 5 million, net of tax), respectively.
All merger costs were related to the Sprint-Nextel merger and/or the PCS Affiliates and Nextel Partners’ acquisitions. Merger and integration costs are generally non-recurring in nature and primarily include costs to prepare systems for the launch of common customer interfacing systems, processes and other integration and planning activities, certain costs to provide wireless devices that operate sea lessly between the
integration expenses which are solely and directly attributable to the Wireless segment have been allocated to that segmen These expenses are classified as selling, general and administrative, cost of products, or equipment revenues as appropriate on our consolidated statement of operations. Merger and integration expenses that are not solely and directly attributable to the Wireless segment are included in the Corporate segment and are classified as selling, general and administrative expenses on our consolidated statement of operations. In the second quarter of
policies described above.
net of tax), which consists of $41 million related to work force reductions, lease termination charges, and certain other exit costs and $44 million of asset impairments primarily related to the abandonment of various assets in the quarter. For the six months ended June 30, 2007, we recorded severance, exit costs and asset impairment charges of $259 million pre-tax ($161 million, net of tax), which consists of $207 million related to work force reductions and lease termination charges, and $52 million of asset impairments primarily related to the abandonment of
In the second quarter ended June 30, 2006, we recorded severance, exit costs and asset impairment charges of $40 million pre-ta
severance and related costs associated with work force reductions of legacy Sprint employees and $42 million of asset impairments primarily related to software asset impairment and abandonment. Severance, exit costs and asset impairment charges are allocated to the appropriate segment results.
In May 2006, we entered into a separation and distribution agreement with Embarq Corporation, which consists primarily of the business that we had reported as the Local segment in our consolidated financial statements in prior periods, and, at the time, was a wholly owned subsidiary, and
operating results as of January 1, 2006.
business.
20