Embed Size (px)
Citation preview
EE EEQUITY
QUITY
QUITY
QUITY RR RRESEARCH
ESEARCH
ESEARCH
ESEARCH
DWS
DWS
DWS
DWS CC CCOMP
OMP
OMP
OMP LL LLAB
AB
AB
AB
CC CCOMPANY
OMPANY
OMPANY
OMPANY RR RREPORT
EPORT
EPORT
EPORT
DDDDDDDDDDDDWWWWWWWWWWWWSSSSSSSSSSSS CCCCCCCCCCCCOOOOOOOOOOOOMMMMMMMMMMMMPPPPPPPPPPPPLLLLLLLLLLLLAAAAAAAAAAAABBBBBBBBBBBB
Please carefully read important notices in the last pages of this report.
April 10, 2007April 10, 2007April 10, 2007April 10, 2007
Country: Korea Sector: Refining/Petrochem Industry: Energy/Chemical Ticker: 003600
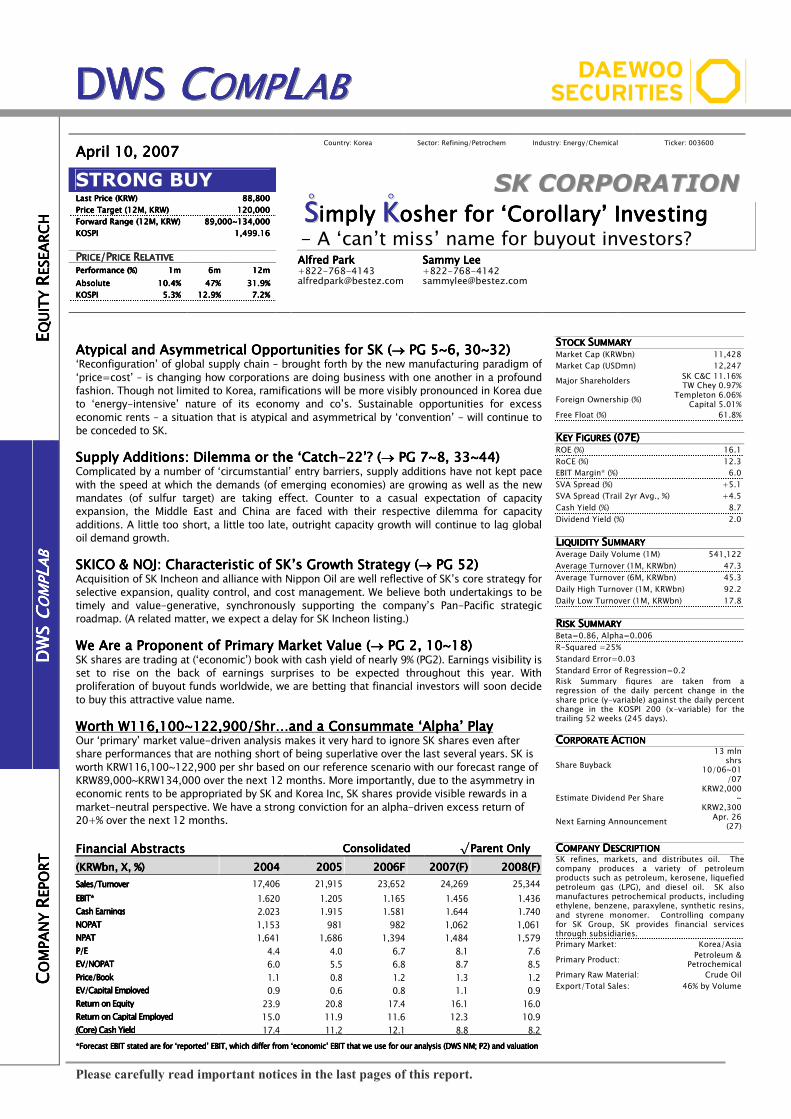
STRONG BUY SSKK CCOORRPPOORRAATTIIOONN Last Price (KRW)Last Price (KRW)Last Price (KRW)Last Price (KRW) 88,80088,80088,80088,800
Price Target (1Price Target (1Price Target (1Price Target (12M, KRW)2M, KRW)2M, KRW)2M, KRW) 120,000120,000120,000120,000
ForwardForwardForwardForward Range Range Range Range (12M, KRW)(12M, KRW)(12M, KRW)(12M, KRW) 89,000~134,00089,000~134,00089,000~134,00089,000~134,000
KOSPIKOSPIKOSPIKOSPI 1,499.161,499.161,499.161,499.16
SSSSSSSS̊̊imply imply imply imply KKKKKKKK̊̊osher for osher for osher for osher for ‘‘‘‘CorollaryCorollaryCorollaryCorollary’’’’ Investing Investing Investing Investing - A ‘can’t miss’ name for buyout investors?
PPPPRICERICERICERICE/P/P/P/PRICERICERICERICE RRRRELATIVEELATIVEELATIVEELATIVE
Performance (%)Performance (%)Performance (%)Performance (%) 1m1m1m1m 6m6m6m6m 12m12m12m12m
AbsoluteAbsoluteAbsoluteAbsolute 10.4%10.4%10.4%10.4% 47%47%47%47% 31313131.9%.9%.9%.9%
KOSPIKOSPIKOSPIKOSPI 5.3%5.3%5.3%5.3% 12.9%12.9%12.9%12.9% 7.2%7.2%7.2%7.2%
Alfred ParkAlfred ParkAlfred ParkAlfred Park +822-768-4143 [email protected]
Sammy LeeSammy LeeSammy LeeSammy Lee +822-768-4142 [email protected]
Atypical and Asymmetrical Opportunities for SK (Atypical and Asymmetrical Opportunities for SK (Atypical and Asymmetrical Opportunities for SK (Atypical and Asymmetrical Opportunities for SK (→→→→ PG PG PG PG 5~65~65~65~6, , , , 30~3230~3230~3230~32)))) ‘Reconfiguration’ of global supply chain – brought forth by the new manufacturing paradigm of ‘price=cost’ – is changing how corporations are doing business with one another in a profound fashion. Though not limited to Korea, ramifications will be more visibly pronounced in Korea due to ‘energy-intensive’ nature of its economy and co’s. Sustainable opportunities for excess economic rents – a situation that is atypical and asymmetrical by ‘convention’ - will continue to be conceded to SK.
Supply Additions: Dilemma or the ‘CatchSupply Additions: Dilemma or the ‘CatchSupply Additions: Dilemma or the ‘CatchSupply Additions: Dilemma or the ‘Catch----22’? (22’? (22’? (22’? (→→→→ PG PG PG PG 7~87~87~87~8, , , , 33~4433~4433~4433~44)))) Complicated by a number of ‘circumstantial’ entry barriers, supply additions have not kept pace with the speed at which the demands (of emerging economies) are growing as well as the new mandates (of sulfur target) are taking effect. Counter to a casual expectation of capacity expansion, the Middle East and China are faced with their respective dilemma for capacity additions. A little too short, a little too late, outright capacity growth will continue to lag global oil demand growth.
SKICO & NOJ: Characteristic of SK’s Growth Strategy (SKICO & NOJ: Characteristic of SK’s Growth Strategy (SKICO & NOJ: Characteristic of SK’s Growth Strategy (SKICO & NOJ: Characteristic of SK’s Growth Strategy (→→→→ PG PG PG PG 52525252)))) Acquisition of SK Incheon and alliance with Nippon Oil are well reflective of SK’s core strategy for selective expansion, quality control, and cost management. We believe both undertakings to be timely and value-generative, synchronously supporting the company’s Pan-Pacific strategic roadmap. (A related matter, we expect a delay for SK Incheon listing.)
We Are a Proponent of Primary Market Value (We Are a Proponent of Primary Market Value (We Are a Proponent of Primary Market Value (We Are a Proponent of Primary Market Value (→→→→ PG 2, 10 PG 2, 10 PG 2, 10 PG 2, 10~1~1~1~18)8)8)8) SK shares are trading at (‘economic’) book with cash yield of nearly 9% (PG2). Earnings visibility is set to rise on the back of earnings surprises to be expected throughout this year. With proliferation of buyout funds worldwide, we are betting that financial investors will soon decide to buy this attractive value name.
Worth W116,100~12Worth W116,100~12Worth W116,100~12Worth W116,100~122222,,,,999900/Shr…and a Consummate ‘Alpha’ Play00/Shr…and a Consummate ‘Alpha’ Play00/Shr…and a Consummate ‘Alpha’ Play00/Shr…and a Consummate ‘Alpha’ Play Our ‘primary’ market value-driven analysis makes it very hard to ignore SK shares even after share performances that are nothing short of being superlative over the last several years. SK is worth KRW116,100~122,900 per shr based on our reference scenario with our forecast range of KRW89,000~KRW134,000 over the next 12 months. More importantly, due to the asymmetry in economic rents to be appropriated by SK and Korea Inc, SK shares provide visible rewards in a market-neutral perspective. We have a strong conviction for an alpha-driven excess return of 20+% over the next 12 months.
Financial AbstractsFinancial AbstractsFinancial AbstractsFinancial Abstracts ConsolidatedConsolidatedConsolidatedConsolidated √√√√ Parent OnlyParent OnlyParent OnlyParent Only
(KRWbn, X, %)(KRWbn, X, %)(KRWbn, X, %)(KRWbn, X, %) 2004200420042004 2005200520052005 2006F2006F2006F2006F 2007200720072007((((FFFF)))) 2008200820082008((((FFFF))))
Sales/TurnoverSales/TurnoverSales/TurnoverSales/Turnover 17,406 21,915 23,652 24,269 25,344
EBIT*EBIT*EBIT*EBIT* 1,620 1,205 1,165 1,456 1,436 Cash EarningsCash EarningsCash EarningsCash Earnings 2,023 1,915 1,581 1,644 1,740 NOPAT NOPAT NOPAT NOPAT 1,153 981 982 1,062 1,061 NPAT NPAT NPAT NPAT 1,641 1,686 1,394 1,484 1,579 P/E P/E P/E P/E 4.4 4.0 6.7 8.1 7.6 EV/NOPAT EV/NOPAT EV/NOPAT EV/NOPAT 6.0 5.5 6.8 8.7 8.5 Price/BookPrice/BookPrice/BookPrice/Book 1.1 0.8 1.2 1.3 1.2 EV/Capital Employed EV/Capital Employed EV/Capital Employed EV/Capital Employed 0.9 0.6 0.8 1.1 0.9 Return on Equity Return on Equity Return on Equity Return on Equity 23.9 20.8 17.4 16.1 16.0 Return on Capital Employed Return on Capital Employed Return on Capital Employed Return on Capital Employed 15.0 11.9 11.6 12.3 10.9 (Core) Cash Yield(Core) Cash Yield(Core) Cash Yield(Core) Cash Yield 17.4 11.2 12.1 8.8 8.2
*Forecast EBIT stated are for ‘reported’ EBIT, which differ from ‘economic’ EBIT that we use for our analysis (DWS NM*Forecast EBIT stated are for ‘reported’ EBIT, which differ from ‘economic’ EBIT that we use for our analysis (DWS NM*Forecast EBIT stated are for ‘reported’ EBIT, which differ from ‘economic’ EBIT that we use for our analysis (DWS NM*Forecast EBIT stated are for ‘reported’ EBIT, which differ from ‘economic’ EBIT that we use for our analysis (DWS NM; P2; P2; P2; P2) and valuation) and valuation) and valuation) and valuation
SSSSTOCK TOCK TOCK TOCK SSSSUMMARYUMMARYUMMARYUMMARY Market Cap (KRWbn) 11,428
Market Cap (USDmn) 12,247
Major Shareholders SK C&C 11.16% TW Chey 0.97%
Foreign Ownership (%) Templeton 6.06%
Capital 5.01% Free Float (%) 61.8%
KKKKEYEYEYEY FFFFIGURES IGURES IGURES IGURES (07E)(07E)(07E)(07E) ROE (%) 16.1
RoCE (%) 12.3
EBIT Margin* (%) 6.0
SVA Spread (%) +5.1
SVA Spread (Trail 2yr Avg., %) +4.5
Cash Yield (%) 8.7
Dividend Yield (%) 2.0
LLLLIQUIDITYIQUIDITYIQUIDITYIQUIDITY SSSSUMMARYUMMARYUMMARYUMMARY Average Daily Volume (1M) 541,122
Average Turnover (1M, KRWbn) 47.3
Average Turnover (6M, KRWbn) 45.3
Daily High Turnover (1M, KRWbn) 92.2
Daily Low Turnover (1M, KRWbn) 17.8
RRRRISKISKISKISK SSSSUMMARYUMMARYUMMARYUMMARY Beta=0.86, Alpha=0.006
R-Squared =25%
Standard Error=0.03
Standard Error of Regression=0.2 Risk Summary figures are taken from a regression of the daily percent change in the share price (y-variable) against the daily percent change in the KOSPI 200 (x-variable) for the trailing 52 weeks (245 days).
CCCCORPORATEORPORATEORPORATEORPORATE AAAACTIONCTIONCTIONCTION
Share Buyback
13 mln shrs
10/06~01/07
Estimate Dividend Per Share KRW2,000
~ KRW2,300
Next Earning Announcement Apr. 26
(27)
CCCCOMPANYOMPANYOMPANYOMPANY DDDDESCRIPTIONESCRIPTIONESCRIPTIONESCRIPTION SK refines, markets, and distributes oil. The company produces a variety of petroleum products such as petroleum, kerosene, liquefied petroleum gas (LPG), and diesel oil. SK also manufactures petrochemical products, including ethylene, benzene, paraxylene, synthetic resins, and styrene monomer. Controlling company for SK Group, SK provides financial services through subsidiaries. Primary Market: Korea/Asia
Primary Product: Petroleum &
Petrochemical Primary Raw Material: Crude Oil
Export/Total Sales: 46% by Volume
2
April 10, 2007 SK Corporation
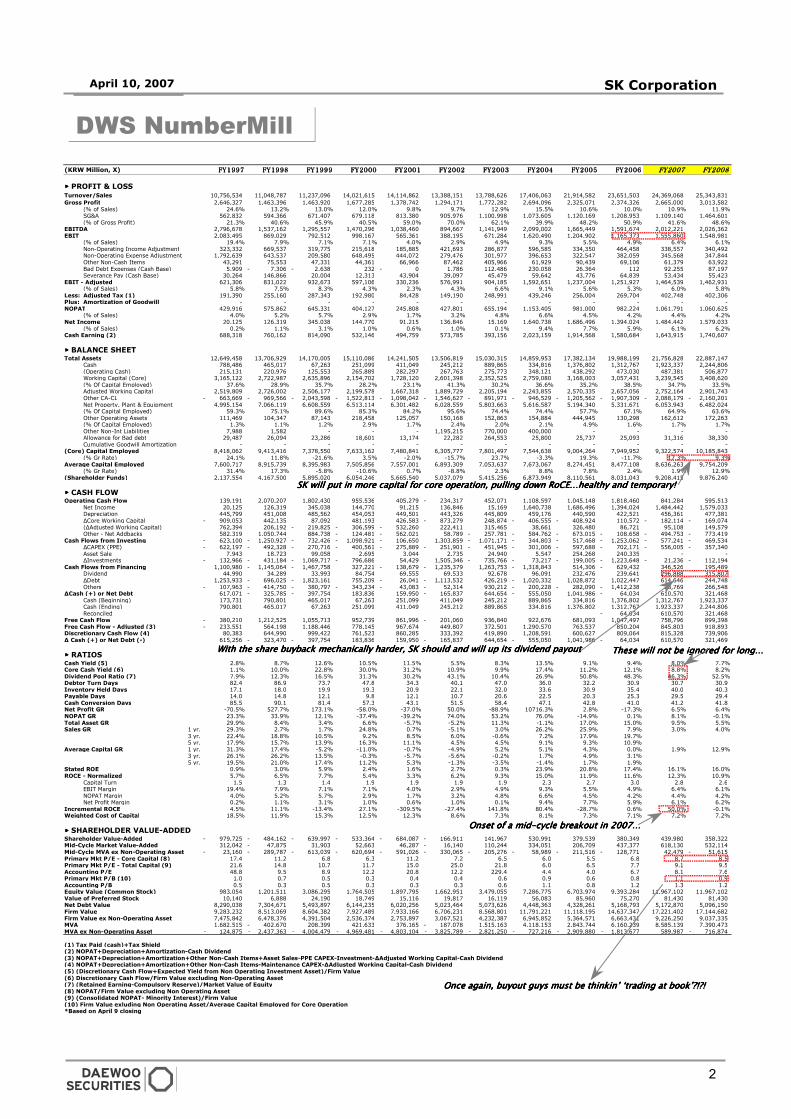
These will not be ignored for long… These will not be ignored for long… These will not be ignored for long… These will not be ignored for long…
DWS NumberMill
(KRW Million, X) FY1997FY1997FY1997FY1997 FY1998FY1998FY1998FY1998 FY1999FY1999FY1999FY1999 FY2000FY2000FY2000FY2000 FY2001FY2001FY2001FY2001 FY2002FY2002FY2002FY2002 FY2003FY2003FY2003FY2003 FY2004FY2004FY2004FY2004 FY2005FY2005FY2005FY2005 FY2006FY2006FY2006FY2006 FY2007FY2007FY2007FY2007 FY2008FY2008FY2008FY2008
▶▶▶▶ PROFIT & LOSSTurnover/Sales 10,756,534 11,048,787 11,237,096 14,021,615 14,114,862 13,388,151 13,788,626 17,406,063 21,914,582 23,651,503 24,369,068 25,343,831
Gross Profit 2,646,327 1,463,396 1,463,920 1,677,285 1,378,742 1,294,171 1,772,282 2,694,096 2,325,071 2,374,326 2,665,000 3,013,582 (% of Sales) 24.6% 13.2% 13.0% 12.0% 9.8% 9.7% 12.9% 15.5% 10.6% 10.0% 10.9% 11.9%
SG&A 562,832 594,366 671,407 679,118 813,380 905,976 1,100,998 1,073,605 1,120,169 1,208,953 1,109,140 1,464,601 (% of Gross Profit) 21.3% 40.6% 45.9% 40.5% 59.0% 70.0% 62.1% 39.9% 48.2% 50.9% 41.6% 48.6%
EBITDA 2,796,678 1,537,162 1,295,557 1,470,296 1,038,460 894,667 1,141,949 2,099,002 1,665,449 1,591,674 2,012,221 2,026,362 EBIT 2,083,495 869,029 792,512 998,167 565,361 388,195 671,284 1,620,490 1,204,902 1,165,373 1,555,860 1,548,981
(% of Sales) 19.4% 7.9% 7.1% 7.1% 4.0% 2.9% 4.9% 9.3% 5.5% 4.9% 6.4% 6.1%Non-Operating Income Adjustment 323,332 669,537 319,775 215,618 185,885 421,693 286,877 596,585 334,350 464,458 338,557 340,492 Non-Operating Expense Adjustment 1,792,639 643,537 209,580 648,495 444,072 279,476 301,977 396,653 322,547 382,059 345,568 347,844 Other Non-Cash Items 43,291 75,553 47,331 44,361 66,966 87,462 405,966 61,929 90,439 69,106 61,379 63,922 Bad Debt Expenses (Cash Base) 5,909 7,306- 2,638- 232 0- 1,786 112,486 230,058 26,364 112 92,255 87,197 Severance Pay (Cash Base) 30,264 146,866 20,004 12,313 43,904 39,097 45,479 59,642 43,776 64,839 53,434 55,423
EBIT - Adjusted 621,306 831,022 932,673 597,106 330,236 576,991 904,185 1,592,651 1,237,004 1,251,927 1,464,539 1,462,931 (% of Sales) 5.8% 7.5% 8.3% 4.3% 2.3% 4.3% 6.6% 9.1% 5.6% 5.3% 6.0% 5.8%
Less: Adjusted Tax (1) 191,390 255,160 287,343 192,980 84,428 149,190 248,991 439,246 256,004 269,704 402,748 402,306 Plus: Amortization of Goodwill - - - - - - - - - - - - NOPAT 429,916 575,862 645,331 404,127 245,808 427,801 655,194 1,153,405 981,000 982,224 1,061,791 1,060,625
(% of Sales) 4.0% 5.2% 5.7% 2.9% 1.7% 3.2% 4.8% 6.6% 4.5% 4.2% 4.4% 4.2%Net Income 20,125 126,319 345,038 144,770 91,215 136,846 15,169 1,640,738 1,686,496 1,394,024 1,484,442 1,579,033
(% of Sales) 0.2% 1.1% 3.1% 1.0% 0.6% 1.0% 0.1% 9.4% 7.7% 5.9% 6.1% 6.2%Cash Earning (2) 688,318 760,162 814,090 532,146 494,759 573,785 393,156 2,023,159 1,914,568 1,580,684 1,643,915 1,740,607
▶▶▶▶ BALANCE SHEETTotal Assets 12,649,458 13,706,929 14,170,005 15,110,086 14,241,505 13,506,819 15,030,315 14,859,953 17,382,134 19,988,199 21,756,828 22,887,147
Cash 788,486 465,017 67,263 251,099 411,049 245,212 889,865 334,816 1,376,802 1,312,767 1,923,337 2,244,806 (Operating Cash) 2% 215,131 220,976 125,553 265,889 282,297 267,763 275,773 348,121 438,292 473,030 487,381 506,877 Working Capital (Core) 3,165,122 2,722,987 2,635,896 2,154,702 1,728,120 2,601,398 2,352,525 2,759,080 3,168,003 3,057,431 3,239,545 3,408,620 (% Of Capital Employed) 37.6% 28.9% 35.7% 28.2% 23.1% 41.3% 30.2% 36.6% 35.2% 38.5% 34.7% 33.5%Adjusted Working Capital 2,519,809 2,726,002 2,506,177 2,199,578 1,667,318 1,889,729 2,205,194 2,243,855 2,570,335 2,657,056 2,752,164 2,901,743 Other CA-CL 663,669- 969,566- 2,043,598- 1,522,813- 1,098,042- 1,546,627- 891,971- 946,529- 1,205,562- 1,907,309- 2,088,179- 2,160,201- Net Property, Plant & Equipment 4,995,154 7,066,119 6,608,559 6,513,114 6,301,482 6,028,559 5,803,663 5,616,587 5,194,340 5,331,671 6,053,943 6,482,024 (% Of Capital Employed) 59.3% 75.1% 89.6% 85.3% 84.2% 95.6% 74.4% 74.4% 57.7% 67.1% 64.9% 63.6%Other Operating Assets 111,469 104,347 87,143 218,458 125,057 150,168 152,863 154,884 444,945 130,298 162,612 172,263 (% Of Capital Employed) 1.3% 1.1% 1.2% 2.9% 1.7% 2.4% 2.0% 2.1% 4.9% 1.6% 1.7% 1.7%Other Non-Int Liabilities 7,988 1,582 - - - 1,195,215 770,000 400,000 - - - - Allowance for Bad debt 29,487 26,094 23,286 18,601 13,174 22,282 264,553 25,800 25,737 25,093 31,316 38,330 Cumulative Goodwill Amortization - - - - - - - - - - - -
(Core) Capital Employed 8,418,062 9,413,416 7,378,550 7,633,162 7,480,841 6,305,777 7,801,497 7,544,638 9,004,264 7,949,952 9,322,574 10,185,843 (% Gr Rate) 24.1% 11.8% -21.6% 3.5% -2.0% -15.7% 23.7% -3.3% 19.3% -11.7% 17.3% 9.3%
Average Capital Employed 7,600,717 8,915,739 8,395,983 7,505,856 7,557,001 6,893,309 7,053,637 7,673,067 8,274,451 8,477,108 8,636,263 9,754,209 (% Gr Rate) 31.4% 17.3% -5.8% -10.6% 0.7% -8.8% 2.3% 8.8% 7.8% 2.4% 1.9% 12.9%
(Shareholder Funds) 2,137,554 4,167,500 5,895,020 6,054,246 5,665,540 5,037,079 5,415,256 6,873,949 8,110,561 8,031,043 9,208,415 9,876,240
▶▶▶▶ CASH FLOWOperating Cash Flow 139,191 2,070,207 1,802,430 955,536 405,279 234,317- 452,071 1,108,597 1,045,148 1,818,460 841,284 595,513
Net Income 20,125 126,319 345,038 144,770 91,215 136,846 15,169 1,640,738 1,686,496 1,394,024 1,484,442 1,579,033 Depreciation 445,799 451,008 485,562 454,053 449,501 443,326 445,809 459,176 440,590 422,521 456,361 477,381 ∆Core Working Capital 909,053- 442,135 87,092 481,193 426,583 873,279- 248,874 406,555- 408,924- 110,572 182,114- 169,074- (∆Adjusted Working Capital) 762,394 206,192 219,825- 306,599- 532,260- 222,411 315,465 38,661 326,480 86,721 95,108 149,579 Other - Net Addbacks 582,319 1,050,744 884,738 124,481- 562,021- 58,789 257,781- 584,762- 673,015- 108,658- 494,753- 773,419-
Cash Flows from Investing 623,100- 1,250,927- 732,426- 1,098,921- 106,650- 1,303,859 1,071,171- 344,803- 517,468- 1,253,062- 577,241- 469,534- ∆CAPEX (PPE) 622,197- 492,328- 270,716- 400,561- 275,889- 251,901- 451,945- 301,006- 597,688- 702,171- 556,005- 357,340- Asset Sale 7,943 18,723 99,058 2,695 3,044 2,735 24,940 5,547 254,268 240,335 - - ∆Investments 132,966- 431,184- 1,069,717- 796,686- 54,429 1,505,346 735,766- 73,217- 199,005- 1,223,648- 21,236- 112,194-
Cash Flows from Financing 1,100,980 1,145,064- 1,467,758- 327,221 138,679- 1,235,379- 1,263,753 1,318,843- 514,306 629,432- 346,526 195,489 Dividend 44,990 34,289 33,993 84,754 69,555 69,533 92,678 96,091 232,476 239,641 296,888 315,807 ∆Debt 1,253,933 696,025- 1,823,161- 755,209 26,041- 1,113,532- 426,219 1,020,332- 1,028,872 1,022,447 614,646 244,748 Others 107,963- 414,750- 380,797- 343,234- 43,083- 52,314- 930,212 200,228- 282,090- 1,412,238- 28,769 266,548
∆Cash (+) or Net Debt 617,071 325,785- 397,754- 183,836 159,950 165,837- 644,654 555,050- 1,041,986 64,034- 610,570 321,468 Cash (Beginning) 173,731 790,801 465,017 67,263 251,099 411,049 245,212 889,865 334,816 1,376,802 1,312,767 1,923,337 Cash (Ending) 790,801 465,017 67,263 251,099 411,049 245,212 889,865 334,816 1,376,802 1,312,767 1,923,337 2,244,806 Reconciled 64,034- 610,570 321,468
Free Cash Flow 380,210- 1,212,525 1,055,713 952,739 861,996 201,060- 936,840 922,676 681,093 1,047,497 758,796 899,398 Free Cash Flow - Adjusted (3) 233,551- 564,198 1,188,446 778,145 967,674 449,807 372,501 1,290,570 763,537 850,204 845,803 918,893 Discretionary Cash Flow (4) 80,383 644,990 999,422 761,523 860,285 333,392 419,890 1,208,591 600,627 809,064 815,328 739,906 ∆ Cash (+) or Net Debt (-) 615,256 323,470- 397,754- 183,836 159,950 165,837- 644,654 555,050- 1,041,986 64,034- 610,570 321,469
▶▶▶▶ RATIOS
Cash Yield (5) 2.8% 8.7% 12.6% 10.5% 11.5% 5.5% 8.3% 13.5% 9.1% 9.4% 8.0% 7.7%Core Cash Yield (6) 1.1% 10.0% 22.8% 30.0% 31.2% 10.9% 9.9% 17.4% 11.2% 12.1% 8.8% 8.2%Dividend Pool Ratio (7) 7.9% 12.3% 16.5% 31.3% 30.2% 43.1% 10.4% 26.9% 50.8% 48.3% 46.3% 52.5%Debtor Turn Days 82.4 86.9 73.7 47.8 34.3 40.1 47.0 36.0 32.2 30.9 30.7 30.9 Inventory Held Days 17.1 18.0 19.9 19.3 20.9 22.1 32.0 33.6 30.9 35.4 40.0 40.3 Payable Days 14.0 14.8 12.1 9.8 12.1 10.7 20.6 22.5 20.3 25.3 29.5 29.4 Cash Conversion Days 85.5 90.1 81.4 57.3 43.1 51.5 58.4 47.1 42.8 41.0 41.2 41.8 Net Profit GR -70.5% 527.7% 173.1% -58.0% -37.0% 50.0% -88.9% 10716.3% 2.8% -17.3% 6.5% 6.4%NOPAT GR 23.3% 33.9% 12.1% -37.4% -39.2% 74.0% 53.2% 76.0% -14.9% 0.1% 8.1% -0.1%Total Asset GR 29.9% 8.4% 3.4% 6.6% -5.7% -5.2% 11.3% -1.1% 17.0% 15.0% 9.5% 5.5%Sales GR 1 yr. 29.3% 2.7% 1.7% 24.8% 0.7% -5.1% 3.0% 26.2% 25.9% 7.9% 3.0% 4.0%
3 yr. 22.4% 18.8% 10.5% 9.2% 8.5% 6.0% -0.6% 7.2% 17.9% 19.7%5 yr. 17.9% 15.7% 13.9% 16.3% 11.1% 4.5% 4.5% 9.1% 9.3% 10.9%
Average Capital GR 1 yr. 31.3% 17.4% -5.2% -11.0% -0.7% -4.9% 5.2% 5.1% 4.3% 0.0% 1.9% 12.9%3 yr. 26.1% 26.2% 13.5% -0.3% -5.7% -5.6% -0.2% 1.7% 4.9% 3.1%5 yr. 19.5% 21.0% 17.4% 11.2% 5.3% -1.3% -3.5% -1.4% 1.7% 1.9%
Stated ROE 0.9% 3.0% 5.9% 2.4% 1.6% 2.7% 0.3% 23.9% 20.8% 17.4% 16.1% 16.0%ROCE - Normalized 5.7% 6.5% 7.7% 5.4% 3.3% 6.2% 9.3% 15.0% 11.9% 11.6% 12.3% 10.9%
Capital Turn 1.5 1.3 1.4 1.9 1.9 1.9 1.9 2.3 2.7 3.0 2.8 2.6 EBIT Margin 19.4% 7.9% 7.1% 7.1% 4.0% 2.9% 4.9% 9.3% 5.5% 4.9% 6.4% 6.1%NOPAT Margin 4.0% 5.2% 5.7% 2.9% 1.7% 3.2% 4.8% 6.6% 4.5% 4.2% 4.4% 4.2%Net Profit Margin 0.2% 1.1% 3.1% 1.0% 0.6% 1.0% 0.1% 9.4% 7.7% 5.9% 6.1% 6.2%
Incremental ROCE 4.5% 11.1% -13.4% 27.1% -309.5% -27.4% 141.8% 80.4% -28.7% 0.6% 50.0% -0.1%Weighted Cost of Capital 18.5% 11.9% 15.3% 12.5% 12.3% 8.6% 7.3% 8.1% 7.3% 7.1% 7.2% 7.2%
▶▶▶▶ SHAREHOLDER VALUE-ADDEDShareholder Value-Added 979,725- 484,162- 639,997- 533,364- 684,087- 166,911- 141,967 530,991 379,539 380,349 439,980 358,322 Mid-Cycle Market Value-Added 312,042 47,875- 31,903 52,663 46,287 16,140- 110,244 334,051 206,709 437,377 618,130 532,114 Mid-Cycle MVA ex Non-Operating Asset 23,160- 289,787- 613,039- 620,694- 591,026- 330,065- 205,276- 58,989- 211,516- 128,771- 42,479 51,615- Primary Mkt P/E - Core Capital (8) 17.4 11.2 6.8 6.3 11.2 7.2 6.5 6.0 5.5 6.8 8.7 8.5 Primary Mkt P/E - Total Capital (9) 21.6 14.8 10.7 11.7 15.0 25.0 21.8 6.0 6.5 7.7 9.1 9.5 Accounting P/E 48.8 9.5 8.9 12.2 20.8 12.2 229.4 4.4 4.0 6.7 8.1 7.6 Primary Mkt P/B (10) 1.0 0.7 0.5 0.3 0.4 0.4 0.6 0.9 0.6 0.8 1.1 0.9 Accounting P/B 0.5 0.3 0.5 0.3 0.3 0.3 0.6 1.1 0.8 1.2 1.3 1.2 Equity Value (Common Stock) 983,054 1,201,511 3,086,295 1,764,505 1,897,795 1,662,951 3,479,055 7,286,775 6,703,974 9,393,284 11,967,102 11,967,102 Value of Preferred Stock 10,140 6,888 24,190 18,749 15,116 19,817 16,119 56,083 85,960 75,270 81,430 81,430 Net Debt Value 8,290,038 7,304,671 5,493,897 6,144,235 6,020,256 5,023,464 5,073,626 4,448,363 4,328,261 5,168,793 5,172,870 5,096,150 Firm Value 9,283,232 8,513,069 8,604,382 7,927,489 7,933,166 6,706,231 8,568,801 11,791,221 11,118,195 14,637,347 17,221,402 17,144,682 Firm Value ex Non-Operating Asset 7,475,842 6,478,376 4,391,504 2,536,374 2,753,897 3,067,521 4,232,387 6,945,852 5,364,571 6,663,431 9,226,250 9,037,335 MVA 1,682,515 402,670- 208,399 421,633 376,165 187,078- 1,515,163 4,118,153 2,843,744 6,160,239 8,585,139 7,390,473 MVA ex Non-Operating Asset 124,875- 2,437,363- 4,004,479- 4,969,481- 4,803,104- 3,825,789- 2,821,250- 727,216- 2,909,880- 1,813,677- 589,987 716,874-
(1) Tax Paid (cash)+Tax Shield(2) NOPAT+Depreciation+Amortization-Cash Dividend(3) NOPAT+Depreciation+Amortization+Other Non-Cash Items+Asset Sales-PPE CAPEX-Investment-∆Adjusted Working Capital-Cash Dividend(4) NOPAT+Depreciation+Amortization+Other Non-Cash Items-Maintenance CAPEX-∆Adjusted Working Capital-Cash Dividend(5) (Discretionary Cash Flow+Expected Yield from Non Operating Investment Asset)/Firm Value(6) Discretionary Cash Flow/Firm Value excluding Non-Operating Asset(7) (Retained Earning-Compulsory Reserve)/Market Value of Equity(8) NOPAT/Firm Value excluding Non Operating Asset(9) (Consolidated NOPAT- Minority Interest)/Firm Value(10) Firm Value exluding Non Operating Asset/Average Capital Employed for Core Operation
*Based on April 9 closing
SK will put in more capital for core operation, pulling down RoCE…healthy and temporary!SK will put in more capital for core operation, pulling down RoCE…healthy and temporary!SK will put in more capital for core operation, pulling down RoCE…healthy and temporary!SK will put in more capital for core operation, pulling down RoCE…healthy and temporary!
Once again, buyout guys must be thinkin’ ‘trading at book’Once again, buyout guys must be thinkin’ ‘trading at book’Once again, buyout guys must be thinkin’ ‘trading at book’Once again, buyout guys must be thinkin’ ‘trading at book’?!?!?!?!?!?!?!?!
With the share buyback mechanically harder, SK should aWith the share buyback mechanically harder, SK should aWith the share buyback mechanically harder, SK should aWith the share buyback mechanically harder, SK should and will up its dividend payout nd will up its dividend payout nd will up its dividend payout nd will up its dividend payout
Onset of a midOnset of a midOnset of a midOnset of a mid----cycle breakout in 2007… cycle breakout in 2007… cycle breakout in 2007… cycle breakout in 2007…
3
April 10, 2007 SK Corporation
Investment ThesisInvestment ThesisInvestment ThesisInvestment Thesis....................................................................................................................................................................................................................................................4444
Atypical and Asmmetrical Opportunities for ExceAtypical and Asmmetrical Opportunities for ExceAtypical and Asmmetrical Opportunities for ExceAtypical and Asmmetrical Opportunities for Excess Economic Rentsss Economic Rentsss Economic Rentsss Economic Rents................................ 4444
Financial Analysis and ValuationFinancial Analysis and ValuationFinancial Analysis and ValuationFinancial Analysis and Valuation ........................................................................................................................................................10101010
What Causes SK’s Share Price to Behave the Way It Does?What Causes SK’s Share Price to Behave the Way It Does?What Causes SK’s Share Price to Behave the Way It Does?What Causes SK’s Share Price to Behave the Way It Does? .................................................................................... 10101010
2007 Operating Performance2007 Operating Performance2007 Operating Performance2007 Operating Performance ........................................................................................................................................................................21212121
Surprise! Surprise! Surprise!Surprise! Surprise! Surprise!Surprise! Surprise! Surprise!Surprise! Surprise! Surprise! ............................................................................................................................................................................................................................................................ 21212121
Demand VersDemand VersDemand VersDemand Versus Supplyus Supplyus Supplyus Supply ............................................................................................................................................................................................................30303030
Will supply additions be the culprit of margin contraction?Will supply additions be the culprit of margin contraction?Will supply additions be the culprit of margin contraction?Will supply additions be the culprit of margin contraction? ............................................................................ 30303030
Verdict Upon Supply AdditionsVerdict Upon Supply AdditionsVerdict Upon Supply AdditionsVerdict Upon Supply Additions ................................................................................................................................................................39393939
Simply a Dilemma or The Case of ‘CatchSimply a Dilemma or The Case of ‘CatchSimply a Dilemma or The Case of ‘CatchSimply a Dilemma or The Case of ‘Catch----22’?22’?22’?22’? .................................................................................................................................................... 39393939
SK and ‘Dieselization’SK and ‘Dieselization’SK and ‘Dieselization’SK and ‘Dieselization’ ....................................................................................................................................................................................................................45454545
StraStraStraStrattttegiegiegiegic Positioning toward ‘Segmental’ Growth Pays Offc Positioning toward ‘Segmental’ Growth Pays Offc Positioning toward ‘Segmental’ Growth Pays Offc Positioning toward ‘Segmental’ Growth Pays Off ................................................................................ 45454545
Select Investments, QualitySelect Investments, QualitySelect Investments, QualitySelect Investments, Quality & & & & Cost ControlCost ControlCost ControlCost Control ............................................................................................52525252
SKICOSKICOSKICOSKICO,,,, NOJ Undertakings NOJ Undertakings NOJ Undertakings NOJ Undertakings: Evid: Evid: Evid: Evidence ence ence ence of SK’s Above Strategyof SK’s Above Strategyof SK’s Above Strategyof SK’s Above Strategy............................................................................ 52525252
ConclusionConclusionConclusionConclusion....................................................................................................................................................................................................................................................................................55555555
Table of Table of Table of Table of ContentContentContentContentssss
4
April 10, 2007 SK Corporation
2%
4%
6%
8%
10%
12%
14%
1987
1988
1989
1990
1991
1992
1993
1994
1995
1996
1997
1998
1999
2000
2001
2002
2003
2004
2005
2006
0
10,000
20,000
30,000
40,000
50,000
60,000
70,000
80,000
Energy Consumption/GDP (LHS) SK Corp Share Price (KRW, RHS)
(Consolidated) gross margin of 9~13%
(Consolidated) gross margin of 15~20%
DeepDeepDeepDeepValue!!Value!!Value!!Value!!
New cyclical lower limit
New reference mid-cycle level of energy intensity
Shr px overshootShr px overshootShr px overshootShr px overshoot
IINNVVEESSTTMMEENNTT TTHHEESSIISS
AATTYYPPIICCAALL AANNDD AASSMMMMEETTRRIICCAALL OOPPPPOORRTTUUNNIITTIIEESS FFOORR EEXXCCEESSSS EECCOONNOOMMIICC RREENNTTSS
‘Structural Driver’ behind S‘Structural Driver’ behind S‘Structural Driver’ behind S‘Structural Driver’ behind SK’s PerformanceK’s PerformanceK’s PerformanceK’s Performance
SK Corporation (“SK” hereafter), one of my most favorite names for the last few years,
decisively outperformed the KOSPI200 by 36% over the last 4 months since its
reiteration as one of the ‘stalwart’ focus names for the year of 2007 in my previous
publication on investment strategy, <Comes 2007, Looms Sinister Twilight> dated
December 7, 2006. SK’s share price already exceeded the analysts’ weighted
consensus target price of KRW 82,633 per share (based on analysts’ target price
during the last 12 months).
In our effort to establish our investment opinion beyond a simple valuation call, we
undertake intensive studies into discovering ‘organic’ elements of a company that
are centrally subject to be researched, in order to derive the ‘corollary’ awaiting the
company in the upcoming cycle(s). By ‘corollary’ investing, we are referring to an
investing strategy, in which we seek to capitalize on the total sum of shareholder
value-added (thus ‘economic’ MVAs) on the basis of the ‘eventual’ - or ‘inevitable’-
results that are likely to be consummated along the line of the law and dynamics of
the market. In this respect, SK shares present a very convincing case whereby the
company should upstage the broad market with a clearly more visible mid-cycle
growth in a market-neutral perspective under today’s market conditions that
presumably guarantee the absence of arbitrage. As the word ‘corollary’ connotes
very little explicit guideline for the timeline to the point of materialization of the
shareholder value-added, we may not be entirely free of the risk of over-extended
lockup or temporary correction. However, we conclude that the reward, supported
by a high earnings visibility, significantly outweigh the risks.
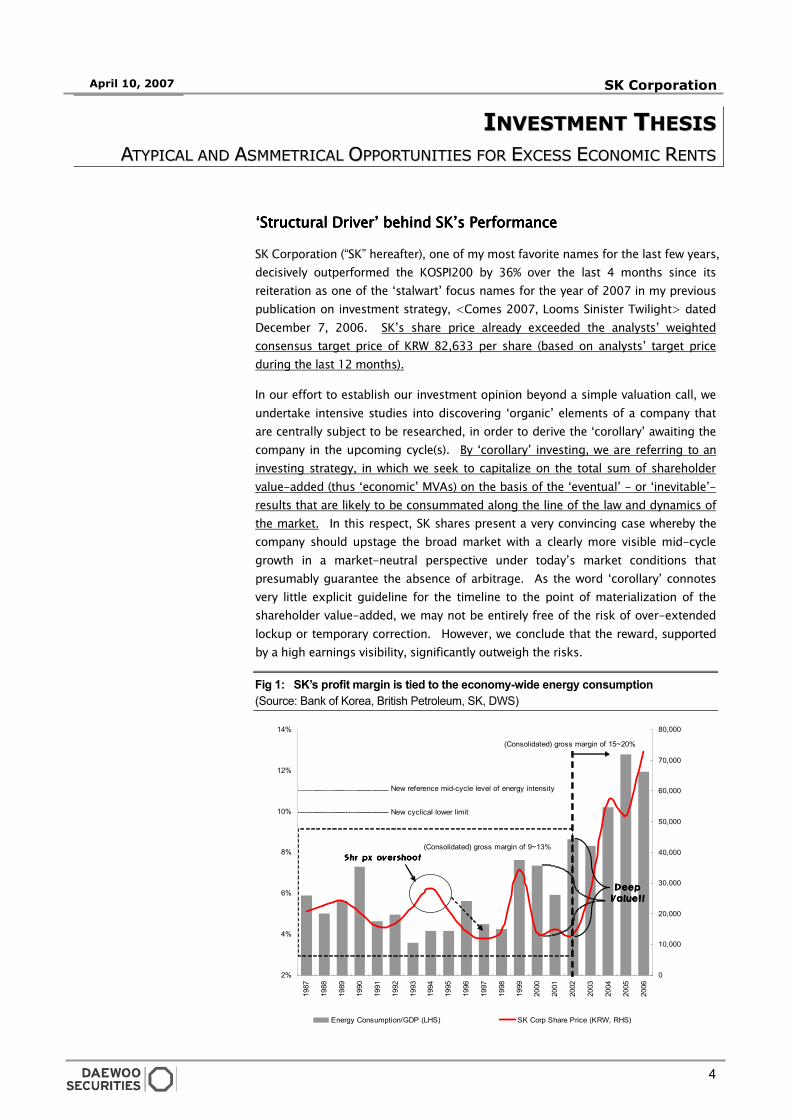
Fig 1: SK’s profit margin is tied to the economy-wide energy consumption
(Source: Bank of Korea, British Petroleum, SK, DWS)
5
April 10, 2007 SK Corporation
-
0.2
0.4
0.6
0.8
1.0
1.2
1.4
1.6
2000
2001
2002
2003
2004
2005
2006
2
3
4
5
6
7
8
Energy Intensity Coefficient (LHS) Korea Output Real Growth (%, RHS)
Reference level of US' energy intensity Coefficient (0.3~0.4)
SK’s gross margin expansion has been closely, if not directly, tied to the economy-
wide increase in energy consumption of Korea Inc. As Figure 1 illustrates, SK’s
shares offered a ‘deep value’ at the end of 2002 while the company-level financial
numbers synchronously supported this case of turnaround at the end of the 1st half
of 2003. This case of ‘deep value’ was warranted of its due rerating in the 2nd half
of 2003 and thereafter.
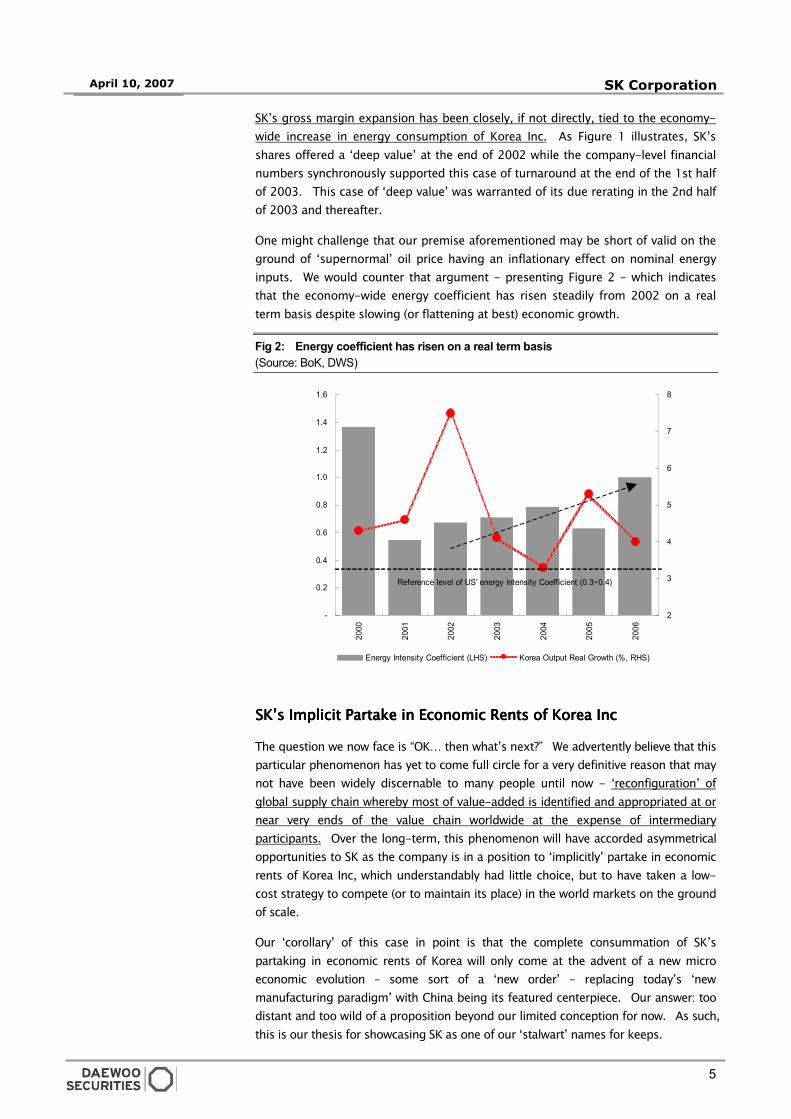
One might challenge that our premise aforementioned may be short of valid on the
ground of ‘supernormal’ oil price having an inflationary effect on nominal energy
inputs. We would counter that argument - presenting Figure 2 - which indicates
that the economy-wide energy coefficient has risen steadily from 2002 on a real
term basis despite slowing (or flattening at best) economic growth.
Fig 2: Energy coefficient has risen on a real term basis
(Source: BoK, DWS)
SK’sSK’sSK’sSK’s Implicit Partake in Economic Rents of Korea Inc Implicit Partake in Economic Rents of Korea Inc Implicit Partake in Economic Rents of Korea Inc Implicit Partake in Economic Rents of Korea Inc
The question we now face is “OK… then what’s next?” We advertently believe that this
particular phenomenon has yet to come full circle for a very definitive reason that may
not have been widely discernable to many people until now - ‘reconfiguration’ of
global supply chain whereby most of value-added is identified and appropriated at or
near very ends of the value chain worldwide at the expense of intermediary
participants. Over the long-term, this phenomenon will have accorded asymmetrical
opportunities to SK as the company is in a position to ‘implicitly’ partake in economic
rents of Korea Inc, which understandably had little choice, but to have taken a low-
cost strategy to compete (or to maintain its place) in the world markets on the ground
of scale.
Our ‘corollary’ of this case in point is that the complete consummation of SK’s
partaking in economic rents of Korea will only come at the advent of a new micro
economic evolution – some sort of a ‘new order’ - replacing today’s ‘new
manufacturing paradigm’ with China being its featured centerpiece. Our answer: too
distant and too wild of a proposition beyond our limited conception for now. As such,
this is our thesis for showcasing SK as one of our ‘stalwart’ names for keeps.
6
April 10, 2007 SK Corporation
Interestingly, this thesis of ours would also bring forth one very noteworthy
technical implication: it would be held in the best interest of the nation’s economy
to lower SK’s business cost. While we do not know whether or not Korean National
Pension and other municipal funds alike have acted on this vested interest, we
believe that the market’s intuition will - more likely than not - manifest it. Why not
take advantage of the fire spreading leeward?
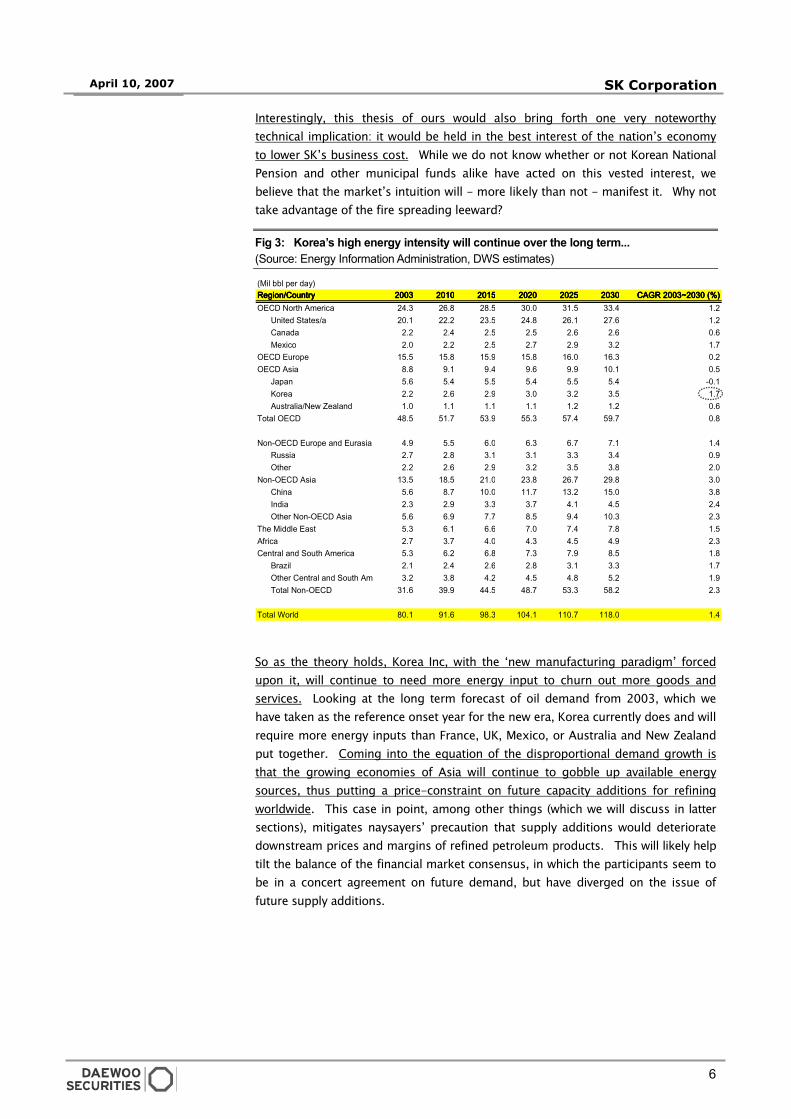
Fig 3: Korea’s high energy intensity will continue over the long term...
(Source: Energy Information Administration, DWS estimates)
So as the theory holds, Korea Inc, with the ‘new manufacturing paradigm’ forced
upon it, will continue to need more energy input to churn out more goods and
services. Looking at the long term forecast of oil demand from 2003, which we
have taken as the reference onset year for the new era, Korea currently does and will
require more energy inputs than France, UK, Mexico, or Australia and New Zealand
put together. Coming into the equation of the disproportional demand growth is
that the growing economies of Asia will continue to gobble up available energy
sources, thus putting a price-constraint on future capacity additions for refining
worldwide. This case in point, among other things (which we will discuss in latter
sections), mitigates naysayers’ precaution that supply additions would deteriorate
downstream prices and margins of refined petroleum products. This will likely help
tilt the balance of the financial market consensus, in which the participants seem to
be in a concert agreement on future demand, but have diverged on the issue of
future supply additions.
(Mil bbl per day) Region/CountryRegion/CountryRegion/CountryRegion/Country 2003200320032003 2010201020102010 2015201520152015 2020202020202020 2025202520252025 2030203020302030 CAGR 2003~2030 (%)CAGR 2003~2030 (%)CAGR 2003~2030 (%)CAGR 2003~2030 (%)OECD North America 24.3 26.8 28.5 30.0 31.5 33.4 1.2 United States/a 20.1 22.2 23.5 24.8 26.1 27.6 1.2 Canada 2.2 2.4 2.5 2.5 2.6 2.6 0.6 Mexico 2.0 2.2 2.5 2.7 2.9 3.2 1.7OECD Europe 15.5 15.8 15.9 15.8 16.0 16.3 0.2OECD Asia 8.8 9.1 9.4 9.6 9.9 10.1 0.5 Japan 5.6 5.4 5.5 5.4 5.5 5.4 -0.1 Korea 2.2 2.6 2.9 3.0 3.2 3.5 1.7 Australia/New Zealand 1.0 1.1 1.1 1.1 1.2 1.2 0.6Total OECD 48.5 51.7 53.9 55.3 57.4 59.7 0.8
Non-OECD Europe and Eurasia 4.9 5.5 6.0 6.3 6.7 7.1 1.4 Russia 2.7 2.8 3.1 3.1 3.3 3.4 0.9 Other 2.2 2.6 2.9 3.2 3.5 3.8 2.0Non-OECD Asia 13.5 18.5 21.0 23.8 26.7 29.8 3.0 China 5.6 8.7 10.0 11.7 13.2 15.0 3.8 India 2.3 2.9 3.3 3.7 4.1 4.5 2.4 Other Non-OECD Asia 5.6 6.9 7.7 8.5 9.4 10.3 2.3The Middle East 5.3 6.1 6.6 7.0 7.4 7.8 1.5Africa 2.7 3.7 4.0 4.3 4.5 4.9 2.3Central and South America 5.3 6.2 6.8 7.3 7.9 8.5 1.8 Brazil 2.1 2.4 2.6 2.8 3.1 3.3 1.7 Other Central and South America 3.2 3.8 4.2 4.5 4.8 5.2 1.9 Total Non-OECD 31.6 39.9 44.5 48.7 53.3 58.2 2.3
Total World 80.1 91.6 98.3 104.1 110.7 118.0 1.4
7
April 10, 2007 SK Corporation
Coming into Equation for Strong Petroleum Prices is a Possible Coming into Equation for Strong Petroleum Prices is a Possible Coming into Equation for Strong Petroleum Prices is a Possible Coming into Equation for Strong Petroleum Prices is a Possible
Supply DisruptSupply DisruptSupply DisruptSupply Disruptionionionion
In fact, we have noted that capacity additions – worldwide - are coming on stream at
a much slower pace than previously anticipated. According to <Oil & Gas Journal
Worldwide Refining Survey and Construction Report>, the total new worldwide
atmospheric crude distillation capacity under construction is counting about
600,000 bpd as of the end of 2006. However, even with these works-in-progress,
it is clear that the number of new refineries needed is still significant, and more
critically, these additions should already be in the engineering phase to be fully
operational by 2010. As of today, none of them is!
Another event weighing on the supply side is the worldwide enforcement of ‘cleaner
air’ mandates for tighter specifications. Capacity investments will be hampered by
the reality that the need to meet sulfur regulatory changes is a primary pull on
refiner’s capital. Hydroprocessing has been by far the most significant processing
investment over the last 5 years. Reduced sulfur targets for global products,
including potentially residual fuels and heating oil as well, will complicate the supply
side because ‘simple’ refiners that have not made the necessary investments for
‘upgrade’ will have no option other than to purchase increasingly expensive sweet
crude oil or else throw in the towel. We believe that some 8% of refiners worldwide
are exposed to this predicament. Further, we expect about 1% of current motor
gasoline volume to be lost as a result of octane levels being reduced during the
hydrotreating process.
Lastly on the supply issue, as refinery capacity additions lag, the fragility of the
distribution infrastructure will become more visible. In the Far East, the
downstream distribution systems will need extensive development. Meanwhile, the
United States will need significant additions for tankage and pipelines, which have
become yet another problematic issue due to sulfur mandates presenting the
challenge to handle the necessary ‘segregation’ and ‘contamination’ of ‘sweet’
products. In addition, the globalization of products and phase-out of single-hull
tankers will require large investments in product vessels to handle the long-range
movement of products in the downstream arena.
8
April 10, 2007 SK Corporation
-4%
-2%
0%
2%
4%
6%
8%
1990
1991
1992
1993
1994
1995
1996
1997
1998
1999
2000
2001
2002
2003
2004
2005
2006
2007
2008
Distilation Capacity % Increase Energy Consumption% Increase
US real output growth Europe real output growth
Asia real output growth
Supply Additions Supply Additions Supply Additions Supply Additions ---- aaaa LLLLittle too Short, a ittle too Short, a ittle too Short, a ittle too Short, a LLLLittle too Lateittle too Lateittle too Lateittle too Late
Supply additions will come full-fledged only if the aforementioned issues are
addressed first. Whether this takes place in due process remains to be seen as it
requires more active dialogues among the policymakers, regulators, up/
downstream players, and investment banks. It will greatly depend on who is willing
to ‘ante-up’ for the volume. Since the ramifications for both the ‘winner’ and the
‘loser’ will be significant, all interested parties may be less than willing to roll the
dice yet.
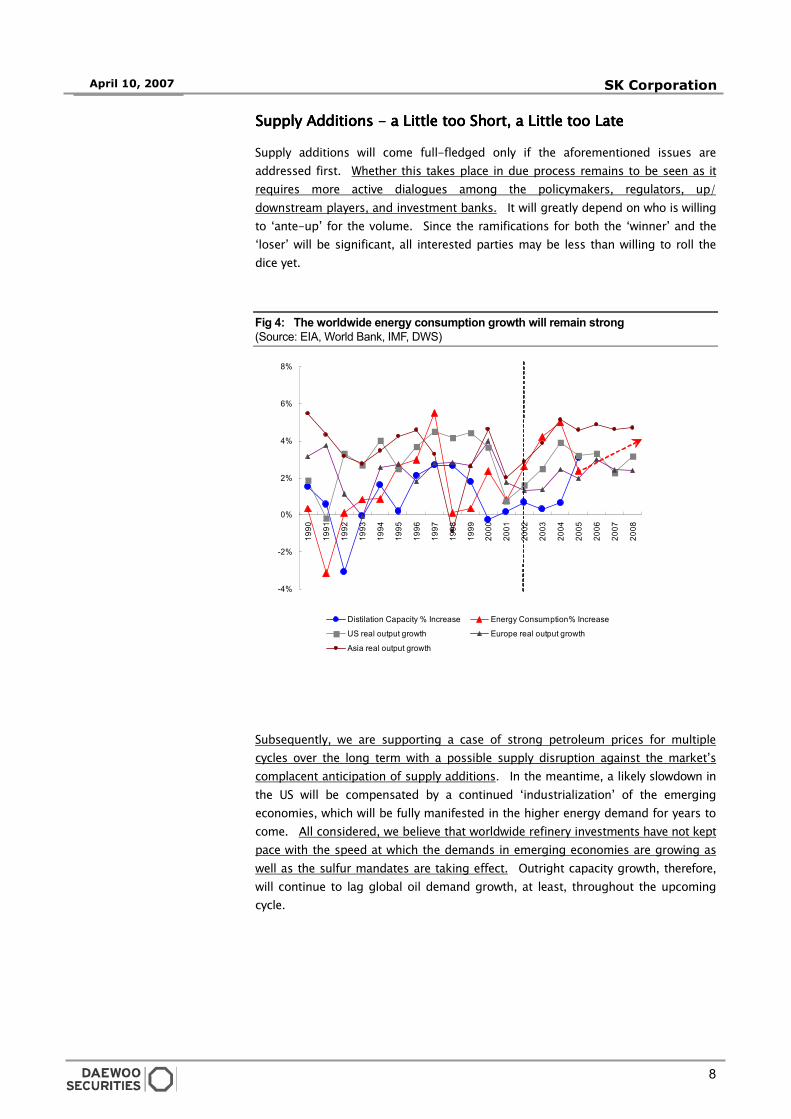
Fig 4: The worldwide energy consumption growth will remain strong
(Source: EIA, World Bank, IMF, DWS)
Subsequently, we are supporting a case of strong petroleum prices for multiple
cycles over the long term with a possible supply disruption against the market’s
complacent anticipation of supply additions. In the meantime, a likely slowdown in
the US will be compensated by a continued ‘industrialization’ of the emerging
economies, which will be fully manifested in the higher energy demand for years to
come. All considered, we believe that worldwide refinery investments have not kept
pace with the speed at which the demands in emerging economies are growing as
well as the sulfur mandates are taking effect. Outright capacity growth, therefore,
will continue to lag global oil demand growth, at least, throughout the upcoming
cycle.
9
April 10, 2007 SK Corporation
Internal Initiatives to Chime with Macro DevelopmentInternal Initiatives to Chime with Macro DevelopmentInternal Initiatives to Chime with Macro DevelopmentInternal Initiatives to Chime with Macro Development
Having implied that we are convinced of the world’s inexorable trend with respect to
how differently corporations are operating, we commend SK for what it has done
internally to further strengthen its (already solid) leadership position: (1) made
selective investments into ‘strategic’ segments of refining (low-sulfur diesel and
kerosene) and petrochemicals (BTX) to optimize its crude ‘slate’; (2) disposed of
excess assets and non-operating assets over the last 5 years; (3) acquired SK
Incheon (“SKICO” hereafter), which it successfully integrated and branded into ‘SK
realm’; and (4) inked in a strategic tie-up with Nippon Oil of Japan (“NOJ” hereafter).
In our opinion, the ‘value’ driver over the next 6~12 months for SK shares will be
accredited more to ‘follow-through’ of these internal initiatives than to
exploration/production (‘E&P’) business unit or a possible transition into a holding
company structure, both of which have been limelighted as the rerating catalyst in
the financial market. According to our studies, SK’s mid-cycle profitability, as
measured by return on capital employed, will convincingly escalate to about 13%
from the current level of 9% (2001~2005) due to these initiatives, which we suspect
have yet to be fully priced in. Over the next 3 years, we expect SK to take on the
form of a rare breed of the ‘procyclical-defensive’. Not only do we reiterate SK as
our favorite top pick among the large-capitalization universe stocks in Korea, we
also suggest that the company’s shares provide visible rewards in a market-neutral
perspective that they should demand a spot in your investment portfolio as a
consummate alpha play with an alpha-driven excess return target of 20%+ over the
next 12 months.
10
April 10, 2007 SK Corporation
FFIINNAANNCCIIAALL AANNAALLYYSSIISS AANNDD VVAALLUUAATTIIOONN
WWHHAATT CCAAUUSSEESS SSKK’’SS SSHHAARREE PPRRIICCEE TTOO BBEEHHAAVVEE TTHHEE WWAAYY IITT DDOOEESS??
DonDonDonDon’’’’t Judge a Book by Its Cover t Judge a Book by Its Cover t Judge a Book by Its Cover t Judge a Book by Its Cover ---- More Often thanMore Often thanMore Often thanMore Often than Not Not Not Not, It is , It is , It is , It is nnnnot ot ot ot
What ItWhat ItWhat ItWhat It Reads Reads Reads Reads
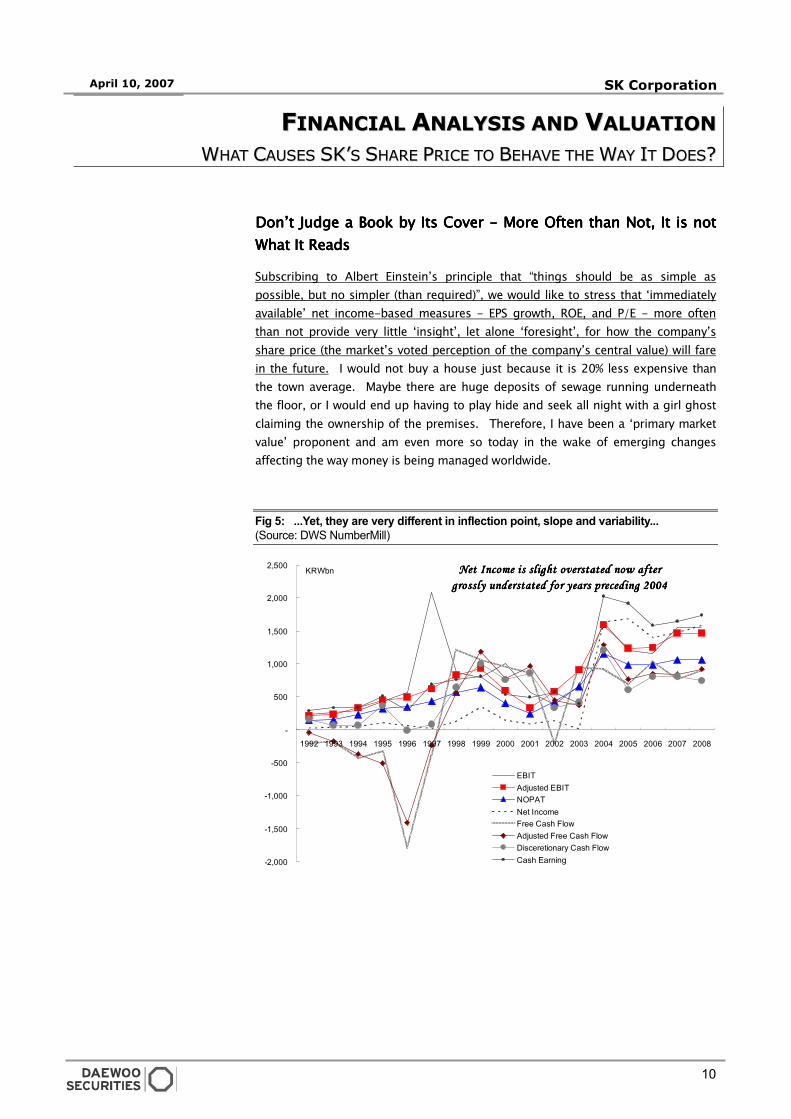
Subscribing to Albert Einstein’s principle that “things should be as simple as
possible, but no simpler (than required)”, we would like to stress that ‘immediately
available’ net income-based measures - EPS growth, ROE, and P/E - more often
than not provide very little ‘insight’, let alone ‘foresight’, for how the company’s
share price (the market’s voted perception of the company’s central value) will fare
in the future. I would not buy a house just because it is 20% less expensive than
the town average. Maybe there are huge deposits of sewage running underneath
the floor, or I would end up having to play hide and seek all night with a girl ghost
claiming the ownership of the premises. Therefore, I have been a ‘primary market
value’ proponent and am even more so today in the wake of emerging changes
affecting the way money is being managed worldwide.
Fig 5: ...Yet, they are very different in inflection point, slope and variability...
(Source: DWS NumberMill)
-2,000
-1,500
-1,000
-500
-
500
1,000
1,500
2,000
2,500
1992 1993 1994 1995 1996 1997 1998 1999 2000 2001 2002 2003 2004 2005 2006 2007 2008
EBITAdjusted EBITNOPATNet IncomeFree Cash FlowAdjusted Free Cash FlowDisceretionary Cash FlowCash Earning
KRWbn Net Income is slight overstated now afterNet Income is slight overstated now afterNet Income is slight overstated now afterNet Income is slight overstated now after
grossly understated for years preceding 2004grossly understated for years preceding 2004grossly understated for years preceding 2004grossly understated for years preceding 2004
11
April 10, 2007 SK Corporation
Understanding of AccounUnderstanding of AccounUnderstanding of AccounUnderstanding of Accounting Pays Offting Pays Offting Pays Offting Pays Off
From 1995 to 2006 covering 3 peak-to-peak cycles, SK’s accounting figures have
not been much more than the offspring of an accounting craft (no negative
connotation intended). As expected, net-income based measures were of little
help in appraising the firm’s central value at any given time. In fact, SK’s net
income, after being grossly understated for years preceding 2004, is believed to be
actually overstated with respect to its mid-cycle earning capacity. Free cash flow
poses a similar problem for its insane volatility on a peak-to-peak basis. In light of
the fact that the net income-based measures are most ‘immediately available’ and
most used as means of valuation by many people, which we believe is not by
‘reason’, but rather by ‘convention’, we must guard against the illusion that there is
‘safety in numbers’.
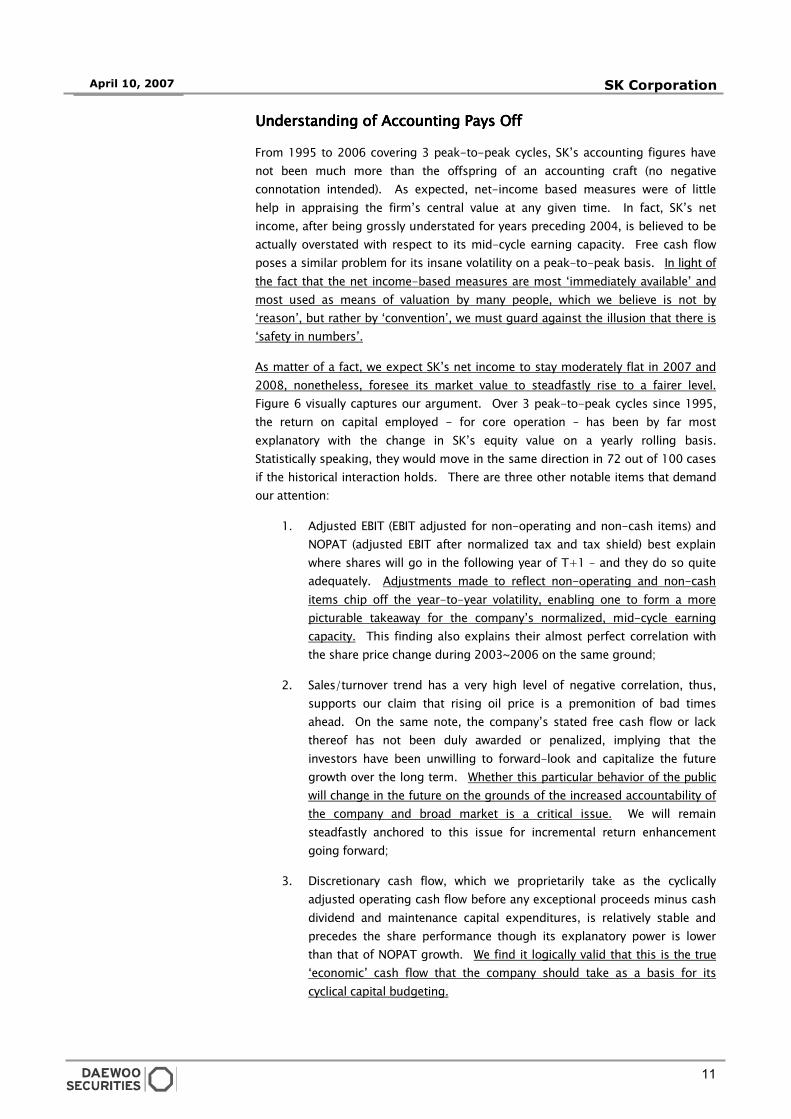
As matter of a fact, we expect SK’s net income to stay moderately flat in 2007 and
2008, nonetheless, foresee its market value to steadfastly rise to a fairer level.
Figure 6 visually captures our argument. Over 3 peak-to-peak cycles since 1995,
the return on capital employed - for core operation – has been by far most
explanatory with the change in SK’s equity value on a yearly rolling basis.
Statistically speaking, they would move in the same direction in 72 out of 100 cases
if the historical interaction holds. There are three other notable items that demand
our attention:
1. Adjusted EBIT (EBIT adjusted for non-operating and non-cash items) and
NOPAT (adjusted EBIT after normalized tax and tax shield) best explain
where shares will go in the following year of T+1 – and they do so quite
adequately. Adjustments made to reflect non-operating and non-cash
items chip off the year-to-year volatility, enabling one to form a more
picturable takeaway for the company’s normalized, mid-cycle earning
capacity. This finding also explains their almost perfect correlation with
the share price change during 2003~2006 on the same ground;
2. Sales/turnover trend has a very high level of negative correlation, thus,
supports our claim that rising oil price is a premonition of bad times
ahead. On the same note, the company’s stated free cash flow or lack
thereof has not been duly awarded or penalized, implying that the
investors have been unwilling to forward-look and capitalize the future
growth over the long term. Whether this particular behavior of the public
will change in the future on the grounds of the increased accountability of
the company and broad market is a critical issue. We will remain
steadfastly anchored to this issue for incremental return enhancement
going forward;
3. Discretionary cash flow, which we proprietarily take as the cyclically
adjusted operating cash flow before any exceptional proceeds minus cash
dividend and maintenance capital expenditures, is relatively stable and
precedes the share performance though its explanatory power is lower
than that of NOPAT growth. We find it logically valid that this is the true
‘economic’ cash flow that the company should take as a basis for its
cyclical capital budgeting.
12
April 10, 2007 SK Corporation
-80%
-60%
-40%
-20%
0%
20%
40%
60%
80%
100%
Turn
over
/Sal
esTu
rnov
er/S
ales
Turn
over
/Sal
esTu
rnov
er/S
ales
EB
IT
EB
IT
EB
IT
EB
IT
Adj
uste
d E
BIT
Adj
uste
d E
BIT
Adj
uste
d E
BIT
Adj
uste
d E
BIT
NO
PA
T N
OP
AT
NO
PA
T N
OP
AT
Net
Inco
me
Net
Inco
me
Net
Inco
me
Net
Inco
me
Fre
e C
ash
Flo
w
Fre
e C
ash
Flo
w
Fre
e C
ash
Flo
w
Fre
e C
ash
Flo
w
Dis
cere
tiona
ryD
isce
retio
nary
Dis
cere
tiona
ryD
isce
retio
nary
Cas
h Fl
owC
ash
Flow
Cas
h Fl
owC
ash
Flow
Cas
h E
arni
ngC
ash
Ear
ning
Cas
h E
arni
ngC
ash
Ear
ning
Sta
ted
RO
ES
tate
d R
OE
Sta
ted
RO
ES
tate
d R
OE
RO
CE
- In
vest
edR
OC
E -
Inve
sted
RO
CE
- In
vest
edR
OC
E -
Inve
sted
Cap
ital
Cap
ital
Cap
ital
Cap
ital
RO
CE
- C
ore
RO
CE
- C
ore
RO
CE
- C
ore
RO
CE
- C
ore
Ope
ratin
g C
apita
lO
pera
ting
Cap
ital
Ope
ratin
g C
apita
lO
pera
ting
Cap
ital
Pearson Coefficient to Stock Price(1995~2006)Pearson Coefficient to Stock Price(2003~2006)Pearson Coefficient to Stock Price ofT+1 year
Reference level of 'meaningfulness'Reference level of 'meaningfulness'Reference level of 'meaningfulness'Reference level of 'meaningfulness'
Highest Explanation Power - 52%Highest Explanation Power - 52%Highest Explanation Power - 52%Highest Explanation Power - 52%
?
Fig 6: Forget RoE and EPS... Monitor RoCE and economic earning growth
(Source: DWS NumberMill)
When well schematized and practised, these findings should translate into a better-
than-average, if not superior, trading/investment strategy. An acute observer, who
grounds his/her analysis in valuing the company’s normalized ‘economic’ earning
with the additory focus on the probability assessment of earning visibility and the
rate of capital expenditures, should identify consistent opportunities with relative
ease. It should also help in a behavioral investing perspective if one knows what
everyone else may be thinking on their possibly illusory premise.
13
April 10, 2007 SK Corporation
-1,500
-1,000
-500
0
500
1,000
FY
1991
FY
1991
FY
1991
FY
1991
FY
1992
FY
1992
FY
1992
FY
1992
FY
1993
FY
1993
FY
1993
FY
1993
FY
1994
FY
1994
FY
1994
FY
1994
FY
1995
FY
1995
FY
1995
FY
1995
FY
1996
FY
1996
FY
1996
FY
1996
FY
1997
FY
1997
FY
1997
FY
1997
FY
1998
FY
1998
FY
1998
FY
1998
FY
1999
FY
1999
FY
1999
FY
1999
FY
2000
FY
2000
FY
2000
FY
2000
FY
2001
FY
2001
FY
2001
FY
2001
FY
2002
FY
2002
FY
2002
FY
2002
FY
2003
FY
2003
FY
2003
FY
2003
FY
2004
FY
2004
FY
2004
FY
2004
FY
2005
FY
2005
FY
2005
FY
2005
FY
2006
FY
2006
FY
2006
FY
2006
FY
2007
FY
2007
FY
2007
FY
2007
FY
2008
FY
2008
FY
2008
FY
2008
Shareholder Value-Added
Annual Average Market Value Added excluding Non Op Assets
Annual Average Market Value Added
(KRW bn)
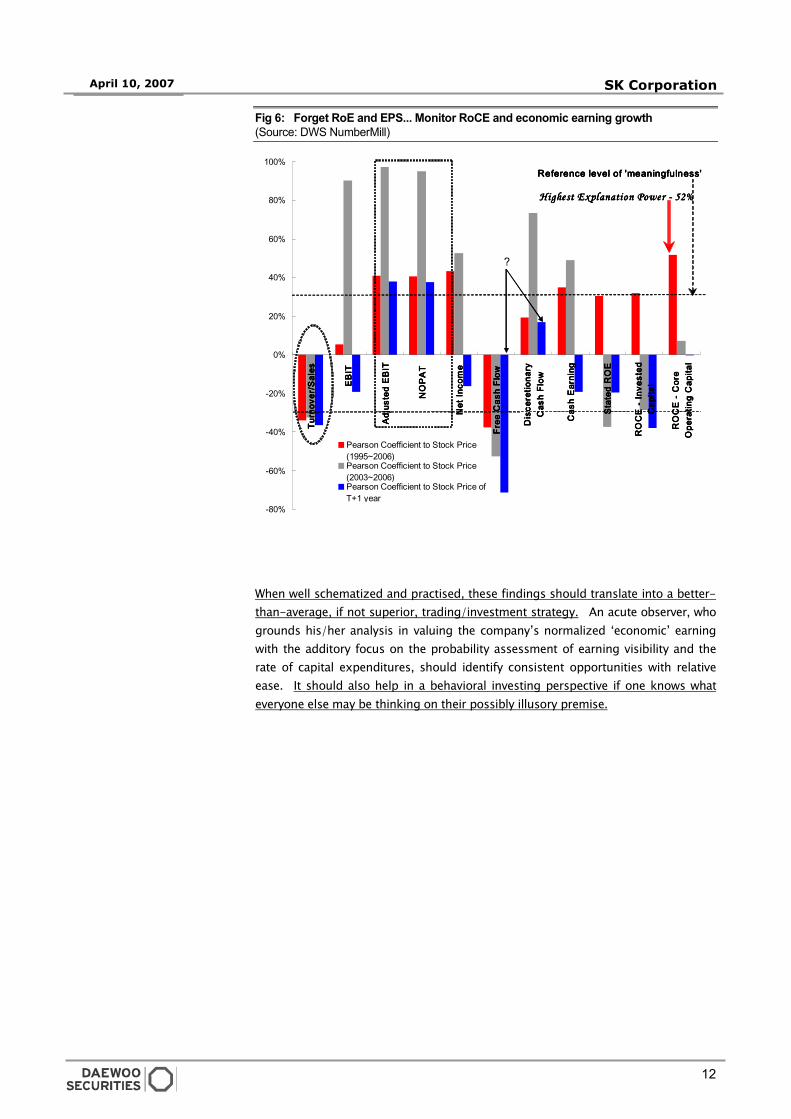
How Should We Value SK How Should We Value SK How Should We Value SK How Should We Value SK andandandand Why? Why? Why? Why?
SK share performance of the last several years has been nothing short of being
superlative. After the full-body of rerating during 2003~2004, SK shares have
started to steepen up again from November 2006. The current price of KRW92,000
is well above the analysts’ consensus and the unexpected strength of prices is
largely interpreted by the market as the due premium accounting for the likelihood
of SK wearing a holding company outfit whereby asset values of its investment
holdings will likely be more justifiably and ‘transparently’ reflected.
While we do not completely disagree that such a proposition is certainly one casual
way to explain the recent strength of its share price, we find a better explanation for
the case of undervaluation in the ‘post-2003’ trend and pattern of SK’s core
operating earning.
Fig 7: Could an average investor have been led astray by pileup of miscalculations over the years?.. (Source: DWS NumberMill)
First, despite the clear difference in the trend and pattern of SK’s core operating
earning before and after 2003, the analyst community appears to be still reserved
with the company’s earning over the next two years, unwilling to capitalize on its
future earning in the upcoming cycles. Fully detailed in the following section, we
are clearly more positive on SK’s earning visibility and forward-look at its earning
stream in justifiably going-concern perspective with the conscious effort not to err
of stretching beyond what we ought to ‘normatively’ envisage. Second, charting
the historical pattern of SK’s value-added generation, or lack thereof, we can see
that it was the public’s recognition of SK’s investments that actually supported the
share price until 1997. Otherwise, it would be logically difficult to explain the case
of SK’s huge overvaluation throughout the entire ’90s unless the market was so
inefficient to the extent that any analytic effort was of little, if not none, utility (as
indicated by the dotted line). What do you think?
14
April 10, 2007 SK Corporation
The bottom line we wish to address is that, simply, the market may have not caught
up with the degree (or slope) of the turnaround in SK’s earning yet enough and even
perhaps expect its shares to be somewhat gravitational for a technical reason – that
is because the share prices went up ‘too much’. To add to the mystery of SK’s
undervaluation is the perversity of the current trend toward (liquidity-driven)
indexation pushing financial investors to stocks whose characteristics are not
necessarily synonymous with best value. This is about to change as we believe that
the current M&A boom is symptomatic of value being snatched up by ‘industrial’
buyers. If you can borrow at 5~6% and are asked to entertain a possible purchase
of a company like SK that has a cash yield of 8~9%, which financial investors seem to
ignore anyway, you are having the time of your life. But we see that financial
investors will not be ‘robbed’. Instead, with proliferation of buyout funds, we are
now ready to bet that they will soon decide to buy these assets themselves.
To align ourselves in this expected setting, we choose to look at SK from a ‘primary’
market value perspective (as ‘they’ are) for what it’s worth. The actual, ‘economic’
value of SK’s investments, whether the company is a controlling firm or legally a
holding company, does not change. Our reasoning by choice is to appraise the
company’s core business operation based on its future earning subject to our (or of
anyone deemed to be an expert) fair visibility and then add up this appraised value
and non-operating investments assets minus the sum of probability-weighted
‘value destruction’, which we will state in terms of percent of capital employed, for
the ‘conglomerate’ discount.
The conglomerate discount exists when a conglomerate would be worth more to
shareholders if it were split up and sold as separate business units than it is
currently valued by the market. And, we do believe that SK’s petroleum and its
upstream E&P business, if separated, can demand a higher price tag. Among many
factors, a conglomerate discount exists, in our opinion, due to management costs
(associated with bureaucracy and cross-subsidy risk), minority costs (associated
with an individual or family’s possible malfeasance), and technical costs (associated
with loss of clarity in financial accounts and higher costs to keep investors informed).
We would mainly discount SK for management costs because there aren’t enough
material signs to suggest that the last two must be accounted for.
15
April 10, 2007 SK Corporation
-15%
-10%
-5%
0%
5%
10%
15%
20%
25%
30%
35%
FY1997
FY1998
FY1999
FY2000
FY2001
FY2002
FY2003
FY2004
FY2005
FY2006
FY2007
FY2008
Total Asset Sales/Turnover Operating Capital
Now the Fun Part Now the Fun Part Now the Fun Part Now the Fun Part ---- Crunching Up Numbers! Crunching Up Numbers! Crunching Up Numbers! Crunching Up Numbers!
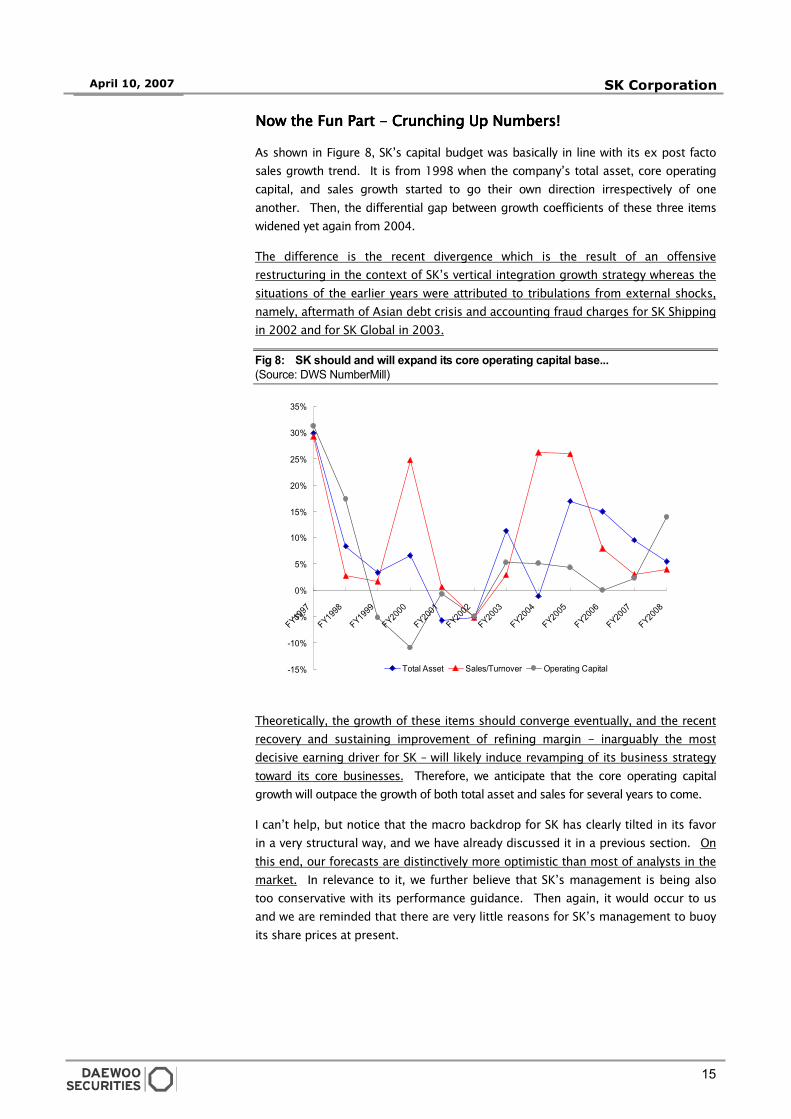
As shown in Figure 8, SK’s capital budget was basically in line with its ex post facto
sales growth trend. It is from 1998 when the company’s total asset, core operating
capital, and sales growth started to go their own direction irrespectively of one
another. Then, the differential gap between growth coefficients of these three items
widened yet again from 2004.
The difference is the recent divergence which is the result of an offensive
restructuring in the context of SK’s vertical integration growth strategy whereas the
situations of the earlier years were attributed to tribulations from external shocks,
namely, aftermath of Asian debt crisis and accounting fraud charges for SK Shipping
in 2002 and for SK Global in 2003.
Fig 8: SK should and will expand its core operating capital base...
(Source: DWS NumberMill)
Theoretically, the growth of these items should converge eventually, and the recent
recovery and sustaining improvement of refining margin - inarguably the most
decisive earning driver for SK – will likely induce revamping of its business strategy
toward its core businesses. Therefore, we anticipate that the core operating capital
growth will outpace the growth of both total asset and sales for several years to come.
I can’t help, but notice that the macro backdrop for SK has clearly tilted in its favor
in a very structural way, and we have already discussed it in a previous section. On
this end, our forecasts are distinctively more optimistic than most of analysts in the
market. In relevance to it, we further believe that SK’s management is being also
too conservative with its performance guidance. Then again, it would occur to us
and we are reminded that there are very little reasons for SK’s management to buoy
its share prices at present.
16
April 10, 2007 SK Corporation
0
100
200
300
400
500
600
700
Petroleum Petrochemical Lubricant E&P Others
SK GuidanceDWS EstimateDWS Estimate - Economic EBIT
KRWbn
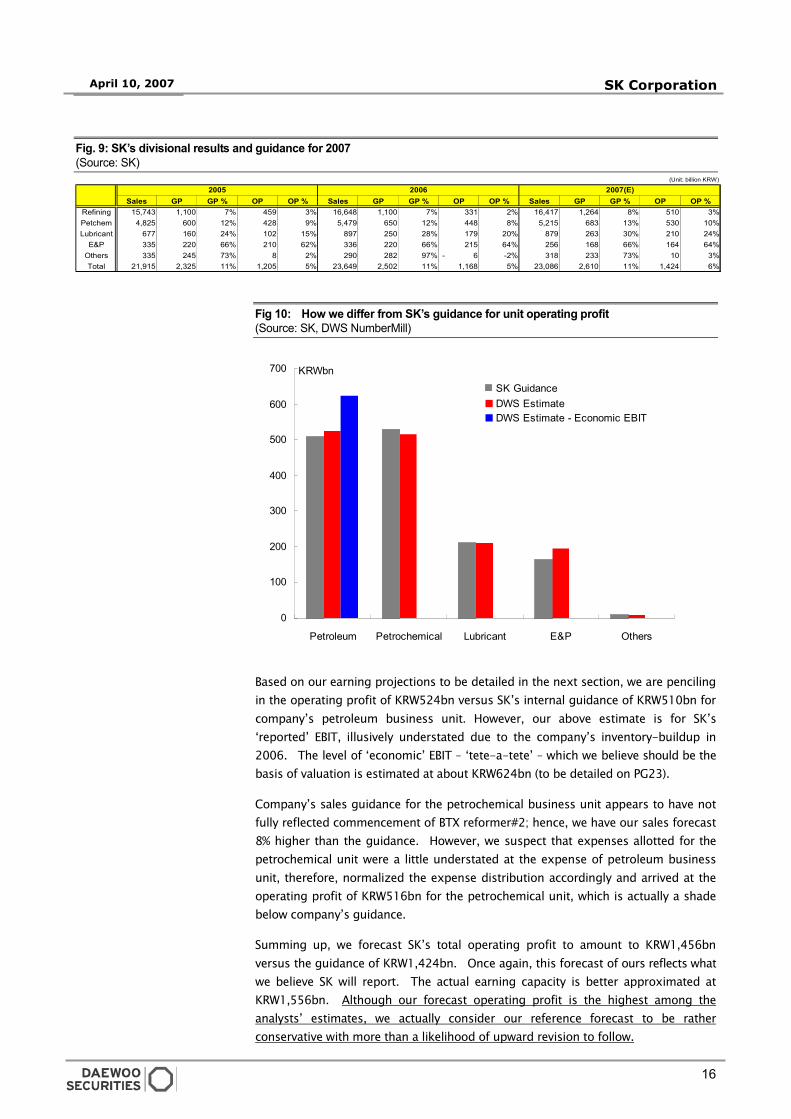
Fig. 9: SK’s divisional results and guidance for 2007
(Source: SK)
Fig 10: How we differ from SK’s guidance for unit operating profit
(Source: SK, DWS NumberMill)
Based on our earning projections to be detailed in the next section, we are penciling
in the operating profit of KRW524bn versus SK’s internal guidance of KRW510bn for
company’s petroleum business unit. However, our above estimate is for SK’s
‘reported’ EBIT, illusively understated due to the company’s inventory-buildup in
2006. The level of ‘economic’ EBIT – ‘tete-a-tete’ – which we believe should be the
basis of valuation is estimated at about KRW624bn (to be detailed on PG23).
Company’s sales guidance for the petrochemical business unit appears to have not
fully reflected commencement of BTX reformer#2; hence, we have our sales forecast
8% higher than the guidance. However, we suspect that expenses allotted for the
petrochemical unit were a little understated at the expense of petroleum business
unit, therefore, normalized the expense distribution accordingly and arrived at the
operating profit of KRW516bn for the petrochemical unit, which is actually a shade
below company’s guidance.
Summing up, we forecast SK’s total operating profit to amount to KRW1,456bn
versus the guidance of KRW1,424bn. Once again, this forecast of ours reflects what
we believe SK will report. The actual earning capacity is better approximated at
KRW1,556bn. Although our forecast operating profit is the highest among the
analysts’ estimates, we actually consider our reference forecast to be rather
conservative with more than a likelihood of upward revision to follow.
(Unit: billion KRW)
Sales GP GP % OP OP % Sales GP GP % OP OP % Sales GP GP % OP OP %
Refining 15,743 1,100 7% 459 3% 16,648 1,100 7% 331 2% 16,417 1,264 8% 510 3%
Petchem 4,825 600 12% 428 9% 5,479 650 12% 448 8% 5,215 683 13% 530 10%
Lubricant 677 160 24% 102 15% 897 250 28% 179 20% 879 263 30% 210 24%
E&P 335 220 66% 210 62% 336 220 66% 215 64% 256 168 66% 164 64%
Others 335 245 73% 8 2% 290 282 97% - 6 -2% 318 233 73% 10 3%
Total 21,915 2,325 11% 1,205 5% 23,649 2,502 11% 1,168 5% 23,086 2,610 11% 1,424 6%
2005 2006 2007(E)
17
April 10, 2007 SK Corporation
As we previously stated, our aim is to forward-look at SK’s earning stream in going-
concern perspective with the effort not to err of stretching beyond what we ought to
‘normatively’ envisage. And we remain alerted to do it in a risk-adjusted way via
taking its earning visibility into account. Our due assumptions are as follows:
1. Peak Year: 2011 for EBIT/NOPAT margin; 2012 for sales and capital growth
2. Explicit forecast for sales growth: 3.0% (2007), 4.0% (2008), and 6.1% (2009)
3. Explicit forecast for growth of capital employed: 18.3%, 10.3%, and 4.0%
4. Explicit forecast for NOPAT margin: 4.4%, 4.2%, 5.9% - reference case scenario
5. Linear forecast for NOPAT margin (based on sales and EBIT margin
1990~2003): worst case scenario
6. Linear forecast for NOPAT margin (based on sales and EBIT margin
2002~2006): best case scenario
7. Rate of Change(Up)/Decay(Down) for the transitory period (2010~2014): 2.1%
for sales g; 3.1% for capital g; 1.7% of EBIT margin
8. No major acquisitions or buybacks
We foresee that SK’s future value-added will stem more from margin expansion
than from capital turn improvement. As such, margin peak year and year-to-year
variability will have the most material impact on the company’s central value.
We explicitly forecast that NOPAT margin will peak in 2011 on two grounds: (1) that
yearly supply additions will be most pronounced in 2010 - to be fully operational in
2011 and onward; and (2) that the eligibility for tax credits for purchase of a diesel-
powered vehicle in the US expires in December 31, 2010.
We assume 1.7% for the rate of decay for EBIT margin based on a historical
simulation. Qualitative and intuitive, we actually anticipate more improvements in
the operating efficiency and cost control than our reference forecast would imply.
On the SG&A side, there will be little pressure on key costs in FY2007~FY2008.
Transportation cost – disproportionately high in 2006 – will moderate in 2007 and
2008. Labor cost should likely remain capped because SK is already the second
highest paying employer in Korea – some USD70K per head (excluding board
directors) – as of 2006.
The advantage of dynamic valuation approach using the ‘cyclical’ fade is that we
could compare the company’s quarterly performance against our forecast
assumptions so that we can dynamically adapt our positioning in the invested
shares for return enhancement in a tactical context, according to earning
announcements and news flows.
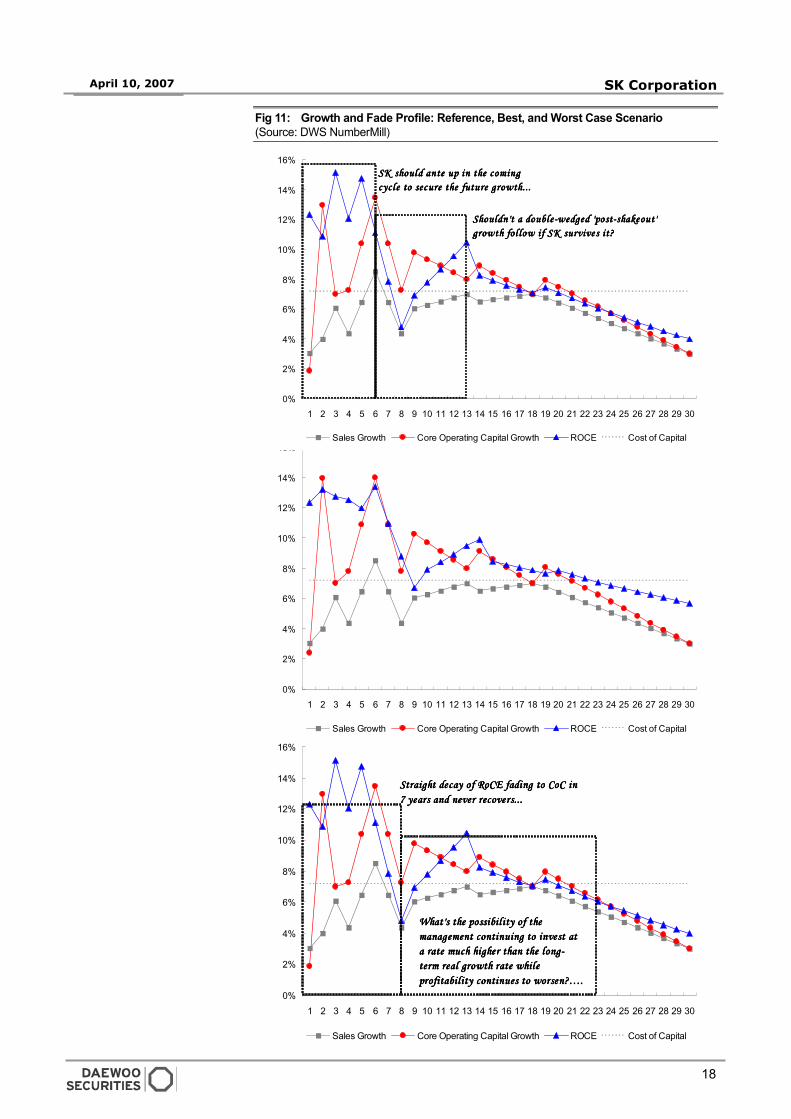
Assimilating to a highly dynamic nature of the stock market, we deliberately choose
to calculate the share’s central value for each of three different scenarios:
Reference-case based on our explicit forecasts; Worst-case based on linear
forecasts assuming that good performances of 2004~2006 are atypical, hence
cannot be used as a representative basis of the mid-cycle performance; Best-case
based on linear forecasts assuming the performances of the last cycle of
2002~2006 will be typical of the future mid-cycle performance. Our dynamic
valuation approach turns out the worth of SK’s core operation at KRW14tr, KRW
11.2tr, and KRW15.3tr for the reference, worst, and best case scenario, respectively.
18
April 10, 2007 SK Corporation
0%
2%
4%
6%
8%
10%
12%
14%
16%
1 2 3 4 5 6 7 8 9 10 11 12 13 14 15 16 17 18 19 20 21 22 23 24 25 26 27 28 29 30
Sales Growth Core Operating Capital Growth ROCE Cost of Capital
0%
2%
4%
6%
8%
10%
12%
14%
16%
1 2 3 4 5 6 7 8 9 10 11 12 13 14 15 16 17 18 19 20 21 22 23 24 25 26 27 28 29 30
Sales Growth Core Operating Capital Growth ROCE Cost of Capital
Straight decay of RoCE fading to CoC inStraight decay of RoCE fading to CoC inStraight decay of RoCE fading to CoC inStraight decay of RoCE fading to CoC in
7 years and never recovers...7 years and never recovers...7 years and never recovers...7 years and never recovers...
What's the possibility of theWhat's the possibility of theWhat's the possibility of theWhat's the possibility of the
management continuing to invest atmanagement continuing to invest atmanagement continuing to invest atmanagement continuing to invest at
a rate much higher than the long-a rate much higher than the long-a rate much higher than the long-a rate much higher than the long-
term real growth rate whileterm real growth rate whileterm real growth rate whileterm real growth rate while
profitability continues to worsen?….profitability continues to worsen?….profitability continues to worsen?….profitability continues to worsen?….
Fig 11: Growth and Fade Profile: Reference, Best, and Worst Case Scenario
(Source: DWS NumberMill)
0%
2%
4%
6%
8%
10%
12%
14%
16%
1 2 3 4 5 6 7 8 9 10 11 12 13 14 15 16 17 18 19 20 21 22 23 24 25 26 27 28 29 30
Sales Growth Core Operating Capital Growth ROCE Cost of Capital
SK should ante up in the comingSK should ante up in the comingSK should ante up in the comingSK should ante up in the coming
cycle to secure the future growth...cycle to secure the future growth...cycle to secure the future growth...cycle to secure the future growth...
Shouldn't a double-wedged 'post-shakeout'Shouldn't a double-wedged 'post-shakeout'Shouldn't a double-wedged 'post-shakeout'Shouldn't a double-wedged 'post-shakeout'
growth fol low if SK survives it?growth fol low if SK survives it?growth fol low if SK survives it?growth fol low if SK survives it?
19
April 10, 2007 SK Corporation
21.8% 90.8%
40.6% 91.1%
44.2% 60.0%
22.7%72.1% 29.6%
22.7%51.0% SK GasSK GasSK GasSK Gas 50% 67.1%
39.4% Daehan GasDaehan GasDaehan GasDaehan Gas 40%Busan GasBusan GasBusan GasBusan Gas 40%
90.6% Pohang GasPohang GasPohang GasPohang Gas 100% 30.0%Chungjoo GasChungjoo GasChungjoo GasChungjoo Gas 100%Koomi GasKoomi GasKoomi GasKoomi Gas 100%
40.1% Choongnam GasChoongnam GasChoongnam GasChoongnam Gas 100% 22.7%Kangwon GasKangwon GasKangwon GasKangwon Gas 100%Iksan GasIksan GasIksan GasIksan Gas 100%Chunnam GasChunnam GasChunnam GasChunnam Gas 100%
32.4%
65.0%
96.7%
SKSKSKSK SK TelecomSK TelecomSK TelecomSK Telecom
SK NetworksSK NetworksSK NetworksSK Networks
SKCSKCSKCSKC
K-PowerK-PowerK-PowerK-Power
OK CashbackOK CashbackOK CashbackOK Cashback
SKSKSKSKSecuritiesSecuritiesSecuritiesSecurities
SKSKSKSKChemicalsChemicalsChemicalsChemicals
SK E&CSK E&CSK E&CSK E&C
Dong-ShinDong-ShinDong-ShinDong-Shin
SK ShippingSK ShippingSK ShippingSK Shipping
SKE&SSKE&SSKE&SSKE&S
DOPCODOPCODOPCODOPCO
SK TelinkSK TelinkSK TelinkSK Telink
SKSKSKSKCommunicationCommunicationCommunicationCommunication
SeoulSeoulSeoulSeoulRecordsRecordsRecordsRecords
TU MediaTU MediaTU MediaTU Media
PantechPantechPantechPantech
SK IncheonSK IncheonSK IncheonSK Incheon
PaxnetPaxnetPaxnetPaxnet
SKC&CSKC&CSKC&CSKC&C
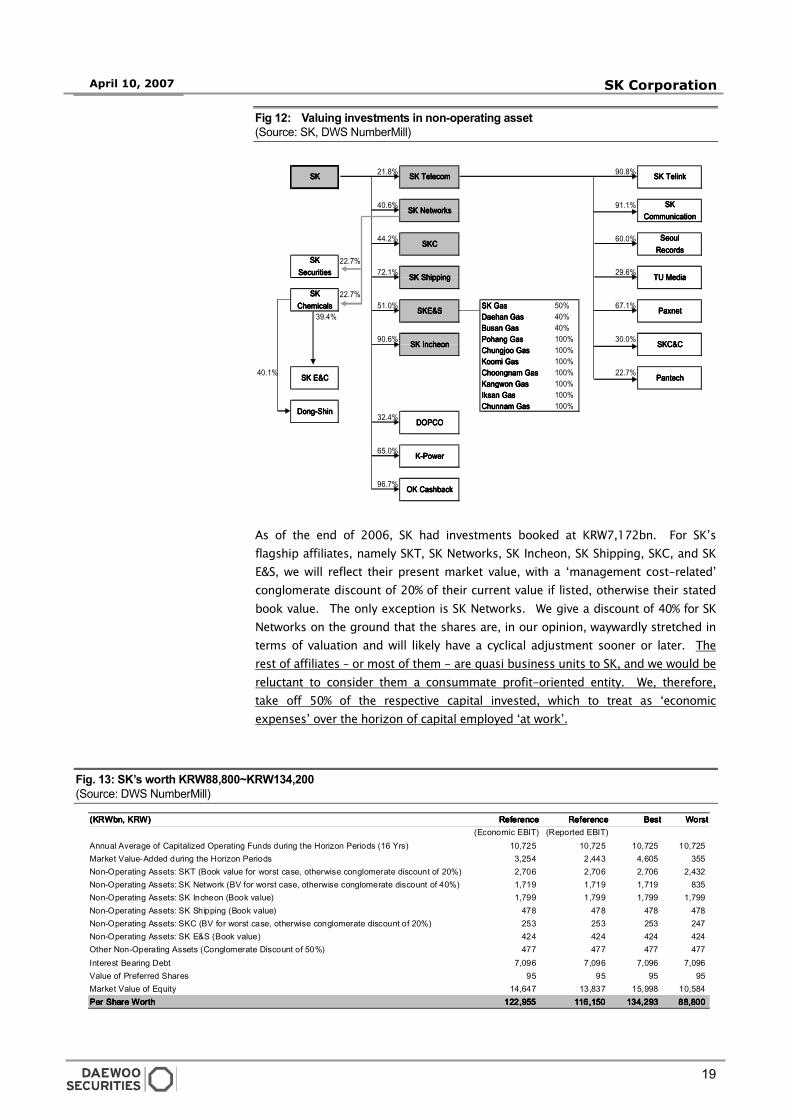
Fig 12: Valuing investments in non-operating asset
(Source: SK, DWS NumberMill)
As of the end of 2006, SK had investments booked at KRW7,172bn. For SK’s
flagship affiliates, namely SKT, SK Networks, SK Incheon, SK Shipping, SKC, and SK
E&S, we will reflect their present market value, with a ‘management cost-related’
conglomerate discount of 20% of their current value if listed, otherwise their stated
book value. The only exception is SK Networks. We give a discount of 40% for SK
Networks on the ground that the shares are, in our opinion, waywardly stretched in
terms of valuation and will likely have a cyclical adjustment sooner or later. The
rest of affiliates – or most of them - are quasi business units to SK, and we would be
reluctant to consider them a consummate profit-oriented entity. We, therefore,
take off 50% of the respective capital invested, which to treat as ‘economic
expenses’ over the horizon of capital employed ‘at work’.
Fig. 13: SK’s worth KRW88,800~KRW134,200
(Source: DWS NumberMill)
(KRWbn, KRW)(KRWbn, KRW)(KRWbn, KRW)(KRWbn, KRW) ReferenceReferenceReferenceReference ReferenceReferenceReferenceReference BestBestBestBest WorstWorstWorstWorst(Economic EBIT) (Reported EBIT)
Annual Average of Capitalized Operating Funds during the Horizon Periods (16 Yrs) 10,725 10,725 10,725 10,725 Market Value-Added during the Horizon Periods 3,254 2,443 4,605 355 Non-Operating Assets: SKT (Book value for worst case, otherwise conglomerate discount of 20%) 2,706 2,706 2,706 2,432 Non-Operating Assets: SK Network (BV for worst case, otherwise conglomerate discount of 40%) 1,719 1,719 1,719 835 Non-Operating Assets: SK Incheon (Book value) 1,799 1,799 1,799 1,799 Non-Operating Assets: SK Shipping (Book value) 478 478 478 478 Non-Operating Assets: SKC (BV for worst case, otherwise conglomerate discount of 20%) 253 253 253 247 Non-Operating Assets: SK E&S (Book value) 424 424 424 424 Other Non-Operating Assets (Conglomerate Discount of 50%) 477 477 477 477 Interest Bearing Debt 7,096 7,096 7,096 7,096 Value of Preferred Shares 95 95 95 95 Market Value of Equity 14,647 13,837 15,998 10,584 Per Share WorthPer Share WorthPer Share WorthPer Share Worth 122,955122,955122,955122,955 116,150116,150116,150116,150 134,293134,293134,293134,293 88,80088,80088,80088,800
20
April 10, 2007 SK Corporation
So we have a case of a clear-cut undervaluation. However alertly we look at the
numbers subject to analysis (especially key numbers that have impact on margin),
we do not see cases of numbers, which we may have subconsciously ‘stretched’, in
order to justify our argument, in a self-fulfilling way. Instead, our assumptions for
the reference case scenario, if not downright conservative, should be achievable with
a relative ease for SK (excluding an unexpected catastrophic situation).
The only explanation we have for SK’s steep undervaluation is that the majority of
market participants are still reserved with SK’s less-than-stellar leadership status
(therefore, no premium over the broad market) in Korean economy. Things will
likely change.
Equally subject to change is the role of financial investors worldwide in today’s
highly dynamic market. Awash with excess liquidity, we will see a case of
hyperbolic growth in buyout deals in Asia. Cash yield of 8~9% and a dividend pool
of about 50% for a company that has a similar magnitude of structural force and
cyclical momentum on its back, let alone market size, as SK, are very hard to come
by. As per the menu of financial abstracts for SK (on PG.2), we are betting that
financial investors will decide to commit for a long-term hold.
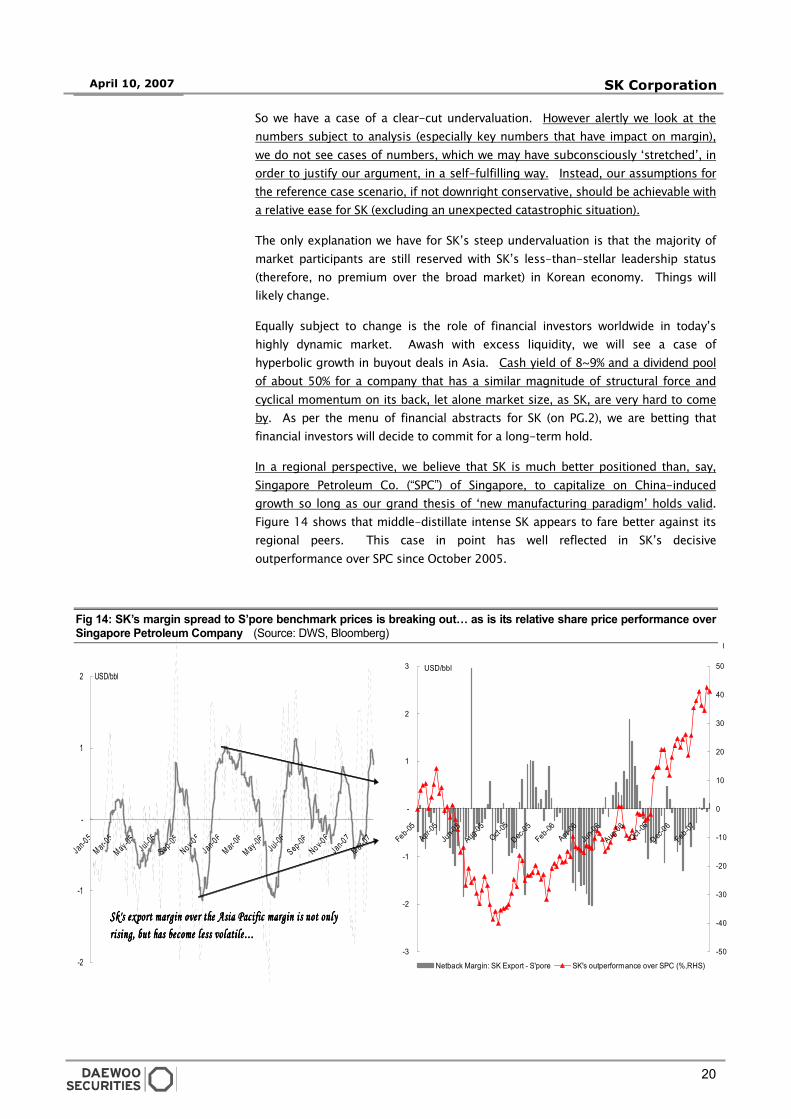
In a regional perspective, we believe that SK is much better positioned than, say,
Singapore Petroleum Co. (“SPC”) of Singapore, to capitalize on China-induced
growth so long as our grand thesis of ‘new manufacturing paradigm’ holds valid.
Figure 14 shows that middle-distillate intense SK appears to fare better against its
regional peers. This case in point has well reflected in SK’s decisive
outperformance over SPC since October 2005.
Fig 14: SK’s margin spread to S’pore benchmark prices is breaking out… as is its relative share price performance over Singapore Petroleum Company (Source: DWS, Bloomberg)
-3
-2
-1
-
1
2
3
Feb-05Apr-0
5
Jun-0
5
Aug-05
Oct-05
Dec-05
Feb-06Apr-0
6
Jun-0
6
Aug-06
Oct-06
Dec-06
Feb-07
-50
-40
-30
-20
-10
0
10
20
30
40
50
Netback Margin: SK Export - S'pore SK's outperformance over SPC (%,RHS)
USD/bbl
-2
-1
-
1
2
Jan-05
Mar-05
May-05
Jul-05
Sep-05
Nov-05
Jan-06
Mar-06
May-06
Jul-06
Sep-06
Nov-06
Jan-0 7
Mar-07
USD/bbl
Sk's export margin over the Asia Pacific margin is not onlySk's export margin over the Asia Pacific margin is not onlySk's export margin over the Asia Pacific margin is not onlySk's export margin over the Asia Pacific margin is not only
rising, but has become less volati le…rising, but has become less volati le…rising, but has become less volati le…rising, but has become less volati le…
21
April 10, 2007 SK Corporation
-6
-4
-2
-
2
4
6
8
10
Feb-05
Apr-05
Jun-0
5
Aug-05
Oct-05
Dec-05
Feb-06
Apr-06
Jun-0
6
Aug-06
Oct-06
Dec-06
Feb-07
S'pore-Arab Light Netback Margin SK's Blended Netback Margin
USD/bbl
-6
-4
-2
-
2
4
6
8
10
12
Feb-05
Apr-05
Jun-0
5
Aug-05
Oct-05
Dec-05
Feb-06
Apr-06
Jun-0
6
Aug-06
Oct-06
Dec-06
Feb-07
S'pore-Arab Light Netback Margin SK's Export Netback Margin
USD/bbl
22000077 OOPPEERRAATTIINNGG PPEERRFFOORRMMAANNCCEE
SSUURRPPRRIISSEE!! SSUURRPPRRIISSEE!! SSUURRPPRRIISSEE!!
Situations Situations Situations Situations are are are are getgetgetgettingtingtingting ‘refined’ for SK ‘refined’ for SK ‘refined’ for SK ‘refined’ for SK
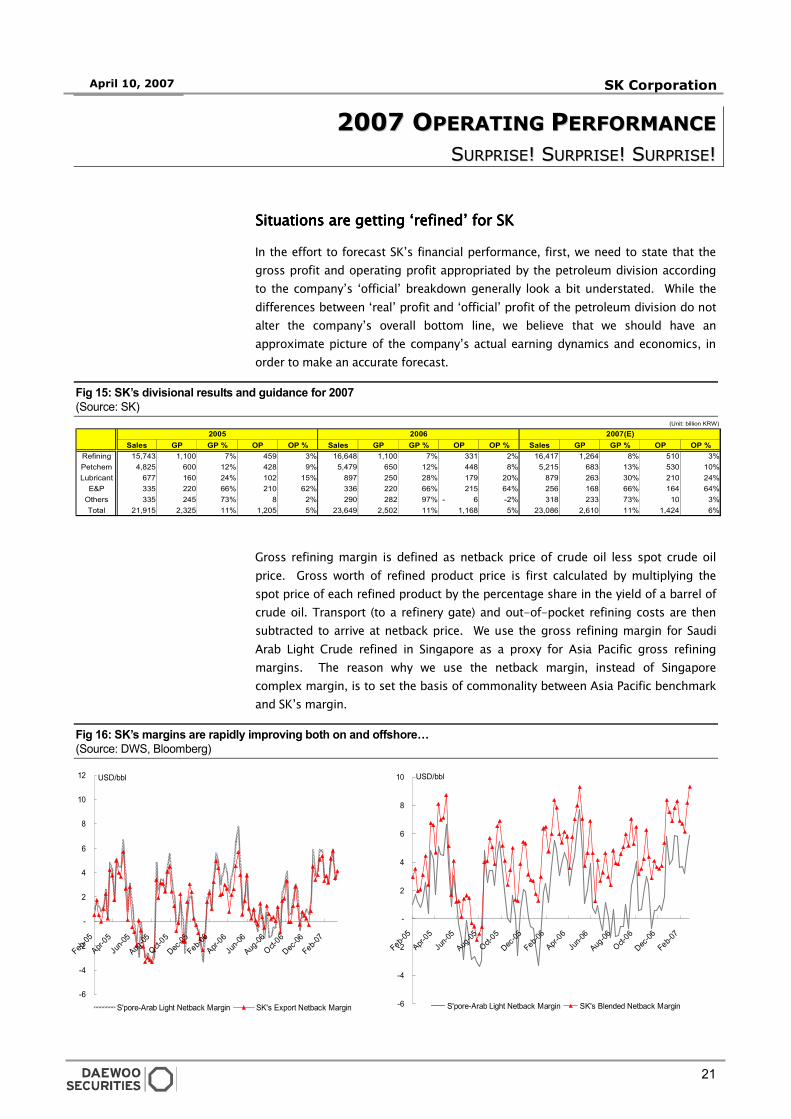
In the effort to forecast SK’s financial performance, first, we need to state that the
gross profit and operating profit appropriated by the petroleum division according
to the company’s ‘official’ breakdown generally look a bit understated. While the
differences between ‘real’ profit and ‘official’ profit of the petroleum division do not
alter the company’s overall bottom line, we believe that we should have an
approximate picture of the company’s actual earning dynamics and economics, in
order to make an accurate forecast.
Fig 15: SK’s divisional results and guidance for 2007
(Source: SK)
Gross refining margin is defined as netback price of crude oil less spot crude oil
price. Gross worth of refined product price is first calculated by multiplying the
spot price of each refined product by the percentage share in the yield of a barrel of
crude oil. Transport (to a refinery gate) and out-of-pocket refining costs are then
subtracted to arrive at netback price. We use the gross refining margin for Saudi
Arab Light Crude refined in Singapore as a proxy for Asia Pacific gross refining
margins. The reason why we use the netback margin, instead of Singapore
complex margin, is to set the basis of commonality between Asia Pacific benchmark
and SK’s margin.
Fig 16: SK’s margins are rapidly improving both on and offshore…
(Source: DWS, Bloomberg)
(Unit: billion KRW)
Sales GP GP % OP OP % Sales GP GP % OP OP % Sales GP GP % OP OP %
Refining 15,743 1,100 7% 459 3% 16,648 1,100 7% 331 2% 16,417 1,264 8% 510 3%
Petchem 4,825 600 12% 428 9% 5,479 650 12% 448 8% 5,215 683 13% 530 10%
Lubricant 677 160 24% 102 15% 897 250 28% 179 20% 879 263 30% 210 24%
E&P 335 220 66% 210 62% 336 220 66% 215 64% 256 168 66% 164 64%
Others 335 245 73% 8 2% 290 282 97% - 6 -2% 318 233 73% 10 3%
Total 21,915 2,325 11% 1,205 5% 23,649 2,502 11% 1,168 5% 23,086 2,610 11% 1,424 6%
2005 2006 2007(E)
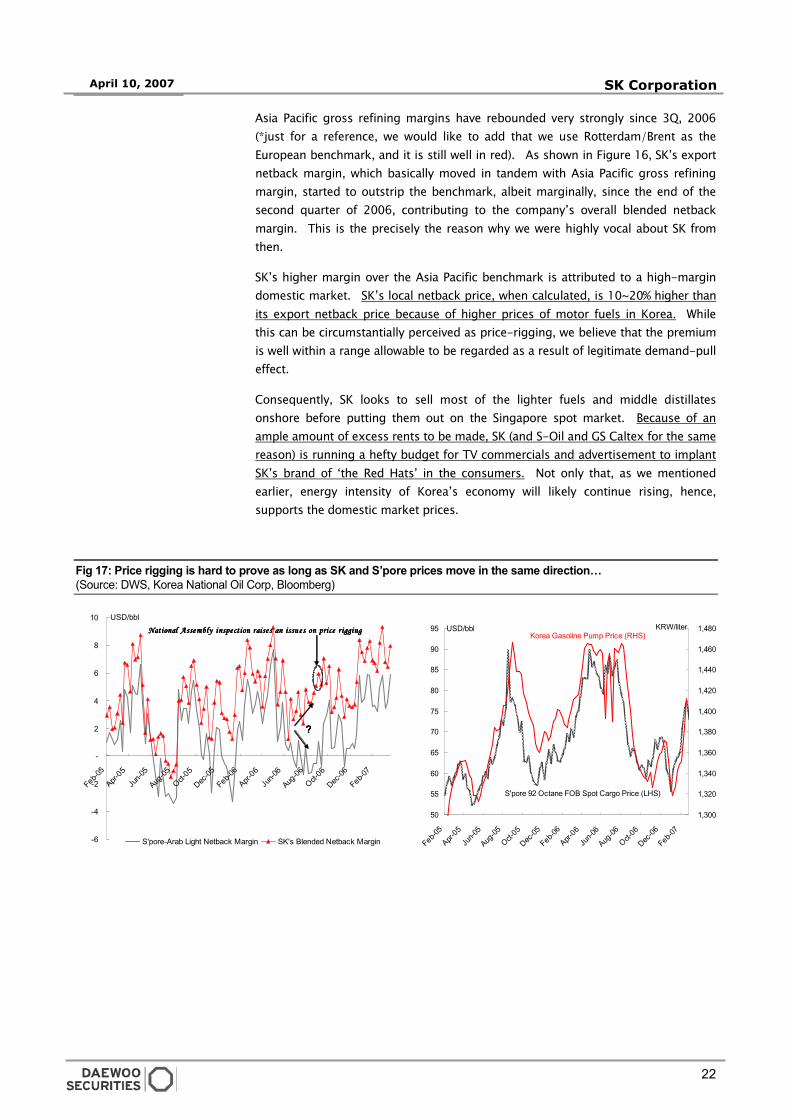
22
April 10, 2007 SK Corporation
Asia Pacific gross refining margins have rebounded very strongly since 3Q, 2006
(*just for a reference, we would like to add that we use Rotterdam/Brent as the
European benchmark, and it is still well in red). As shown in Figure 16, SK’s export
netback margin, which basically moved in tandem with Asia Pacific gross refining
margin, started to outstrip the benchmark, albeit marginally, since the end of the
second quarter of 2006, contributing to the company’s overall blended netback
margin. This is the precisely the reason why we were highly vocal about SK from
then.
SK’s higher margin over the Asia Pacific benchmark is attributed to a high-margin
domestic market. SK’s local netback price, when calculated, is 10~20% higher than
its export netback price because of higher prices of motor fuels in Korea. While
this can be circumstantially perceived as price-rigging, we believe that the premium
is well within a range allowable to be regarded as a result of legitimate demand-pull
effect.
Consequently, SK looks to sell most of the lighter fuels and middle distillates
onshore before putting them out on the Singapore spot market. Because of an
ample amount of excess rents to be made, SK (and S-Oil and GS Caltex for the same
reason) is running a hefty budget for TV commercials and advertisement to implant
SK’s brand of ‘the Red Hats’ in the consumers. Not only that, as we mentioned
earlier, energy intensity of Korea’s economy will likely continue rising, hence,
supports the domestic market prices.
Fig 17: Price rigging is hard to prove as long as SK and S’pore prices move in the same direction…
(Source: DWS, Korea National Oil Corp, Bloomberg)
50
55
60
65
70
75
80
85
90
95
Feb-05
Apr-05
Jun-0
5
Aug-05
Oct-05
Dec-05
Feb-06
Apr-06
Jun-0
6
Aug-06
Oct-06
Dec-06
Feb-07
1,300
1,320
1,340
1,360
1,380
1,400
1,420
1,440
1,460
1,480Korea Gasoline Pump Price (RHS)
USD/bbl KRW/liter
S'pore 92 Octane FOB Spot Cargo Price (LHS)
-6
-4
-2
-
2
4
6
8
10
Feb-05
Apr-05
Jun-0
5
Aug-05
Oct-05
Dec-05
Feb-06
Apr-06
Jun-0
6
Aug-06
Oct-06
Dec-06
Feb-07
S'pore-Arab Light Netback Margin SK's Blended Netback Margin
USD/bblNational Assembly inspection raise s an issu es on price r iggingNational Assembly inspection raise s an issu es on price r iggingNational Assembly inspection raise s an issu es on price r iggingNational Assembly inspection raise s an issu es on price r igging
????
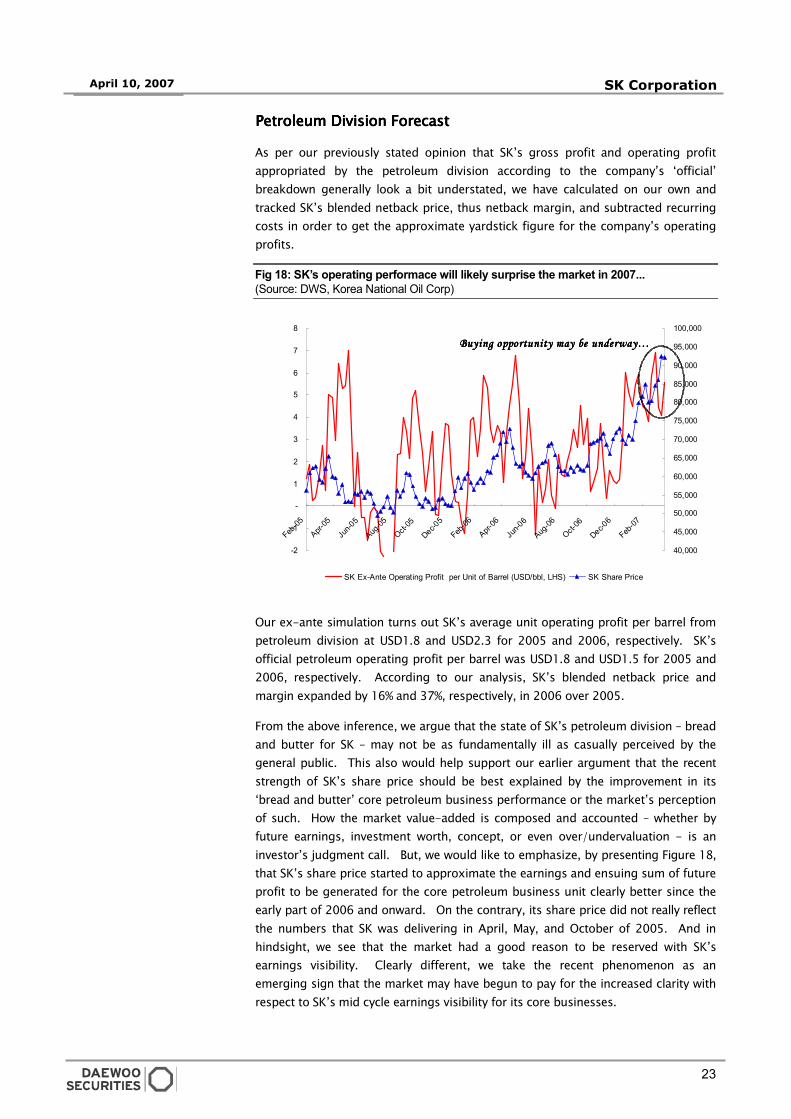
23
April 10, 2007 SK Corporation
-2
-1
-
1
2
3
4
5
6
7
8
Feb-05
Apr-05
Jun-0
5
Aug-05
Oct-05
Dec-05
Feb-06
Apr-06
Jun-0
6
Aug-06
Oct-06
Dec-06
Feb-07
40,000
45,000
50,000
55,000
60,000
65,000
70,000
75,000
80,000
85,000
90,000
95,000
100,000
SK Ex-Ante Operating Profit per Unit of Barrel (USD/bbl, LHS) SK Share Price
Buying opportunity may be underway…Buying opportunity may be underway…Buying opportunity may be underway…Buying opportunity may be underway…
Petroleum Division ForecastPetroleum Division ForecastPetroleum Division ForecastPetroleum Division Forecast
As per our previously stated opinion that SK’s gross profit and operating profit
appropriated by the petroleum division according to the company’s ‘official’
breakdown generally look a bit understated, we have calculated on our own and
tracked SK’s blended netback price, thus netback margin, and subtracted recurring
costs in order to get the approximate yardstick figure for the company’s operating
profits.
Fig 18: SK’s operating performace will likely surprise the market in 2007...
(Source: DWS, Korea National Oil Corp)
Our ex-ante simulation turns out SK’s average unit operating profit per barrel from
petroleum division at USD1.8 and USD2.3 for 2005 and 2006, respectively. SK’s
official petroleum operating profit per barrel was USD1.8 and USD1.5 for 2005 and
2006, respectively. According to our analysis, SK’s blended netback price and
margin expanded by 16% and 37%, respectively, in 2006 over 2005.
From the above inference, we argue that the state of SK’s petroleum division – bread
and butter for SK – may not be as fundamentally ill as casually perceived by the
general public. This also would help support our earlier argument that the recent
strength of SK’s share price should be best explained by the improvement in its
‘bread and butter’ core petroleum business performance or the market’s perception
of such. How the market value-added is composed and accounted – whether by
future earnings, investment worth, concept, or even over/undervaluation - is an
investor’s judgment call. But, we would like to emphasize, by presenting Figure 18,
that SK’s share price started to approximate the earnings and ensuing sum of future
profit to be generated for the core petroleum business unit clearly better since the
early part of 2006 and onward. On the contrary, its share price did not really reflect
the numbers that SK was delivering in April, May, and October of 2005. And in
hindsight, we see that the market had a good reason to be reserved with SK’s
earnings visibility. Clearly different, we take the recent phenomenon as an
emerging sign that the market may have begun to pay for the increased clarity with
respect to SK’s mid cycle earnings visibility for its core businesses.
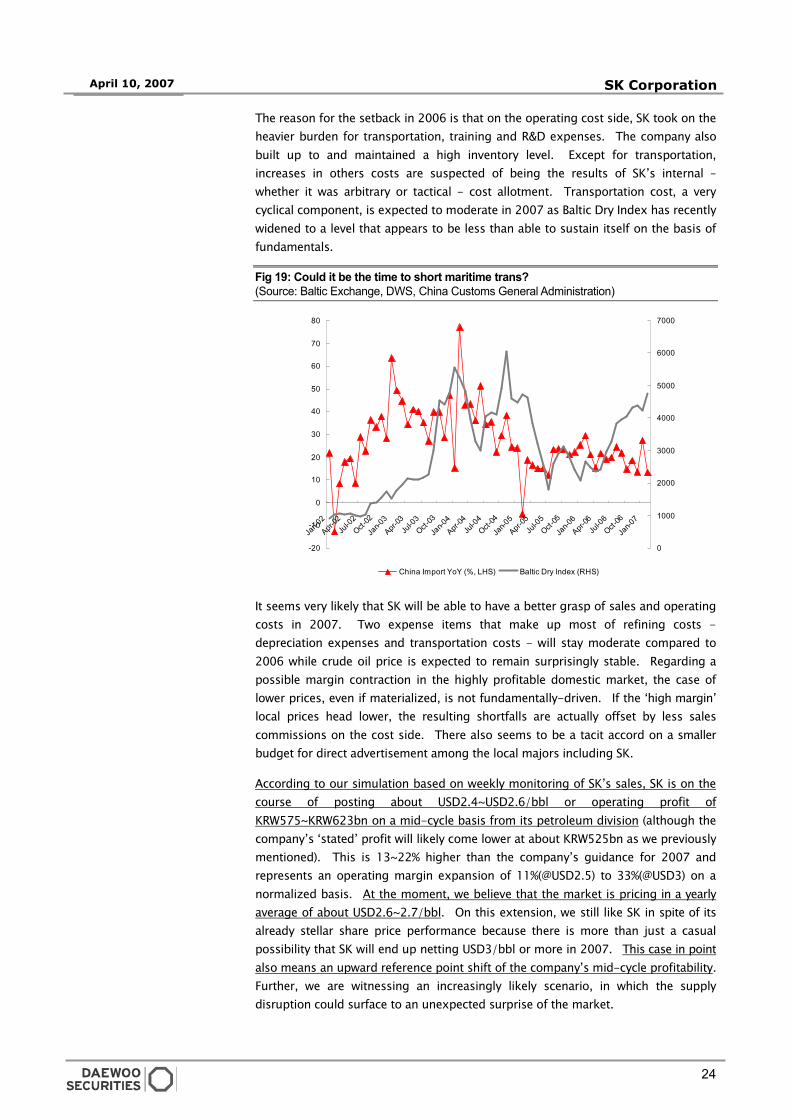
24
April 10, 2007 SK Corporation
-20
-10
0
10
20
30
40
50
60
70
80
Jan-0
2Apr-0
2Ju
l-02Oct-
02
Jan-0
3Apr-
03Ju
l-03Oct-
03
Jan-0
4Apr-
04Ju
l-04Oct-
04
Jan-0
5Apr-
05Ju
l-05Oct-
05
Jan-0
6Apr-
06Ju
l-06Oct-
06
Jan-0
7
0
1000
2000
3000
4000
5000
6000
7000
China Import YoY (%, LHS) Baltic Dry Index (RHS)
The reason for the setback in 2006 is that on the operating cost side, SK took on the
heavier burden for transportation, training and R&D expenses. The company also
built up to and maintained a high inventory level. Except for transportation,
increases in others costs are suspected of being the results of SK’s internal –
whether it was arbitrary or tactical - cost allotment. Transportation cost, a very
cyclical component, is expected to moderate in 2007 as Baltic Dry Index has recently
widened to a level that appears to be less than able to sustain itself on the basis of
fundamentals.
Fig 19: Could it be the time to short maritime trans?
(Source: Baltic Exchange, DWS, China Customs General Administration)
It seems very likely that SK will be able to have a better grasp of sales and operating
costs in 2007. Two expense items that make up most of refining costs -
depreciation expenses and transportation costs - will stay moderate compared to
2006 while crude oil price is expected to remain surprisingly stable. Regarding a
possible margin contraction in the highly profitable domestic market, the case of
lower prices, even if materialized, is not fundamentally-driven. If the ‘high margin’
local prices head lower, the resulting shortfalls are actually offset by less sales
commissions on the cost side. There also seems to be a tacit accord on a smaller
budget for direct advertisement among the local majors including SK.
According to our simulation based on weekly monitoring of SK’s sales, SK is on the
course of posting about USD2.4~USD2.6/bbl or operating profit of
KRW575~KRW623bn on a mid-cycle basis from its petroleum division (although the
company’s ‘stated’ profit will likely come lower at about KRW525bn as we previously
mentioned). This is 13~22% higher than the company’s guidance for 2007 and
represents an operating margin expansion of 11%(@USD2.5) to 33%(@USD3) on a
normalized basis. At the moment, we believe that the market is pricing in a yearly
average of about USD2.6~2.7/bbl. On this extension, we still like SK in spite of its
already stellar share price performance because there is more than just a casual
possibility that SK will end up netting USD3/bbl or more in 2007. This case in point
also means an upward reference point shift of the company’s mid-cycle profitability.
Further, we are witnessing an increasingly likely scenario, in which the supply
disruption could surface to an unexpected surprise of the market.
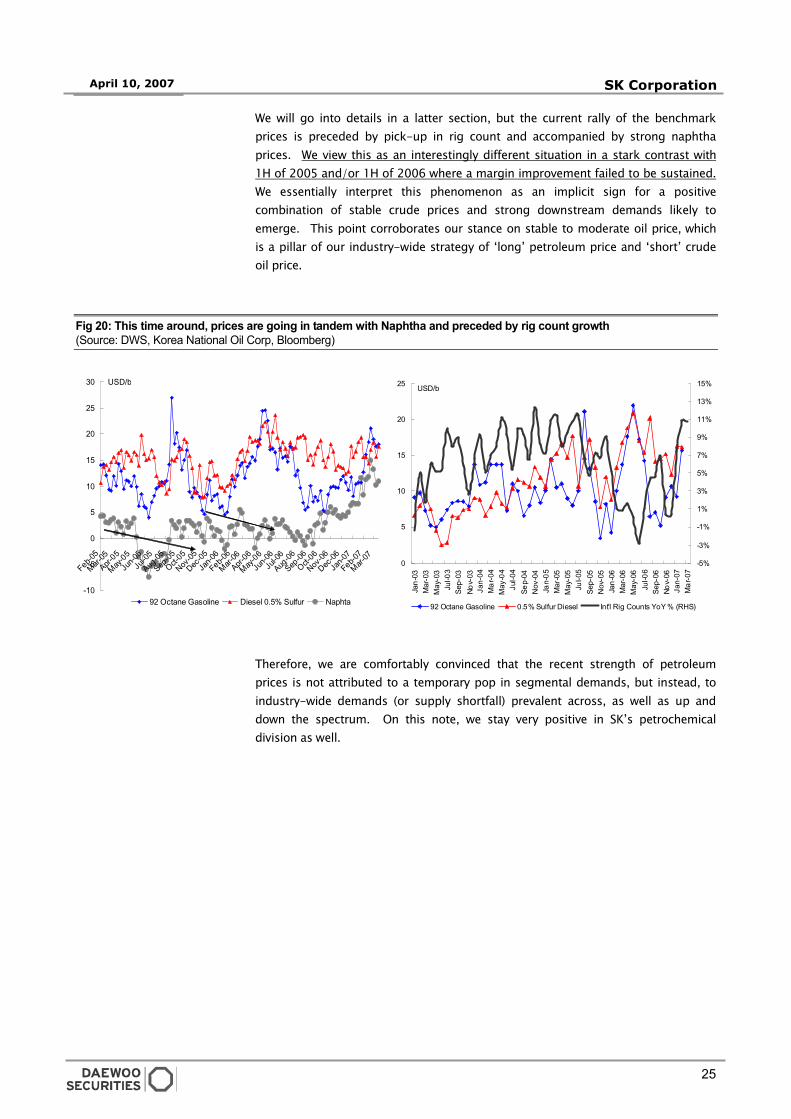
25
April 10, 2007 SK Corporation
-10
-5
0
5
10
15
20
25
30
Feb-05
Mar-05Apr-
05
May-05
Jun-0
5Ju
l-05
Aug-05
Sep-05
Oct-05
Nov-05
Dec-05
Jan-0
6
Feb-06
Mar-06Apr-
06
May-06Ju
n-06Ju
l-06
Aug-06
Sep-06
Oct-06
Nov-06
Dec-06
Jan-0
7
Feb-07
Mar-07
92 Octane Gasoline Diesel 0.5% Sulfur Naphta
USD/b
0
5
10
15
20
25
Jan-
03M
ar-0
3M
ay-0
3Ju
l-03
Sep-
03No
v-03
Jan-
04M
ar-0
4M
ay-0
4Ju
l-04
Sep-
04N
ov-0
4Ja
n-05
Mar
-05
May
-05
Jul-0
5Se
p-05
Nov
-05
Jan-
06M
ar-0
6M
ay-0
6Ju
l-06
Sep-
06No
v-06
Jan-
07M
ar-0
7
-5%
-3%
-1%
1%
3%
5%
7%
9%
11%
13%
15%
92 Octane Gasoline 0.5% Sulfur Diesel Int'l Rig Counts YoY % (RHS)
USD/b
We will go into details in a latter section, but the current rally of the benchmark
prices is preceded by pick-up in rig count and accompanied by strong naphtha
prices. We view this as an interestingly different situation in a stark contrast with
1H of 2005 and/or 1H of 2006 where a margin improvement failed to be sustained.
We essentially interpret this phenomenon as an implicit sign for a positive
combination of stable crude prices and strong downstream demands likely to
emerge. This point corroborates our stance on stable to moderate oil price, which
is a pillar of our industry-wide strategy of ‘long’ petroleum price and ‘short’ crude
oil price.
Fig 20: This time around, prices are going in tandem with Naphtha and preceded by rig count growth
(Source: DWS, Korea National Oil Corp, Bloomberg)
Therefore, we are comfortably convinced that the recent strength of petroleum
prices is not attributed to a temporary pop in segmental demands, but instead, to
industry-wide demands (or supply shortfall) prevalent across, as well as up and
down the spectrum. On this note, we stay very positive in SK’s petrochemical
division as well.
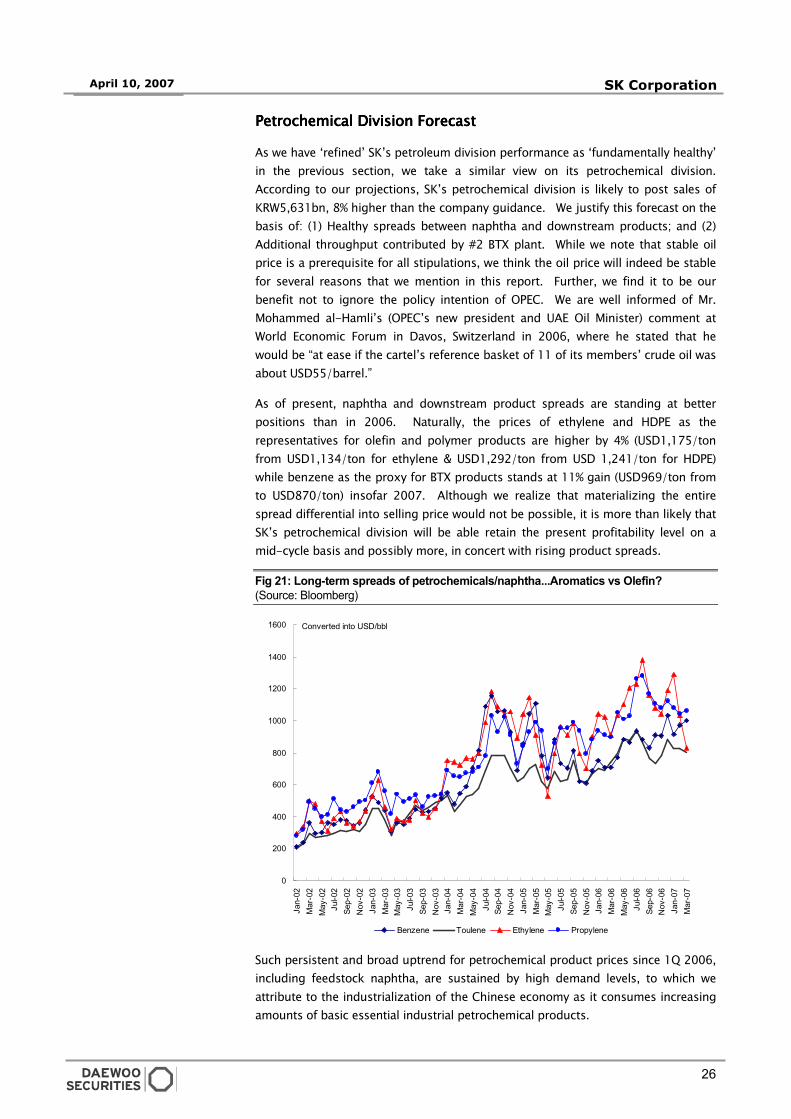
26
April 10, 2007 SK Corporation
0
200
400
600
800
1000
1200
1400
1600
Jan-
02M
ar-0
2M
ay-0
2Ju
l-02
Sep-
02N
ov-0
2Ja
n-03
Mar
-03
May
-03
Jul-0
3Se
p-03
Nov
-03
Jan-
04M
ar-0
4M
ay-0
4Ju
l-04
Sep-
04N
ov-0
4Ja
n-05
Mar
-05
May
-05
Jul-0
5Se
p-05
Nov
-05
Jan-
06M
ar-0
6M
ay-0
6Ju
l-06
Sep-
06N
ov-0
6Ja
n-07
Mar
-07
Benzene Toulene Ethylene Propylene
Converted into USD/bbl
PetrochemicalPetrochemicalPetrochemicalPetrochemical Division Forecast Division Forecast Division Forecast Division Forecast
As we have ‘refined’ SK’s petroleum division performance as ‘fundamentally healthy’
in the previous section, we take a similar view on its petrochemical division.
According to our projections, SK’s petrochemical division is likely to post sales of
KRW5,631bn, 8% higher than the company guidance. We justify this forecast on the
basis of: (1) Healthy spreads between naphtha and downstream products; and (2)
Additional throughput contributed by #2 BTX plant. While we note that stable oil
price is a prerequisite for all stipulations, we think the oil price will indeed be stable
for several reasons that we mention in this report. Further, we find it to be our
benefit not to ignore the policy intention of OPEC. We are well informed of Mr.
Mohammed al-Hamli’s (OPEC’s new president and UAE Oil Minister) comment at
World Economic Forum in Davos, Switzerland in 2006, where he stated that he
would be “at ease if the cartel’s reference basket of 11 of its members’ crude oil was
about USD55/barrel.”
As of present, naphtha and downstream product spreads are standing at better
positions than in 2006. Naturally, the prices of ethylene and HDPE as the
representatives for olefin and polymer products are higher by 4% (USD1,175/ton
from USD1,134/ton for ethylene & USD1,292/ton from USD 1,241/ton for HDPE)
while benzene as the proxy for BTX products stands at 11% gain (USD969/ton from
to USD870/ton) insofar 2007. Although we realize that materializing the entire
spread differential into selling price would not be possible, it is more than likely that
SK’s petrochemical division will be able retain the present profitability level on a
mid-cycle basis and possibly more, in concert with rising product spreads.
Fig 21: Long-term spreads of petrochemicals/naphtha...Aromatics vs Olefin?
(Source: Bloomberg)
Such persistent and broad uptrend for petrochemical product prices since 1Q 2006,
including feedstock naphtha, are sustained by high demand levels, to which we
attribute to the industrialization of the Chinese economy as it consumes increasing
amounts of basic essential industrial petrochemical products.
27
April 10, 2007 SK Corporation
Apart from China-induced factor, there is an internal factor for SK to bring in
additional revenue. The KRW82bn investment project raised SK’s BTX production
capacity by 61% from 1,080k ton/year to 1,737k ton/year, which began to
contribute commercially in Aug. 2006. According to our analysis, it is possible that,
in 2007, the #2 aromatic reformer could generate additional revenue by as much as
KRW404bn, up 42% from 2006. Though SK’s other petrochemical products may
not show as strong of a performance as 2006, SK’s #2 aromatic reformer will be
more than sufficient to serve as a growth factor for the petrochemical division.
Going forward into 2008, we expect petrochemical product spreads to remain at
similar levels to those of 2007; consequently, we believe SK’s petrochemical division
will post similar results in 2008. The basis of our 2008 projection lies in the
uncertainty for Iranian projects. Due to the geopolitical situation surrounding Iran,
coupled with the ill state of the county’s national finance, we think unlikely that
Iranian projects will proceed and be completed as previously announced. Without
Iranian projects, it is plausible that Chinese and Indian consumption will be ample
enough to take up the additional output from Thai and Taiwanese projects as China
alone is still said to be under-supplied by 13,200k tons by 2008.
Fig 22: Announced Ethylene Plant Projects
(Source: Ministry of Economy, Trade and Industry of Japan, DWS)
(Unit: kton/year)
CompanyCompanyCompanyCompany LocationLocationLocationLocation Capacity (kton)Capacity (kton)Capacity (kton)Capacity (kton) Original ScheduleOriginal ScheduleOriginal ScheduleOriginal Schedule Revised ScheduleRevised ScheduleRevised ScheduleRevised ScheduleMarun PC Iran 1,100 2006 4Q During 2008
IRPC Thailand 350 2007 1Q 2007 2QArya Sasol Iran 1,000 2007 2Q 2007 2Q
Jam PC Iran 1,320 2007 3Q During 2008Formosa Pet Taiwan 1,200 2007 3Q 2007 2Q
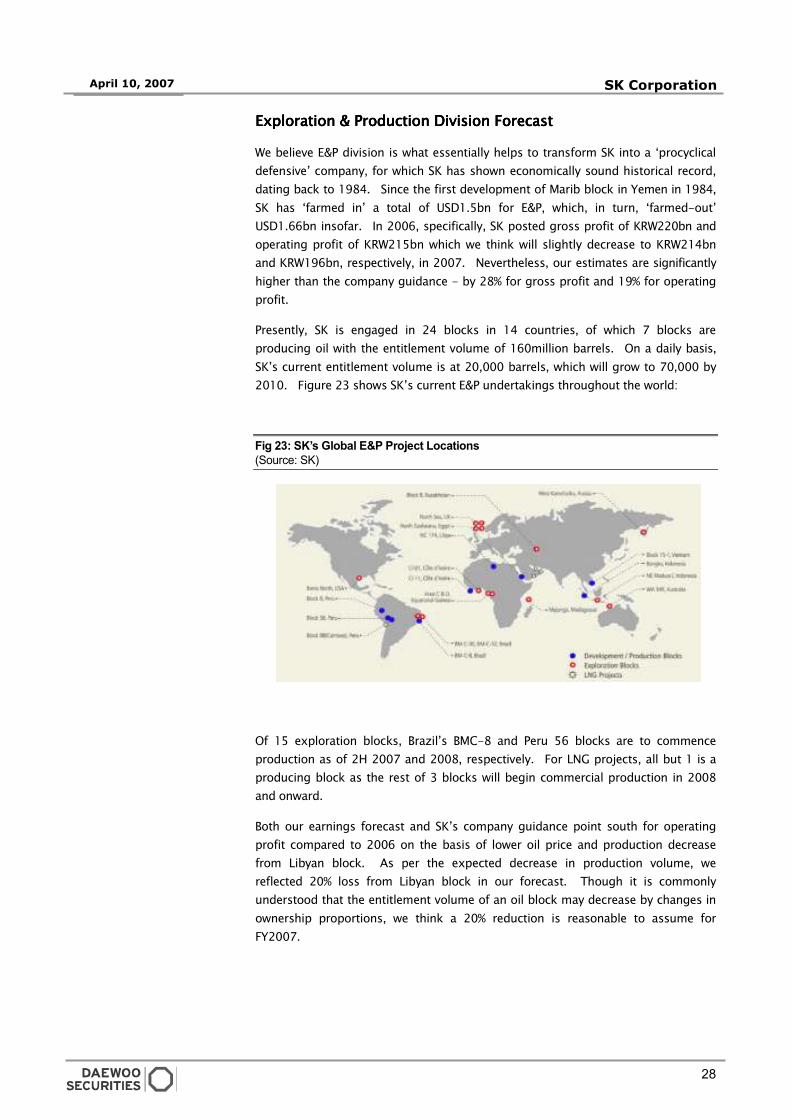
28
April 10, 2007 SK Corporation
Exploration & ProductionExploration & ProductionExploration & ProductionExploration & Production Division Forecast Division Forecast Division Forecast Division Forecast
We believe E&P division is what essentially helps to transform SK into a ‘procyclical
defensive’ company, for which SK has shown economically sound historical record,
dating back to 1984. Since the first development of Marib block in Yemen in 1984,
SK has ‘farmed in’ a total of USD1.5bn for E&P, which, in turn, ‘farmed-out’
USD1.66bn insofar. In 2006, specifically, SK posted gross profit of KRW220bn and
operating profit of KRW215bn which we think will slightly decrease to KRW214bn
and KRW196bn, respectively, in 2007. Nevertheless, our estimates are significantly
higher than the company guidance - by 28% for gross profit and 19% for operating
profit.
Presently, SK is engaged in 24 blocks in 14 countries, of which 7 blocks are
producing oil with the entitlement volume of 160million barrels. On a daily basis,
SK’s current entitlement volume is at 20,000 barrels, which will grow to 70,000 by
2010. Figure 23 shows SK’s current E&P undertakings throughout the world:
Fig 23: SK’s Global E&P Project Locations
(Source: SK)
Of 15 exploration blocks, Brazil’s BMC-8 and Peru 56 blocks are to commence
production as of 2H 2007 and 2008, respectively. For LNG projects, all but 1 is a
producing block as the rest of 3 blocks will begin commercial production in 2008
and onward.
Both our earnings forecast and SK’s company guidance point south for operating
profit compared to 2006 on the basis of lower oil price and production decrease
from Libyan block. As per the expected decrease in production volume, we
reflected 20% loss from Libyan block in our forecast. Though it is commonly
understood that the entitlement volume of an oil block may decrease by changes in
ownership proportions, we think a 20% reduction is reasonable to assume for
FY2007.
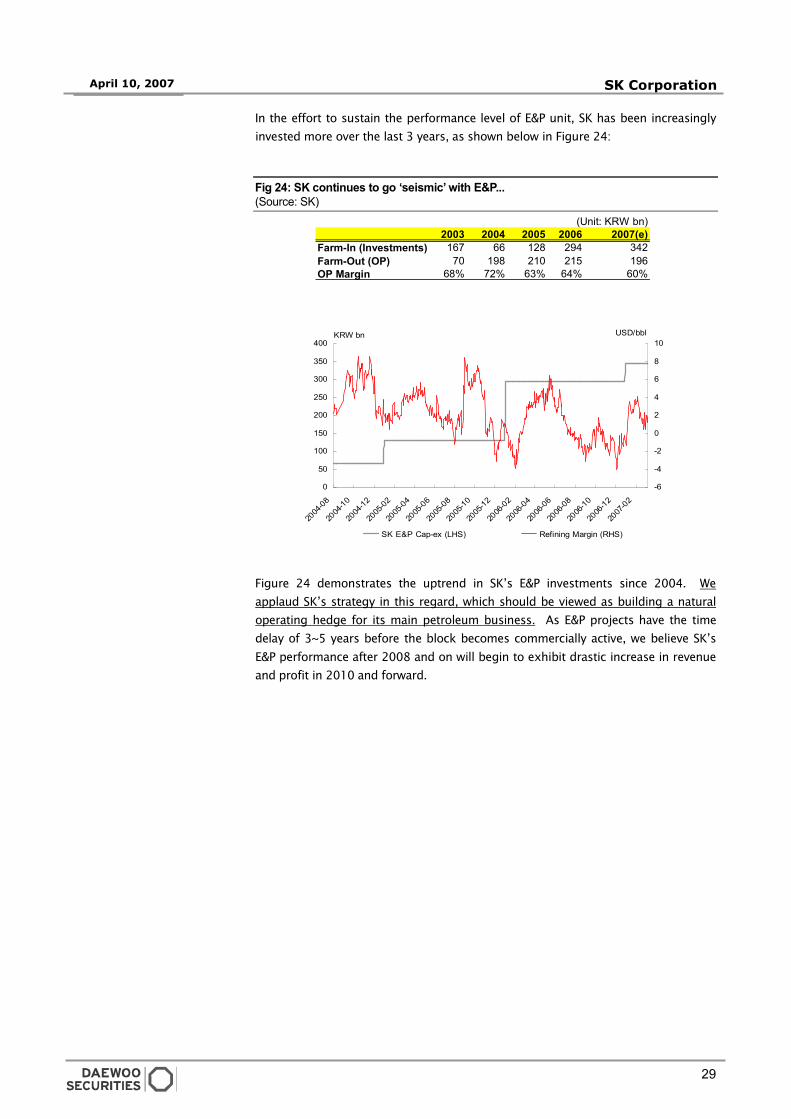
29
April 10, 2007 SK Corporation
0
50
100
150
200
250
300
350
400
2004
-08
2004
-10
2004
-12
2005
-02
2005
-04
2005
-06
2005
-08
2005
-10
2005
-12
2006
-02
2006
-04
2006
-06
2006
-08
2006
-10
2006
-12
2007
-02
KRW bn
-6
-4
-2
0
2
4
6
8
10USD/bbl
SK E&P Cap-ex (LHS) Refining Margin (RHS)
In the effort to sustain the performance level of E&P unit, SK has been increasingly
invested more over the last 3 years, as shown below in Figure 24:
Fig 24: SK continues to go ‘seismic’ with E&P...
(Source: SK)
Figure 24 demonstrates the uptrend in SK’s E&P investments since 2004. We
applaud SK’s strategy in this regard, which should be viewed as building a natural
operating hedge for its main petroleum business. As E&P projects have the time
delay of 3~5 years before the block becomes commercially active, we believe SK’s
E&P performance after 2008 and on will begin to exhibit drastic increase in revenue
and profit in 2010 and forward.
(Unit: KRW bn)
2003 2004 2005 2006 2007(e)
Farm-In (Investments) 167 66 128 294 342
Farm-Out (OP) 70 198 210 215 196
OP Margin 68% 72% 63% 64% 60%
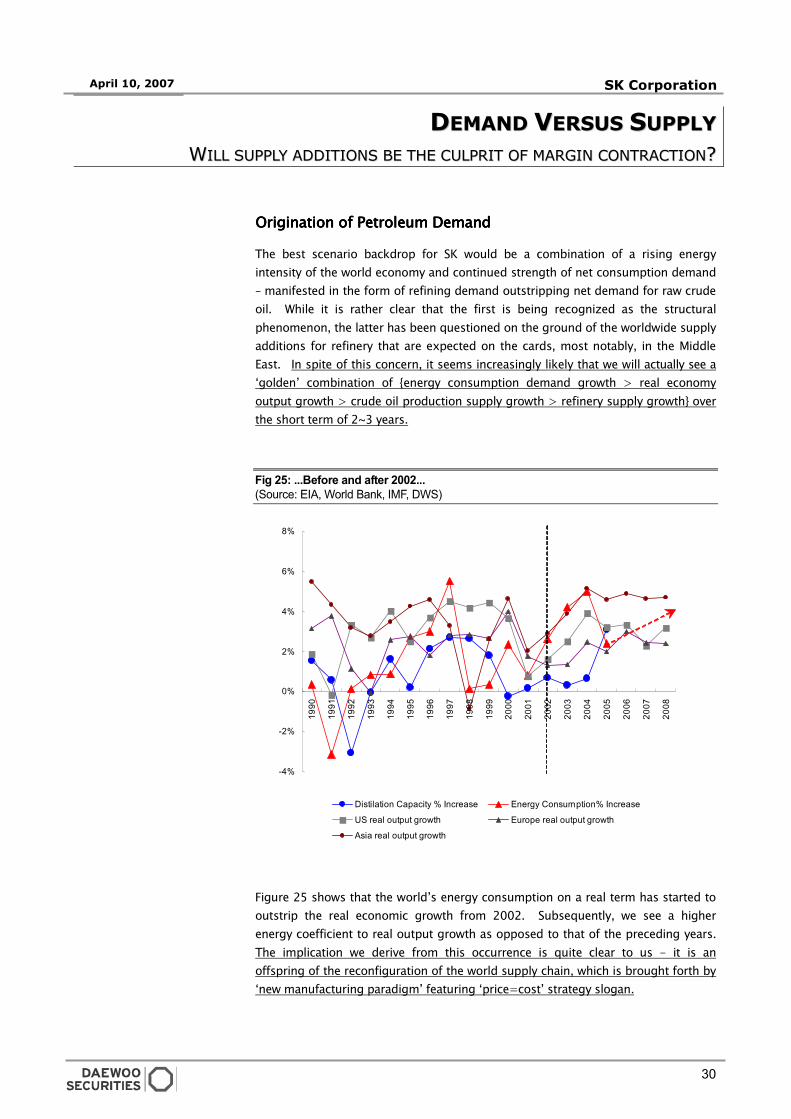
30
April 10, 2007 SK Corporation
-4%
-2%
0%
2%
4%
6%
8%
1990
1991
1992
1993
1994
1995
1996
1997
1998
1999
2000
2001
2002
2003
2004
2005
2006
2007
2008
Distilation Capacity % Increase Energy Consumption% Increase
US real output growth Europe real output growth
Asia real output growth
DDEEMMAANNDD VVEERRSSUUSS SSUUPPPPLLYY
WWIILLLL SSUUPPPPLLYY AADDDDIITTIIOONNSS BBEE TTHHEE CCUULLPPRRIITT OOFF MMAARRGGIINN CCOONNTTRRAACCTTIIOONN??
Origination of Petroleum DemandOrigination of Petroleum DemandOrigination of Petroleum DemandOrigination of Petroleum Demand
The best scenario backdrop for SK would be a combination of a rising energy
intensity of the world economy and continued strength of net consumption demand
– manifested in the form of refining demand outstripping net demand for raw crude
oil. While it is rather clear that the first is being recognized as the structural
phenomenon, the latter has been questioned on the ground of the worldwide supply
additions for refinery that are expected on the cards, most notably, in the Middle
East. In spite of this concern, it seems increasingly likely that we will actually see a
‘golden’ combination of {energy consumption demand growth > real economy
output growth > crude oil production supply growth > refinery supply growth} over
the short term of 2~3 years.
Fig 25: ...Before and after 2002...
(Source: EIA, World Bank, IMF, DWS)
Figure 25 shows that the world’s energy consumption on a real term has started to
outstrip the real economic growth from 2002. Subsequently, we see a higher
energy coefficient to real output growth as opposed to that of the preceding years.
The implication we derive from this occurrence is quite clear to us - it is an
offspring of the reconfiguration of the world supply chain, which is brought forth by
‘new manufacturing paradigm’ featuring ‘price=cost’ strategy slogan.
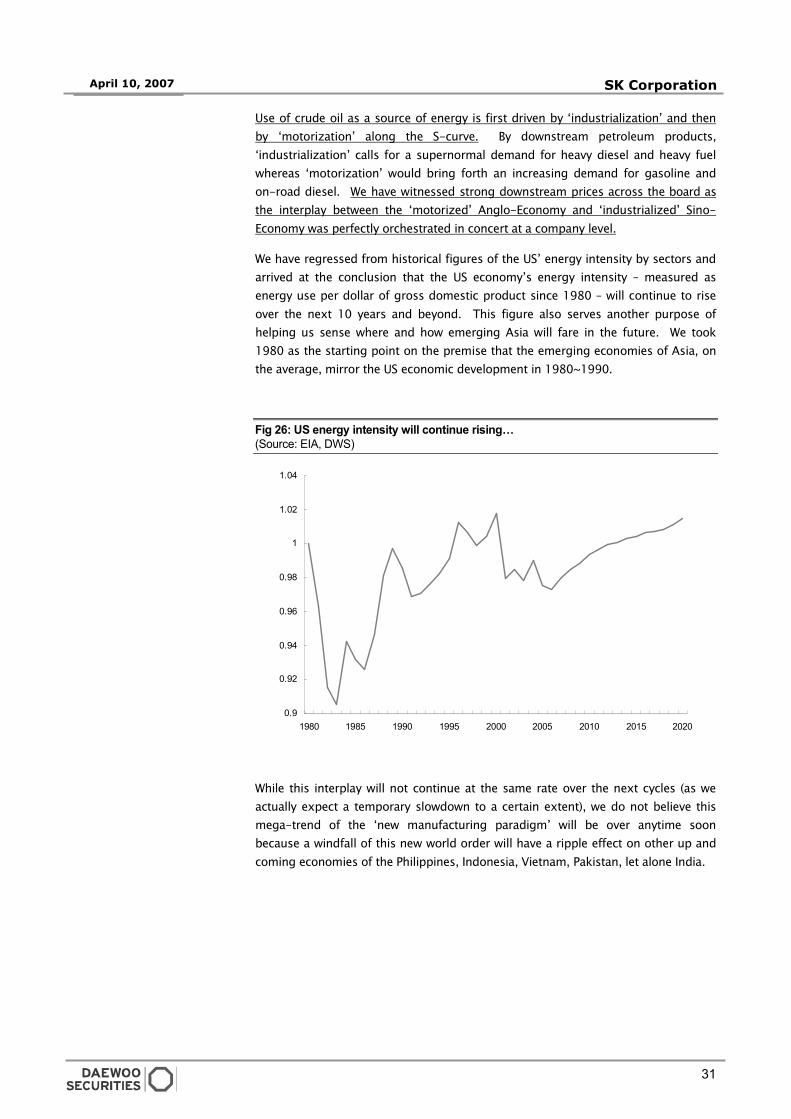
31
April 10, 2007 SK Corporation
0.9
0.92
0.94
0.96
0.98
1
1.02
1.04
1980 1985 1990 1995 2000 2005 2010 2015 2020
Use of crude oil as a source of energy is first driven by ‘industrialization’ and then
by ‘motorization’ along the S-curve. By downstream petroleum products,
‘industrialization’ calls for a supernormal demand for heavy diesel and heavy fuel
whereas ‘motorization’ would bring forth an increasing demand for gasoline and
on-road diesel. We have witnessed strong downstream prices across the board as
the interplay between the ‘motorized’ Anglo-Economy and ‘industrialized’ Sino-
Economy was perfectly orchestrated in concert at a company level.
We have regressed from historical figures of the US’ energy intensity by sectors and
arrived at the conclusion that the US economy’s energy intensity – measured as
energy use per dollar of gross domestic product since 1980 – will continue to rise
over the next 10 years and beyond. This figure also serves another purpose of
helping us sense where and how emerging Asia will fare in the future. We took
1980 as the starting point on the premise that the emerging economies of Asia, on
the average, mirror the US economic development in 1980~1990.
Fig 26: US energy intensity will continue rising…
(Source: EIA, DWS)
While this interplay will not continue at the same rate over the next cycles (as we
actually expect a temporary slowdown to a certain extent), we do not believe this
mega-trend of the ‘new manufacturing paradigm’ will be over anytime soon
because a windfall of this new world order will have a ripple effect on other up and
coming economies of the Philippines, Indonesia, Vietnam, Pakistan, let alone India.
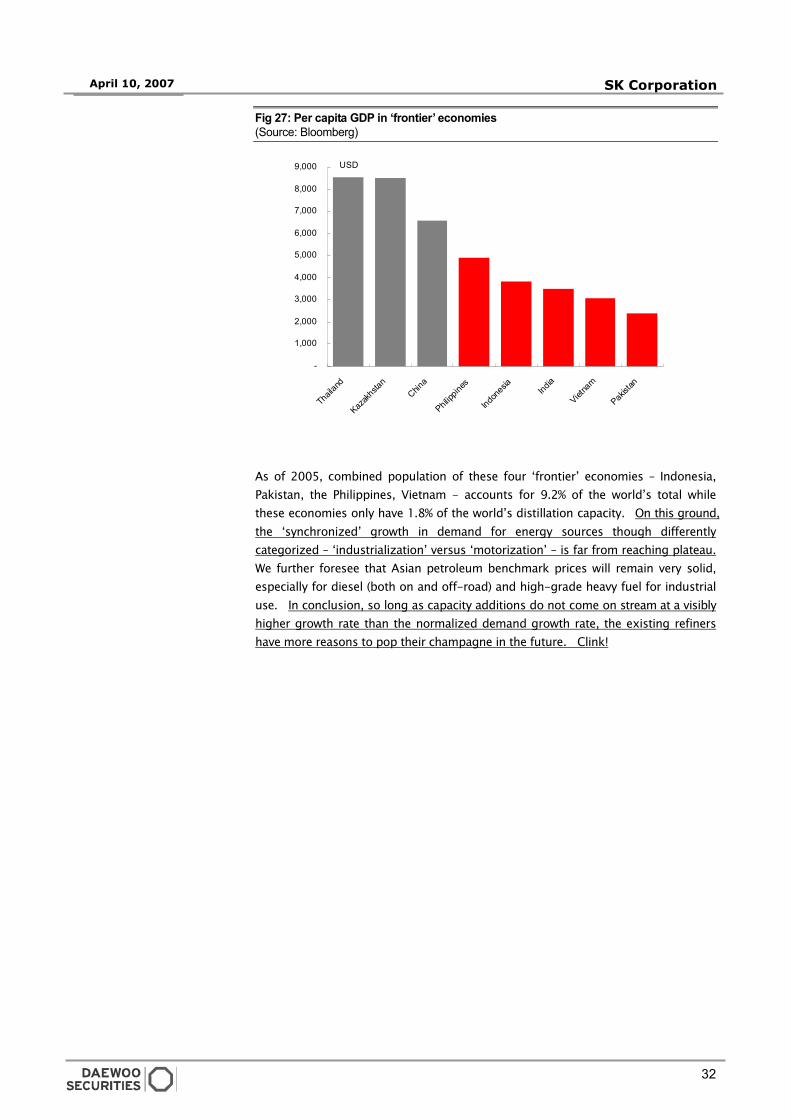
32
April 10, 2007 SK Corporation
-
1,000
2,000
3,000
4,000
5,000
6,000
7,000
8,000
9,000
Thailand
Kazakhstan
China
Philippines
Indonesia
India
Vietnam
Pakistan
USD
Emerging markets to watch
Fig 27: Per capita GDP in ‘frontier’ economies
(Source: Bloomberg)
As of 2005, combined population of these four ‘frontier’ economies – Indonesia,
Pakistan, the Philippines, Vietnam - accounts for 9.2% of the world’s total while
these economies only have 1.8% of the world’s distillation capacity. On this ground,
the ‘synchronized’ growth in demand for energy sources though differently
categorized – ‘industrialization’ versus ‘motorization’ – is far from reaching plateau.
We further foresee that Asian petroleum benchmark prices will remain very solid,
especially for diesel (both on and off-road) and high-grade heavy fuel for industrial
use. In conclusion, so long as capacity additions do not come on stream at a visibly
higher growth rate than the normalized demand growth rate, the existing refiners
have more reasons to pop their champagne in the future. Clink!
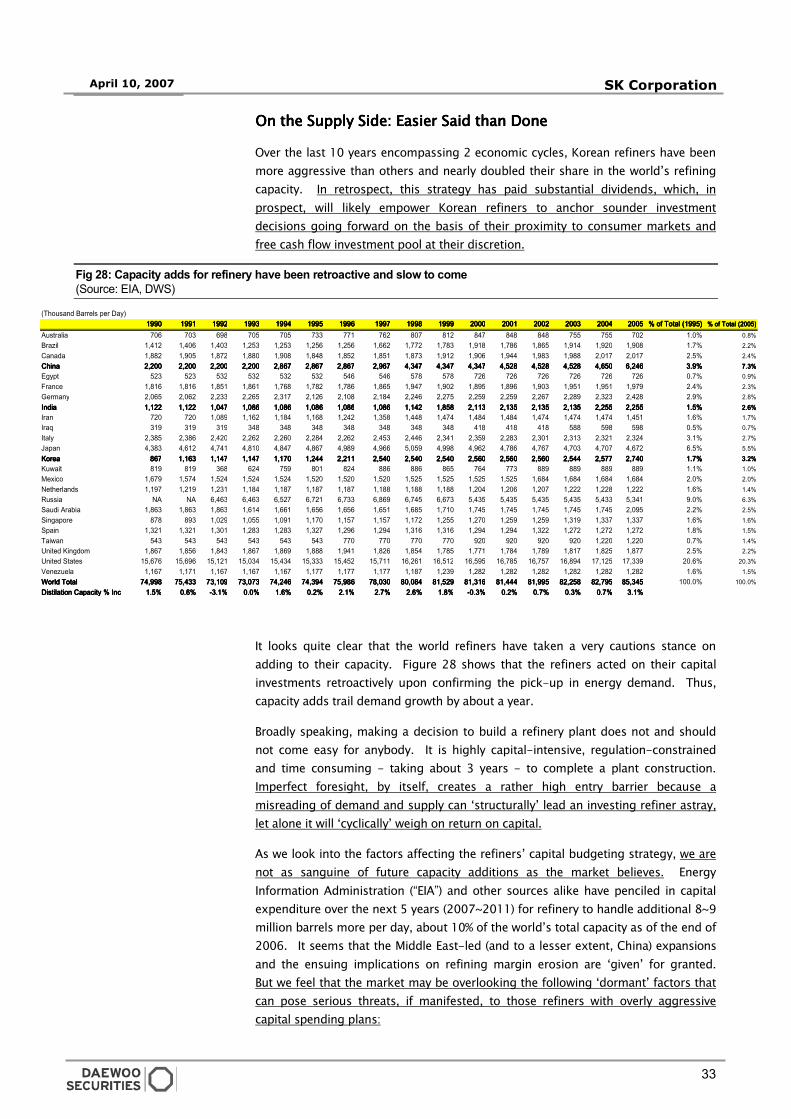
33
April 10, 2007 SK Corporation
(Thousand Barrels per Day) 1990199019901990 1991199119911991 1992199219921992 1993199319931993 1994199419941994 1995199519951995 1996199619961996 1997199719971997 1998199819981998 1999199919991999 2000200020002000 2001200120012001 2002200220022002 2003200320032003 2004200420042004 2005200520052005 % of Total (1995)% of Total (1995)% of Total (1995)% of Total (1995) % of Total (2005)% of Total (2005)% of Total (2005)% of Total (2005)
Australia 706 703 698 705 705 733 771 762 807 812 847 848 848 755 755 702 1.0% 0.8%Brazil 1,412 1,406 1,403 1,253 1,253 1,256 1,256 1,662 1,772 1,783 1,918 1,786 1,865 1,914 1,920 1,908 1.7% 2.2%Canada 1,882 1,905 1,872 1,880 1,908 1,848 1,852 1,851 1,873 1,912 1,906 1,944 1,983 1,988 2,017 2,017 2.5% 2.4%China China China China 2,2002,2002,2002,200 2,2002,2002,2002,200 2,2002,2002,2002,200 2,2002,2002,2002,200 2,8672,8672,8672,867 2,8672,8672,8672,867 2,8672,8672,8672,867 2,9672,9672,9672,967 4,3474,3474,3474,347 4,3474,3474,3474,347 4,3474,3474,3474,347 4,5284,5284,5284,528 4,5284,5284,5284,528 4,5284,5284,5284,528 4,6504,6504,6504,650 6,2466,2466,2466,246 3.9%3.9%3.9%3.9% 7.3%7.3%7.3%7.3%Egypt 523 523 532 532 532 532 546 546 578 578 726 726 726 726 726 726 0.7% 0.9%France 1,816 1,816 1,851 1,861 1,768 1,782 1,786 1,865 1,947 1,902 1,895 1,896 1,903 1,951 1,951 1,979 2.4% 2.3%Germany 2,065 2,062 2,233 2,265 2,317 2,126 2,108 2,184 2,246 2,275 2,259 2,259 2,267 2,289 2,323 2,428 2.9% 2.8%India India India India 1,1221,1221,1221,122 1,1221,1221,1221,122 1,0471,0471,0471,047 1,0861,0861,0861,086 1,0861,0861,0861,086 1,0861,0861,0861,086 1,0861,0861,0861,086 1,0861,0861,0861,086 1,1421,1421,1421,142 1,8581,8581,8581,858 2,1132,1132,1132,113 2,1352,1352,1352,135 2,1352,1352,1352,135 2,1352,1352,1352,135 2,2552,2552,2552,255 2,2552,2552,2552,255 1.5%1.5%1.5%1.5% 2.6%2.6%2.6%2.6%Iran 720 720 1,089 1,162 1,184 1,168 1,242 1,358 1,448 1,474 1,484 1,484 1,474 1,474 1,474 1,451 1.6% 1.7%Iraq 319 319 319 348 348 348 348 348 348 348 418 418 418 588 598 598 0.5% 0.7%Italy 2,385 2,386 2,420 2,262 2,260 2,284 2,262 2,453 2,446 2,341 2,359 2,283 2,301 2,313 2,321 2,324 3.1% 2.7%Japan 4,383 4,612 4,741 4,810 4,847 4,867 4,989 4,966 5,059 4,998 4,962 4,786 4,767 4,703 4,707 4,672 6.5% 5.5%KoreaKoreaKoreaKorea 867867867867 1,1631,1631,1631,163 1,1471,1471,1471,147 1,1471,1471,1471,147 1,1701,1701,1701,170 1,2441,2441,2441,244 2,2112,2112,2112,211 2,5402,5402,5402,540 2,5402,5402,5402,540 2,5402,5402,5402,540 2,5602,5602,5602,560 2,5602,5602,5602,560 2,5602,5602,5602,560 2,5442,5442,5442,544 2,5772,5772,5772,577 2,7402,7402,7402,740 1.7%1.7%1.7%1.7% 3.2%3.2%3.2%3.2%Kuwait 819 819 368 624 759 801 824 886 886 865 764 773 889 889 889 889 1.1% 1.0%Mexico 1,679 1,574 1,524 1,524 1,524 1,520 1,520 1,520 1,525 1,525 1,525 1,525 1,684 1,684 1,684 1,684 2.0% 2.0%Netherlands 1,197 1,219 1,231 1,184 1,187 1,187 1,187 1,188 1,188 1,188 1,204 1,206 1,207 1,222 1,228 1,222 1.6% 1.4%Russia NA NA 6,463 6,463 6,527 6,721 6,733 6,869 6,745 6,673 5,435 5,435 5,435 5,435 5,433 5,341 9.0% 6.3%Saudi Arabia 1,863 1,863 1,863 1,614 1,661 1,656 1,656 1,651 1,685 1,710 1,745 1,745 1,745 1,745 1,745 2,095 2.2% 2.5%Singapore 878 893 1,029 1,055 1,091 1,170 1,157 1,157 1,172 1,255 1,270 1,259 1,259 1,319 1,337 1,337 1.6% 1.6%Spain 1,321 1,321 1,301 1,283 1,283 1,327 1,296 1,294 1,316 1,316 1,294 1,294 1,322 1,272 1,272 1,272 1.8% 1.5%Taiwan 543 543 543 543 543 543 770 770 770 770 920 920 920 920 1,220 1,220 0.7% 1.4%United Kingdom 1,867 1,856 1,843 1,867 1,869 1,888 1,941 1,826 1,854 1,785 1,771 1,784 1,789 1,817 1,825 1,877 2.5% 2.2%United States 15,676 15,696 15,121 15,034 15,434 15,333 15,452 15,711 16,261 16,512 16,595 16,785 16,757 16,894 17,125 17,339 20.6% 20.3%Venezuela 1,167 1,171 1,167 1,167 1,167 1,177 1,177 1,177 1,187 1,239 1,282 1,282 1,282 1,282 1,282 1,282 1.6% 1.5%World Total World Total World Total World Total 74,99874,99874,99874,998 75,43375,43375,43375,433 73,10973,10973,10973,109 73,07373,07373,07373,073 74,24674,24674,24674,246 74,39474,39474,39474,394 75,98675,98675,98675,986 78,03078,03078,03078,030 80,08480,08480,08480,084 81,52981,52981,52981,529 81,31681,31681,31681,316 81,44481,44481,44481,444 81,99581,99581,99581,995 82,25882,25882,25882,258 82,79582,79582,79582,795 85,34585,34585,34585,345 100.0% 100.0%Distilation Capacity % IncDistilation Capacity % IncDistilation Capacity % IncDistilation Capacity % Inc 1.5%1.5%1.5%1.5% 0.6%0.6%0.6%0.6% -3.1%-3.1%-3.1%-3.1% 0.0%0.0%0.0%0.0% 1.6%1.6%1.6%1.6% 0.2%0.2%0.2%0.2% 2.1%2.1%2.1%2.1% 2.7%2.7%2.7%2.7% 2.6%2.6%2.6%2.6% 1.8%1.8%1.8%1.8% -0.3%-0.3%-0.3%-0.3% 0.2%0.2%0.2%0.2% 0.7%0.7%0.7%0.7% 0.3%0.3%0.3%0.3% 0.7%0.7%0.7%0.7% 3.1%3.1%3.1%3.1%
On the Supply Side: On the Supply Side: On the Supply Side: On the Supply Side: EasierEasierEasierEasier SSSSaid than aid than aid than aid than DDDDoneoneoneone
Over the last 10 years encompassing 2 economic cycles, Korean refiners have been
more aggressive than others and nearly doubled their share in the world’s refining
capacity. In retrospect, this strategy has paid substantial dividends, which, in
prospect, will likely empower Korean refiners to anchor sounder investment
decisions going forward on the basis of their proximity to consumer markets and
free cash flow investment pool at their discretion.
Fig 28: Capacity adds for refinery have been retroactive and slow to come
(Source: EIA, DWS)
It looks quite clear that the world refiners have taken a very cautions stance on
adding to their capacity. Figure 28 shows that the refiners acted on their capital
investments retroactively upon confirming the pick-up in energy demand. Thus,
capacity adds trail demand growth by about a year.
Broadly speaking, making a decision to build a refinery plant does not and should
not come easy for anybody. It is highly capital-intensive, regulation-constrained
and time consuming - taking about 3 years - to complete a plant construction.
Imperfect foresight, by itself, creates a rather high entry barrier because a
misreading of demand and supply can ‘structurally’ lead an investing refiner astray,
let alone it will ‘cyclically’ weigh on return on capital.
As we look into the factors affecting the refiners’ capital budgeting strategy, we are
not as sanguine of future capacity additions as the market believes. Energy
Information Administration (“EIA”) and other sources alike have penciled in capital
expenditure over the next 5 years (2007~2011) for refinery to handle additional 8~9
million barrels more per day, about 10% of the world’s total capacity as of the end of
2006. It seems that the Middle East-led (and to a lesser extent, China) expansions
and the ensuing implications on refining margin erosion are ‘given’ for granted.
But we feel that the market may be overlooking the following ‘dormant’ factors that
can pose serious threats, if manifested, to those refiners with overly aggressive
capital spending plans:
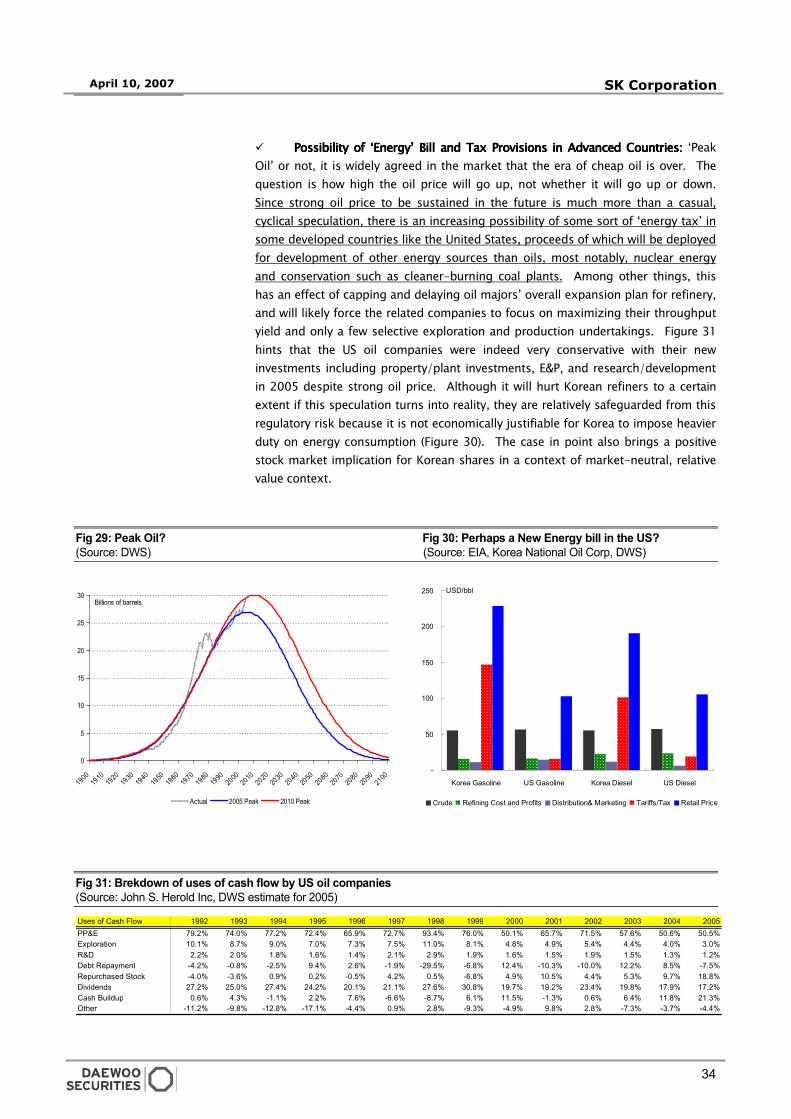
34
April 10, 2007 SK Corporation
Uses of Cash Flow 1992 1993 1994 1995 1996 1997 1998 1999 2000 2001 2002 2003 2004 2005PP&E 79.2% 74.0% 77.2% 72.4% 65.9% 72.7% 93.4% 76.0% 50.1% 65.7% 71.5% 57.6% 50.6% 50.5%Exploration 10.1% 8.7% 9.0% 7.0% 7.3% 7.5% 11.0% 8.1% 4.8% 4.9% 5.4% 4.4% 4.0% 3.0%R&D 2.2% 2.0% 1.8% 1.6% 1.4% 2.1% 2.9% 1.9% 1.6% 1.5% 1.9% 1.5% 1.3% 1.2%Debt Repayment -4.2% -0.8% -2.5% 9.4% 2.6% -1.9% -29.5% -6.8% 12.4% -10.3% -10.0% 12.2% 8.5% -7.5%Repurchased Stock -4.0% -3.6% 0.9% 0.2% -0.5% 4.2% 0.5% -6.8% 4.9% 10.5% 4.4% 5.3% 9.7% 18.8%Dividends 27.2% 25.0% 27.4% 24.2% 20.1% 21.1% 27.6% 30.8% 19.7% 19.2% 23.4% 19.8% 17.9% 17.2%Cash Buildup 0.6% 4.3% -1.1% 2.2% 7.6% -6.6% -8.7% 6.1% 11.5% -1.3% 0.6% 6.4% 11.8% 21.3%Other -11.2% -9.8% -12.8% -17.1% -4.4% 0.9% 2.8% -9.3% -4.9% 9.8% 2.8% -7.3% -3.7% -4.4%
� Possibility of ‘Possibility of ‘Possibility of ‘Possibility of ‘EEEEnergy’ nergy’ nergy’ nergy’ BBBBill and ill and ill and ill and TTTTax ax ax ax PPPProrororovisions in visions in visions in visions in AAAAdvanced dvanced dvanced dvanced CCCCountrountrountrountriesiesiesies:::: ‘Peak
Oil’ or not, it is widely agreed in the market that the era of cheap oil is over. The
question is how high the oil price will go up, not whether it will go up or down.
Since strong oil price to be sustained in the future is much more than a casual,
cyclical speculation, there is an increasing possibility of some sort of ‘energy tax’ in
some developed countries like the United States, proceeds of which will be deployed
for development of other energy sources than oils, most notably, nuclear energy
and conservation such as cleaner-burning coal plants. Among other things, this
has an effect of capping and delaying oil majors’ overall expansion plan for refinery,
and will likely force the related companies to focus on maximizing their throughput
yield and only a few selective exploration and production undertakings. Figure 31
hints that the US oil companies were indeed very conservative with their new
investments including property/plant investments, E&P, and research/development
in 2005 despite strong oil price. Although it will hurt Korean refiners to a certain
extent if this speculation turns into reality, they are relatively safeguarded from this
regulatory risk because it is not economically justifiable for Korea to impose heavier
duty on energy consumption (Figure 30). The case in point also brings a positive
stock market implication for Korean shares in a context of market-neutral, relative
value context.
Fig 29: Peak Oil? Fig 30: Perhaps a New Energy bill in the US?
(Source: DWS) (Source: EIA, Korea National Oil Corp, DWS)
Fig 31: Brekdown of uses of cash flow by US oil companies
(Source: John S. Herold Inc, DWS estimate for 2005)
0
5
10
15
20
25
30
1900
1910
1920
1930
1940
1950
1960
1970
198019
9020
0020
1020
2020
3020
4020
5020
6020
7020
8020
9021
00
Billions of barrels
Actual 2005 Peak 2010 Peak
-
50
100
150
200
250
Korea Gasoline US Gasoline Korea Diesel US Diesel
Crude Refining Cost and Profits Distribution& Marketing Tariffs/Tax Retail Price
USD/bbl
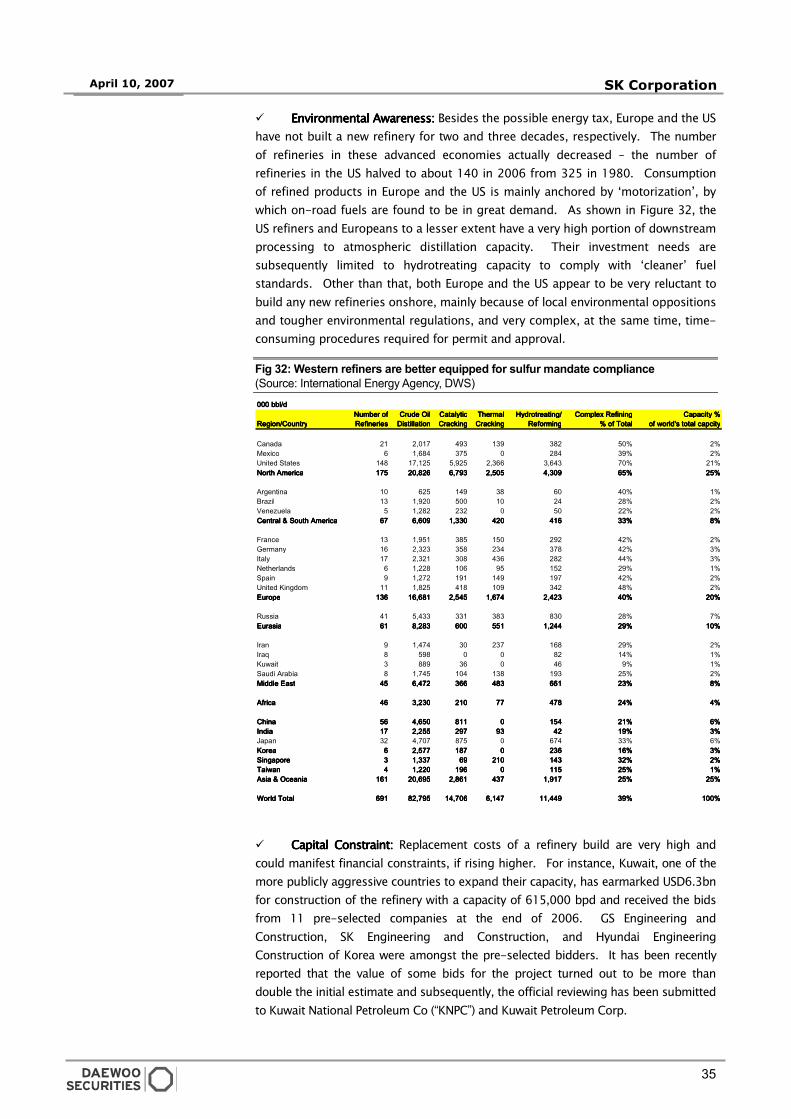
35
April 10, 2007 SK Corporation
Number ofNumber ofNumber ofNumber of Crude OilCrude OilCrude OilCrude Oil CatalyticCatalyticCatalyticCatalytic ThermalThermalThermalThermal Hydrotreating/Hydrotreating/Hydrotreating/Hydrotreating/ Complex RefiningComplex RefiningComplex RefiningComplex Refining Capacity %Capacity %Capacity %Capacity %Region/CountryRegion/CountryRegion/CountryRegion/Country RefineriesRefineriesRefineriesRefineries DistillationDistillationDistillationDistillation CrackingCrackingCrackingCracking CrackingCrackingCrackingCracking ReformingReformingReformingReforming % of Total% of Total% of Total% of Total of world's total capcityof world's total capcityof world's total capcityof world's total capcity
Canada 21 2,017 493 139 382 50% 2%Mexico 6 1,684 375 0 284 39% 2%United States 148 17,125 5,925 2,366 3,643 70% 21%North AmericaNorth AmericaNorth AmericaNorth America 175175175175 20,82620,82620,82620,826 6,7936,7936,7936,793 2,5052,5052,5052,505 4,3094,3094,3094,309 65%65%65%65% 25%25%25%25%
Argentina 10 625 149 38 60 40% 1%Brazil 13 1,920 500 10 24 28% 2%Venezuela 5 1,282 232 0 50 22% 2%Central & South AmericaCentral & South AmericaCentral & South AmericaCentral & South America 67676767 6,6096,6096,6096,609 1,3301,3301,3301,330 420420420420 416416416416 33%33%33%33% 8%8%8%8%
France 13 1,951 385 150 292 42% 2%Germany 16 2,323 358 234 378 42% 3%Italy 17 2,321 308 436 282 44% 3%Netherlands 6 1,228 106 95 152 29% 1%Spain 9 1,272 191 149 197 42% 2%United Kingdom 11 1,825 418 109 342 48% 2%EuropeEuropeEuropeEurope 136136136136 16,68116,68116,68116,681 2,5452,5452,5452,545 1,6741,6741,6741,674 2,4232,4232,4232,423 40%40%40%40% 20%20%20%20%
Russia 41 5,433 331 383 830 28% 7%EurasiaEurasiaEurasiaEurasia 61616161 8,2838,2838,2838,283 600600600600 551551551551 1,2441,2441,2441,244 29%29%29%29% 10%10%10%10%
Iran 9 1,474 30 237 168 29% 2%Iraq 8 598 0 0 82 14% 1%Kuwait 3 889 36 0 46 9% 1%Saudi Arabia 8 1,745 104 138 193 25% 2%Middle EastMiddle EastMiddle EastMiddle East 45454545 6,4726,4726,4726,472 366366366366 483483483483 661661661661 23%23%23%23% 8%8%8%8%
AfricaAfricaAfricaAfrica 46464646 3,2303,2303,2303,230 210210210210 77777777 478478478478 24%24%24%24% 4%4%4%4%
ChinaChinaChinaChina 56565656 4,6504,6504,6504,650 811811811811 0000 154154154154 21%21%21%21% 6%6%6%6%IndiaIndiaIndiaIndia 17171717 2,2552,2552,2552,255 297297297297 93939393 42424242 19%19%19%19% 3%3%3%3%Japan 32 4,707 875 0 674 33% 6%KoreaKoreaKoreaKorea 6666 2,5772,5772,5772,577 187187187187 0000 236236236236 16%16%16%16% 3%3%3%3%SingaporeSingaporeSingaporeSingapore 3333 1,3371,3371,3371,337 69696969 210210210210 143143143143 32%32%32%32% 2%2%2%2%TaiwanTaiwanTaiwanTaiwan 4444 1,2201,2201,2201,220 196196196196 0000 115115115115 25%25%25%25% 1%1%1%1%Asia & OceaniaAsia & OceaniaAsia & OceaniaAsia & Oceania 161161161161 20,69520,69520,69520,695 2,8612,8612,8612,861 437437437437 1,9171,9171,9171,917 25%25%25%25% 25%25%25%25%
World TotalWorld TotalWorld TotalWorld Total 691691691691 82,79582,79582,79582,795 14,70614,70614,70614,706 6,1476,1476,1476,147 11,44911,44911,44911,449 39%39%39%39% 100%100%100%100%
000 bbl/d000 bbl/d000 bbl/d000 bbl/d
� Environmental Environmental Environmental Environmental AAAAwareness:wareness:wareness:wareness: Besides the possible energy tax, Europe and the US
have not built a new refinery for two and three decades, respectively. The number
of refineries in these advanced economies actually decreased – the number of
refineries in the US halved to about 140 in 2006 from 325 in 1980. Consumption
of refined products in Europe and the US is mainly anchored by ‘motorization’, by
which on-road fuels are found to be in great demand. As shown in Figure 32, the
US refiners and Europeans to a lesser extent have a very high portion of downstream
processing to atmospheric distillation capacity. Their investment needs are
subsequently limited to hydrotreating capacity to comply with ‘cleaner’ fuel
standards. Other than that, both Europe and the US appear to be very reluctant to
build any new refineries onshore, mainly because of local environmental oppositions
and tougher environmental regulations, and very complex, at the same time, time-
consuming procedures required for permit and approval.
Fig 32: Western refiners are better equipped for sulfur mandate compliance
(Source: International Energy Agency, DWS)
� Capital Capital Capital Capital CCCConstraint:onstraint:onstraint:onstraint: Replacement costs of a refinery build are very high and
could manifest financial constraints, if rising higher. For instance, Kuwait, one of the
more publicly aggressive countries to expand their capacity, has earmarked USD6.3bn
for construction of the refinery with a capacity of 615,000 bpd and received the bids
from 11 pre-selected companies at the end of 2006. GS Engineering and
Construction, SK Engineering and Construction, and Hyundai Engineering
Construction of Korea were amongst the pre-selected bidders. It has been recently
reported that the value of some bids for the project turned out to be more than
double the initial estimate and subsequently, the official reviewing has been submitted
to Kuwait National Petroleum Co (“KNPC”) and Kuwait Petroleum Corp.
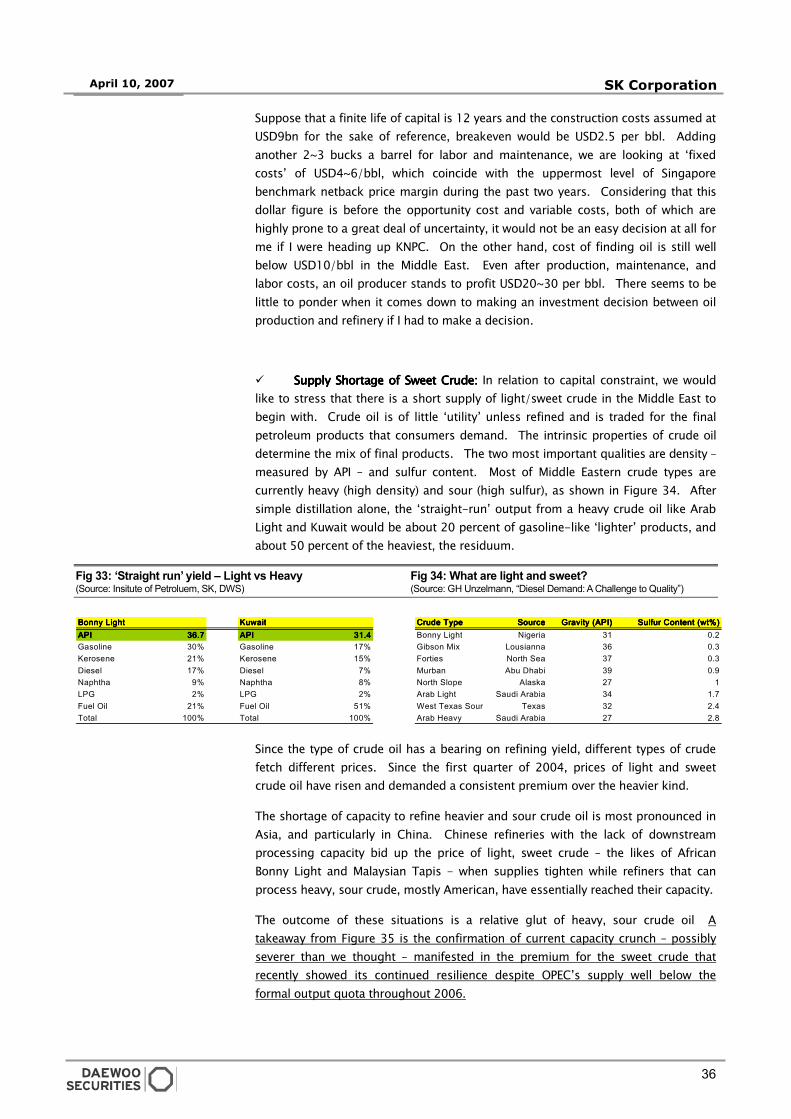
36
April 10, 2007 SK Corporation
Bonny LightBonny LightBonny LightBonny Light KuwaitKuwaitKuwaitKuwait Crude TypeCrude TypeCrude TypeCrude Type SourceSourceSourceSource Gravity (API)Gravity (API)Gravity (API)Gravity (API) Sulfur Content (wt%)Sulfur Content (wt%)Sulfur Content (wt%)Sulfur Content (wt%)APIAPIAPIAPI 36.736.736.736.7 APIAPIAPIAPI 31.431.431.431.4 Bonny Light Nigeria 31 0.2Gasoline 30% Gasoline 17% Gibson Mix Lousianna 36 0.3Kerosene 21% Kerosene 15% Forties North Sea 37 0.3Diesel 17% Diesel 7% Murban Abu Dhabi 39 0.9Naphtha 9% Naphtha 8% North Slope Alaska 27 1LPG 2% LPG 2% Arab Light Saudi Arabia 34 1.7Fuel Oil 21% Fuel Oil 51% West Texas Sour Texas 32 2.4Total 100% Total 100% Arab Heavy Saudi Arabia 27 2.8
Suppose that a finite life of capital is 12 years and the construction costs assumed at
USD9bn for the sake of reference, breakeven would be USD2.5 per bbl. Adding
another 2~3 bucks a barrel for labor and maintenance, we are looking at ‘fixed
costs’ of USD4~6/bbl, which coincide with the uppermost level of Singapore
benchmark netback price margin during the past two years. Considering that this
dollar figure is before the opportunity cost and variable costs, both of which are
highly prone to a great deal of uncertainty, it would not be an easy decision at all for
me if I were heading up KNPC. On the other hand, cost of finding oil is still well
below USD10/bbl in the Middle East. Even after production, maintenance, and
labor costs, an oil producer stands to profit USD20~30 per bbl. There seems to be
little to ponder when it comes down to making an investment decision between oil
production and refinery if I had to make a decision.
� Supply Supply Supply Supply SSSShortage of hortage of hortage of hortage of SSSSweet weet weet weet CCCCrude:rude:rude:rude: In relation to capital constraint, we would
like to stress that there is a short supply of light/sweet crude in the Middle East to
begin with. Crude oil is of little ‘utility’ unless refined and is traded for the final
petroleum products that consumers demand. The intrinsic properties of crude oil
determine the mix of final products. The two most important qualities are density –
measured by API – and sulfur content. Most of Middle Eastern crude types are
currently heavy (high density) and sour (high sulfur), as shown in Figure 34. After
simple distillation alone, the ‘straight-run’ output from a heavy crude oil like Arab
Light and Kuwait would be about 20 percent of gasoline-like ‘lighter’ products, and
about 50 percent of the heaviest, the residuum.
Fig 33: ‘Straight run’ yield – Light vs Heavy Fig 34: What are light and sweet? (Source: Insitute of Petroluem, SK, DWS) (Source: GH Unzelmann, “Diesel Demand: A Challenge to Quality”)
Since the type of crude oil has a bearing on refining yield, different types of crude
fetch different prices. Since the first quarter of 2004, prices of light and sweet
crude oil have risen and demanded a consistent premium over the heavier kind.
The shortage of capacity to refine heavier and sour crude oil is most pronounced in
Asia, and particularly in China. Chinese refineries with the lack of downstream
processing capacity bid up the price of light, sweet crude – the likes of African
Bonny Light and Malaysian Tapis - when supplies tighten while refiners that can
process heavy, sour crude, mostly American, have essentially reached their capacity.
The outcome of these situations is a relative glut of heavy, sour crude oil A
takeaway from Figure 35 is the confirmation of current capacity crunch – possibly
severer than we thought – manifested in the premium for the sweet crude that
recently showed its continued resilience despite OPEC’s supply well below the
formal output quota throughout 2006.
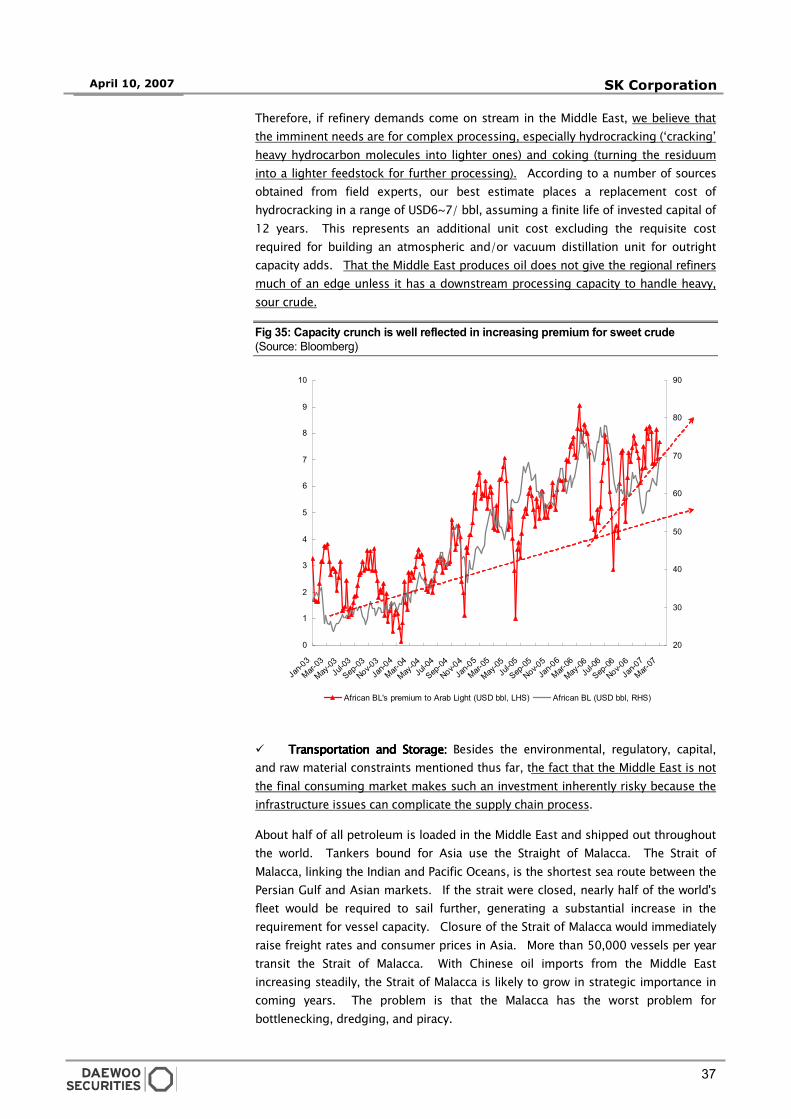
37
April 10, 2007 SK Corporation
0
1
2
3
4
5
6
7
8
9
10
Jan-0
3
Mar-03
May-03
Jul-0
3
Sep-03
Nov-03Ja
n-04
Mar-04
May-04
Jul-0
4
Sep-04
Nov-04Ja
n-05
Mar-05
May-05
Jul-0
5
Sep-05
Nov-05Ja
n-06
Mar-06
May-06
Jul-0
6
Sep-06
Nov-06Ja
n-07
Mar-07
20
30
40
50
60
70
80
90
African BL's premium to Arab Light (USD bbl, LHS) African BL (USD bbl, RHS)
Therefore, if refinery demands come on stream in the Middle East, we believe that
the imminent needs are for complex processing, especially hydrocracking (‘cracking’
heavy hydrocarbon molecules into lighter ones) and coking (turning the residuum
into a lighter feedstock for further processing). According to a number of sources
obtained from field experts, our best estimate places a replacement cost of
hydrocracking in a range of USD6~7/ bbl, assuming a finite life of invested capital of
12 years. This represents an additional unit cost excluding the requisite cost
required for building an atmospheric and/or vacuum distillation unit for outright
capacity adds. That the Middle East produces oil does not give the regional refiners
much of an edge unless it has a downstream processing capacity to handle heavy,
sour crude.
Fig 35: Capacity crunch is well reflected in increasing premium for sweet crude
(Source: Bloomberg)
� Transportation and Storage:Transportation and Storage:Transportation and Storage:Transportation and Storage: Besides the environmental, regulatory, capital,
and raw material constraints mentioned thus far, the fact that the Middle East is not
the final consuming market makes such an investment inherently risky because the
infrastructure issues can complicate the supply chain process.
About half of all petroleum is loaded in the Middle East and shipped out throughout
the world. Tankers bound for Asia use the Straight of Malacca. The Strait of
Malacca, linking the Indian and Pacific Oceans, is the shortest sea route between the
Persian Gulf and Asian markets. If the strait were closed, nearly half of the world's
fleet would be required to sail further, generating a substantial increase in the
requirement for vessel capacity. Closure of the Strait of Malacca would immediately
raise freight rates and consumer prices in Asia. More than 50,000 vessels per year
transit the Strait of Malacca. With Chinese oil imports from the Middle East
increasing steadily, the Strait of Malacca is likely to grow in strategic importance in
coming years. The problem is that the Malacca has the worst problem for
bottlenecking, dredging, and piracy.
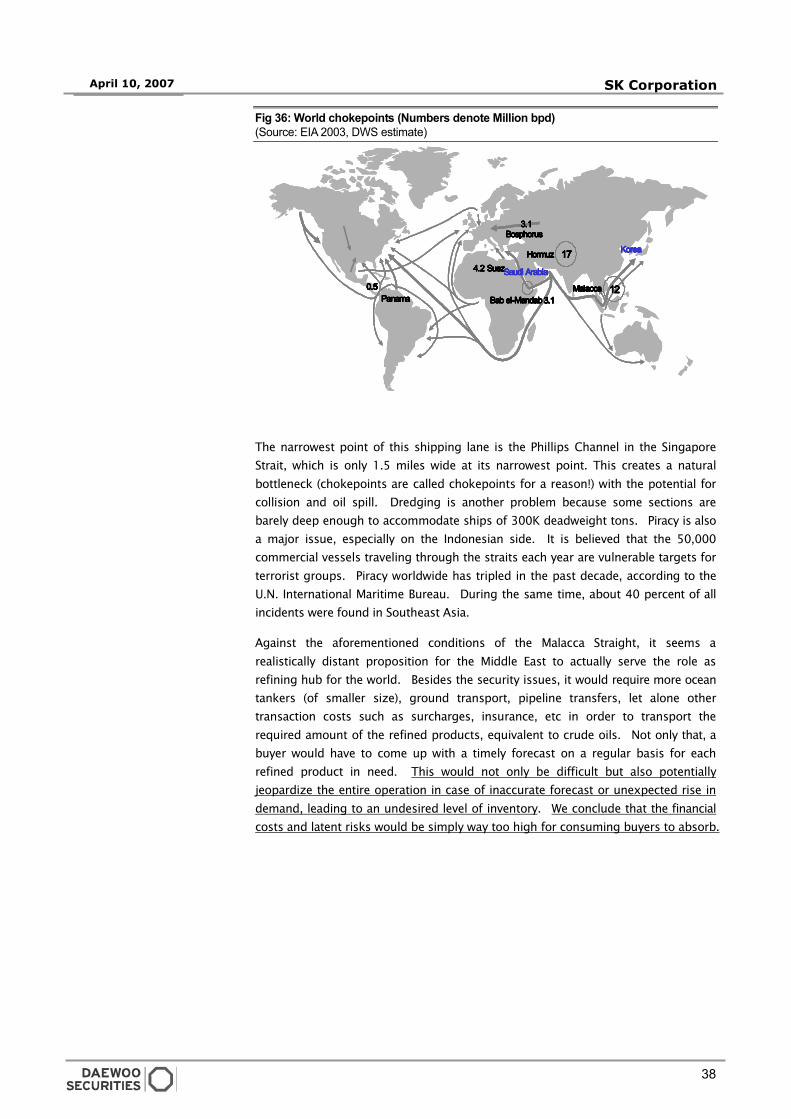
38
April 10, 2007 SK Corporation
17171717HormuzHormuzHormuzHormuz
MalaccaMalaccaMalaccaMalaccaBabBabBabBab elelelel----MandabMandabMandabMandab
SuezSuezSuezSuez
BosphorusBosphorusBosphorusBosphorus
PanamaPanamaPanamaPanama
3.13.13.13.1
0.50.50.50.53.13.13.13.1
4.24.24.24.2
12121212
KoreaKoreaKoreaKorea
Saudi ArabiaSaudi ArabiaSaudi ArabiaSaudi Arabia
Fig 36: World chokepoints (Numbers denote Million bpd)
(Source: EIA 2003, DWS estimate)
The narrowest point of this shipping lane is the Phillips Channel in the Singapore
Strait, which is only 1.5 miles wide at its narrowest point. This creates a natural
bottleneck (chokepoints are called chokepoints for a reason!) with the potential for
collision and oil spill. Dredging is another problem because some sections are
barely deep enough to accommodate ships of 300K deadweight tons. Piracy is also
a major issue, especially on the Indonesian side. It is believed that the 50,000
commercial vessels traveling through the straits each year are vulnerable targets for
terrorist groups. Piracy worldwide has tripled in the past decade, according to the
U.N. International Maritime Bureau. During the same time, about 40 percent of all
incidents were found in Southeast Asia.
Against the aforementioned conditions of the Malacca Straight, it seems a
realistically distant proposition for the Middle East to actually serve the role as
refining hub for the world. Besides the security issues, it would require more ocean
tankers (of smaller size), ground transport, pipeline transfers, let alone other
transaction costs such as surcharges, insurance, etc in order to transport the
required amount of the refined products, equivalent to crude oils. Not only that, a
buyer would have to come up with a timely forecast on a regular basis for each
refined product in need. This would not only be difficult but also potentially
jeopardize the entire operation in case of inaccurate forecast or unexpected rise in
demand, leading to an undesired level of inventory. We conclude that the financial
costs and latent risks would be simply way too high for consuming buyers to absorb.
39
April 10, 2007 SK Corporation
VVEERRDDIICCTT UUPPOONN SSUUPPPPLLYY AADDDDIITTIIOONNSS
SSIIMMPPLLYY AA DDIILLEEMMMMAA OORR TTHHEE CCAASSEE OOFF ‘‘CCAATTCCHH--2222’’??
The Middle EastThe Middle EastThe Middle EastThe Middle East
To take the Middle East’s future investment announcements for granted is less
than a fertile thought. We believe that the Middle East expansion in refinery
should be primarily designed to meet the regional needs. We highlight once
again that the ambitious investment roadmap of Saudi Arabia and of other OPEC
countries alike - while it sounds feasible - does not sound reasonable or realistic
without the prerequisite of more oil supply to precede it.
In fact, while Saudi Arabia has earmarked USD55~60bn - an annual average of
USD11bn - for refinery projects between 2007 and 2011, a significantly larger
budget of about USD25~27bn per year has been already set aside for oil production
capacity adds over the next three years. A total annual investment of USD35~40bn
seems a bit overstretched given that the Kingdom’s annual budget surplus should
be about USD15~20bn during the same period, let alone the Kingdom’s public debt
in excess of USD100 bn. The estimate for the Kingdom’s surplus is based on the
assumption of oil export of 7~8mil bpd at average prices of USD38~45 per bbl and
a production cost of USD3 per bbl. This budget estimate is actually at the upper
range of our long-term forecast, given that Saudi population can top 40 million by
2025, leaving the Kingdom hard pressed to create jobs and income. The kingdom
has to spend a great deal on the industrial sectors and services that require labor
because oil sector employs only about 2% of the total labor force. These economic
challenges, not limited to Saudi Arabia, are common throughout the Middle East and
North Africa.
This estimate will be significantly revised down, of course, if geopolitical risks
regarding Iran’s nuclear programs heighten. This leaves us with the best educated
guess that the planned investments should be and will be revised down at some
point and we believe that the downward revision of planned investments will be for
refining sector, not crude oil production. As the largest producer in the world and a
leader in OPEC’s production quota decisions, Saudi should have an export buffer of
1~2 mil bpd to offset possible supply disruption. More importantly, it makes
economic sense to pump oil, but not to refine it at current benchmark world prices.
In a nutshell, the Middle East will eventually wake up to realize that their ‘All-Out’
strategy may have to be toned down a bit. After all, most of investment
announcements were made during 2005 when oil price forecasts and the
surrounding conditions were much rosier and more favorable than now. We would
like to insist that sizable expansion by the Middle East should be strategically
confined for petrochemical segment, not refining segment, because there are gluts
of cheap ethane gas.
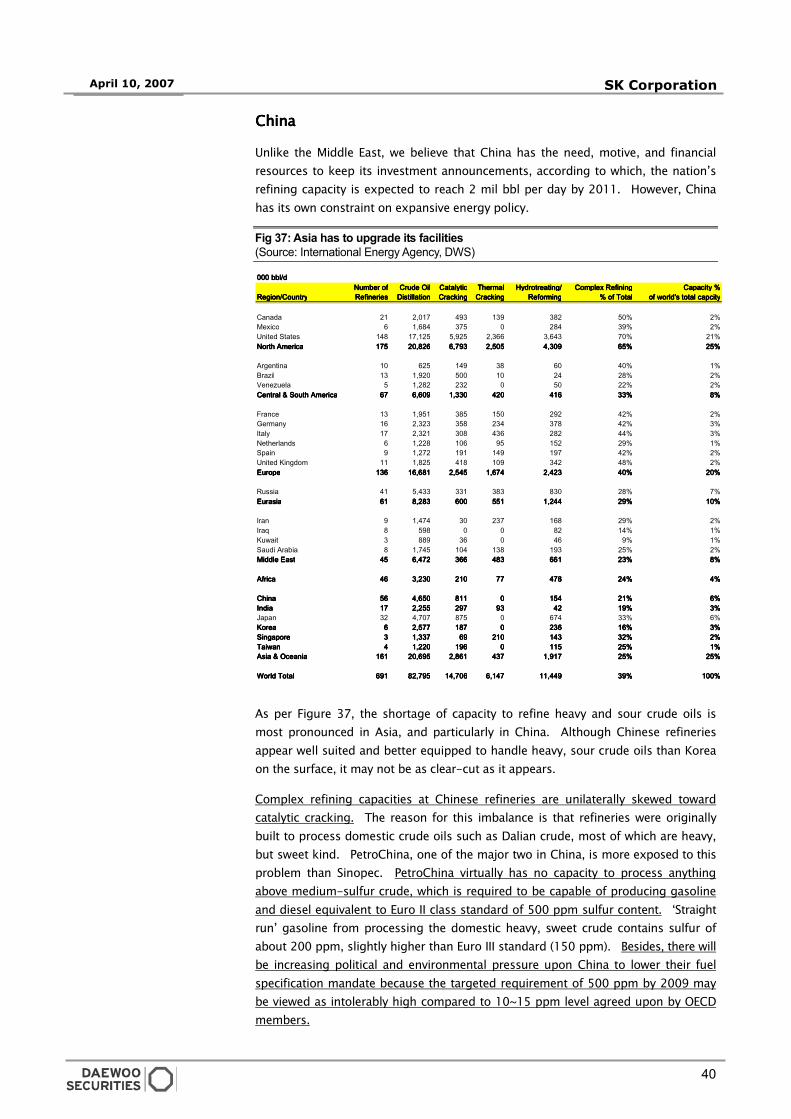
40
April 10, 2007 SK Corporation
Number ofNumber ofNumber ofNumber of Crude OilCrude OilCrude OilCrude Oil CatalyticCatalyticCatalyticCatalytic ThermalThermalThermalThermal Hydrotreating/Hydrotreating/Hydrotreating/Hydrotreating/ Complex RefiningComplex RefiningComplex RefiningComplex Refining Capacity %Capacity %Capacity %Capacity %Region/CountryRegion/CountryRegion/CountryRegion/Country RefineriesRefineriesRefineriesRefineries DistillationDistillationDistillationDistillation CrackingCrackingCrackingCracking CrackingCrackingCrackingCracking ReformingReformingReformingReforming % of Total% of Total% of Total% of Total of world's total capcityof world's total capcityof world's total capcityof world's total capcity
Canada 21 2,017 493 139 382 50% 2%Mexico 6 1,684 375 0 284 39% 2%United States 148 17,125 5,925 2,366 3,643 70% 21%North AmericaNorth AmericaNorth AmericaNorth America 175175175175 20,82620,82620,82620,826 6,7936,7936,7936,793 2,5052,5052,5052,505 4,3094,3094,3094,309 65%65%65%65% 25%25%25%25%
Argentina 10 625 149 38 60 40% 1%Brazil 13 1,920 500 10 24 28% 2%Venezuela 5 1,282 232 0 50 22% 2%Central & South AmericaCentral & South AmericaCentral & South AmericaCentral & South America 67676767 6,6096,6096,6096,609 1,3301,3301,3301,330 420420420420 416416416416 33%33%33%33% 8%8%8%8%
France 13 1,951 385 150 292 42% 2%Germany 16 2,323 358 234 378 42% 3%Italy 17 2,321 308 436 282 44% 3%Netherlands 6 1,228 106 95 152 29% 1%Spain 9 1,272 191 149 197 42% 2%United Kingdom 11 1,825 418 109 342 48% 2%EuropeEuropeEuropeEurope 136136136136 16,68116,68116,68116,681 2,5452,5452,5452,545 1,6741,6741,6741,674 2,4232,4232,4232,423 40%40%40%40% 20%20%20%20%
Russia 41 5,433 331 383 830 28% 7%EurasiaEurasiaEurasiaEurasia 61616161 8,2838,2838,2838,283 600600600600 551551551551 1,2441,2441,2441,244 29%29%29%29% 10%10%10%10%
Iran 9 1,474 30 237 168 29% 2%Iraq 8 598 0 0 82 14% 1%Kuwait 3 889 36 0 46 9% 1%Saudi Arabia 8 1,745 104 138 193 25% 2%Middle EastMiddle EastMiddle EastMiddle East 45454545 6,4726,4726,4726,472 366366366366 483483483483 661661661661 23%23%23%23% 8%8%8%8%
AfricaAfricaAfricaAfrica 46464646 3,2303,2303,2303,230 210210210210 77777777 478478478478 24%24%24%24% 4%4%4%4%
ChinaChinaChinaChina 56565656 4,6504,6504,6504,650 811811811811 0000 154154154154 21%21%21%21% 6%6%6%6%IndiaIndiaIndiaIndia 17171717 2,2552,2552,2552,255 297297297297 93939393 42424242 19%19%19%19% 3%3%3%3%Japan 32 4,707 875 0 674 33% 6%KoreaKoreaKoreaKorea 6666 2,5772,5772,5772,577 187187187187 0000 236236236236 16%16%16%16% 3%3%3%3%SingaporeSingaporeSingaporeSingapore 3333 1,3371,3371,3371,337 69696969 210210210210 143143143143 32%32%32%32% 2%2%2%2%TaiwanTaiwanTaiwanTaiwan 4444 1,2201,2201,2201,220 196196196196 0000 115115115115 25%25%25%25% 1%1%1%1%Asia & OceaniaAsia & OceaniaAsia & OceaniaAsia & Oceania 161161161161 20,69520,69520,69520,695 2,8612,8612,8612,861 437437437437 1,9171,9171,9171,917 25%25%25%25% 25%25%25%25%
World TotalWorld TotalWorld TotalWorld Total 691691691691 82,79582,79582,79582,795 14,70614,70614,70614,706 6,1476,1476,1476,147 11,44911,44911,44911,449 39%39%39%39% 100%100%100%100%
000 bbl/d000 bbl/d000 bbl/d000 bbl/d
ChinaChinaChinaChina
Unlike the Middle East, we believe that China has the need, motive, and financial
resources to keep its investment announcements, according to which, the nation’s
refining capacity is expected to reach 2 mil bbl per day by 2011. However, China
has its own constraint on expansive energy policy.
Fig 37: Asia has to upgrade its facilities
(Source: International Energy Agency, DWS)
As per Figure 37, the shortage of capacity to refine heavy and sour crude oils is
most pronounced in Asia, and particularly in China. Although Chinese refineries
appear well suited and better equipped to handle heavy, sour crude oils than Korea
on the surface, it may not be as clear-cut as it appears.
Complex refining capacities at Chinese refineries are unilaterally skewed toward
catalytic cracking. The reason for this imbalance is that refineries were originally
built to process domestic crude oils such as Dalian crude, most of which are heavy,
but sweet kind. PetroChina, one of the major two in China, is more exposed to this
problem than Sinopec. PetroChina virtually has no capacity to process anything
above medium-sulfur crude, which is required to be capable of producing gasoline
and diesel equivalent to Euro II class standard of 500 ppm sulfur content. ‘Straight
run’ gasoline from processing the domestic heavy, sweet crude contains sulfur of
about 200 ppm, slightly higher than Euro III standard (150 ppm). Besides, there will
be increasing political and environmental pressure upon China to lower their fuel
specification mandate because the targeted requirement of 500 ppm by 2009 may
be viewed as intolerably high compared to 10~15 ppm level agreed upon by OECD
members.
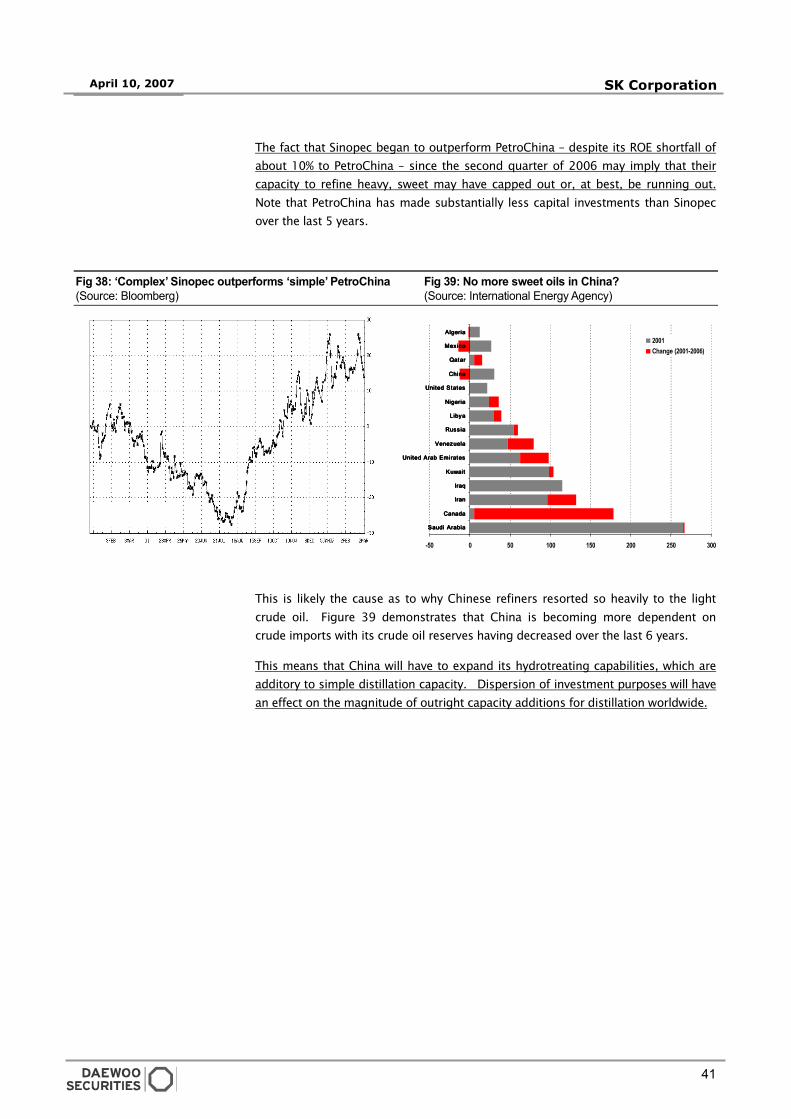
41
April 10, 2007 SK Corporation
-50 0 50 100 150 200 250 300
Saudi ArabiaSaudi ArabiaSaudi ArabiaSaudi Arabia
CanadaCanadaCanadaCanada
IranIranIranIran
IraqIraqIraqIraq
KuwaitKuwaitKuwaitKuwait
United Arab EmiratesUnited Arab EmiratesUnited Arab EmiratesUnited Arab Emirates
VenezuelaVenezuelaVenezuelaVenezuela
RussiaRussiaRussiaRussia
LibyaLibyaLibyaLibya
NigeriaNigeriaNigeriaNigeria
United StatesUnited StatesUnited StatesUnited States
ChinaChinaChinaChina
QatarQatarQatarQatar
MexicoMexicoMexicoMexico
AlgeriaAlgeriaAlgeriaAlgeria2001
Change (2001-2006)
The fact that Sinopec began to outperform PetroChina – despite its ROE shortfall of
about 10% to PetroChina – since the second quarter of 2006 may imply that their
capacity to refine heavy, sweet may have capped out or, at best, be running out.
Note that PetroChina has made substantially less capital investments than Sinopec
over the last 5 years.
Fig 38: ‘Complex’ Sinopec outperforms ‘simple’ PetroChina Fig 39: No more sweet oils in China?
(Source: Bloomberg) (Source: International Energy Agency)
This is likely the cause as to why Chinese refiners resorted so heavily to the light
crude oil. Figure 39 demonstrates that China is becoming more dependent on
crude imports with its crude oil reserves having decreased over the last 6 years.
This means that China will have to expand its hydrotreating capabilities, which are
additory to simple distillation capacity. Dispersion of investment purposes will have
an effect on the magnitude of outright capacity additions for distillation worldwide.
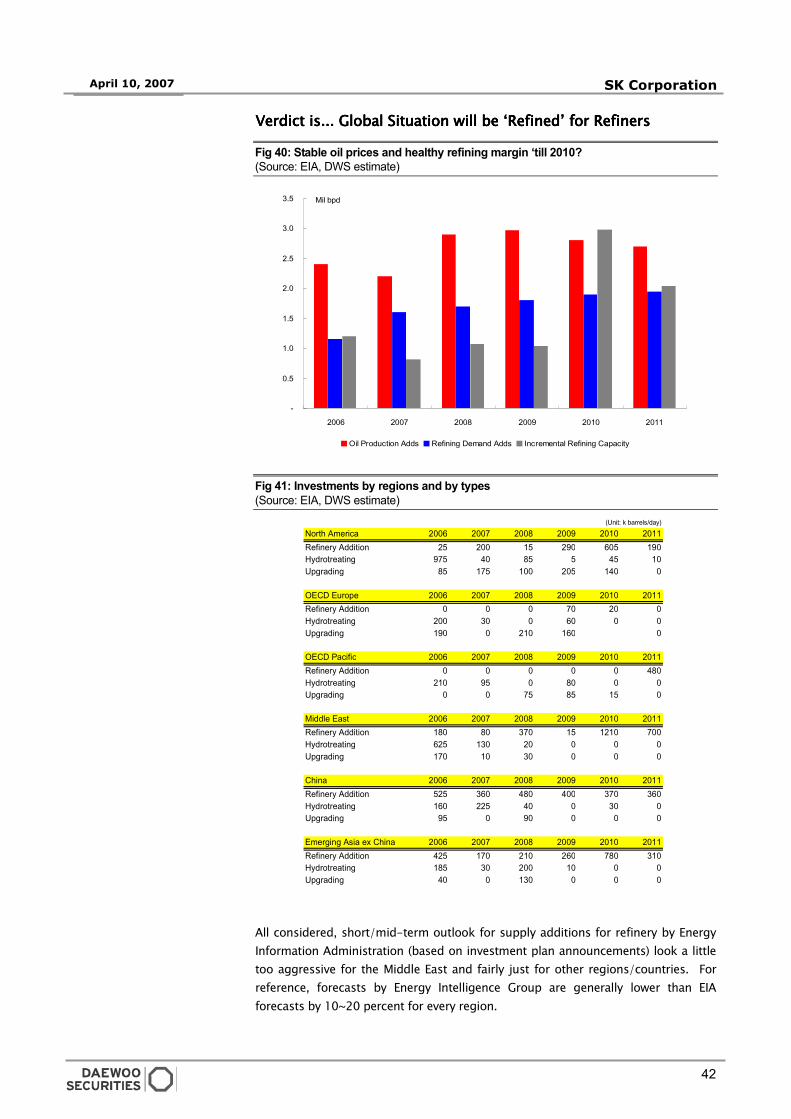
42
April 10, 2007 SK Corporation
-
0.5
1.0
1.5
2.0
2.5
3.0
3.5
2006 2007 2008 2009 2010 2011
Oil Production Adds Refining Demand Adds Incremental Refining Capacity
Mil bpd
(Unit: k barrels/day)
North America 2006 2007 2008 2009 2010 2011Refinery Addition 25 200 15 290 605 190Hydrotreating 975 40 85 5 45 10Upgrading 85 175 100 205 140 0
OECD Europe 2006 2007 2008 2009 2010 2011Refinery Addition 0 0 0 70 20 0Hydrotreating 200 30 0 60 0 0Upgrading 190 0 210 160 0
OECD Pacific 2006 2007 2008 2009 2010 2011Refinery Addition 0 0 0 0 0 480Hydrotreating 210 95 0 80 0 0Upgrading 0 0 75 85 15 0
Middle East 2006 2007 2008 2009 2010 2011Refinery Addition 180 80 370 15 1210 700Hydrotreating 625 130 20 0 0 0Upgrading 170 10 30 0 0 0
China 2006 2007 2008 2009 2010 2011Refinery Addition 525 360 480 400 370 360Hydrotreating 160 225 40 0 30 0Upgrading 95 0 90 0 0 0
Emerging Asia ex China 2006 2007 2008 2009 2010 2011Refinery Addition 425 170 210 260 780 310Hydrotreating 185 30 200 10 0 0Upgrading 40 0 130 0 0 0
Verdict Verdict Verdict Verdict is... is... is... is... Global Situation will be ‘Refined’ for RefinersGlobal Situation will be ‘Refined’ for RefinersGlobal Situation will be ‘Refined’ for RefinersGlobal Situation will be ‘Refined’ for Refiners
Fig 40: Stable oil prices and healthy refining margin ‘till 2010?
(Source: EIA, DWS estimate)
Fig 41: Investments by regions and by types
(Source: EIA, DWS estimate)
All considered, short/mid-term outlook for supply additions for refinery by Energy
Information Administration (based on investment plan announcements) look a little
too aggressive for the Middle East and fairly just for other regions/countries. For
reference, forecasts by Energy Intelligence Group are generally lower than EIA
forecasts by 10~20 percent for every region.
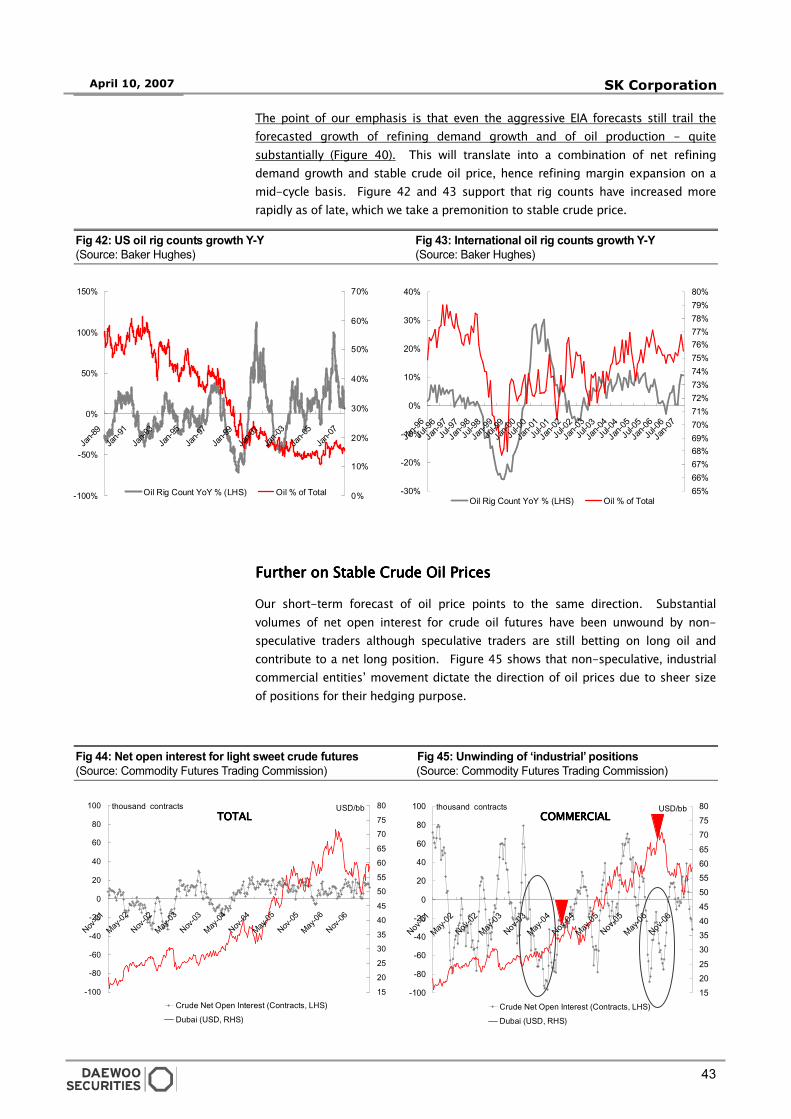
43
April 10, 2007 SK Corporation
The point of our emphasis is that even the aggressive EIA forecasts still trail the
forecasted growth of refining demand growth and of oil production - quite
substantially (Figure 40). This will translate into a combination of net refining
demand growth and stable crude oil price, hence refining margin expansion on a
mid-cycle basis. Figure 42 and 43 support that rig counts have increased more
rapidly as of late, which we take a premonition to stable crude price.
Fig 42: US oil rig counts growth Y-Y Fig 43: International oil rig counts growth Y-Y
(Source: Baker Hughes) (Source: Baker Hughes)
Further on Stable Crude Oil PricesFurther on Stable Crude Oil PricesFurther on Stable Crude Oil PricesFurther on Stable Crude Oil Prices
Our short-term forecast of oil price points to the same direction. Substantial
volumes of net open interest for crude oil futures have been unwound by non-
speculative traders although speculative traders are still betting on long oil and
contribute to a net long position. Figure 45 shows that non-speculative, industrial
commercial entities’ movement dictate the direction of oil prices due to sheer size
of positions for their hedging purpose.
Fig 44: Net open interest for light sweet crude futures Fig 45: Unwinding of ‘industrial’ positions
(Source: Commodity Futures Trading Commission) (Source: Commodity Futures Trading Commission)
Total Non-
TOTALTOTALTOTALTOTAL
-100
-80
-60
-40
-20
0
20
40
60
80
100
Nov-01
May-02
Nov-02
May-03
Nov-03
May-04
Nov-04
May-05
Nov-05
May-06
Nov-06
152025
30354045
50556065
707580
Crude Net Open Interest (Contracts, LHS)
Dubai (USD, RHS)
thousand contracts USD/bb
-100
-80
-60
-40
-20
0
20
40
60
80
100
Nov-01
May-02
Nov-02
May-03
Nov-03
May-04
Nov-04
May-05
Nov-05
May-06
Nov-06
15
20
25
30
35
40
45
50
55
60
65
70
75
80
Crude Net Open Interest (Contracts, LHS)
Dubai (USD, RHS)
thousand contracts USD/bbTOTALTOTALTOTALTOTAL COMMERCIALCOMMERCIALCOMMERCIALCOMMERCIAL
-100%
-50%
0%
50%
100%
150%
Jan-8
9Ja
n-91
Jan-9
3
Jan-9
5
Jan-9
7
Jan-9
9Ja
n-01
Jan-0
3
Jan-0
5
Jan-0
7
0%
10%
20%
30%
40%
50%
60%
70%
Oil Rig Count YoY % (LHS) Oil % of Total
-30%
-20%
-10%
0%
10%
20%
30%
40%
Jan-9
6Ju
l-96
Jan-9
7Ju
l-97
Jan-9
8Ju
l-98
Jan-9
9Ju
l-99
Jan-0
0Ju
l-00
Jan-0
1Ju
l-01
Jan-0
2Ju
l-02
Jan-0
3Ju
l-03
Jan-0
4Ju
l-04
Jan-0
5Ju
l-05
Jan-0
6Ju
l-06
Jan-0
7
65%66%67%68%69%70%71%72%73%74%75%76%77%78%79%80%
Oil Rig Count YoY % (LHS) Oil % of Total
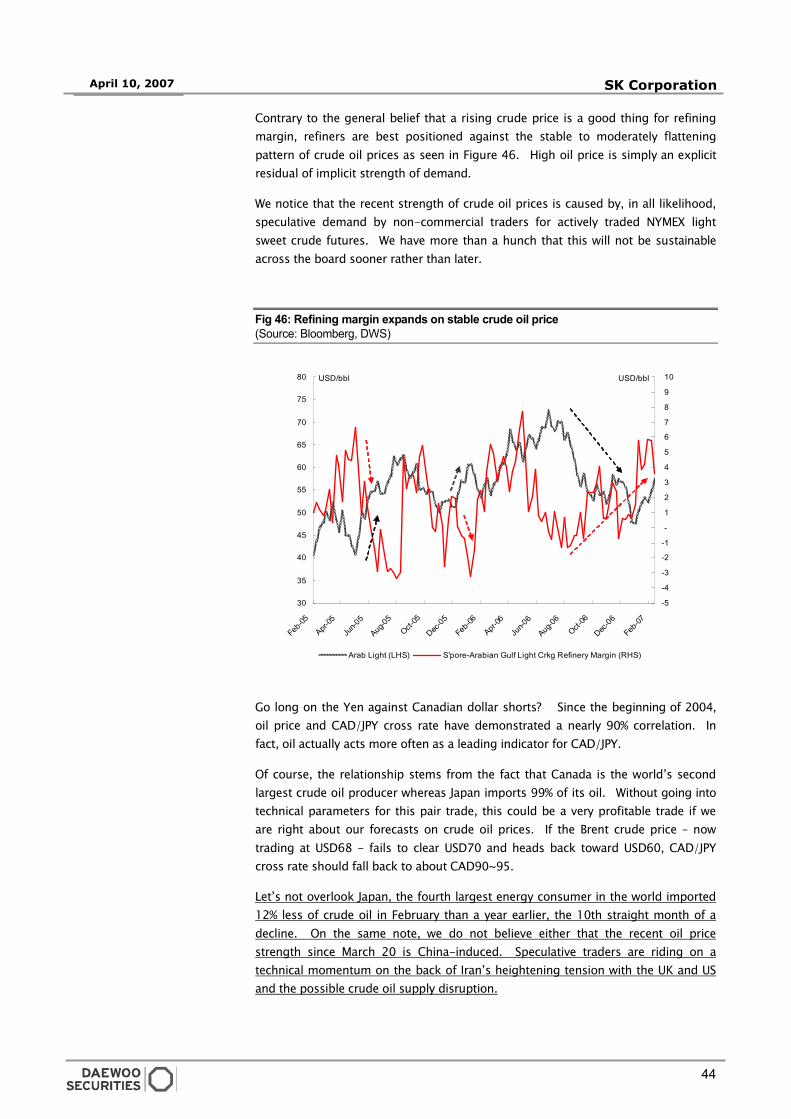
44
April 10, 2007 SK Corporation
30
35
40
45
50
55
60
65
70
75
80
Feb-0
5
Apr-05
Jun-0
5
Aug-05
Oct-05
Dec-05
Feb-0
6
Apr-06
Jun-0
6
Aug-06
Oct-06
Dec-06
Feb-0
7
-5
-4
-3
-2
-1
-
1
2
3
4
5
6
7
8
9
10
Arab Light (LHS) S'pore-Arabian Gulf Light Crkg Refinery Margin (RHS)
USD/bbl USD/bbl
Contrary to the general belief that a rising crude price is a good thing for refining
margin, refiners are best positioned against the stable to moderately flattening
pattern of crude oil prices as seen in Figure 46. High oil price is simply an explicit
residual of implicit strength of demand.
We notice that the recent strength of crude oil prices is caused by, in all likelihood,
speculative demand by non-commercial traders for actively traded NYMEX light
sweet crude futures. We have more than a hunch that this will not be sustainable
across the board sooner rather than later.
Fig 46: Refining margin expands on stable crude oil price
(Source: Bloomberg, DWS)
Go long on the Yen against Canadian dollar shorts? Since the beginning of 2004,
oil price and CAD/JPY cross rate have demonstrated a nearly 90% correlation. In
fact, oil actually acts more often as a leading indicator for CAD/JPY.
Of course, the relationship stems from the fact that Canada is the world’s second
largest crude oil producer whereas Japan imports 99% of its oil. Without going into
technical parameters for this pair trade, this could be a very profitable trade if we
are right about our forecasts on crude oil prices. If the Brent crude price – now
trading at USD68 - fails to clear USD70 and heads back toward USD60, CAD/JPY
cross rate should fall back to about CAD90~95.
Let’s not overlook Japan, the fourth largest energy consumer in the world imported
12% less of crude oil in February than a year earlier, the 10th straight month of a
decline. On the same note, we do not believe either that the recent oil price
strength since March 20 is China-induced. Speculative traders are riding on a
technical momentum on the back of Iran’s heightening tension with the UK and US
and the possible crude oil supply disruption.
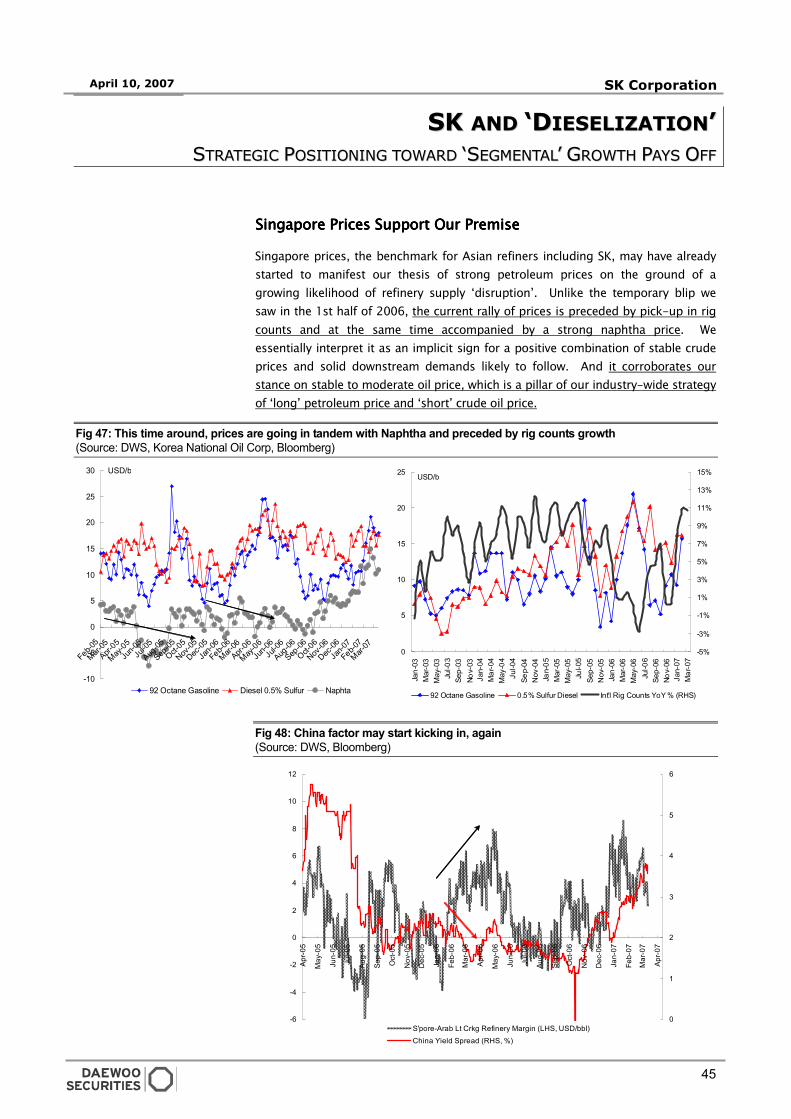
45
April 10, 2007 SK Corporation
-6
-4
-2
0
2
4
6
8
10
12
Apr-0
5
May
-05
Jun-
05
Jul-0
5
Aug-
05
Sep-
05
Oct
-05
Nov
-05
Dec
-05
Jan-
06
Feb-
06
Mar
-06
Apr-0
6
May
-06
Jun-
06
Jul-0
6
Aug-
06
Sep-
06
Oct
-06
Nov
-06
Dec
-06
Jan-
07
Feb-
07
Mar
-07
Apr-0
7
0
1
2
3
4
5
6
S'pore-Arab Lt Crkg Refinery Margin (LHS, USD/bbl)China Yield Spread (RHS, %)
-10
-5
0
5
10
15
20
25
30
Feb-05
Mar-05Apr-
05
May-05
Jun-0
5Ju
l-05
Aug-05
Sep-05
Oct-05
Nov-05
Dec-05
Jan-0
6
Feb-0
6
Mar-06Apr-
06
May-06
Jun-0
6Ju
l-06
Aug-06
Sep-06
Oct-06
Nov-06
Dec-06
Jan-0
7
Feb-0
7
Mar-07
92 Octane Gasoline Diesel 0.5% Sulfur Naphta
USD/b
0
5
10
15
20
25
Jan-
03M
ar-0
3M
ay-0
3Ju
l-03
Sep-
03No
v-03
Jan-
04M
ar-0
4M
ay-0
4Ju
l-04
Sep-
04N
ov-0
4Ja
n-05
Mar
-05
May
-05
Jul-0
5Se
p-05
Nov
-05
Jan-
06M
ar-0
6M
ay-0
6Ju
l-06
Sep-
06No
v-06
Jan-
07M
ar-0
7
-5%
-3%
-1%
1%
3%
5%
7%
9%
11%
13%
15%
92 Octane Gasoline 0.5% Sulfur Diesel Int'l Rig Counts YoY % (RHS)
USD/b
SSKK AANNDD ‘‘DDIIEESSEELLIIZZAATTIIOONN’’
SSTTRRAATTEEGGIICC PPOOSSIITTIIOONNIINNGG TTOOWWAARRDD ‘‘SSEEGGMMEENNTTAALL’’ GGRROOWWTTHH PPAAYYSS OOFFFF
SSSSingapore Pingapore Pingapore Pingapore Prices Support rices Support rices Support rices Support Our PremiseOur PremiseOur PremiseOur Premise
Singapore prices, the benchmark for Asian refiners including SK, may have already
started to manifest our thesis of strong petroleum prices on the ground of a
growing likelihood of refinery supply ‘disruption’. Unlike the temporary blip we
saw in the 1st half of 2006, the current rally of prices is preceded by pick-up in rig
counts and at the same time accompanied by a strong naphtha price. We
essentially interpret it as an implicit sign for a positive combination of stable crude
prices and solid downstream demands likely to follow. And it corroborates our
stance on stable to moderate oil price, which is a pillar of our industry-wide strategy
of ‘long’ petroleum price and ‘short’ crude oil price.
Fig 47: This time around, prices are going in tandem with Naphtha and preceded by rig counts growth
(Source: DWS, Korea National Oil Corp, Bloomberg)
Fig 48: China factor may start kicking in, again
(Source: DWS, Bloomberg)
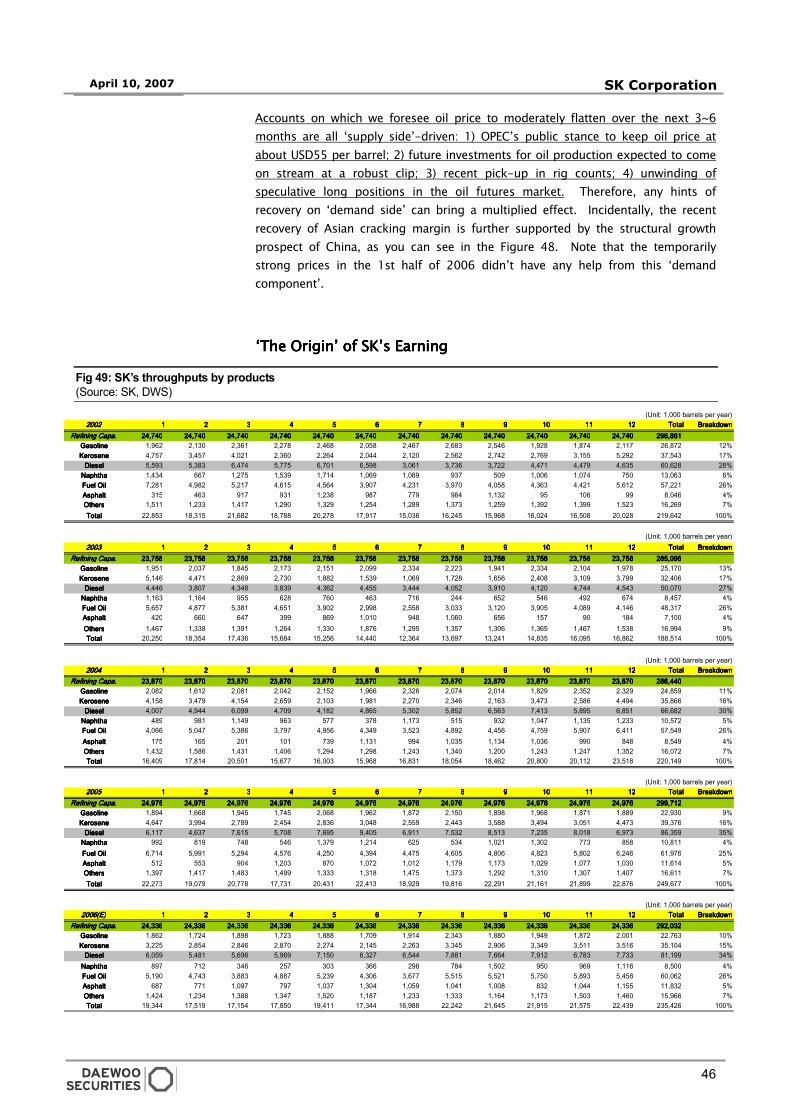
46
April 10, 2007 SK Corporation
(Unit: 1,000 barrels per year)2002200220022002 1111 2222 3333 4444 5555 6666 7777 8888 9999 10101010 11111111 12121212 TotalTotalTotalTotal BreakdownBreakdownBreakdownBreakdown
Refining Capa.Refining Capa.Refining Capa.Refining Capa. 24,74024,74024,74024,740 24,74024,74024,74024,740 24,74024,74024,74024,740 24,74024,74024,74024,740 24,74024,74024,74024,740 24,74024,74024,74024,740 24,74024,74024,74024,740 24,74024,74024,74024,740 24,74024,74024,74024,740 24,74024,74024,74024,740 24,74024,74024,74024,740 24,74024,74024,74024,740 296,881296,881296,881296,881 GasolineGasolineGasolineGasoline 1,962 2,130 2,361 2,278 2,468 2,058 2,467 2,683 2,546 1,928 1,874 2,117 26,872 12%KeroseneKeroseneKeroseneKerosene 4,757 3,457 4,021 2,360 2,264 2,044 2,120 2,562 2,742 2,769 3,155 5,292 37,543 17%
DieselDieselDieselDiesel 5,593 5,383 6,474 5,775 6,701 6,598 3,061 3,736 3,722 4,471 4,479 4,635 60,628 28%NaphthaNaphthaNaphthaNaphtha 1,434 667 1,275 1,539 1,714 1,069 1,089 937 509 1,006 1,074 750 13,063 6%Fuel OilFuel OilFuel OilFuel Oil 7,281 4,982 5,217 4,615 4,564 3,907 4,231 3,970 4,058 4,363 4,421 5,612 57,221 26%AsphaltAsphaltAsphaltAsphalt 315 463 917 931 1,238 987 779 984 1,132 95 106 99 8,046 4%OthersOthersOthersOthers 1,511 1,233 1,417 1,290 1,329 1,254 1,289 1,373 1,259 1,392 1,399 1,523 16,269 7%TotalTotalTotalTotal 22,853 18,315 21,682 18,788 20,278 17,917 15,036 16,245 15,968 16,024 16,508 20,028 219,642 100%
(Unit: 1,000 barrels per year)2003200320032003 1111 2222 3333 4444 5555 6666 7777 8888 9999 10101010 11111111 12121212 TotalTotalTotalTotal BreakdownBreakdownBreakdownBreakdown
Refining Capa.Refining Capa.Refining Capa.Refining Capa. 23,75823,75823,75823,758 23,75823,75823,75823,758 23,75823,75823,75823,758 23,75823,75823,75823,758 23,75823,75823,75823,758 23,75823,75823,75823,758 23,75823,75823,75823,758 23,75823,75823,75823,758 23,75823,75823,75823,758 23,75823,75823,75823,758 23,75823,75823,75823,758 23,75823,75823,75823,758 285,096285,096285,096285,096 GasolineGasolineGasolineGasoline 1,951 2,037 1,845 2,173 2,151 2,099 2,334 2,223 1,941 2,334 2,104 1,978 25,170 13%KeroseneKeroseneKeroseneKerosene 5,146 4,471 2,869 2,730 1,882 1,539 1,069 1,728 1,656 2,408 3,109 3,799 32,406 17%
DieselDieselDieselDiesel 4,446 3,807 4,348 3,839 4,362 4,455 3,444 4,052 3,910 4,120 4,744 4,543 50,070 27%NaphthaNaphthaNaphthaNaphtha 1,163 1,164 955 628 760 463 716 244 652 546 492 674 8,457 4%Fuel OilFuel OilFuel OilFuel Oil 5,657 4,877 5,381 4,651 3,902 2,998 2,558 3,033 3,120 3,905 4,089 4,146 48,317 26%AsphaltAsphaltAsphaltAsphalt 420 660 647 399 869 1,010 948 1,060 656 157 90 184 7,100 4%OthersOthersOthersOthers 1,467 1,338 1,391 1,264 1,330 1,876 1,295 1,357 1,306 1,365 1,467 1,538 16,994 9%TotalTotalTotalTotal 20,250 18,354 17,436 15,684 15,256 14,440 12,364 13,697 13,241 14,835 16,095 16,862 188,514 100%
(Unit: 1,000 barrels per year)2004200420042004 1111 2222 3333 4444 5555 6666 7777 8888 9999 10101010 11111111 12121212 TotalTotalTotalTotal BreakdownBreakdownBreakdownBreakdown
Refining Capa.Refining Capa.Refining Capa.Refining Capa. 23,87023,87023,87023,870 23,87023,87023,87023,870 23,87023,87023,87023,870 23,87023,87023,87023,870 23,87023,87023,87023,870 23,87023,87023,87023,870 23,87023,87023,87023,870 23,87023,87023,87023,870 23,87023,87023,87023,870 23,87023,87023,87023,870 23,87023,87023,87023,870 23,87023,87023,87023,870 286,440286,440286,440286,440 GasolineGasolineGasolineGasoline 2,082 1,612 2,081 2,042 2,152 1,966 2,326 2,074 2,014 1,829 2,352 2,329 24,859 11%KeroseneKeroseneKeroseneKerosene 4,158 3,479 4,154 2,659 2,103 1,981 2,270 2,346 2,163 3,473 2,586 4,494 35,866 16%
DieselDieselDieselDiesel 4,007 4,944 6,099 4,709 4,182 4,865 5,302 5,852 6,563 7,413 5,895 6,851 66,682 30%NaphthaNaphthaNaphthaNaphtha 489 981 1,149 963 577 378 1,173 515 932 1,047 1,135 1,233 10,572 5%Fuel OilFuel OilFuel OilFuel Oil 4,066 5,047 5,386 3,797 4,956 4,349 3,523 4,892 4,456 4,759 5,907 6,411 57,549 26%AsphaltAsphaltAsphaltAsphalt 175 165 201 101 739 1,131 994 1,035 1,134 1,036 990 848 8,549 4%OthersOthersOthersOthers 1,432 1,586 1,431 1,406 1,294 1,298 1,243 1,340 1,200 1,243 1,247 1,352 16,072 7%TotalTotalTotalTotal 16,409 17,814 20,501 15,677 16,003 15,968 16,831 18,054 18,462 20,800 20,112 23,518 220,149 100%
(Unit: 1,000 barrels per year)2005200520052005 1111 2222 3333 4444 5555 6666 7777 8888 9999 10101010 11111111 12121212 TotalTotalTotalTotal BreakdownBreakdownBreakdownBreakdown
Refining Capa.Refining Capa.Refining Capa.Refining Capa. 24,97624,97624,97624,976 24,97624,97624,97624,976 24,97624,97624,97624,976 24,97624,97624,97624,976 24,97624,97624,97624,976 24,97624,97624,97624,976 24,97624,97624,97624,976 24,97624,97624,97624,976 24,97624,97624,97624,976 24,97624,97624,97624,976 24,97624,97624,97624,976 24,97624,97624,97624,976 299,712299,712299,712299,712 GasolineGasolineGasolineGasoline 1,894 1,668 1,945 1,745 2,068 1,962 1,872 2,150 1,898 1,968 1,871 1,889 22,930 9%KeroseneKeroseneKeroseneKerosene 4,647 3,994 2,789 2,454 2,836 3,048 2,559 2,443 3,588 3,494 3,051 4,473 39,376 16%
DieselDieselDieselDiesel 6,117 4,637 7,615 5,708 7,695 9,405 6,911 7,532 8,513 7,235 8,018 6,973 86,359 35%NaphthaNaphthaNaphthaNaphtha 992 819 748 546 1,379 1,214 625 534 1,021 1,302 773 858 10,811 4%Fuel OilFuel OilFuel OilFuel Oil 6,714 5,991 5,294 4,576 4,250 4,394 4,475 4,605 4,806 4,823 5,802 6,246 61,976 25%AsphaltAsphaltAsphaltAsphalt 512 553 904 1,203 870 1,072 1,012 1,179 1,173 1,029 1,077 1,030 11,614 5%OthersOthersOthersOthers 1,397 1,417 1,483 1,499 1,333 1,318 1,475 1,373 1,292 1,310 1,307 1,407 16,611 7%TotalTotalTotalTotal 22,273 19,079 20,778 17,731 20,431 22,413 18,929 19,816 22,291 21,161 21,899 22,876 249,677 100%
(Unit: 1,000 barrels per year)2006(E)2006(E)2006(E)2006(E) 1111 2222 3333 4444 5555 6666 7777 8888 9999 10101010 11111111 12121212 TotalTotalTotalTotal BreakdownBreakdownBreakdownBreakdown
Refining Capa.Refining Capa.Refining Capa.Refining Capa. 24,33624,33624,33624,336 24,33624,33624,33624,336 24,33624,33624,33624,336 24,33624,33624,33624,336 24,33624,33624,33624,336 24,33624,33624,33624,336 24,33624,33624,33624,336 24,33624,33624,33624,336 24,33624,33624,33624,336 24,33624,33624,33624,336 24,33624,33624,33624,336 24,33624,33624,33624,336 292,032292,032292,032292,032 GasolineGasolineGasolineGasoline 1,862 1,724 1,898 1,723 1,888 1,709 1,914 2,343 1,880 1,949 1,872 2,001 22,763 10%KeroseneKeroseneKeroseneKerosene 3,225 2,854 2,846 2,870 2,274 2,145 2,263 3,345 2,906 3,349 3,511 3,516 35,104 15%
DieselDieselDieselDiesel 6,059 5,481 5,696 5,969 7,150 6,327 6,544 7,881 7,664 7,912 6,783 7,733 81,199 34%NaphthaNaphthaNaphthaNaphtha 897 712 346 257 303 366 298 784 1,502 950 969 1,116 8,500 4%Fuel OilFuel OilFuel OilFuel Oil 5,190 4,743 3,883 4,887 5,239 4,306 3,677 5,515 5,521 5,750 5,893 5,458 60,062 26%AsphaltAsphaltAsphaltAsphalt 687 771 1,097 797 1,037 1,304 1,059 1,041 1,008 832 1,044 1,155 11,832 5%OthersOthersOthersOthers 1,424 1,234 1,388 1,347 1,520 1,187 1,233 1,333 1,164 1,173 1,503 1,460 15,966 7%TotalTotalTotalTotal 19,344 17,519 17,154 17,850 19,411 17,344 16,988 22,242 21,645 21,915 21,575 22,439 235,426 100%
Accounts on which we foresee oil price to moderately flatten over the next 3~6
months are all ‘supply side’-driven: 1) OPEC’s public stance to keep oil price at
about USD55 per barrel; 2) future investments for oil production expected to come
on stream at a robust clip; 3) recent pick-up in rig counts; 4) unwinding of
speculative long positions in the oil futures market. Therefore, any hints of
recovery on ‘demand side’ can bring a multiplied effect. Incidentally, the recent
recovery of Asian cracking margin is further supported by the structural growth
prospect of China, as you can see in the Figure 48. Note that the temporarily
strong prices in the 1st half of 2006 didn’t have any help from this ‘demand
component’.
‘The Origin’ of SK’s Earning‘The Origin’ of SK’s Earning‘The Origin’ of SK’s Earning‘The Origin’ of SK’s Earning
Fig 49: SK’s throughputs by products
(Source: SK, DWS)
47
April 10, 2007 SK Corporation
Against favorable Singapore prices and margin, SK is expected to maintain an
unbroken pattern of solid earnings in its petroleum division over the next several
years.
In a mid-cycle or trough-to-trough basis, SK’s gross profit grew by a factor of
nearly 1.8 or at a geometric growth rate of 16% from 2002 to 2006 whereas
operating capital increased at an annual clip of only about 5%. This is attributed to
higher value-added product mix, along with more efficient use of capital. As you
can see in Figure 49, SK’s sales mix for its petroleum products shifted in favor of
more expensive diesel fuels since 2003.
We believe that it was a commendable, strategic move for SK to have taken the
necessary preparatory steps over the last few years with anticipation of supernormal
demand for middle distillates to come. Much of hyperbolic demand for middle
distillates was, of course, underpinned by ‘industrialization’ of China and other
emerging countries. But SK may have been one of only few companies that were
right in predicting that the China-induced pent-up demand would coincide with
‘motorization’ of the advanced economies and the mandate for cleaner fuel
mandates to be implemented worldwide. A couple of years ago, they were
probably uttering at their management meeting, “So…What then?”
“Well… ‘Segmental’ demand for sweet diesel fuel?
‘In the Know’ about Dieselization‘In the Know’ about Dieselization‘In the Know’ about Dieselization‘In the Know’ about Dieselization
Diesel, once ignored as the ugly stepchild of the fossil fuel family, is making a
comeback in a big way. Notwithstanding China’s continued need of more off-road
diesel fuels for industrial use, the turnaround catalyst for diesel should stem from
the American consumers’ embracing the diesel engine vehicles. We believe that
this development will dramatically reshape the dynamic of petroleum prices going
forward.
Simply put, if ‘clean’ and delivered on time, diesel fuel has the highest utility among
all the types of internal-combustion engines for running a car as diesel engines
provide 20-to-40 percent better fuel economy and offer more torque at lower rpm
than gasoline. Thus, there lies a powerful impetus for the US policymakers to
encourage diesel-powered vehicles in the United States to reduce dependence on
foreign oil. According to the Department of Energy, if 30 percent of passenger cars
and light-duty trucks in the US had diesel engines, U.S. net crude oil imports would
be reduced by 400,000~500,000 barrels per day.
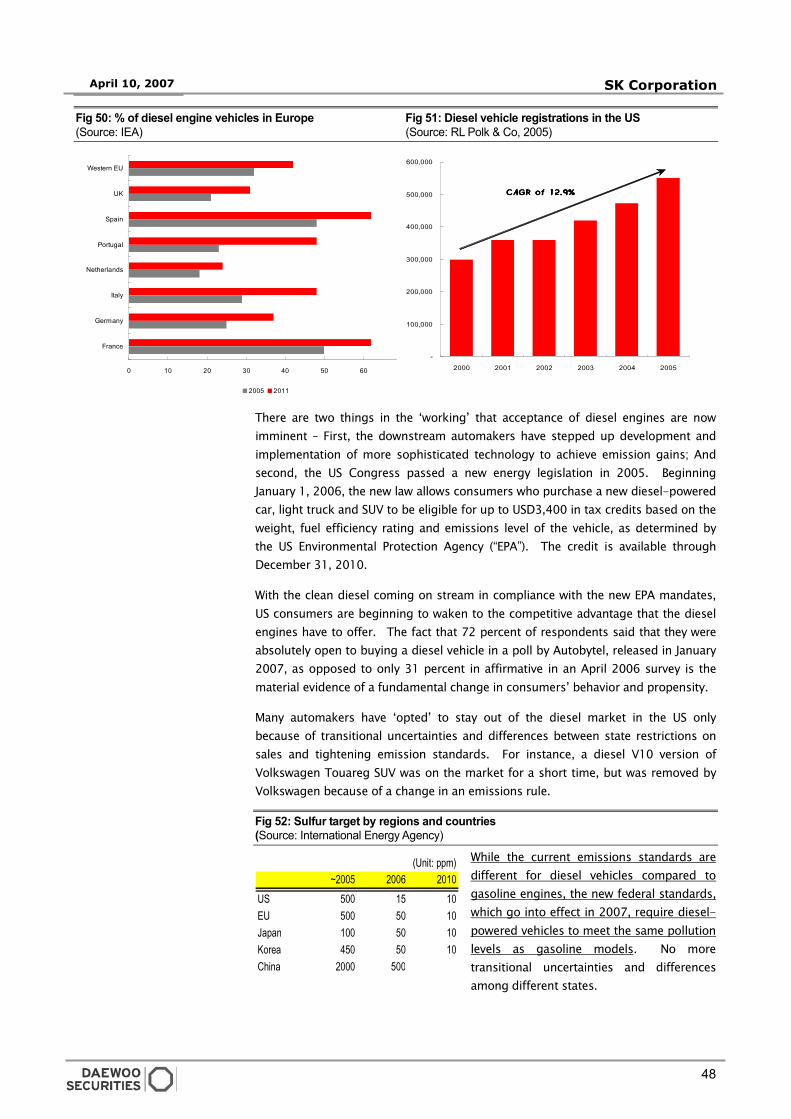
48
April 10, 2007 SK Corporation
0 10 20 30 40 50 60 70
France
Germany
Italy
Netherlands
Portugal
Spain
UK
Western EU
2005 2011
-
100,000
200,000
300,000
400,000
500,000
600,000
2000 2001 2002 2003 2004 2005
CAGR of 12.9%CAGR of 12.9%CAGR of 12.9%CAGR of 12.9%
(Unit: ppm)~2005 2006 2010
US 500 15 10EU 500 50 10Japan 100 50 10Korea 450 50 10China 2000 500
Fig 50: % of diesel engine vehicles in Europe Fig 51: Diesel vehicle registrations in the US
(Source: IEA) (Source: RL Polk & Co, 2005)
There are two things in the ‘working’ that acceptance of diesel engines are now
imminent – First, the downstream automakers have stepped up development and
implementation of more sophisticated technology to achieve emission gains; And
second, the US Congress passed a new energy legislation in 2005. Beginning
January 1, 2006, the new law allows consumers who purchase a new diesel-powered
car, light truck and SUV to be eligible for up to USD3,400 in tax credits based on the
weight, fuel efficiency rating and emissions level of the vehicle, as determined by
the US Environmental Protection Agency (“EPA”). The credit is available through
December 31, 2010.
With the clean diesel coming on stream in compliance with the new EPA mandates,
US consumers are beginning to waken to the competitive advantage that the diesel
engines have to offer. The fact that 72 percent of respondents said that they were
absolutely open to buying a diesel vehicle in a poll by Autobytel, released in January
2007, as opposed to only 31 percent in affirmative in an April 2006 survey is the
material evidence of a fundamental change in consumers’ behavior and propensity.
Many automakers have ‘opted’ to stay out of the diesel market in the US only
because of transitional uncertainties and differences between state restrictions on
sales and tightening emission standards. For instance, a diesel V10 version of
Volkswagen Touareg SUV was on the market for a short time, but was removed by
Volkswagen because of a change in an emissions rule.
Fig 52: Sulfur target by regions and countries
(Source: International Energy Agency)
While the current emissions standards are
different for diesel vehicles compared to
gasoline engines, the new federal standards,
which go into effect in 2007, require diesel-
powered vehicles to meet the same pollution
levels as gasoline models. No more
transitional uncertainties and differences
among different states.
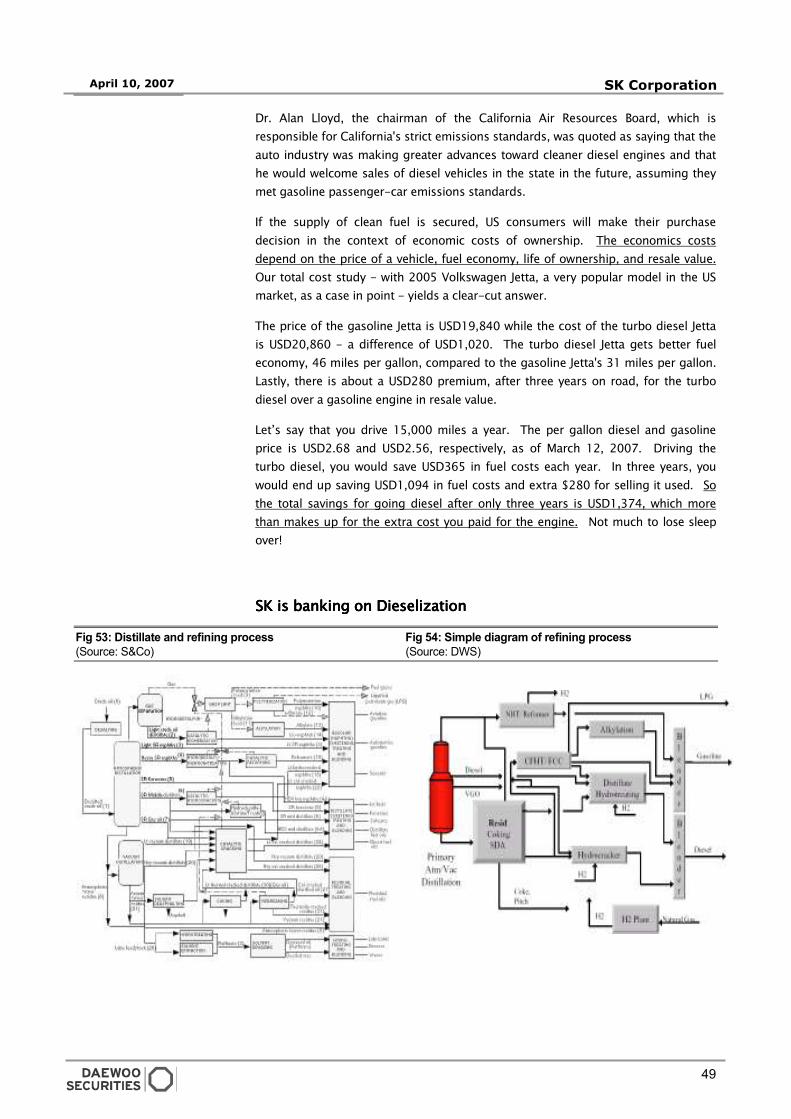
49
April 10, 2007 SK Corporation
Dr. Alan Lloyd, the chairman of the California Air Resources Board, which is
responsible for California's strict emissions standards, was quoted as saying that the
auto industry was making greater advances toward cleaner diesel engines and that
he would welcome sales of diesel vehicles in the state in the future, assuming they
met gasoline passenger-car emissions standards.
If the supply of clean fuel is secured, US consumers will make their purchase
decision in the context of economic costs of ownership. The economics costs
depend on the price of a vehicle, fuel economy, life of ownership, and resale value.
Our total cost study - with 2005 Volkswagen Jetta, a very popular model in the US
market, as a case in point - yields a clear-cut answer.
The price of the gasoline Jetta is USD19,840 while the cost of the turbo diesel Jetta
is USD20,860 - a difference of USD1,020. The turbo diesel Jetta gets better fuel
economy, 46 miles per gallon, compared to the gasoline Jetta's 31 miles per gallon.
Lastly, there is about a USD280 premium, after three years on road, for the turbo
diesel over a gasoline engine in resale value.
Let’s say that you drive 15,000 miles a year. The per gallon diesel and gasoline
price is USD2.68 and USD2.56, respectively, as of March 12, 2007. Driving the
turbo diesel, you would save USD365 in fuel costs each year. In three years, you
would end up saving USD1,094 in fuel costs and extra $280 for selling it used. So
the total savings for going diesel after only three years is USD1,374, which more
than makes up for the extra cost you paid for the engine. Not much to lose sleep
over!
SK is banking on DieselizationSK is banking on DieselizationSK is banking on DieselizationSK is banking on Dieselization
Fig 53: Distillate and refining process Fig 54: Simple diagram of refining process
(Source: S&Co) (Source: DWS)
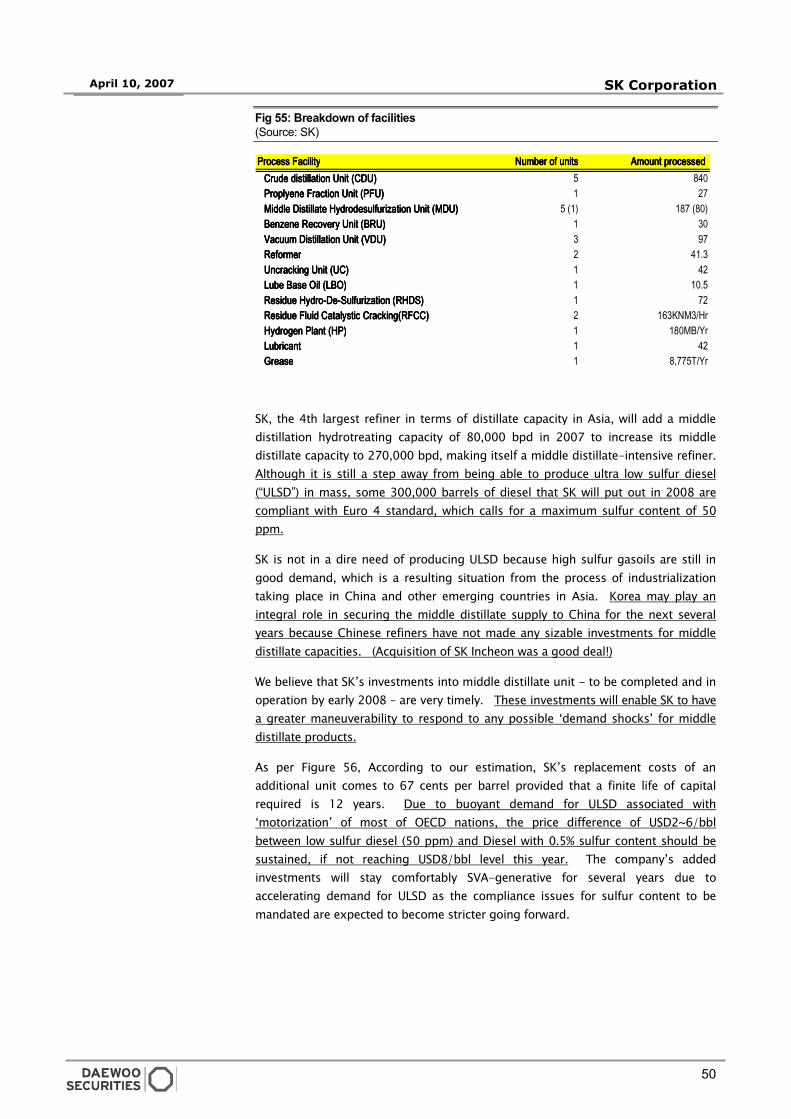
50
April 10, 2007 SK Corporation
Process FacilityProcess FacilityProcess FacilityProcess Facility Number of unitsNumber of unitsNumber of unitsNumber of units Amount processed Amount processed Amount processed Amount processed Crude distillation Unit (CDU)Crude distillation Unit (CDU)Crude distillation Unit (CDU)Crude distillation Unit (CDU) 5 840Proplyene Fraction Unit (PFU)Proplyene Fraction Unit (PFU)Proplyene Fraction Unit (PFU)Proplyene Fraction Unit (PFU) 1 27Middle Distillate Hydrodesulfurization Unit (MDU)Middle Distillate Hydrodesulfurization Unit (MDU)Middle Distillate Hydrodesulfurization Unit (MDU)Middle Distillate Hydrodesulfurization Unit (MDU) 5 (1) 187 (80)Benzene Recovery Unit (BRU)Benzene Recovery Unit (BRU)Benzene Recovery Unit (BRU)Benzene Recovery Unit (BRU) 1 30Vacuum Distillation Unit (VDU)Vacuum Distillation Unit (VDU)Vacuum Distillation Unit (VDU)Vacuum Distillation Unit (VDU) 3 97ReformerReformerReformerReformer 2 41.3Uncracking Unit (UC)Uncracking Unit (UC)Uncracking Unit (UC)Uncracking Unit (UC) 1 42Lube Base Oil (LBO)Lube Base Oil (LBO)Lube Base Oil (LBO)Lube Base Oil (LBO) 1 10.5Residue Hydro-De-Sulfurization (RHDS)Residue Hydro-De-Sulfurization (RHDS)Residue Hydro-De-Sulfurization (RHDS)Residue Hydro-De-Sulfurization (RHDS) 1 72Residue Fluid Catalystic Cracking(RFCC)Residue Fluid Catalystic Cracking(RFCC)Residue Fluid Catalystic Cracking(RFCC)Residue Fluid Catalystic Cracking(RFCC) 2 163KNM3/HrHydrogen Plant (HP)Hydrogen Plant (HP)Hydrogen Plant (HP)Hydrogen Plant (HP) 1 180MB/YrLubricantLubricantLubricantLubricant 1 42GreaseGreaseGreaseGrease 1 8,775T/Yr
Fig 55: Breakdown of facilities
(Source: SK)
SK, the 4th largest refiner in terms of distillate capacity in Asia, will add a middle
distillation hydrotreating capacity of 80,000 bpd in 2007 to increase its middle
distillate capacity to 270,000 bpd, making itself a middle distillate-intensive refiner.
Although it is still a step away from being able to produce ultra low sulfur diesel
(“ULSD”) in mass, some 300,000 barrels of diesel that SK will put out in 2008 are
compliant with Euro 4 standard, which calls for a maximum sulfur content of 50
ppm.
SK is not in a dire need of producing ULSD because high sulfur gasoils are still in
good demand, which is a resulting situation from the process of industrialization
taking place in China and other emerging countries in Asia. Korea may play an
integral role in securing the middle distillate supply to China for the next several
years because Chinese refiners have not made any sizable investments for middle
distillate capacities. (Acquisition of SK Incheon was a good deal!)
We believe that SK’s investments into middle distillate unit - to be completed and in
operation by early 2008 – are very timely. These investments will enable SK to have
a greater maneuverability to respond to any possible ‘demand shocks’ for middle
distillate products.
As per Figure 56, According to our estimation, SK’s replacement costs of an
additional unit comes to 67 cents per barrel provided that a finite life of capital
required is 12 years. Due to buoyant demand for ULSD associated with
‘motorization’ of most of OECD nations, the price difference of USD2~6/bbl
between low sulfur diesel (50 ppm) and Diesel with 0.5% sulfur content should be
sustained, if not reaching USD8/bbl level this year. The company’s added
investments will stay comfortably SVA-generative for several years due to
accelerating demand for ULSD as the compliance issues for sulfur content to be
mandated are expected to become stricter going forward.
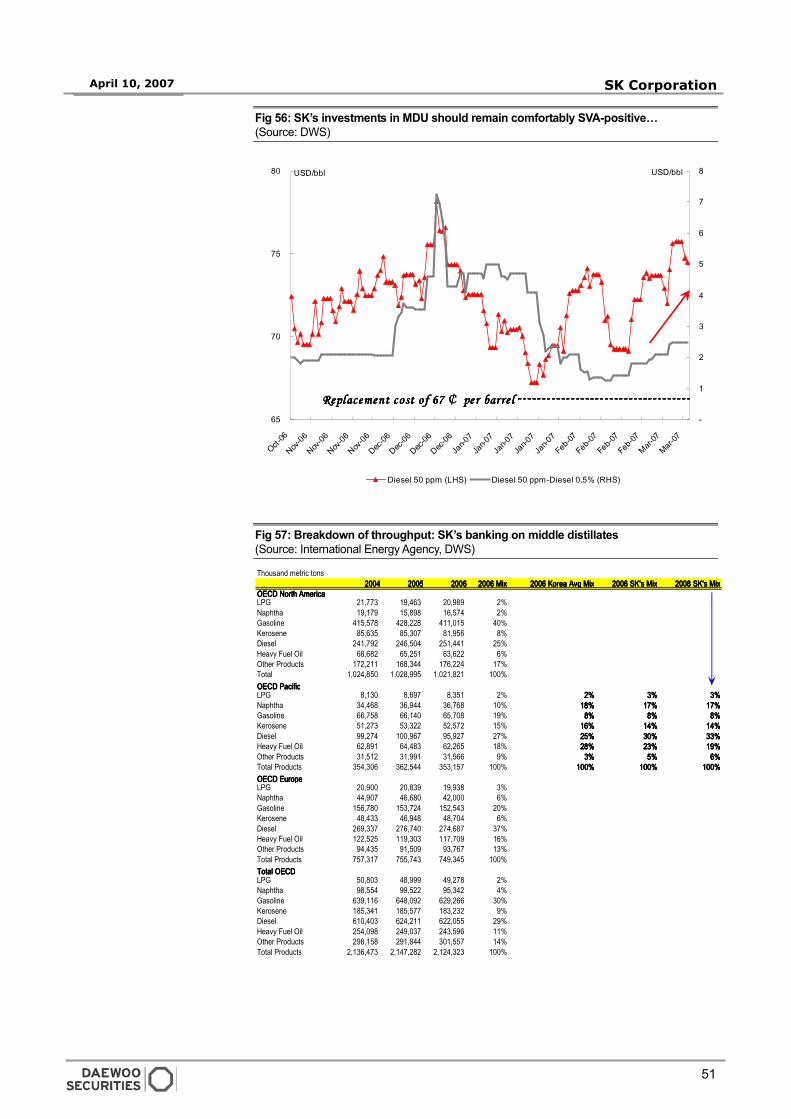
51
April 10, 2007 SK Corporation
Thousand metric tons2004200420042004 2005200520052005 2006200620062006 2006 Mix2006 Mix2006 Mix2006 Mix 2006 Korea Avg Mix2006 Korea Avg Mix2006 Korea Avg Mix2006 Korea Avg Mix 2006 SK's Mix2006 SK's Mix2006 SK's Mix2006 SK's Mix 2008 SK's Mix2008 SK's Mix2008 SK's Mix2008 SK's Mix
OECD North AmericaOECD North AmericaOECD North AmericaOECD North AmericaLPG 21,773 19,463 20,989 2%Naphtha 19,179 15,898 16,574 2%Gasoline 415,578 428,228 411,015 40%Kerosene 85,635 85,307 81,956 8%Diesel 241,792 246,504 251,441 25%Heavy Fuel Oil 68,682 65,251 63,622 6%Other Products 172,211 168,344 176,224 17%Total 1,024,850 1,028,995 1,021,821 100%OECD PacificOECD PacificOECD PacificOECD Pacific LPG 8,130 8,697 8,351 2% 2%2%2%2% 3%3%3%3% 3%3%3%3%Naphtha 34,468 36,944 36,768 10% 18%18%18%18% 17%17%17%17% 17%17%17%17%Gasoline 66,758 66,140 65,708 19% 8%8%8%8% 8%8%8%8% 8%8%8%8%Kerosene 51,273 53,322 52,572 15% 16%16%16%16% 14%14%14%14% 14%14%14%14%Diesel 99,274 100,967 95,927 27% 25%25%25%25% 30%30%30%30% 33%33%33%33%Heavy Fuel Oil 62,891 64,483 62,265 18% 28%28%28%28% 23%23%23%23% 19%19%19%19%Other Products 31,512 31,991 31,566 9% 3%3%3%3% 5%5%5%5% 6%6%6%6%Total Products 354,306 362,544 353,157 100% 100%100%100%100% 100%100%100%100% 100%100%100%100%OECD EuropeOECD EuropeOECD EuropeOECD Europe LPG 20,900 20,839 19,938 3%Naphtha 44,907 46,680 42,000 6%Gasoline 156,780 153,724 152,543 20%Kerosene 48,433 46,948 48,704 6%Diesel 269,337 276,740 274,687 37%Heavy Fuel Oil 122,525 119,303 117,709 16%Other Products 94,435 91,509 93,767 13%Total Products 757,317 755,743 749,345 100%Total OECDTotal OECDTotal OECDTotal OECD LPG 50,803 48,999 49,278 2%Naphtha 98,554 99,522 95,342 4%Gasoline 639,116 648,092 629,266 30%Kerosene 185,341 185,577 183,232 9%Diesel 610,403 624,211 622,055 29%Heavy Fuel Oil 254,098 249,037 243,596 11%Other Products 298,158 291,844 301,557 14%Total Products 2,136,473 2,147,282 2,124,323 100%
65
70
75
80
Oct-06
Nov-06
Nov-06
Nov-06
Nov-06
Dec-06
Dec-06
Dec-06
Dec-06
Jan-0
7
Jan-0
7
Jan-0
7
Jan-0
7
Jan-0
7
Feb-07
Feb-07
Feb-0
7
Feb-0
7
Mar-07
Mar-07
-
1
2
3
4
5
6
7
8
Diesel 50 ppm (LHS) Diesel 50 ppm-Diesel 0.5% (RHS)
USD/bbl USD/bbl
Replacement cost of 67Replacement cost of 67Replacement cost of 67Replacement cost of 67 ¢¢¢¢ per barrel per barrel per barrel per barrel
Fig 56: SK’s investments in MDU should remain comfortably SVA-positive…
(Source: DWS)
Fig 57: Breakdown of throughput: SK’s banking on middle distillates
(Source: International Energy Agency, DWS)
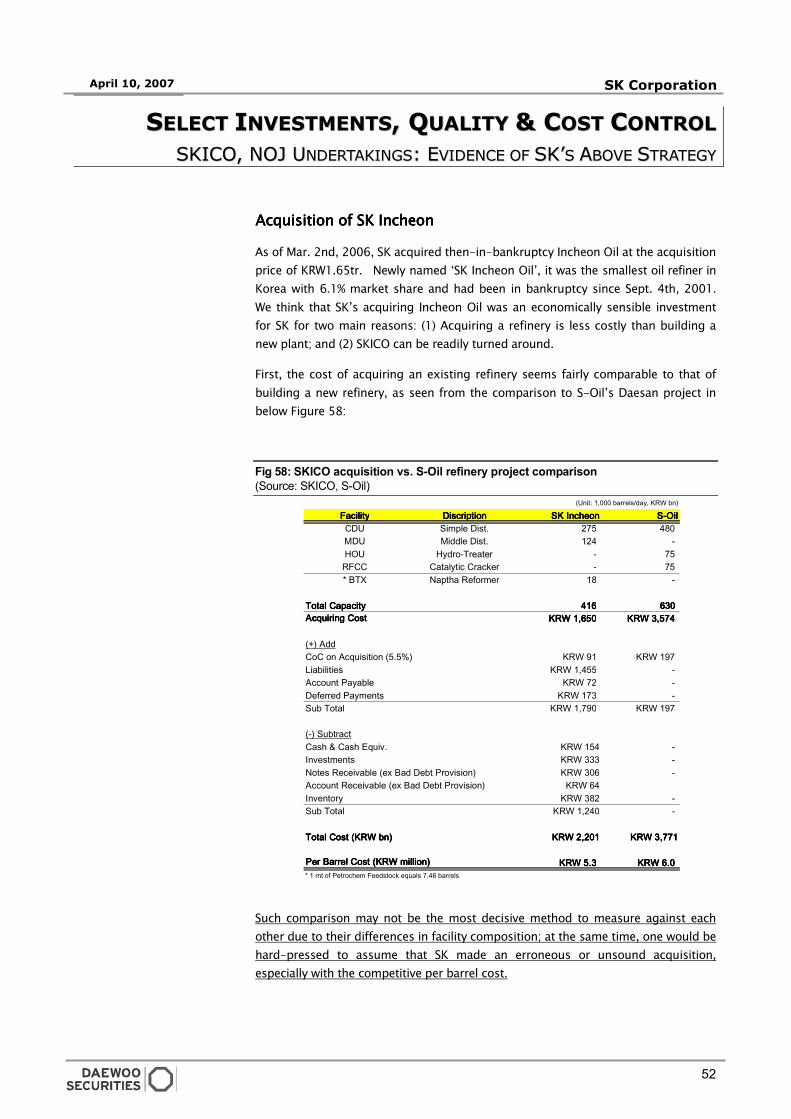
52
April 10, 2007 SK Corporation
SSEELLEECCTT IINNVVEESSTTMMEENNTTSS,, QQUUAALLIITTYY && CCOOSSTT CCOONNTTRROOLL
SSKKIICCOO,, NNOOJJ UUNNDDEERRTTAAKKIINNGGSS:: EEVVIIDDEENNCCEE OOFF SSKK’’SS AABBOOVVEE SSTTRRAATTEEGGYY
Acquisition of Acquisition of Acquisition of Acquisition of SK SK SK SK IncheonIncheonIncheonIncheon
As of Mar. 2nd, 2006, SK acquired then-in-bankruptcy Incheon Oil at the acquisition
price of KRW1.65tr. Newly named ‘SK Incheon Oil’, it was the smallest oil refiner in
Korea with 6.1% market share and had been in bankruptcy since Sept. 4th, 2001.
We think that SK’s acquiring Incheon Oil was an economically sensible investment
for SK for two main reasons: (1) Acquiring a refinery is less costly than building a
new plant; and (2) SKICO can be readily turned around.
First, the cost of acquiring an existing refinery seems fairly comparable to that of
building a new refinery, as seen from the comparison to S-Oil’s Daesan project in
below Figure 58:
Fig 58: SKICO acquisition vs. S-Oil refinery project comparison
(Source: SKICO, S-Oil)
Such comparison may not be the most decisive method to measure against each
other due to their differences in facility composition; at the same time, one would be
hard-pressed to assume that SK made an erroneous or unsound acquisition,
especially with the competitive per barrel cost.
(Unit: 1,000 barrels/day, KRW bn)
FacilityFacilityFacilityFacility DiscriptionDiscriptionDiscriptionDiscription SK IncheonSK IncheonSK IncheonSK Incheon S-OilS-OilS-OilS-OilCDU Simple Dist. 275 480 MDU Middle Dist. 124 - HOU Hydro-Treater - 75
RFCC Catalytic Cracker - 75 * BTX Naptha Reformer 18 -
Total CapacityTotal CapacityTotal CapacityTotal Capacity 416416416416 630630630630KRW 1,650KRW 1,650KRW 1,650KRW 1,650 KRW 3,574KRW 3,574KRW 3,574KRW 3,574
(+) AddCoC on Acquisition (5.5%) KRW 91 KRW 197Liabilities KRW 1,455 - Account Payable KRW 72 - Deferred Payments KRW 173 - Sub Total KRW 1,790 KRW 197
(-) SubtractCash & Cash Equiv. KRW 154 - Investments KRW 333 - Notes Receivable (ex Bad Debt Provision) KRW 306 - Account Receivable (ex Bad Debt Provision) KRW 64Inventory KRW 382 - Sub Total KRW 1,240 -
Total Cost (KRW bn)Total Cost (KRW bn)Total Cost (KRW bn)Total Cost (KRW bn) KRW 2,201KRW 2,201KRW 2,201KRW 2,201 KRW 3,771KRW 3,771KRW 3,771KRW 3,771
KRW 5.3KRW 5.3KRW 5.3KRW 5.3 KRW 6.0KRW 6.0KRW 6.0KRW 6.0* 1 mt of Petrochem Feedstock equals 7.46 barrels
Acquiring CostAcquiring CostAcquiring CostAcquiring Cost
Per Barrel Cost (KRW million)Per Barrel Cost (KRW million)Per Barrel Cost (KRW million)Per Barrel Cost (KRW million)
53
April 10, 2007 SK Corporation
Furthermore, we would like to point that the construction period for a refinery is
approximately 3.5 years, from the groundbreaking to complete operational state. This
translates to the fact that SKICO will have generated operating income in the
neighborhood of KRW147bn, assuming current level of annual operating profit (ex.
KRW42bn for 2006) while S-Oil works to complete the refinery, incurring interest and
time costs, along with possibly higher construction costs than expected in the process.
We also need to note that KRW42bn operating income was based on petroleum
utilization of only 56.8%.
With the economic competitiveness of acquiring Incheon Oil, we believe that SK will be
able to quickly turn around SKICO’s performance, drawing from its wealth of experience
and know-how obtained during over 40 years in the industry. In doing so, we
specifically expect SK to benefit from the following positive cascading effects from the
acquisition: (1) Becoming the 4th largest oil refiner in Asia, thereby increasing market
influence and recognition & (2) Gaining strategic leeway in terms of product and
geographical mix.
First, as the current SK’s refining capacity stands at 840K barrels per day, it will be added
on by 275k barrels per day, making the total distillation capacity be 1,115K barrels per
day for collective SK refining operation. On the petrochemical side, SK’s BTX capacity
will be expanded by 870K tons to 2,607K tons (from 1,737K tons). This places SK as
the 4th largest oil refiner in Asia in distillation capacity, allowing for the scale of
economy to compete with other Asian major refiners.
Second, besides obvious cost savings to be had from joint procurement, logistics, and
co-production, we strongly feel that SK gains the strategic leeway to use SKICO as the
lower-end product provider with emphasis on Chinese export while SK upgrades itself to
be the premium product producer with larger domestic dominance. We see the
evidence of this from the fact that SK will be the real benefactor for SKICO’s KRW1.65tr
hydrocraker facilities, raising SK’s cracker ratio from current 12% to 22% by 1st half of
2008. Although SKICO is financially responsible for the in-progress CAPEX for 80,000
bpd RHDS (Residue Hydro De-sulfurization) and 60,000-bpd RFCC (Residue Fluid
Catalytic Cracking) units, the real utility will be for SK simply because the project site is at
SK’s Ulsan complex.
In summary, by acquiring SKICO at a reasonable price, we think that SK has successfully
reached the critical mass and fortified its leadership position as one of key players in the
fastest growing Asia-Pacific region. Adding the second arm through SKICO will also
allow SK to have a greater flexibility and enhancement in many areas of operation, which,
in all likelihood, will be immediately materialized in a form of profit margin improvement.
As far as the listing of SKICO on Seoul and London, which has been discussed for quite
some time, we are not penciling it in for now. If goes through, it will likely be limited to
Seoul listing. There are three reasons why we think that it will or more accurately,
should be delayed. First, SK cannot get a good price for SKICO due to its track record or
lack thereof. Given that the world-class companies like BP and Royal Dutch Shell are
trading at a humble 8~9 times trailing net profit, there is a slim chance that SKICO can
debut itself with a kind of multiple palatable to SK. Second, we see a very little reason
for SK management to keep SK prices buoyed up for now. Last, more cash from the
listing will only spell dilemma for SK management. That SK’s vested interest in SKICO is
makes a more economic sense than share buyback or paring down the debt, SK will (and
should) likely put itself on hold for SKICO listing.
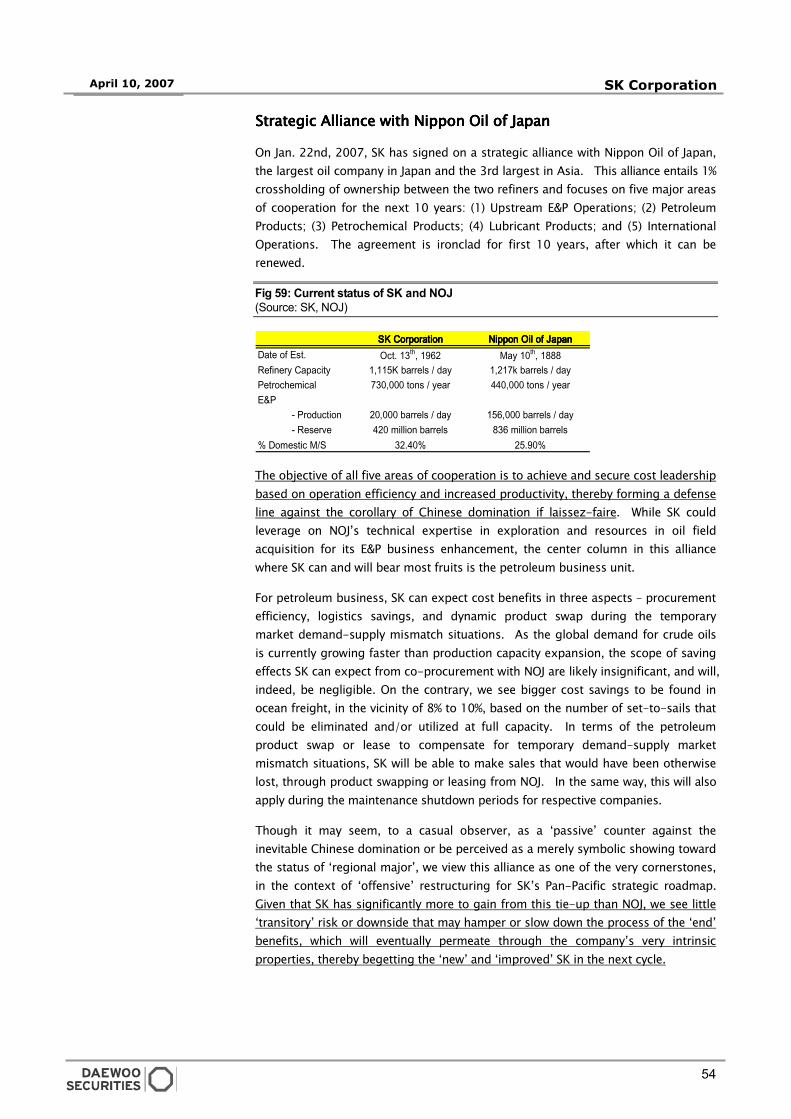
54
April 10, 2007 SK Corporation
Strategic Alliance with Nippon Oil of JapanStrategic Alliance with Nippon Oil of JapanStrategic Alliance with Nippon Oil of JapanStrategic Alliance with Nippon Oil of Japan
On Jan. 22nd, 2007, SK has signed on a strategic alliance with Nippon Oil of Japan,
the largest oil company in Japan and the 3rd largest in Asia. This alliance entails 1%
crossholding of ownership between the two refiners and focuses on five major areas
of cooperation for the next 10 years: (1) Upstream E&P Operations; (2) Petroleum
Products; (3) Petrochemical Products; (4) Lubricant Products; and (5) International
Operations. The agreement is ironclad for first 10 years, after which it can be
renewed.
Fig 59: Current status of SK and NOJ
(Source: SK, NOJ)
The objective of all five areas of cooperation is to achieve and secure cost leadership
based on operation efficiency and increased productivity, thereby forming a defense
line against the corollary of Chinese domination if laissez-faire. While SK could
leverage on NOJ’s technical expertise in exploration and resources in oil field
acquisition for its E&P business enhancement, the center column in this alliance
where SK can and will bear most fruits is the petroleum business unit.
For petroleum business, SK can expect cost benefits in three aspects – procurement
efficiency, logistics savings, and dynamic product swap during the temporary
market demand-supply mismatch situations. As the global demand for crude oils
is currently growing faster than production capacity expansion, the scope of saving
effects SK can expect from co-procurement with NOJ are likely insignificant, and will,
indeed, be negligible. On the contrary, we see bigger cost savings to be found in
ocean freight, in the vicinity of 8% to 10%, based on the number of set-to-sails that
could be eliminated and/or utilized at full capacity. In terms of the petroleum
product swap or lease to compensate for temporary demand-supply market
mismatch situations, SK will be able to make sales that would have been otherwise
lost, through product swapping or leasing from NOJ. In the same way, this will also
apply during the maintenance shutdown periods for respective companies.
Though it may seem, to a casual observer, as a ‘passive’ counter against the
inevitable Chinese domination or be perceived as a merely symbolic showing toward
the status of ‘regional major’, we view this alliance as one of the very cornerstones,
in the context of ‘offensive’ restructuring for SK’s Pan-Pacific strategic roadmap.
Given that SK has significantly more to gain from this tie-up than NOJ, we see little
‘transitory’ risk or downside that may hamper or slow down the process of the ‘end’
benefits, which will eventually permeate through the company’s very intrinsic
properties, thereby begetting the ‘new’ and ‘improved’ SK in the next cycle.
SK CorporationSK CorporationSK CorporationSK Corporation Nippon Oil of JapanNippon Oil of JapanNippon Oil of JapanNippon Oil of JapanDate of Est. Oct. 13th, 1962 May 10th, 1888Refinery Capacity 1,115K barrels / day 1,217k barrels / dayPetrochemical 730,000 tons / year 440,000 tons / yearE&P - Production 20,000 barrels / day 156,000 barrels / day - Reserve 420 million barrels 836 million barrels% Domestic M/S 32.40% 25.90%
55
April 10, 2007 SK Corporation
CCOONNCCLLUUSSIIOONN
Atypical and Asymmetrical Opportunities for SK Atypical and Asymmetrical Opportunities for SK Atypical and Asymmetrical Opportunities for SK Atypical and Asymmetrical Opportunities for SK
‘Reconfiguration’ of global supply chain – brought forth by the new manufacturing
paradigm of ‘price=cost’ – is changing how corporations are doing business as well
as how money is being managed in a profound fashion. Though not limited to
Korea, ramifications will be more visibly pronounced in Korea due to the nation’s
energy intensive nature. Sustainable opportunities for excess economic rents – a
situation that is atypical and asymmetrical by ‘convention’ - will continue to be
conceded to SK.
Supply Additions: Supply Additions: Supply Additions: Supply Additions: Simply a Simply a Simply a Simply a Dilemma or Dilemma or Dilemma or Dilemma or the Case of the Case of the Case of the Case of ‘Catch‘Catch‘Catch‘Catch----22’?22’?22’?22’?
Complicated by a number of ‘circumstantial’ entry barriers, supply additions have
not kept pace with the speed at which the demands (of emerging economies) are
growing as well as the new mandates (of sulfur target) are taking effect. Counter to
a casual expectation of capacity expansion, the Middle East and China are faced with
their respective dilemma for capacity additions. A little too short, a little too late,
outright capacity growth will continue to lag global oil demand growth.
SKICO & NOJ: Characteristic of SK’s Growth SKICO & NOJ: Characteristic of SK’s Growth SKICO & NOJ: Characteristic of SK’s Growth SKICO & NOJ: Characteristic of SK’s Growth StrategyStrategyStrategyStrategy
Acquisition of SK Incheon and alliance with Nippon Oil are well reflective of SK’s core
strategy for selective expansion, quality control, and cost management. We believe
both undertakings to be timely and value-generative, synchronously supporting the
company’s Pan-Pacific strategic roadmap. As far as the listing of SKICO on Seoul
and London, which has been discussed for quite some time, we are not penciling it
in for now.
We Are a Proponent of Primary Market ValueWe Are a Proponent of Primary Market ValueWe Are a Proponent of Primary Market ValueWe Are a Proponent of Primary Market Value
SK shares are trading at (‘economic’) book with cash yield of nearly 9%. Earning
visibility is set to rise on the back of earning surprises to be expected throughout
this year. With proliferation of buyout funds worldwide, we are betting that
financial investors will soon decide to buy this attractive value name.
Worth Worth Worth Worth KRW116,100~KRKRW116,100~KRKRW116,100~KRKRW116,100~KRW12W12W12W122222,,,,999900/Shr00/Shr00/Shr00/Shr,,,, a Consummate ‘Alpha’ Play a Consummate ‘Alpha’ Play a Consummate ‘Alpha’ Play a Consummate ‘Alpha’ Play
Our ‘primary’ market value-driven analysis makes it very hard to ignore SK shares
even after share performances that are nothing short of being superlative over the
last several years. SK is worth KRW116,100~KRW122,900 per share based on our
reference scenario with our forecast range of KRW89,000~KRW134,000 over the
next 12 months. More importantly, due to the asymmetry in economic rents to be
appropriated by SK and Korea Inc, SK shares provide visible rewards in a market-
neutral perspective. We have a strong conviction for an alpha-driven excess return
of 20+% over the next 12 months.
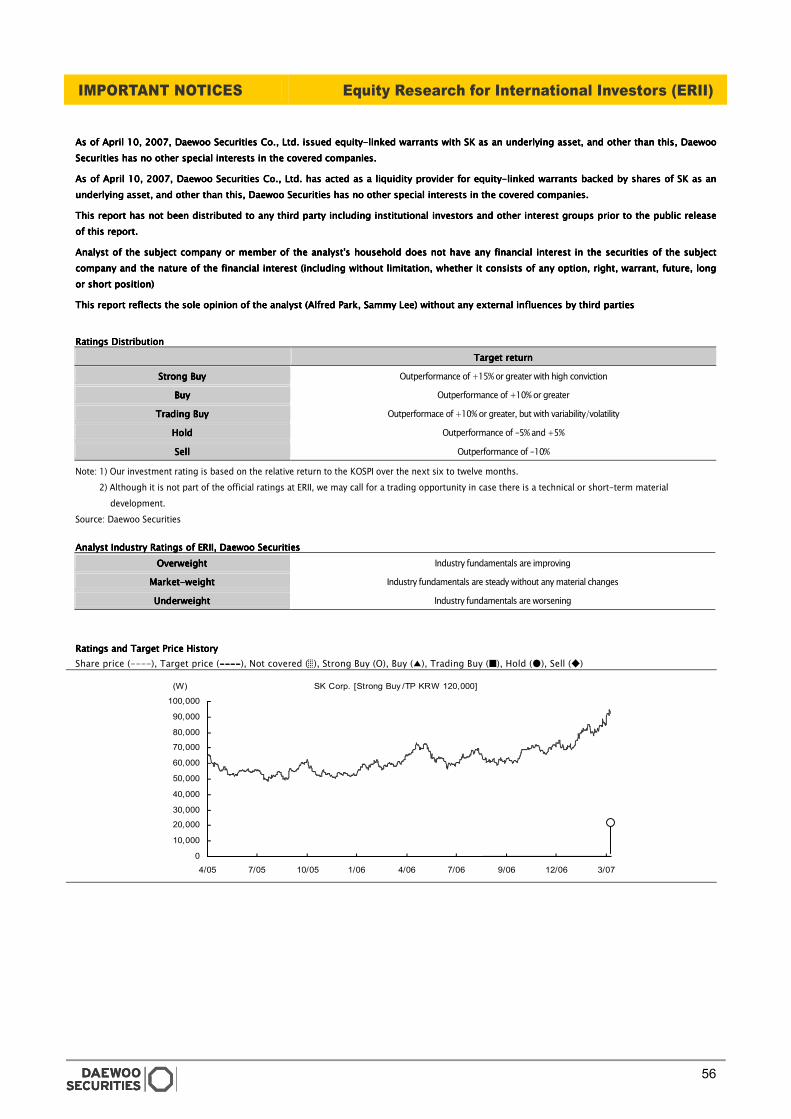
56
IMPORTANT NOTICES Equity Research for International Investors (ERII)
As of April 10, 2007, Daewoo Securities Co., Ltd. issued equityAs of April 10, 2007, Daewoo Securities Co., Ltd. issued equityAs of April 10, 2007, Daewoo Securities Co., Ltd. issued equityAs of April 10, 2007, Daewoo Securities Co., Ltd. issued equity----linked warrants linked warrants linked warrants linked warrants with SK as an underlying asset, and other than this, Daewoo with SK as an underlying asset, and other than this, Daewoo with SK as an underlying asset, and other than this, Daewoo with SK as an underlying asset, and other than this, Daewoo
Securities has no other special interests in the covered companies.Securities has no other special interests in the covered companies.Securities has no other special interests in the covered companies.Securities has no other special interests in the covered companies.
As of April 10, 2007, Daewoo Securities Co., Ltd. has acted as a liquidity provider for equityAs of April 10, 2007, Daewoo Securities Co., Ltd. has acted as a liquidity provider for equityAs of April 10, 2007, Daewoo Securities Co., Ltd. has acted as a liquidity provider for equityAs of April 10, 2007, Daewoo Securities Co., Ltd. has acted as a liquidity provider for equity----linked warrants backed by shares linked warrants backed by shares linked warrants backed by shares linked warrants backed by shares of SK as an of SK as an of SK as an of SK as an
underlying asset, and other than this, Daewoo Securities has no other special interests in the covered companies. underlying asset, and other than this, Daewoo Securities has no other special interests in the covered companies. underlying asset, and other than this, Daewoo Securities has no other special interests in the covered companies. underlying asset, and other than this, Daewoo Securities has no other special interests in the covered companies.
This report has not been distributed to any third party including institutional investors and other interest groups prior to the This report has not been distributed to any third party including institutional investors and other interest groups prior to the This report has not been distributed to any third party including institutional investors and other interest groups prior to the This report has not been distributed to any third party including institutional investors and other interest groups prior to the public release public release public release public release
of this report.of this report.of this report.of this report.
Analyst of the subject company or member of the analyst's household does not have any financial interest in the securities of the subject Analyst of the subject company or member of the analyst's household does not have any financial interest in the securities of the subject Analyst of the subject company or member of the analyst's household does not have any financial interest in the securities of the subject Analyst of the subject company or member of the analyst's household does not have any financial interest in the securities of the subject
company and the nature of the financial interest (including without limitation, whethercompany and the nature of the financial interest (including without limitation, whethercompany and the nature of the financial interest (including without limitation, whethercompany and the nature of the financial interest (including without limitation, whether it consists of any option, right, warrant, future, long it consists of any option, right, warrant, future, long it consists of any option, right, warrant, future, long it consists of any option, right, warrant, future, long
or short position)or short position)or short position)or short position)
This report reflects the sole opinion of the analyst (Alfred Park, Sammy Lee) without any external influences by third partiesThis report reflects the sole opinion of the analyst (Alfred Park, Sammy Lee) without any external influences by third partiesThis report reflects the sole opinion of the analyst (Alfred Park, Sammy Lee) without any external influences by third partiesThis report reflects the sole opinion of the analyst (Alfred Park, Sammy Lee) without any external influences by third parties
Ratings DistributionRatings DistributionRatings DistributionRatings Distribution
Target returnTarget returnTarget returnTarget return
Strong BuyStrong BuyStrong BuyStrong Buy Outperformance of +15% or greater with high conviction
BuyBuyBuyBuy Outperformance of +10% or greater
Trading BuyTrading BuyTrading BuyTrading Buy Outperformace of +10% or greater, but with variability/volatility
HoldHoldHoldHold Outperformance of -5% and +5%
SellSellSellSell Outperformance of -10%
Note: 1) Our investment rating is based on the relative return to the KOSPI over the next six to twelve months.
2) Although it is not part of the official ratings at ERII, we may call for a trading opportunity in case there is a technical or short-term material
development.
Source: Daewoo Securities
Analyst Industry Ratings of ERII, Daewoo SecuritiesAnalyst Industry Ratings of ERII, Daewoo SecuritiesAnalyst Industry Ratings of ERII, Daewoo SecuritiesAnalyst Industry Ratings of ERII, Daewoo Securities
OverweightOverweightOverweightOverweight Industry fundamentals are improving
MarketMarketMarketMarket----weightweightweightweight Industry fundamentals are steady without any material changes
UnderweightUnderweightUnderweightUnderweight Industry fundamentals are worsening
Ratings and Target Price HistoryRatings and Target Price HistoryRatings and Target Price HistoryRatings and Target Price History
Share price (----), Target price (----------------), Not covered (░), Strong Buy (O), Buy (▲), Trading Buy (■), Hold (●), Sell (◆)
SK Corp. [Strong Buy /TP KRW 120,000]
0
10,000
20,000
30,000
40,000
50,000
60,000
70,000
80,000
90,000
100,000
4/05 7/05 10/05 1/06 4/06 7/06 9/06 12/06 3/07
(W)
57
IMPORTANT NOTICES Equity Research for International Investors (ERII)
Daewoo Securities Co., Ltd. may have managed or co-managed a public offering of securities for the subject company, or received
compensation for investment banking services from the subject company in the past 12 months.
This report has been provided by the ERII (Equity Research for International Investors) department of Daewoo Securities Co., Ltd. Daewoo
Securities ERII is run independently of the research division of Daewoo Securities Co., Ltd. The stock ratings, target prices, estimates and
overall viewpoints of ERII may differ from the research division of Daewoo Securities. This report must be viewed as Daewoo Securities ERII's
independent opinion and must not be interpreted by any means as an official viewpoint of the research division of Daewoo Securities Co., Ltd.
Daewoo Securities ERII was established to service international institutional investors although the reports are released publicly. Investors
can access Daewoo Securities ERII's research through Firstcall, Daewoo research direct (www.bestez.com), Multex and Bloomberg (DWIR).
Daewoo Securities Co., Ltd. is a full-service, integrated investment banking, and brokerage firm. We are a leading underwriter of securities
and leading participant in virtually all trading markets. We have investment banking and other business relationships with a substantial
percentage of the companies covered by the research division of Daewoo Securities and Daewoo Securities ERII. Our research professionals
provide important input into our investment banking and other business selection process. Investors should assume that Daewoo Securities
Co., Ltd. are seeking or will seek investment banking or other business from the subject companies covered by this report and that the
research analysts who involved in preparing this report may participate in the solicitation of such business. Our research analysts’
compensation is determined based upon the activities and services intended to benefit the investors of Daewoo Securities Co., Ltd. Like all
employees of Daewoo Securities Co., Ltd., analysts receive compensation that is impacted by overall firm profitability, which includes
revenues from, among other business units, the intuitional equities, investment banking, proprietary trading, and private client division.
This document was prepared by Daewoo Securities Co., Ltd. (“Daewoo”). Information and opinions contained herein have been compiled from
sources believed to be reliable and in good faith. The information has not been independently verified. Daewoo makes no guarantee,
representation or warranty, express or implied, as to the fairness, accuracy or completeness of the information and opinions contained in
this document. Daewoo accepts no responsibility or liability whatsoever for any loss arising from the use of this document or its contents or
otherwise arising in connection therewith. Information and opinions contained herein are subject to change without notice. This document is
for information purposes only. It is not and should not be construed as an offer or solicitation of an offer to purchase or sell any securities or
other financial instruments. This document may not be reproduced, further distributed or published in whole or in part for any purpose.
This document is for distribution in the United Kingdom only to persons who are authorized persons or exempted persons within the
meaning of the Financial Services Act 1986 or any order made thereunder.
Daewoo’s U.S. affiliate, Daewoo Securities (America) Inc., distributes this document in the U.S. solely for “major U.S. institutional investors” as
defined in Rule 15a-6 of the U.S. Securities Exchange Act of 1934. Any U.S. recipient of this document who wishes to effect transactions in
any securities discussed herein should contact and place orders with Daewoo Securities (America) Inc.
DAEWOO SECURITIES INTERNATIONAL NETWORK
DAEWOO SECURITIES CO., LTDDAEWOO SECURITIES CO., LTDDAEWOO SECURITIES CO., LTDDAEWOO SECURITIES CO., LTD
150-716, 34-3, Youido-dong, Yongdungpo-ku, Seoul, Korea
Tel : (822) 768-4143 Fax : (822) 768-2126
Contact: Alfred Park [email protected]
Daewoo Securities (Europe) Ltd.Daewoo Securities (Europe) Ltd.Daewoo Securities (Europe) Ltd.Daewoo Securities (Europe) Ltd.
41st floor, Tower 42, 25 Old Broad Street,
London EC2N 1HQ, U.K.
Tel : 4420-7982-8000 Fax : 4420-7982-8040
Contact: Sean Kang [email protected]
Daewoo Securities (America) Inc.Daewoo Securities (America) Inc.Daewoo Securities (America) Inc.Daewoo Securities (America) Inc.
600 Lexington Avenue, Suite 301
New York, NY 10022 U.S.A.
Tel : 1212-407-1000 Fax : 1212-407-1010
Contact: Joel Choi [email protected]
Daewoo SecuritiesDaewoo SecuritiesDaewoo SecuritiesDaewoo Securities (Hong Kong) Ltd. (Hong Kong) Ltd. (Hong Kong) Ltd. (Hong Kong) Ltd.
Suite 816-819, Jardine House,
1 Connaught Place, Central, H.K., China
Tel : 852-2845-6332 Fax : 852-2845-5374
Contact: H. J. Ahn [email protected]
Tokyo Representative OfficeTokyo Representative OfficeTokyo Representative OfficeTokyo Representative Office
Rm. 701 Build X, 2-1-11 Nihonbashikayaba-Cho,
Chuo-Ku, Tokyo, Japan
Tel : 813-5642-6070 Fax : 813-5642-6228
Contact: John Sejung Oh [email protected]