Embed Size (px)
Citation preview
Earnings Results 1Q15 May, 2015
2
Disclaimer
This presentation may contain certain forward-looking projections and trends that neither
represent realized financial results nor historical information.
These forward-looking projections and trends are subject to risk and uncertainty, and
future results may differ materially from the projections. Many of these risks and
uncertainties are related to factors that are beyond CCR’s ability to control or to estimate,
such as market conditions, currency swings, the behavior of other market participants, the
actions of regulatory agencies, the ability of the company to continue to obtain financing,
changes in the political and social context in which CCR operates or economic trends or
conditions, including changes in the rate of inflation and changes in consumer confidence
on a global, national or regional scale.
Readers are advised not to fully trust these projections and trends. CCR is not obliged to
publish any revision of these projections and trends that should reflect new events or
circumstances after the realization of this presentation.
3
Agenda
Highlights
Results Analysis
Perspectives
TRAFFIC:
Proforma consolidated traffic1 fell by 3.8% in 1Q15.
TOLLS COLLECTED BY ELECTRONIC MEANS:
The number of STP users increased by 11.3% over March 2014, reaching 4,926,000
active tags.
ADJUSTED EBITDA:
Same-basis2 adjusted proforma EBITDA increased by 2.8%, with an margin of 65.6%
(-0.9 p.p.).
NET INCOME:
Same-basis2 net income totaled R$312.6 million, a 13.8% reduction in 1Q15.
4
1Q15 Highlights
1 Including the proportional results of jointly-owned subsidiaries. 2 “Same-basis” amounts exclude: (i) BH Airport; (ii) new businesses, which are not operating yet: Metrô Bahia and MSVia; (iii) non-recurring items from tax
provision for the Bridge; and (iv) in profit and pro-forma comparisons, it excludes Controlar, ViaRio and VLT.
5
Subsequent Events
DIVIDENDS:
The Annual and Extraordinary Shareholders’ Meeting held on April 16, 2015 approved the
distribution of complementary dividends totaling R$100.8 million, representing
approximately R$0.06 per share. The payments began on April 30, 2015.
1- Net revenue excludes construction revenue.
2- Same-basis” amounts exclude: (i) BH Airport; (ii) new businesses, which are not operating yet: Metrô Bahia and MSVia; (iii) non-recurring items from tax provision
for Ponte; and (iv) in profit and pro-forma comparisons, it excludes Controlar, ViaRio and VLT.
3- Calculated by adding net revenue, construction revenue, costs of services and administrative expenses
4- The adjusted EBIT and EBITDA margins were calculated by dividing EBIT and EBITDA by net revenue, excluding construction revenue, as required by IFRS,
whose counter-entry of the same amount impacts total costs.
5- Calculated excluding non-cash expenses: depreciation and amortization, the provision for maintenance and the recognition of prepaid concession expenses.
6
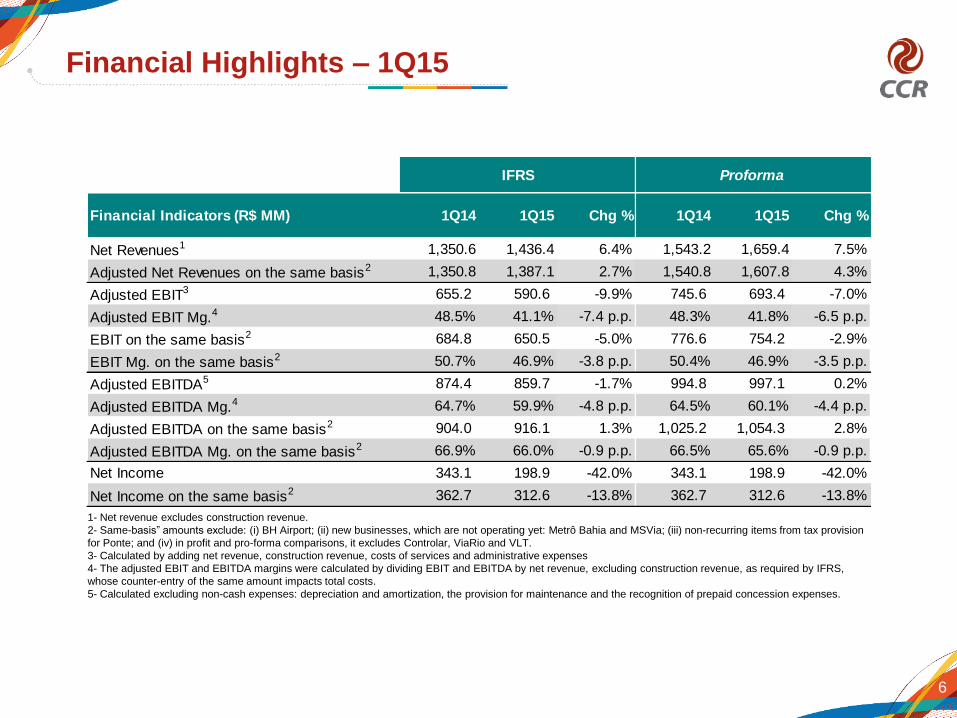
Financial Highlights – 1Q15
Net Revenues1 1,350.6 1,436.4 6.4% 1,543.2 1,659.4 7.5%
Adjusted Net Revenues on the same basis2 1,350.8 1,387.1 2.7% 1,540.8 1,607.8 4.3%
Adjusted EBIT3 655.2 590.6 -9.9% 745.6 693.4 -7.0%
Adjusted EBIT Mg.4 48.5% 41.1% -7.4 p.p. 48.3% 41.8% -6.5 p.p.
EBIT on the same basis2 684.8 650.5 -5.0% 776.6 754.2 -2.9%
EBIT Mg. on the same basis2 50.7% 46.9% -3.8 p.p. 50.4% 46.9% -3.5 p.p.
Adjusted EBITDA5 874.4 859.7 -1.7% 994.8 997.1 0.2%
Adjusted EBITDA Mg.4 64.7% 59.9% -4.8 p.p. 64.5% 60.1% -4.4 p.p.
Adjusted EBITDA on the same basis2 904.0 916.1 1.3% 1,025.2 1,054.3 2.8%
Adjusted EBITDA Mg. on the same basis2 66.9% 66.0% -0.9 p.p. 66.5% 65.6% -0.9 p.p.
Net Income 343.1 198.9 -42.0% 343.1 198.9 -42.0%
Net Income on the same basis2 362.7 312.6 -13.8% 362.7 312.6 -13.8%
Proforma
Financial Indicators (R$ MM) 1Q14 1Q15 Chg %
IFRS
1Q14 1Q15 Chg %
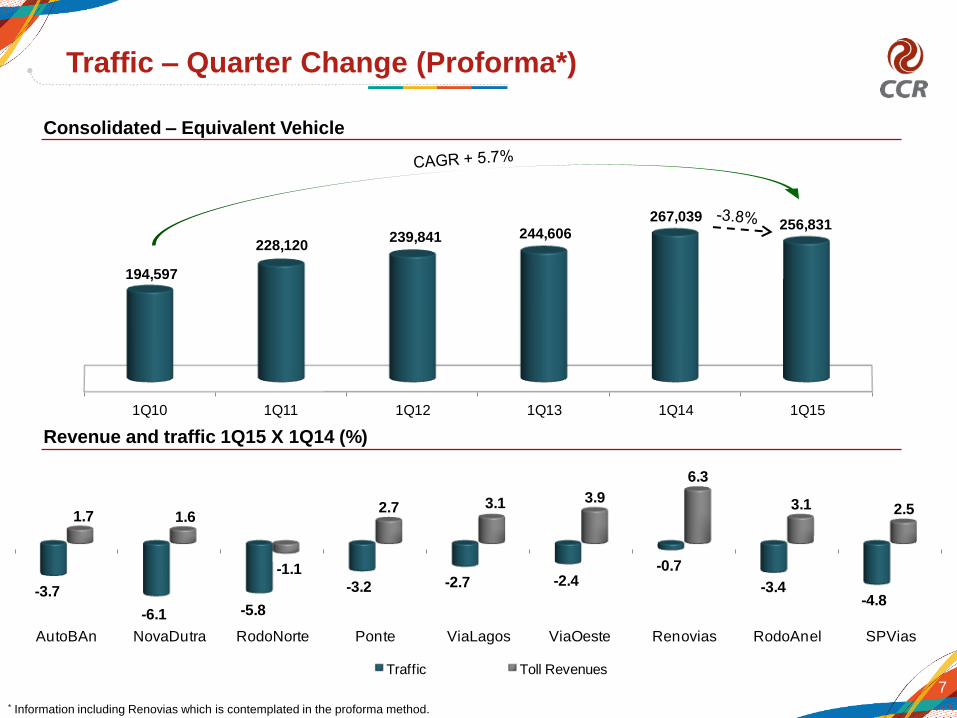
1Q10 1Q11 1Q12 1Q13 1Q14 1Q15
256,831
194,597
228,120 239,841 244,606
267,039
7
Traffic – Quarter Change (Proforma*)
Consolidated – Equivalent Vehicle
Revenue and traffic 1Q15 X 1Q14 (%)
* Information including Renovias which is contemplated in the proforma method.
AutoBAn NovaDutra RodoNorte Ponte ViaLagos ViaOeste Renovias RodoAnel SPVias
-3.7
-6.1 -5.8
-3.2 -2.7 -2.4-0.7
-3.4-4.8
1.7 1.6
-1.1
2.7 3.1 3.9
6.3
3.1 2.5
Traffic Toll Revenues
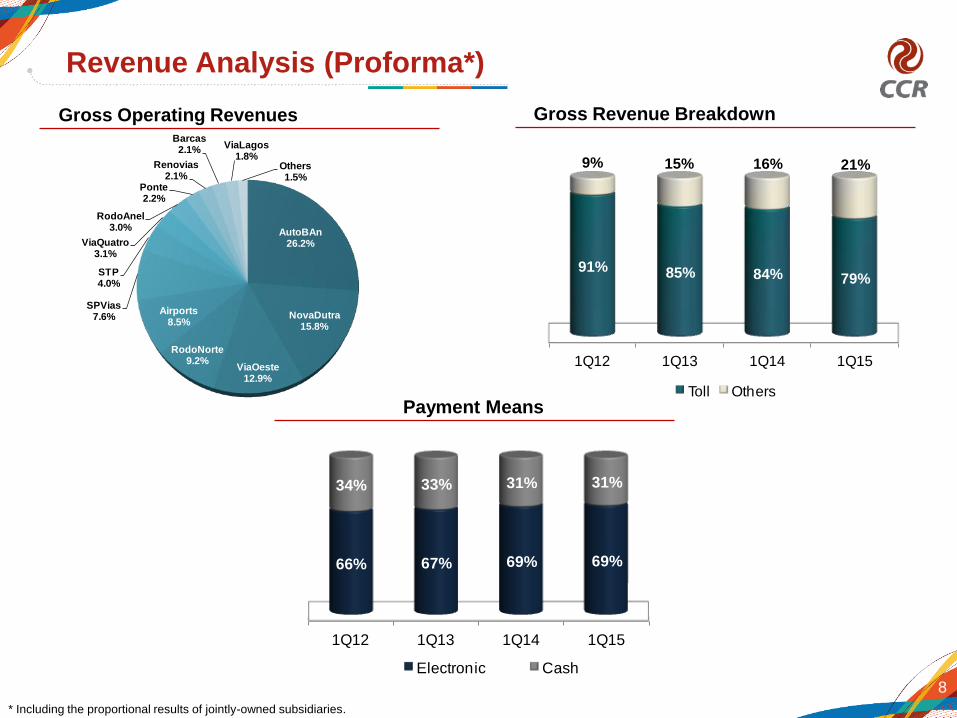
AutoBAn26.2%
NovaDutra15.8%
ViaOeste12.9%
RodoNorte9.2%
Airports8.5%
SPVias7.6%
STP4.0%
ViaQuatro3.1%
RodoAnel3.0%
Ponte2.2%
Renovias2.1%
Barcas2.1%
ViaLagos1.8%
Others1.5%
1Q12 1Q13 1Q14 1Q15
91% 85% 84% 79%
9% 15% 16% 21%
Toll Others
1Q12 1Q13 1Q14 1Q15
66% 67% 69% 69%
34% 33% 31% 31%
Electronic Cash
8
Revenue Analysis (Proforma*)
Payment Means
Gross Operating Revenues Gross Revenue Breakdown
* Including the proportional results of jointly-owned subsidiaries.
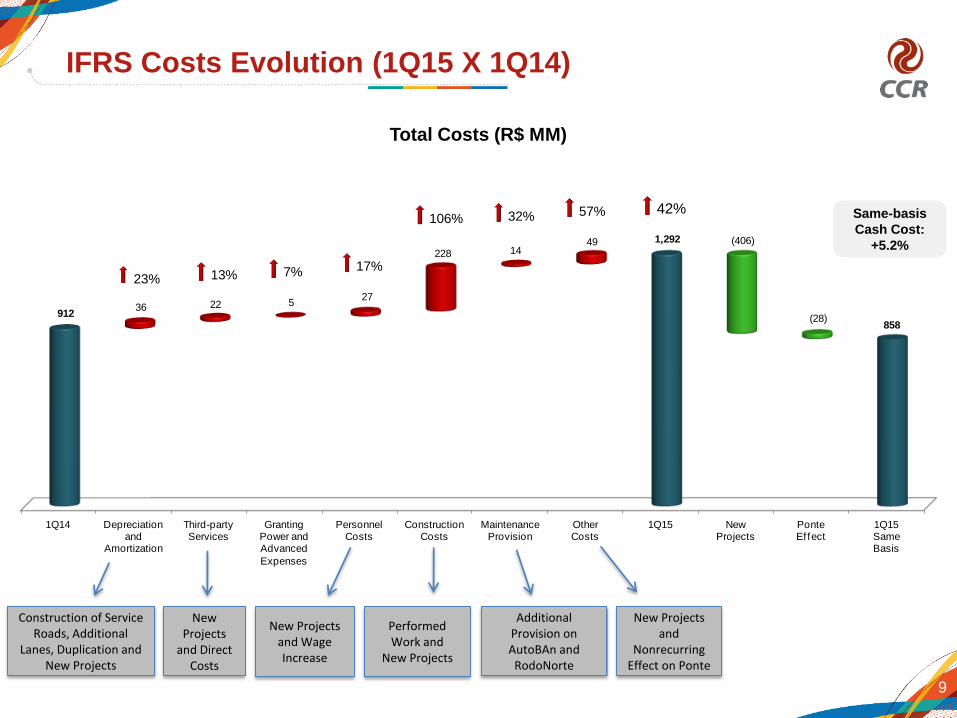
1Q14 Depreciationand
Amortization
Third-partyServices
GrantingPower andAdvanced
Expenses
PersonnelCosts
ConstructionCosts
MaintenanceProvision
OtherCosts
1Q15 NewProjects
PonteEffect
1Q15SameBasis
912
1,292
858
36 22 527
228 1449 (406)
(28)
9
IFRS Costs Evolution (1Q15 X 1Q14)
Total Costs (R$ MM)
Construction of Service Roads, Additional
Lanes, Duplication and New Projects
New Projects
and Direct Costs
New Projects and Wage Increase
Performed Work and
New Projects
Same-basis
Cash Cost:
+5.2%
Additional Provision on AutoBAn and RodoNorte
New Projects and
Nonrecurring Effect on Ponte
13% 17%
106% 42%
23%
32% 57%
7%
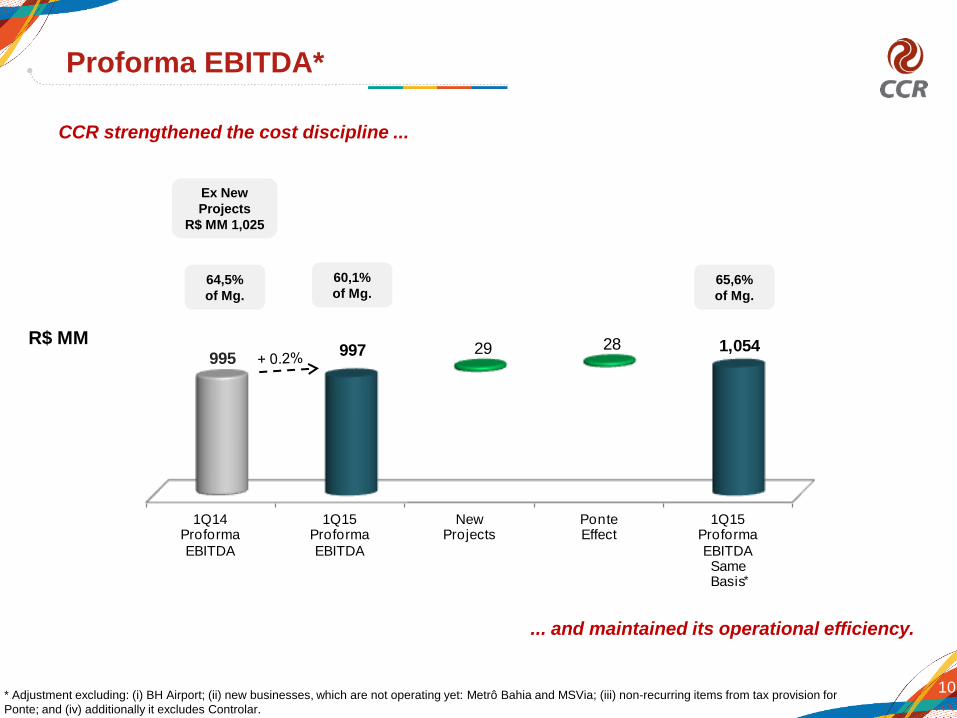
1Q14Proforma
EBITDA
1Q15Proforma
EBITDA
NewProjects
PonteEffect
1Q15Proforma
EBITDASameBasis
995997 28 1,05429
10
Proforma EBITDA*
64,5%
of Mg.
60,1%
of Mg. 65,6%
of Mg.
CCR strengthened the cost discipline ...
... and maintained its operational efficiency.
* Adjustment excluding: (i) BH Airport; (ii) new businesses, which are not operating yet: Metrô Bahia and MSVia; (iii) non-recurring items from tax provision for
Ponte; and (iv) additionally it excludes Controlar.
*
R$ MM
Ex New
Projects
R$ MM 1,025
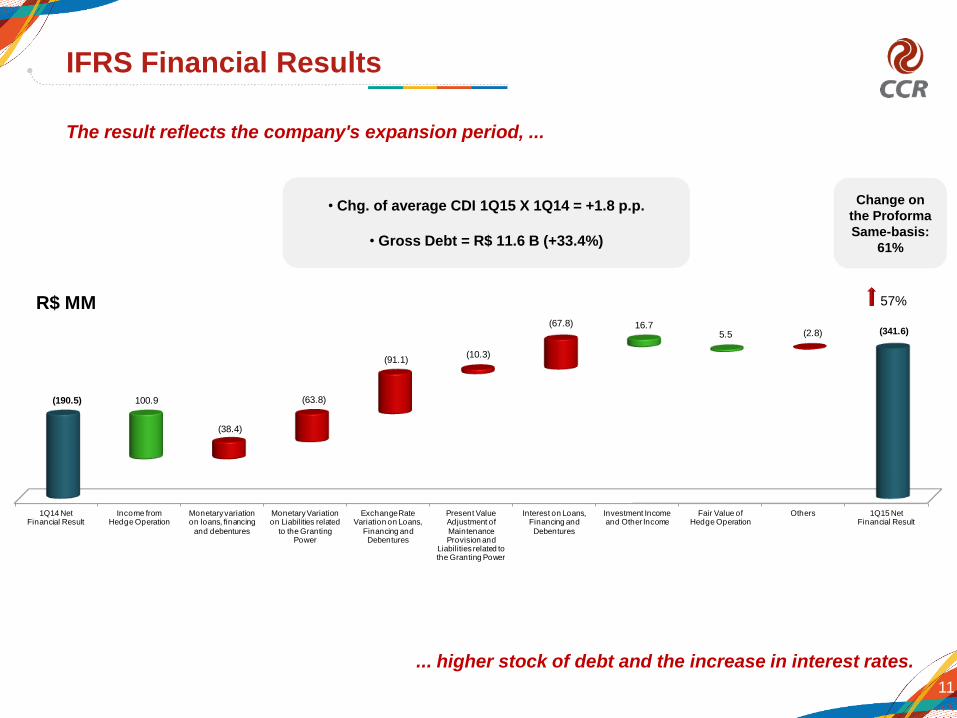
1Q14 NetFinancial Result
Income fromHedge Operation
Monetary variation on loans, financing
and debentures
Monetary Variation on Liabilities related
to the Granting Power
Exchange Rate Variation on Loans,
Financing and Debentures
Present Value Adjustment of
Maintenance Provision and
Liabilities related to the Granting Power
Interest on Loans, Financing and
Debentures
Investment Income and Other Income
Fair Value ofHedge Operation
Others 1Q15 NetFinancial Result
(190.5)
(2.8) (341.6)
100.9
(38.4)
(63.8)
(91.1) (10.3)
(67.8) 16.7 5.5
11
IFRS Financial Results
The result reflects the company's expansion period, ...
... higher stock of debt and the increase in interest rates.
57%
• Chg. of average CDI 1Q15 X 1Q14 = +1.8 p.p.
• Gross Debt = R$ 11.6 B (+33.4%)
R$ MM
Change on
the Proforma
Same-basis:
61%
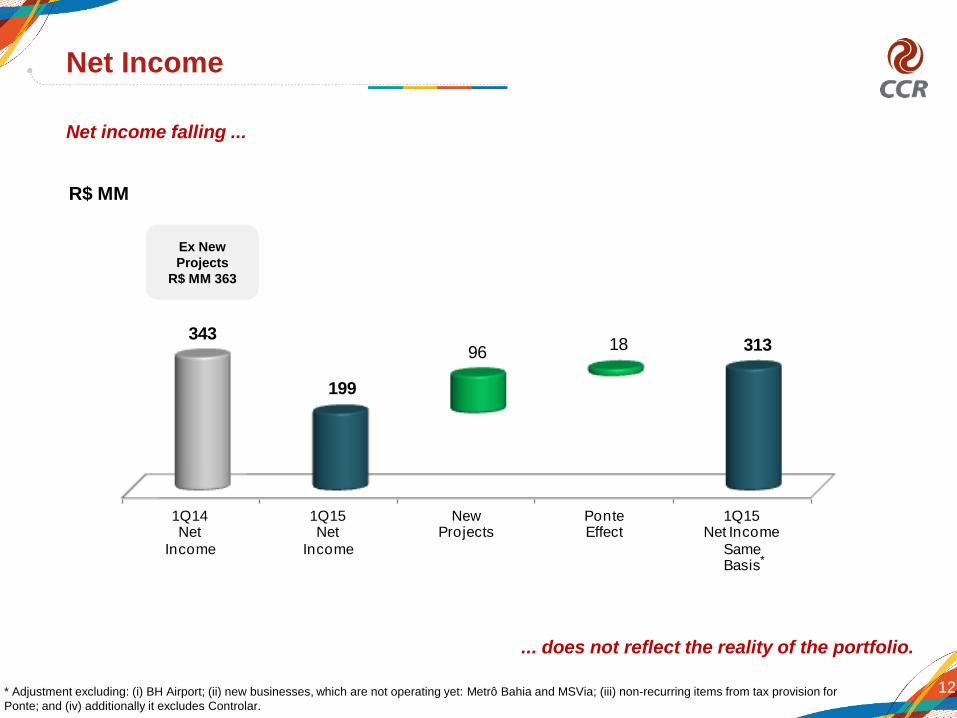
1Q14Net
Income
1Q15Net
Income
NewProjects
PonteEffect
1Q15Net Income
SameBasis
343
199
96 18 313
12
Net Income
R$ MM
Net income falling ...
... does not reflect the reality of the portfolio.
Ex New
Projects
R$ MM 363
* Adjustment excluding: (i) BH Airport; (ii) new businesses, which are not operating yet: Metrô Bahia and MSVia; (iii) non-recurring items from tax provision for
Ponte; and (iv) additionally it excludes Controlar.
*
13
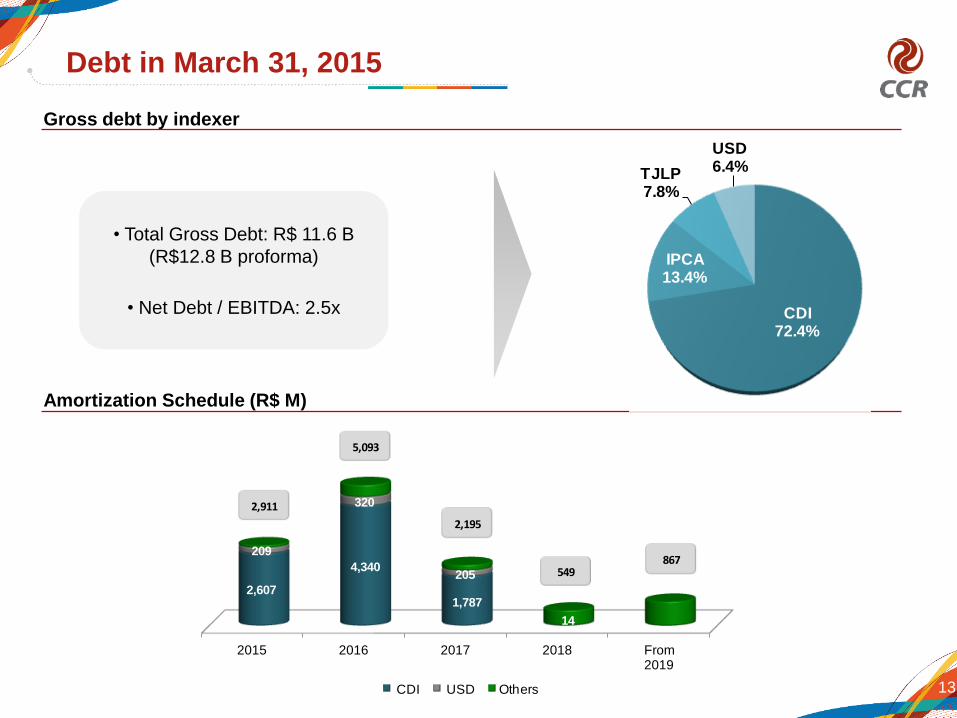
Debt in March 31, 2015
Gross debt by indexer
Amortization Schedule (R$ M)
• Total Gross Debt: R$ 11.6 B
(R$12.8 B proforma)
• Net Debt / EBITDA: 2.5x CDI
72.4%
IPCA13.4%
TJLP7.8%
USD6.4%
2015 2016 2017 2018 From2019
2,607
4,340
1,787
14
209
320
205
CDI USD Others
867549
2,195
5,093
2,911
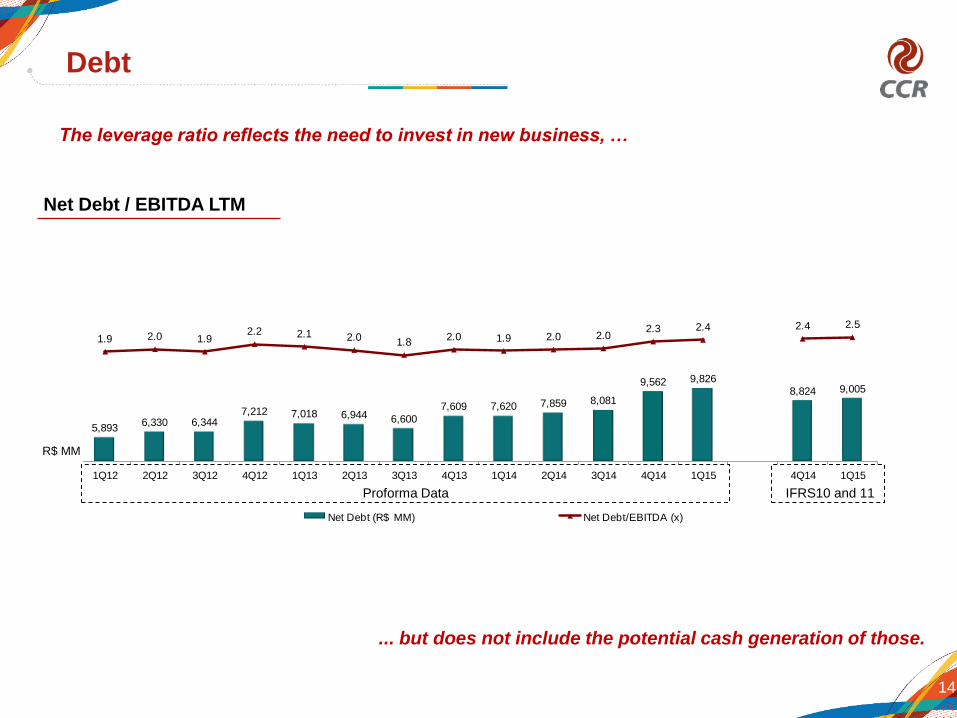
5,8936,330 6,344
7,212 7,018 6,944 6,600
7,609 7,620 7,859 8,081
9,562 9,826
8,824 9,005
1.9 2.0 1.92.2 2.1 2.0 1.8
2.0 1.9 2.0 2.02.3 2.4 2.4 2.5
-2,5
-1,5
-0,5
0,5
1,5
2,5
3,5
4.000
6.000
8.000
10.000
12.000
14.000
16.000
1Q12 2Q12 3Q12 4Q12 1Q13 2Q13 3Q13 4Q13 1Q14 2Q14 3Q14 4Q14 1Q15 4Q14 1Q15
Net Debt (R$ MM) Net Debt/EBITDA (x)
14
Debt
The leverage ratio reflects the need to invest in new business, …
... but does not include the potential cash generation of those.
Net Debt / EBITDA LTM
IFRS10 and 11
R$ MM
Proforma Data
15
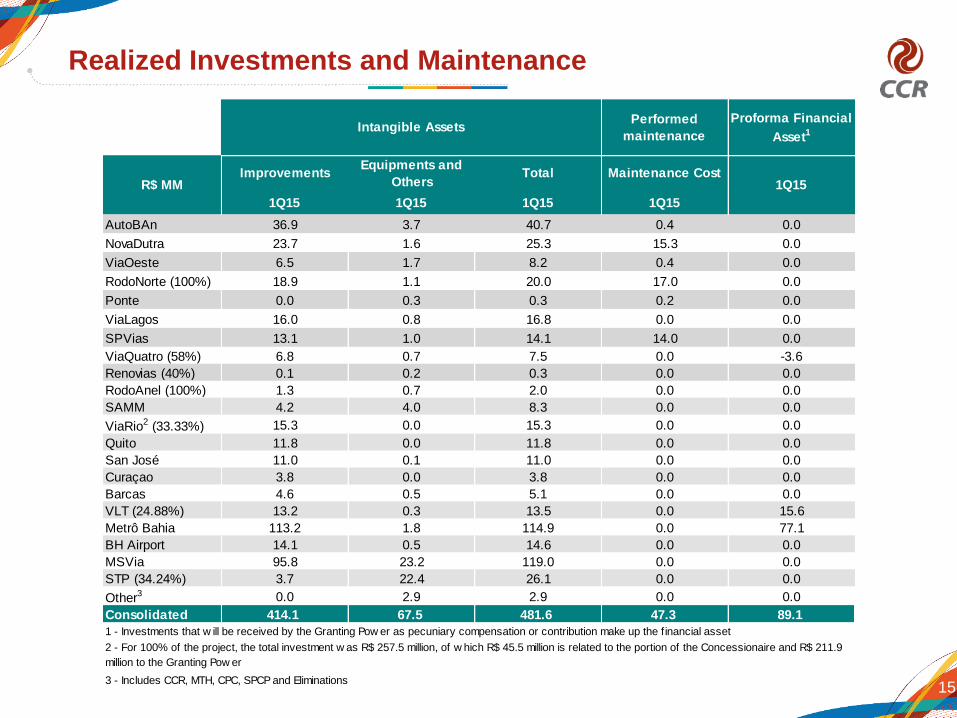
Realized Investments and Maintenance
1Q15 1Q15 1Q15 1Q15
AutoBAn 36.9 3.7 40.7 0.4 0.0
NovaDutra 23.7 1.6 25.3 15.3 0.0
ViaOeste 6.5 1.7 8.2 0.4 0.0
RodoNorte (100%) 18.9 1.1 20.0 17.0 0.0
Ponte 0.0 0.3 0.3 0.2 0.0
ViaLagos 16.0 0.8 16.8 0.0 0.0
SPVias 13.1 1.0 14.1 14.0 0.0
ViaQuatro (58%) 6.8 0.7 7.5 0.0 -3.6
Renovias (40%) 0.1 0.2 0.3 0.0 0.0
RodoAnel (100%) 1.3 0.7 2.0 0.0 0.0
SAMM 4.2 4.0 8.3 0.0 0.0
ViaRio2 (33.33%) 15.3 0.0 15.3 0.0 0.0
Quito 11.8 0.0 11.8 0.0 0.0
San José 11.0 0.1 11.0 0.0 0.0
Curaçao 3.8 0.0 3.8 0.0 0.0
Barcas 4.6 0.5 5.1 0.0 0.0
VLT (24.88%) 13.2 0.3 13.5 0.0 15.6
Metrô Bahia 113.2 1.8 114.9 0.0 77.1
BH Airport 14.1 0.5 14.6 0.0 0.0
MSVia 95.8 23.2 119.0 0.0 0.0
STP (34.24%) 3.7 22.4 26.1 0.0 0.0
Other3 0.0 2.9 2.9 0.0 0.0
Consolidated 414.1 67.5 481.6 47.3 89.1
1 - Investments that w ill be received by the Granting Pow er as pecuniary compensation or contribution make up the f inancial asset
3 - Includes CCR, MTH, CPC, SPCP and Eliminations
1Q15
2 - For 100% of the project, the total investment w as R$ 257.5 million, of w hich R$ 45.5 million is related to the portion of the Concessionaire and R$ 211.9
million to the Granting Pow er
Proforma Financial
Asset1
R$ MM
Intangible AssetsPerformed
maintenance
ImprovementsEquipments and
OthersTotal Maintenance Cost
16
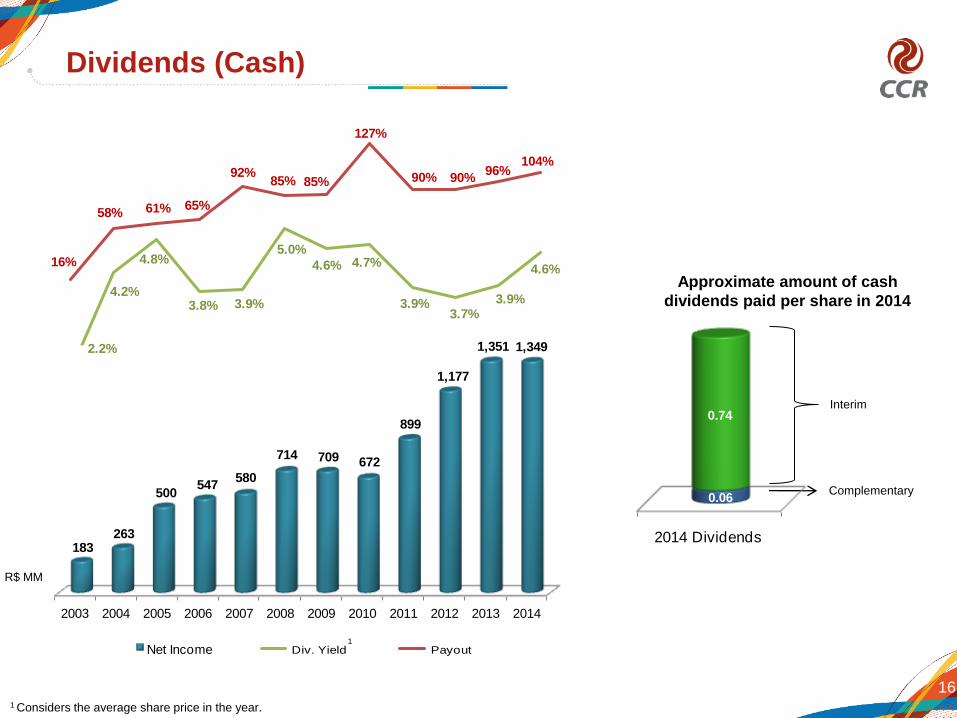
Dividends (Cash)
Interim
Complementary
Approximate amount of cash
dividends paid per share in 2014
R$ MM
1 Considers the average share price in the year.
2014 Dividends
0.06
0.74
2,2%
4.2%
4.8%
3.8% 3.9%
5.0%
4.6% 4.7%
3.9%3.7%
3.9%
4.6%16%
58% 61% 65%
92%85% 85%
127%
90% 90%96%
104%
-70%
-20%
30%
80%
130%
2,0%
3,0%
4,0%
5,0%
6,0%
7,0%
1 2 3 4 5 6 7 8 9 10 11 12
Div. Yield Payout
2003 2004 2005 2006 2007 2008 2009 2010 2011 2012 2013 2014
183263
500547
580
714 709 672
899
1,177
1,351 1,349
Net Income2%
4%
5%
4% 4%
5%5% 5%
4%
16%
58% 61% 65%
92%85% 85%
127%
90%
-70%
-20%
30%
80%
130%
2%
3%
4%
5%
6%
7%
1 2 3 4 5 6 7 8 9
Div. Yield Payout1
2.2%
4.2%
4.8%
3.8% 3.9%
5.0%
4.6% 4.7%
3.9%3.7%
3.9%
4.6%16%
58% 61% 65%
92%85% 85%
127%
90% 90%96%
104%
-70%
-20%
30%
80%
130%
2,0%
3,0%
4,0%
5,0%
6,0%
7,0%
1 2 3 4 5 6 7 8 9 10 11 12
Div. Yield Payout