Embed Size (px)
Citation preview
1 Public Public May 2015 X
1Q15 Earnings Presentation
May 15, 2015
Public
2
Forward Looking Statements
This presentation may contain certain statements that express the management’s expectations, beliefs and assumptions about future events or results. Such statements are not historical fact, being based on currently available competitive, financial and economic data, and on current projections about the industries BM&FBOVESPA works in.
The verbs “anticipate,” “believe,” “estimate,” “expect,” “forecast,” “plan,” “predict,” “project,” “target” and other similar verbs are intended to identify these forward-looking statements, which involve risks and uncertainties that could cause actual results to differ materially from those projected in this presentation and do not guarantee any future BM&FBOVESPA performance.
The factors that might affect performance include, but are not limited to: (i) market acceptance of BM&FBOVESPA services; (ii) volatility related to (a) the Brazilian economy and securities markets and (b) the highly-competitive industries BM&FBOVESPA operates in; (iii) changes in (a) domestic and foreign legislation and taxation and (b) government policies related to the financial and securities markets; (iv) increasing competition from new entrants to the Brazilian markets; (v) ability to keep up with rapid changes in technological environment, including the implementation of enhanced functionality demanded by BM&FBOVESPA customers; (vi) ability to maintain an ongoing process for introducing competitive new products and services, while maintaining the competitiveness of existing ones; (vii) ability to attract new customers in domestic and foreign jurisdictions; (viii) ability to expand the offer of BM&FBOVESPA products in foreign jurisdictions.
All forward-looking statements in this presentation are based on information and data available as of the date they were made, and BM&FBOVESPA undertakes no obligation to update them in light of new information or future development.
This presentation does not constitute an offer to sell or the solicitation of an offer to buy any securities, nor shall there be any sale of securities where such offer or sale would be unlawful prior to registration or qualification under the securities law. No offering shall be made except by means of a prospectus meeting the requirements of the Brazilian Securities Commission CVM Instruction 400 of 2003, as amended.
3
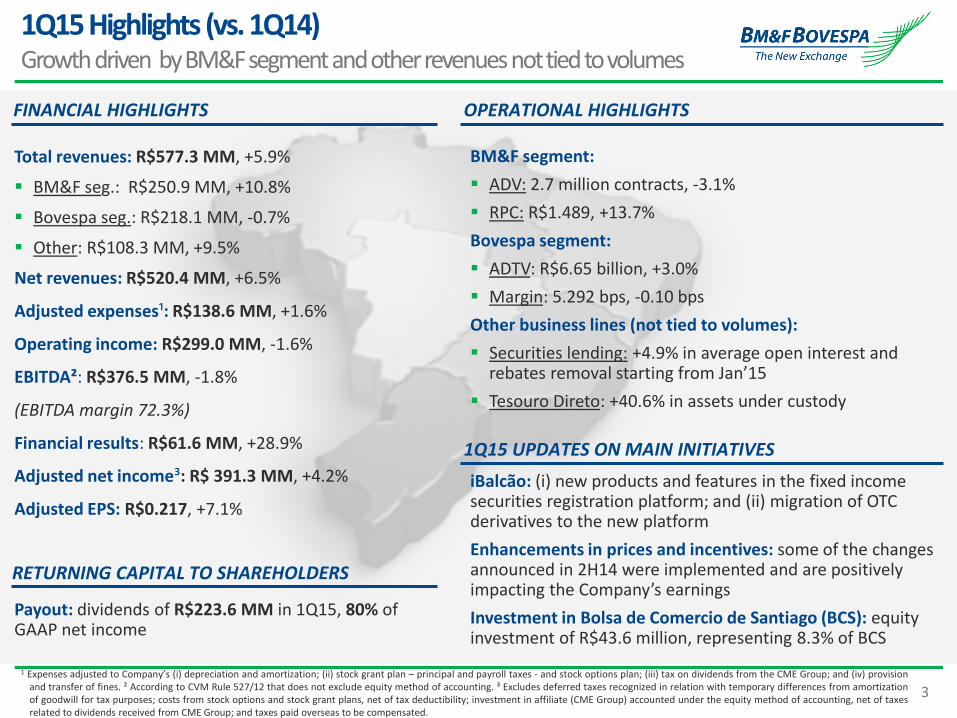
1Q15 Highlights (vs. 1Q14) Growth driven by BM&F segment and other revenues not tied to volumes
FINANCIAL HIGHLIGHTS OPERATIONAL HIGHLIGHTS
Total revenues: R$577.3 MM, +5.9%
BM&F seg.: R$250.9 MM, +10.8%
Bovespa seg.: R$218.1 MM, -0.7%
Other: R$108.3 MM, +9.5%
Net revenues: R$520.4 MM, +6.5%
Adjusted expenses¹: R$138.6 MM, +1.6%
Operating income: R$299.0 MM, -1.6%
EBITDA²: R$376.5 MM, -1.8%
(EBITDA margin 72.3%)
Financial results: R$61.6 MM, +28.9%
Adjusted net income³: R$ 391.3 MM, +4.2%
Adjusted EPS: R$0.217, +7.1%
Payout: dividends of R$223.6 MM in 1Q15, 80% of GAAP net income
RETURNING CAPITAL TO SHAREHOLDERS
BM&F segment:
ADV: 2.7 million contracts, -3.1%
RPC: R$1.489, +13.7%
Bovespa segment:
ADTV: R$6.65 billion, +3.0%
Margin: 5.292 bps, -0.10 bps
Other business lines (not tied to volumes):
Securities lending: +4.9% in average open interest and rebates removal starting from Jan’15
Tesouro Direto: +40.6% in assets under custody
1Q15 UPDATES ON MAIN INITIATIVES
iBalcão: (i) new products and features in the fixed income securities registration platform; and (ii) migration of OTC derivatives to the new platform
Enhancements in prices and incentives: some of the changes announced in 2H14 were implemented and are positively impacting the Company’s earnings
Investment in Bolsa de Comercio de Santiago (BCS): equity investment of R$43.6 million, representing 8.3% of BCS
1 Expenses adjusted to Company’s (i) depreciation and amortization; (ii) stock grant plan – principal and payroll taxes - and stock options plan; (iii) tax on dividends from the CME Group; and (iv) provision and transfer of fines. ² According to CVM Rule 527/12 that does not exclude equity method of accounting. ³ Excludes deferred taxes recognized in relation with temporary differences from amortization of goodwill for tax purposes; costs from stock options and stock grant plans, net of tax deductibility; investment in affiliate (CME Group) accounted under the equity method of accounting, net of taxes related to dividends received from CME Group; and taxes paid overseas to be compensated.
4
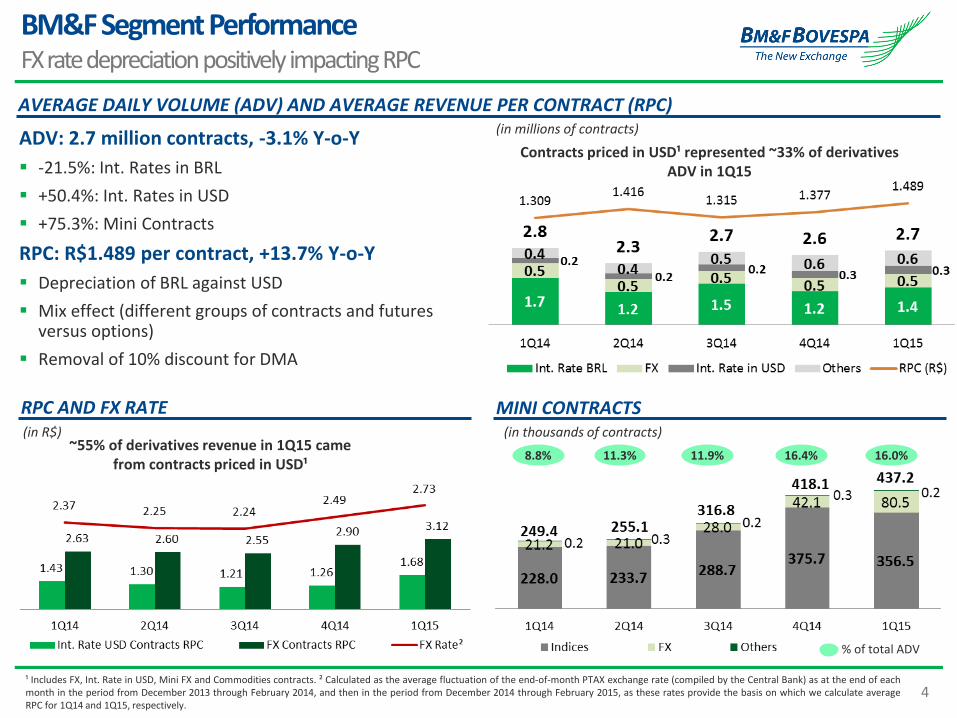
BM&F Segment Performance FX rate depreciation positively impacting RPC
ADV: 2.7 million contracts, -3.1% Y-o-Y
-21.5%: Int. Rates in BRL
+50.4%: Int. Rates in USD
+75.3%: Mini Contracts
RPC: R$1.489 per contract, +13.7% Y-o-Y
Depreciation of BRL against USD
Mix effect (different groups of contracts and futures versus options)
Removal of 10% discount for DMA
AVERAGE DAILY VOLUME (ADV) AND AVERAGE REVENUE PER CONTRACT (RPC)
MINI CONTRACTS
(in millions of contracts)
RPC AND FX RATE (in R$)
~55% of derivatives revenue in 1Q15 came from contracts priced in USD¹
¹ Includes FX, Int. Rate in USD, Mini FX and Commodities contracts. ² Calculated as the average fluctuation of the end-of-month PTAX exchange rate (compiled by the Central Bank) as at the end of each month in the period from December 2013 through February 2014, and then in the period from December 2014 through February 2015, as these rates provide the basis on which we calculate average RPC for 1Q14 and 1Q15, respectively.
Contracts priced in USD¹ represented ~33% of derivatives ADV in 1Q15
(in thousands of contracts)
% of total ADV
11.3% 11.9% 16.4% 16.0% 8.8%
5
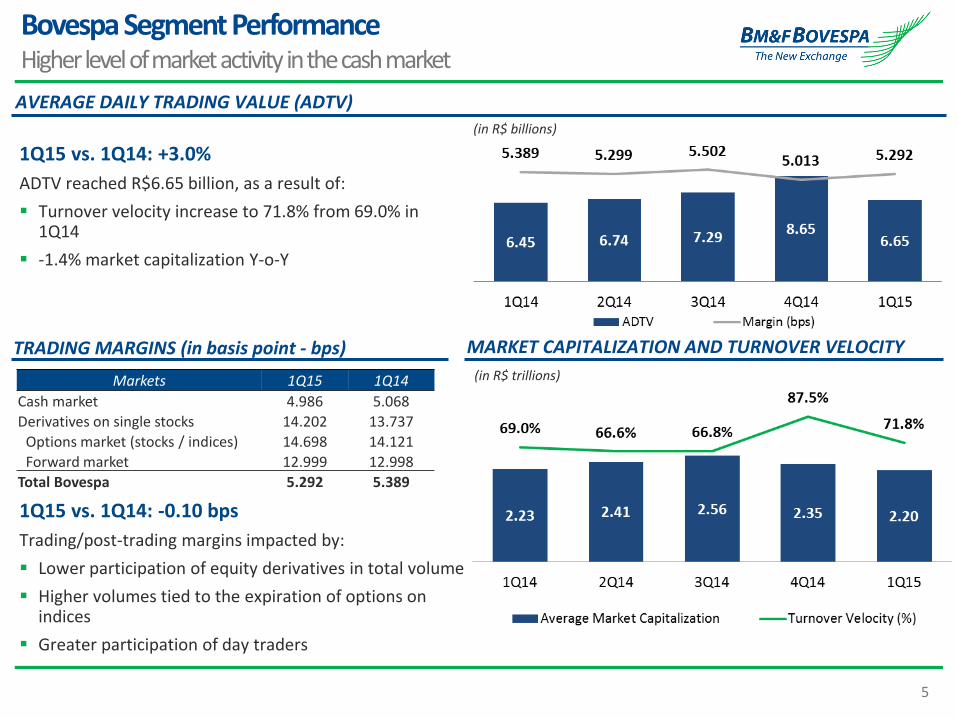
Bovespa Segment Performance Higher level of market activity in the cash market
1Q15 vs. 1Q14: +3.0%
ADTV reached R$6.65 billion, as a result of:
Turnover velocity increase to 71.8% from 69.0% in 1Q14
-1.4% market capitalization Y-o-Y
AVERAGE DAILY TRADING VALUE (ADTV)
MARKET CAPITALIZATION AND TURNOVER VELOCITY TRADING MARGINS (in basis point - bps)
Markets 1Q15 1Q14
Cash market 4.986 5.068
Derivatives on single stocks 14.202 13.737
Options market (stocks / indices) 14.698 14.121
Forward market 12.999 12.998
Total Bovespa 5.292 5.389
1Q15 vs. 1Q14: -0.10 bps
Trading/post-trading margins impacted by:
Lower participation of equity derivatives in total volume
Higher volumes tied to the expiration of options on indices
Greater participation of day traders
(in R$ billions)
(in R$ trillions)
6
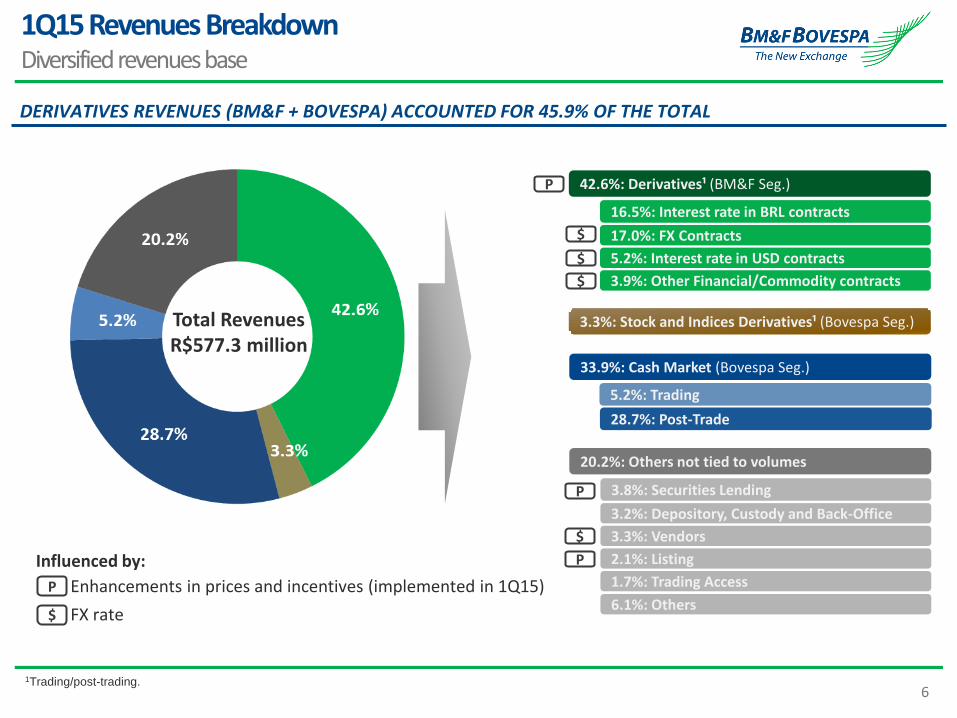
1Q15 Revenues Breakdown Diversified revenues base
42.6%: Derivatives¹ (BM&F Seg.)
Total Revenues R$577.3 million
3.8%: Securities Lending
3.2%: Depository, Custody and Back-Office
3.3%: Vendors
2.1%: Listing
1.7%: Trading Access
20.2%: Others not tied to volumes
DERIVATIVES REVENUES (BM&F + BOVESPA) ACCOUNTED FOR 45.9% OF THE TOTAL
16.5%: Interest rate in BRL contracts
17.0%: FX Contracts
5.2%: Interest rate in USD contracts
3.9%: Other Financial/Commodity contracts
1Trading/post-trading.
Enhancements in prices and incentives (implemented in 1Q15)
FX rate
P
$
$
P
P
$
P
$
$
Influenced by:
6.1%: Others
33.9%: Cash Market (Bovespa Seg.)
5.2%: Trading
28.7%: Post-Trade
3.3%: Stock and Indices Derivatives¹ (Bovespa Seg.)
7
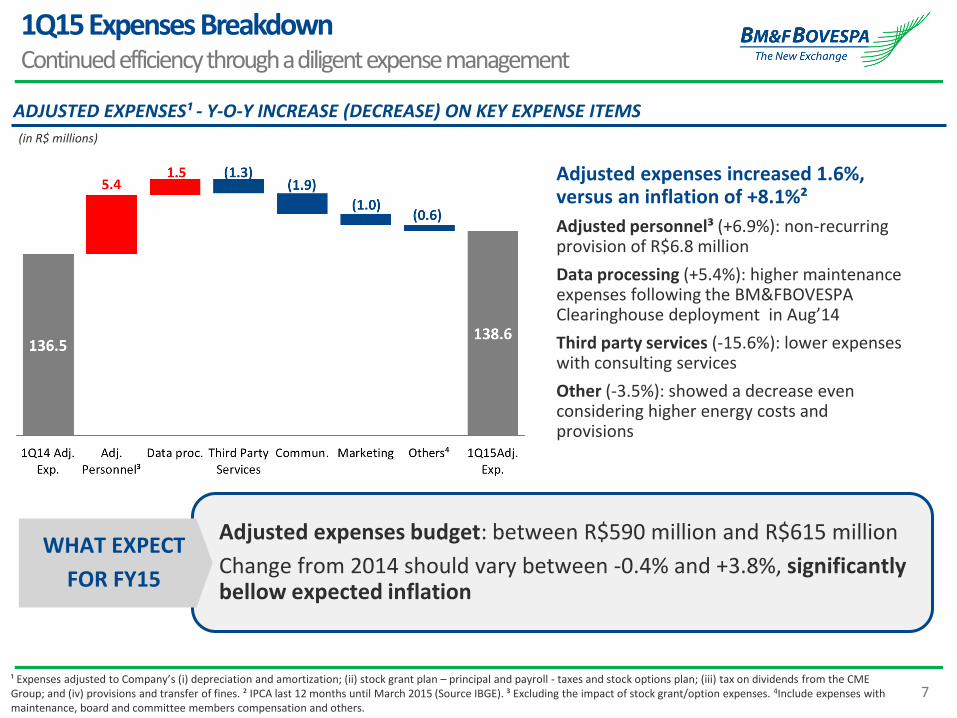
1Q15 Expenses Breakdown Continued efficiency through a diligent expense management
Adjusted expenses increased 1.6%, versus an inflation of +8.1%²
Adjusted personnel³ (+6.9%): non-recurring provision of R$6.8 million
Data processing (+5.4%): higher maintenance expenses following the BM&FBOVESPA Clearinghouse deployment in Aug’14
Third party services (-15.6%): lower expenses with consulting services
Other (-3.5%): showed a decrease even considering higher energy costs and provisions
ADJUSTED EXPENSES¹ - Y-O-Y INCREASE (DECREASE) ON KEY EXPENSE ITEMS
(in R$ millions)
¹ Expenses adjusted to Company’s (i) depreciation and amortization; (ii) stock grant plan – principal and payroll - taxes and stock options plan; (iii) tax on dividends from the CME Group; and (iv) provisions and transfer of fines. ² IPCA last 12 months until March 2015 (Source IBGE). ³ Excluding the impact of stock grant/option expenses. 4Include expenses with maintenance, board and committee members compensation and others.
Adjusted expenses budget: between R$590 million and R$615 million
Change from 2014 should vary between -0.4% and +3.8%, significantly bellow expected inflation
WHAT EXPECT
FOR FY15

8
Long-term Incentive Plan Based on Stock Grants Impacts of changes in the long-term incentive plans
Income Statement (consolidated) in R$ millions
Net revenues -
Expenses (18.3)
Personnel (18.3)
Stock grant – principal amount (9.9)
Stock grant – payroll taxes (8.4)
Operating income (18.3)
Equity on income of investees -
Financial results -
Earnings before taxes (18.3)
Income tax and social contribution 6.2
Net income (12.1)
Impacts on the income statement
Transition impacts (from stock options to stock grants)
R$25.0 million non-recurring expense related to payroll taxes from the transition (not considered on the table), as announced in the Notice to the Market released on February 4, 2015.
AS OF 1Q15 BM&FBOVESPA STARTED TO RECORD EXPENSES RELATED TO STOCK GRANTS¹
¹ There will be a small residual amount of stock options plans outstanding. In 1Q15, expenses related to that represented only 0.05% of the personnel line. ² For each stock grant program, a minimum total term of 3 years from the stock grant date and the last date for transfer shall be respected. Moreover, a minimum waiting period of 12 months shall be respected (i) between the stock grant date and the first transfer date and (ii) between each of the lots of shares, after the first transfer.
Principal amount Payroll taxes
Basis for calculation # of shares granted # of shares granted x 60.3%
Price reference Share price on the grant
date Share price on the transfer
date
Impacted by BVMF3 market price variation (volatility on expenses)
No Yes
Accounting accrual Pro-rata for vesting period Pro-rata for vesting period
Form of payment Shares Cash
Time of payment Share transfer date² Share transfer date²
Tax deductible Yes Yes
Impacts on the Income Statement Overview of the stock grant plan
9
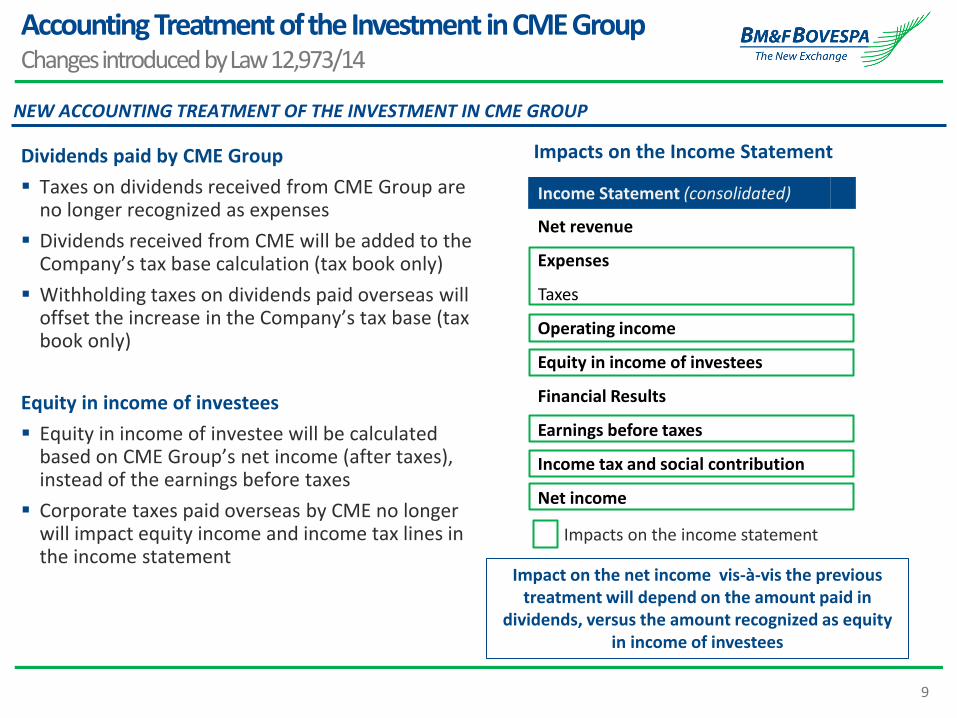
Accounting Treatment of the Investment in CME Group Changes introduced by Law 12,973/14
NEW ACCOUNTING TREATMENT OF THE INVESTMENT IN CME GROUP
Income Statement (consolidated)
Net revenue
Expenses
Taxes
Operating income
Equity in income of investees
Financial Results
Earnings before taxes
Income tax and social contribution
Net income
Impacts on the income statement
Dividends paid by CME Group
Taxes on dividends received from CME Group are no longer recognized as expenses
Dividends received from CME will be added to the Company’s tax base calculation (tax book only)
Withholding taxes on dividends paid overseas will offset the increase in the Company’s tax base (tax book only)
Equity in income of investees
Equity in income of investee will be calculated based on CME Group’s net income (after taxes), instead of the earnings before taxes
Corporate taxes paid overseas by CME no longer will impact equity income and income tax lines in the income statement
Impact on the net income vis-à-vis the previous treatment will depend on the amount paid in
dividends, versus the amount recognized as equity in income of investees
Impacts on the Income Statement
10
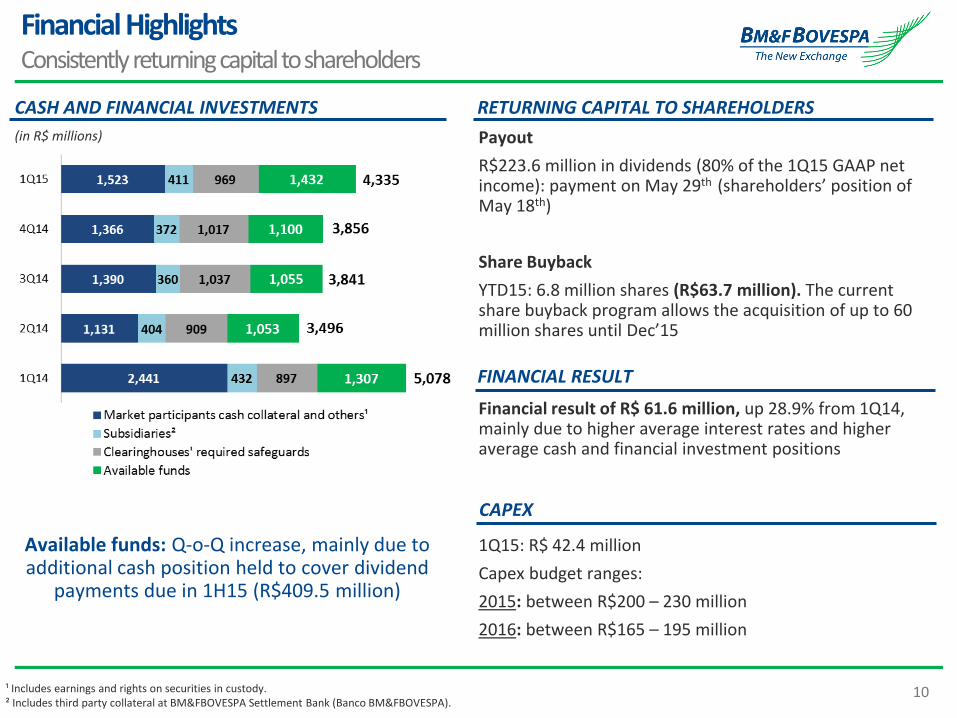
Financial Highlights Consistently returning capital to shareholders
1Q15: R$ 42.4 million
Capex budget ranges:
2015: between R$200 – 230 million
2016: between R$165 – 195 million
Payout
R$223.6 million in dividends (80% of the 1Q15 GAAP net income): payment on May 29th (shareholders’ position of May 18th)
Share Buyback
YTD15: 6.8 million shares (R$63.7 million). The current share buyback program allows the acquisition of up to 60 million shares until Dec’15
FINANCIAL RESULT
CAPEX
RETURNING CAPITAL TO SHAREHOLDERS
Financial result of R$ 61.6 million, up 28.9% from 1Q14, mainly due to higher average interest rates and higher average cash and financial investment positions
CASH AND FINANCIAL INVESTMENTS
Available funds: Q-o-Q increase, mainly due to additional cash position held to cover dividend
payments due in 1H15 (R$409.5 million)
¹ Includes earnings and rights on securities in custody. ² Includes third party collateral at BM&FBOVESPA Settlement Bank (Banco BM&FBOVESPA).
(in R$ millions)
11
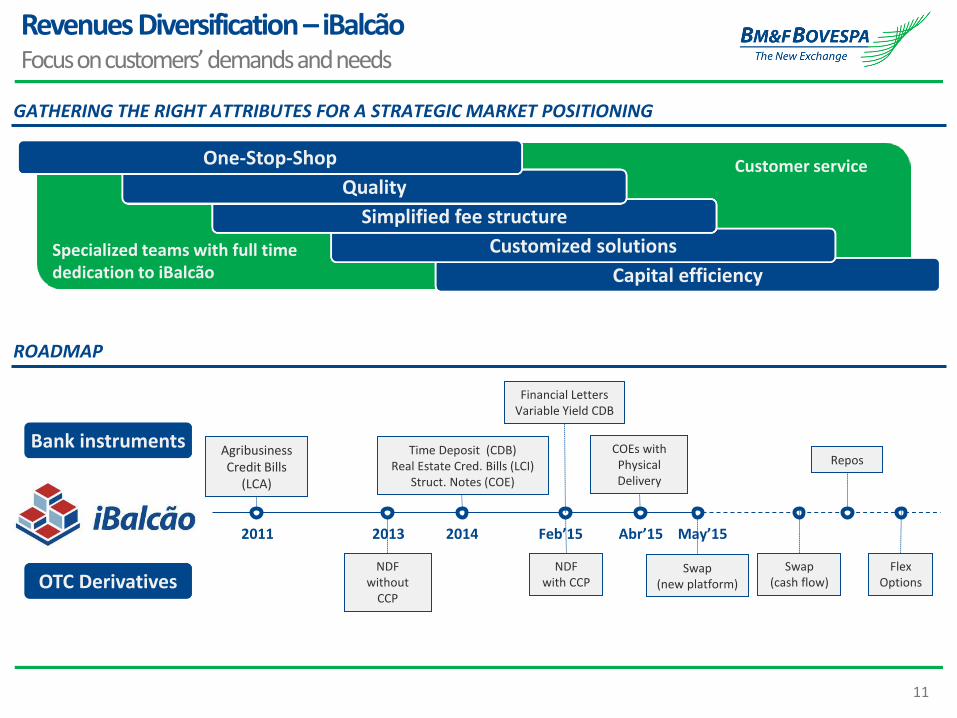
Revenues Diversification – iBalcão Focus on customers’ demands and needs
ROADMAP
Capital efficiency
Customized solutions
Simplified fee structure
Quality
One-Stop-Shop Customer service
Specialized teams with full time dedication to iBalcão
GATHERING THE RIGHT ATTRIBUTES FOR A STRATEGIC MARKET POSITIONING
Bank instruments
OTC Derivatives NDF
with CCP NDF
without CCP
Financial Letters Variable Yield CDB
Repos
Swap (new platform)
Swap (cash flow)
Flex Options
COEs with Physical Delivery
Agribusiness Credit Bills
(LCA)
2013 2014 Feb’15 Abr’15 2011
Time Deposit (CDB) Real Estate Cred. Bills (LCI)
Struct. Notes (COE)
May’15
12
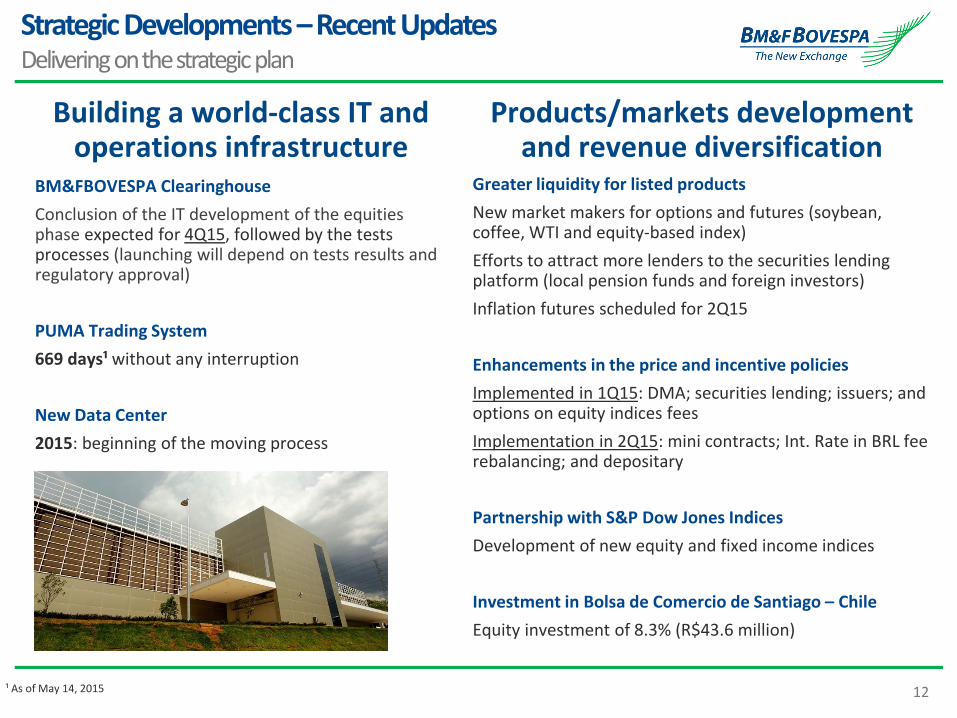
Strategic Developments – Recent Updates Delivering on the strategic plan
Building a world-class IT and operations infrastructure
BM&FBOVESPA Clearinghouse
Conclusion of the IT development of the equities phase expected for 4Q15, followed by the tests processes (launching will depend on tests results and regulatory approval)
PUMA Trading System
669 days¹ without any interruption
New Data Center
2015: beginning of the moving process
Greater liquidity for listed products
New market makers for options and futures (soybean, coffee, WTI and equity-based index)
Efforts to attract more lenders to the securities lending platform (local pension funds and foreign investors)
Inflation futures scheduled for 2Q15
Enhancements in the price and incentive policies
Implemented in 1Q15: DMA; securities lending; issuers; and options on equity indices fees
Implementation in 2Q15: mini contracts; Int. Rate in BRL fee rebalancing; and depositary
Partnership with S&P Dow Jones Indices
Development of new equity and fixed income indices
Investment in Bolsa de Comercio de Santiago – Chile
Equity investment of 8.3% (R$43.6 million)
Products/markets development and revenue diversification
¹ As of May 14, 2015

13
APPENDIX
14
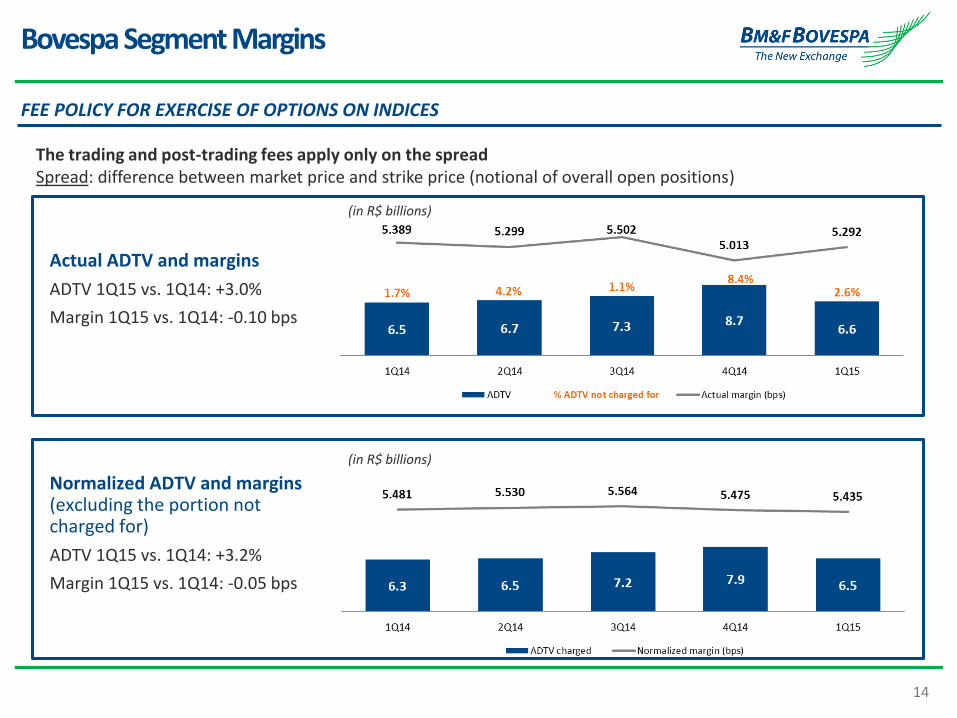
Bovespa Segment Margins
FEE POLICY FOR EXERCISE OF OPTIONS ON INDICES
Actual ADTV and margins
ADTV 1Q15 vs. 1Q14: +3.0%
Margin 1Q15 vs. 1Q14: -0.10 bps
Normalized ADTV and margins (excluding the portion not charged for)
ADTV 1Q15 vs. 1Q14: +3.2%
Margin 1Q15 vs. 1Q14: -0.05 bps
The trading and post-trading fees apply only on the spread Spread: difference between market price and strike price (notional of overall open positions)
(in R$ billions)
(in R$ billions)
15
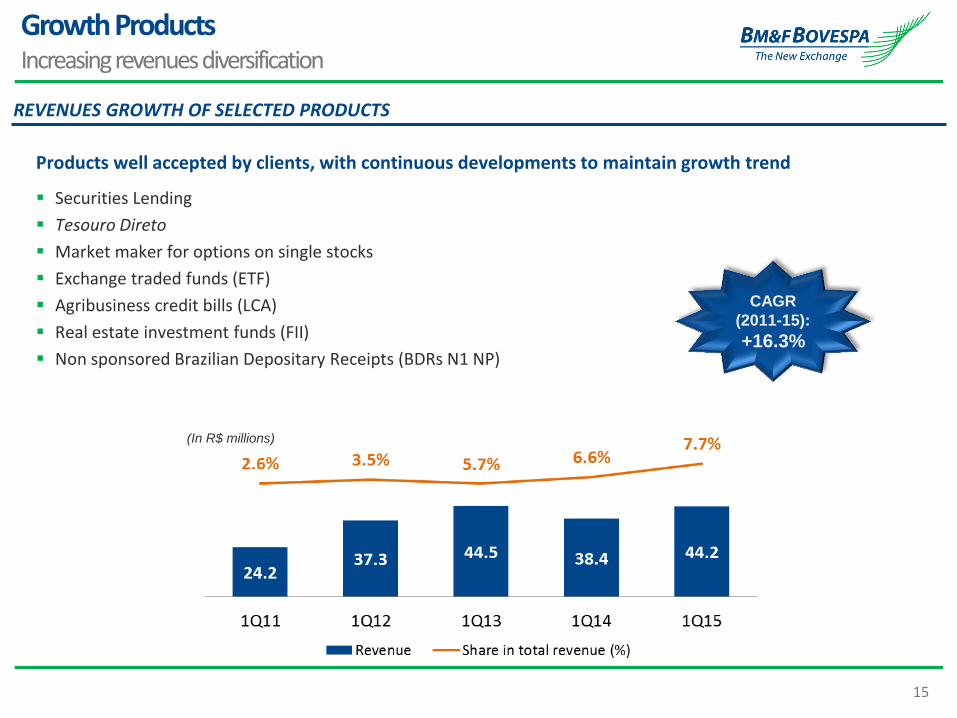
Growth Products Increasing revenues diversification
Products well accepted by clients, with continuous developments to maintain growth trend
Securities Lending
Tesouro Direto
Market maker for options on single stocks
Exchange traded funds (ETF)
Agribusiness credit bills (LCA)
Real estate investment funds (FII)
Non sponsored Brazilian Depositary Receipts (BDRs N1 NP)
CAGR
(2011-15):
+16.3%
(In R$ millions)
REVENUES GROWTH OF SELECTED PRODUCTS
16
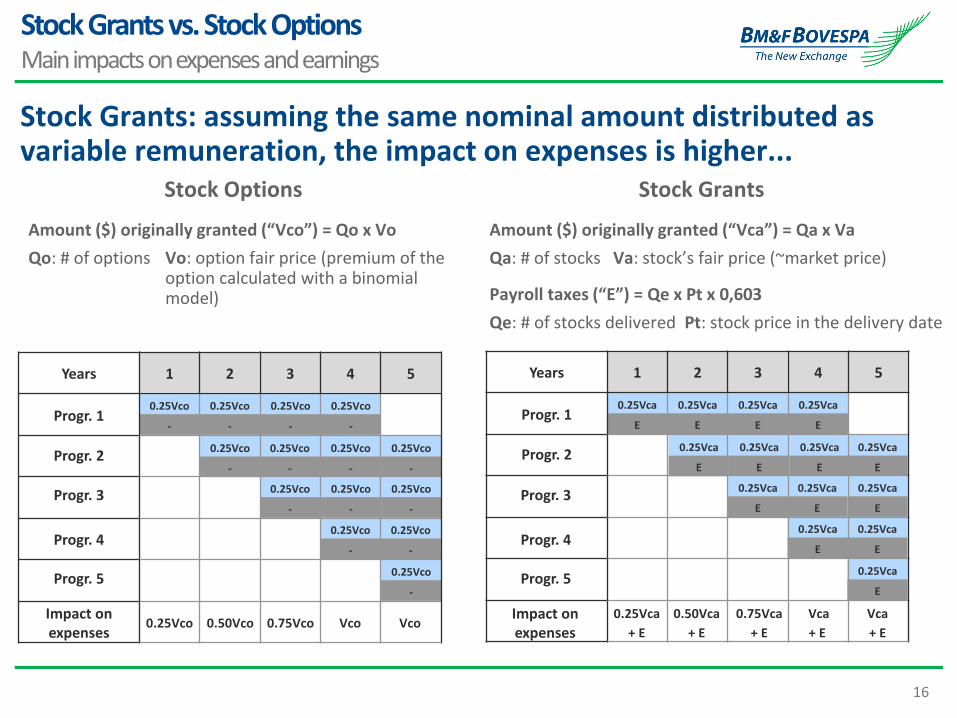
Stock Grants vs. Stock Options Main impacts on expenses and earnings
Amount ($) originally granted (“Vco”) = Qo x Vo
Qo: # of options
Stock Grants: assuming the same nominal amount distributed as variable remuneration, the impact on expenses is higher...
Stock Options Stock Grants
Amount ($) originally granted (“Vca”) = Qa x Va
Qa: # of stocks Va: stock’s fair price (~market price)
Payroll taxes (“E”) = Qe x Pt x 0,603
Qe: # of stocks delivered Pt: stock price in the delivery date
Progr. 1
Progr. 2
Progr. 3
Impact on expenses
0.25Vco 0.50Vco
Progr. 1
Progr. 2
0.25Vca
E
0.25Vca
E
0.25Vca
E
0.25Vca
E
0.25Vca
E
0.25Vca
E
0.25Vca
E
0.25Vca
+ E
0.50Vca
+ E
0.25Vca
E
Progr. 4
Progr. 5
0.75Vco Vco Vco
0.25Vca
E
0.25Vca
E
0.25Vca
E
0.25Vca
E
0.25Vca
E
0.25Vca
E
0.25Vco
-
0.25Vco
-
0.25Vco
-
0.25Vco
-
0.25Vco
-
0.25Vco
-
0.25Vco
-
0.25Vco
-
0.25Vco
-
0.25Vco
-
0.25Vco
-
0.25Vco
-
0.25Vco
-
0.25Vco
-
0.75Vca
+ E
Vca
+ E
Vca
+ E
Impact on expenses
Progr. 3
Progr. 4
Progr. 5
Vo: option fair price (premium of the option calculated with a binomial model)
Years 1 2 3 4 5 Years 1 2 3 4 5
17
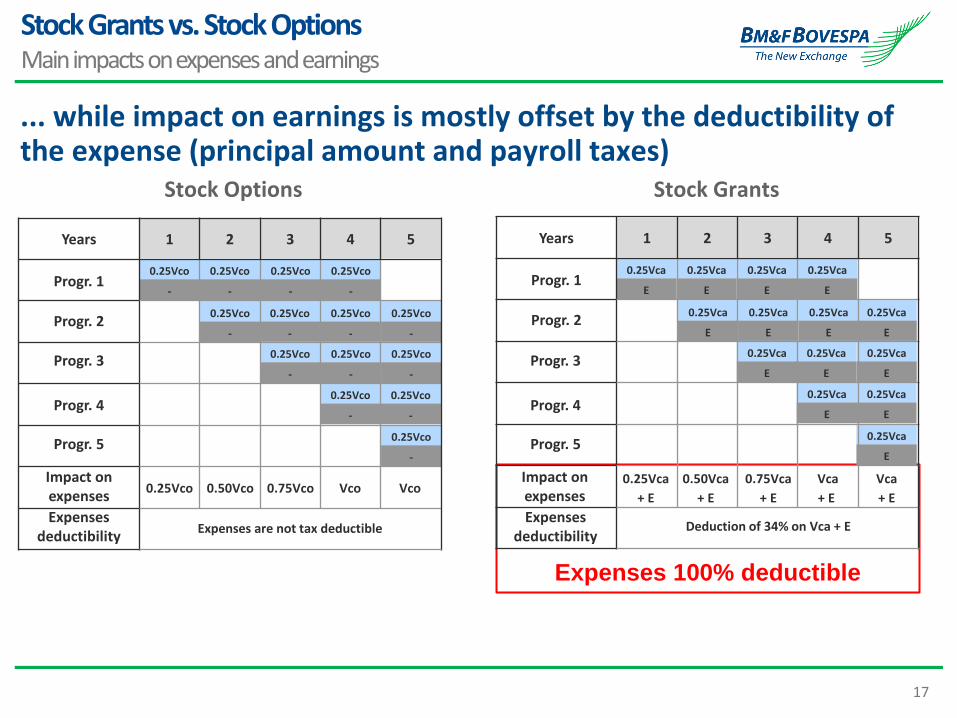
... while impact on earnings is mostly offset by the deductibility of the expense (principal amount and payroll taxes)
Stock Options Stock Grants
Progr. 1
Progr. 2
Progr. 3
Impact on expenses
Progr. 1
Progr. 2
Progr. 4
Progr. 5
Impact on expenses
Progr. 3
Progr. 4
Progr. 5
Expenses deductibility
Expenses deductibility
Expenses 100% deductible
Expenses are not tax deductible Deduction of 34% on Vca + E
Stock Grants vs. Stock Options Main impacts on expenses and earnings
0.25Vco 0.50Vco 0.75Vco Vco Vco
0.25Vco
-
0.25Vco
-
0.25Vco
-
0.25Vco
-
0.25Vco
-
0.25Vco
-
0.25Vco
-
0.25Vco
-
0.25Vco
-
0.25Vco
-
0.25Vco
-
0.25Vco
-
0.25Vco
-
0.25Vco
-
0.25Vca
E
0.25Vca
E
0.25Vca
E
0.25Vca
E
0.25Vca
E
0.25Vca
E
0.25Vca
E
0.25Vca
+ E
0.50Vca
+ E
0.25Vca
E
0.25Vca
E
0.25Vca
E
0.25Vca
E
0.25Vca
E
0.25Vca
E
0.25Vca
E
0.75Vca
+ E
Vca
+ E
Vca
+ E
Years 1 2 3 4 5 Years 1 2 3 4 5
18
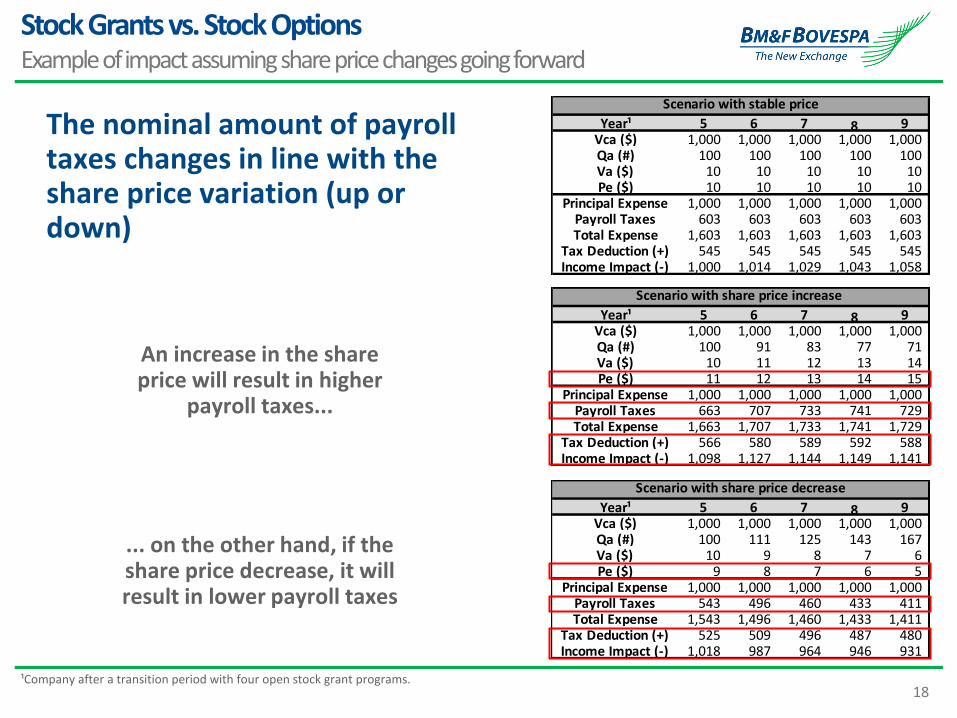
Year¹ 5 6 7 8 9Vca ($) 1,000 1,000 1,000 1,000 1,000 Qa (#) 100 111 125 143 167 Va ($) 10 9 8 7 6 Pe ($) 9 8 7 6 5
Principal Expense 1,000 1,000 1,000 1,000 1,000 Payroll Taxes 543 496 460 433 411 Total Expense 1,543 1,496 1,460 1,433 1,411
Tax Deduction (+) 525 509 496 487 480 Income Impact (-) 1,018 987 964 946 931
Scenario with share price decrease
Year¹ 5 6 7 8 9Vca ($) 1,000 1,000 1,000 1,000 1,000 Qa (#) 100 91 83 77 71 Va ($) 10 11 12 13 14 Pe ($) 11 12 13 14 15
Principal Expense 1,000 1,000 1,000 1,000 1,000 Payroll Taxes 663 707 733 741 729 Total Expense 1,663 1,707 1,733 1,741 1,729
Tax Deduction (+) 566 580 589 592 588 Income Impact (-) 1,098 1,127 1,144 1,149 1,141
Scenario with share price increase
An increase in the share price will result in higher
payroll taxes...
... on the other hand, if the share price decrease, it will result in lower payroll taxes
The nominal amount of payroll taxes changes in line with the share price variation (up or down)
¹Company after a transition period with four open stock grant programs.
Stock Grants vs. Stock Options Example of impact assuming share price changes going forward
Year¹ 5 6 7 8 9Vca ($) 1,000 1,000 1,000 1,000 1,000 Qa (#) 100 100 100 100 100 Va ($) 10 10 10 10 10 Pe ($) 10 10 10 10 10
Principal Expense 1,000 1,000 1,000 1,000 1,000 Payroll Taxes 603 603 603 603 603 Total Expense 1,603 1,603 1,603 1,603 1,603
Tax Deduction (+) 545 545 545 545 545 Income Impact (-) 1,000 1,014 1,029 1,043 1,058
Scenario with stable price
19
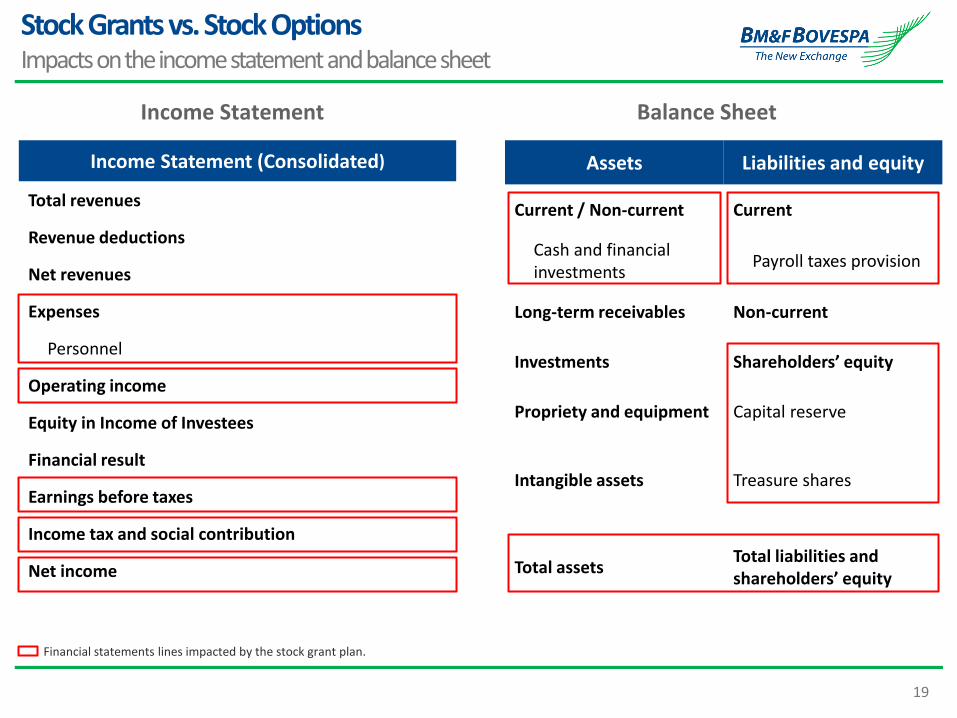
Income Statement Balance Sheet
Income Statement (Consolidated)
Total revenues
Revenue deductions
Net revenues
Expenses
Personnel
Operating income
Equity in Income of Investees
Financial result
Earnings before taxes
Income tax and social contribution
Net income
Assets Liabilities and equity
Current / Non-current Current
Cash and financial investments
Payroll taxes provision
Long-term receivables Non-current
Investments Shareholders’ equity
Propriety and equipment Capital reserve
Intangible assets Treasure shares
Total assets Total liabilities and shareholders’ equity
Financial statements lines impacted by the stock grant plan.
Stock Grants vs. Stock Options Impacts on the income statement and balance sheet
20
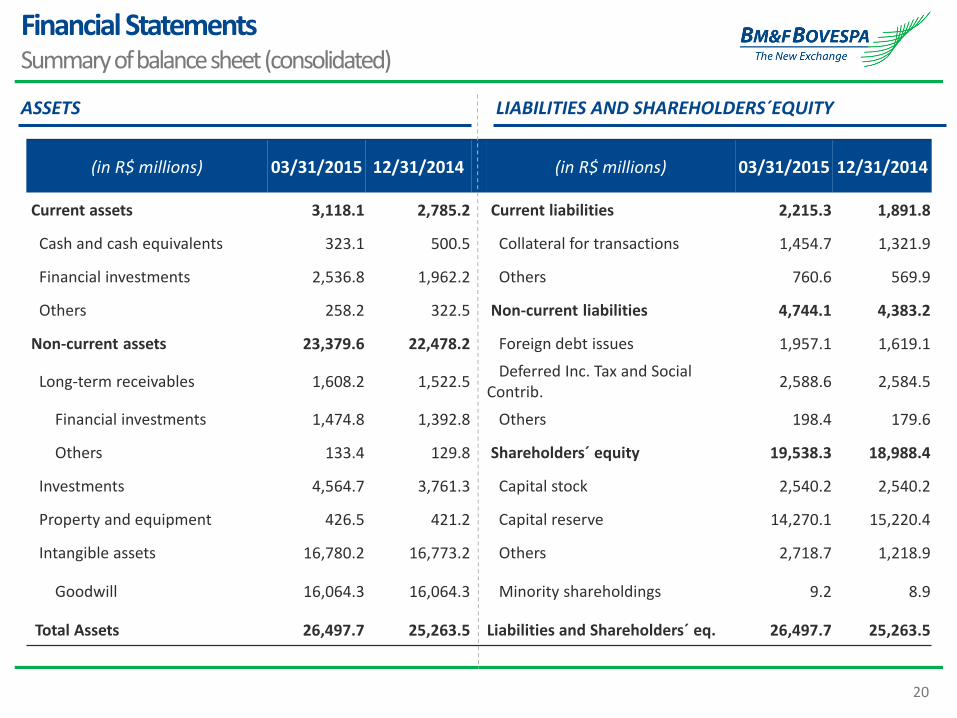
Financial Statements Summary of balance sheet (consolidated)
(in R$ millions) 03/31/2015 12/31/2014 (in R$ millions) 03/31/2015 12/31/2014
Current assets 3,118.1 2,785.2 Current liabilities 2,215.3 1,891.8
Cash and cash equivalents 323.1 500.5 Collateral for transactions 1,454.7 1,321.9
Financial investments 2,536.8 1,962.2 Others 760.6 569.9
Others 258.2 322.5 Non-current liabilities 4,744.1 4,383.2
Non-current assets 23,379.6 22,478.2 Foreign debt issues 1,957.1 1,619.1
Long-term receivables 1,608.2 1,522.5 Deferred Inc. Tax and Social Contrib.
2,588.6 2,584.5
Financial investments 1,474.8 1,392.8 Others 198.4 179.6
Others 133.4 129.8 Shareholders´ equity 19,538.3 18,988.4
Investments 4,564.7 3,761.3 Capital stock 2,540.2 2,540.2
Property and equipment 426.5 421.2 Capital reserve 14,270.1 15,220.4
Intangible assets 16,780.2 16,773.2 Others 2,718.7 1,218.9
Goodwill 16,064.3 16,064.3 Minority shareholdings 9.2 8.9
Total Assets 26,497.7 25,263.5 Liabilities and Shareholders´ eq. 26,497.7 25,263.5
LIABILITIES AND SHAREHOLDERS´EQUITY ASSETS
21
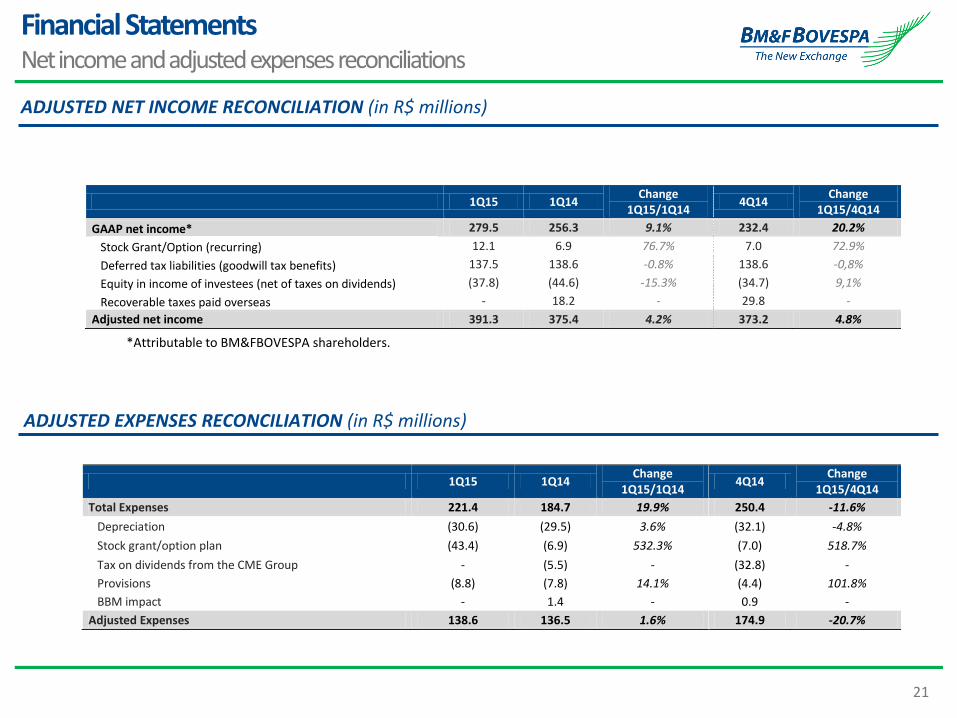
1Q15 1Q14 Change
1Q15/1Q14 4Q14
Change 1Q15/4Q14
Total Expenses 221.4 184.7 19.9% 250.4 -11.6%
Depreciation (30.6) (29.5) 3.6% (32.1) -4.8%
Stock grant/option plan (43.4) (6.9) 532.3% (7.0) 518.7%
Tax on dividends from the CME Group - (5.5) - (32.8) -
Provisions (8.8) (7.8) 14.1% (4.4) 101.8%
BBM impact - 1.4 - 0.9 -
Adjusted Expenses 138.6 136.5 1.6% 174.9 -20.7%
1Q15 1Q14 Change
1Q15/1Q14 4Q14
Change 1Q15/4Q14
GAAP net income* 279.5 256.3 9.1% 232.4 20.2%
Stock Grant/Option (recurring) 12.1 6.9 76.7% 7.0 72.9%
Deferred tax liabilities (goodwill tax benefits) 137.5 138.6 -0.8% 138.6 -0,8%
Equity in income of investees (net of taxes on dividends) (37.8) (44.6) -15.3% (34.7) 9,1%
Recoverable taxes paid overseas - 18.2 - 29.8 -
Adjusted net income 391.3 375.4 4.2% 373.2 4.8%
Financial Statements Net income and adjusted expenses reconciliations
*Attributable to BM&FBOVESPA shareholders.
ADJUSTED NET INCOME RECONCILIATION (in R$ millions)
ADJUSTED EXPENSES RECONCILIATION (in R$ millions)
22
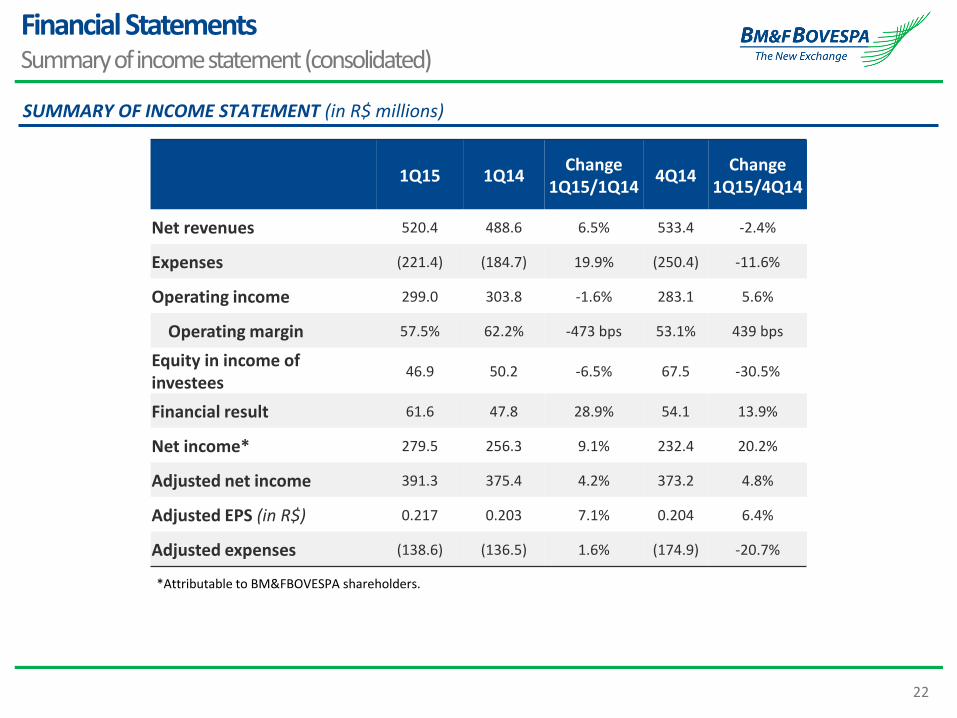
1Q15 1Q14 Change
1Q15/1Q14 4Q14
Change 1Q15/4Q14
Net revenues 520.4 488.6 6.5% 533.4 -2.4%
Expenses (221.4) (184.7) 19.9% (250.4) -11.6%
Operating income 299.0 303.8 -1.6% 283.1 5.6%
Operating margin 57.5% 62.2% -473 bps 53.1% 439 bps
Equity in income of investees
46.9 50.2 -6.5% 67.5 -30.5%
Financial result 61.6 47.8 28.9% 54.1 13.9%
Net income* 279.5 256.3 9.1% 232.4 20.2%
Adjusted net income 391.3 375.4 4.2% 373.2 4.8%
Adjusted EPS (in R$) 0.217 0.203 7.1% 0.204 6.4%
Adjusted expenses (138.6) (136.5) 1.6% (174.9) -20.7%
SUMMARY OF INCOME STATEMENT (in R$ millions)
*Attributable to BM&FBOVESPA shareholders.
Financial Statements Summary of income statement (consolidated)

23
Contact
Investor Relations Department
Phone: 55 11 2565-4729 / 4418 / 4207 / 4834 / 7938