Embed Size (px)
Citation preview

U.S. employment situation: September 2013
Release date: October 22, 2013
Labor market back on track, fueling
chances of interest rate hike
U.S. employment situation: October 2015 November 6, 2015
October 2015 employment summary
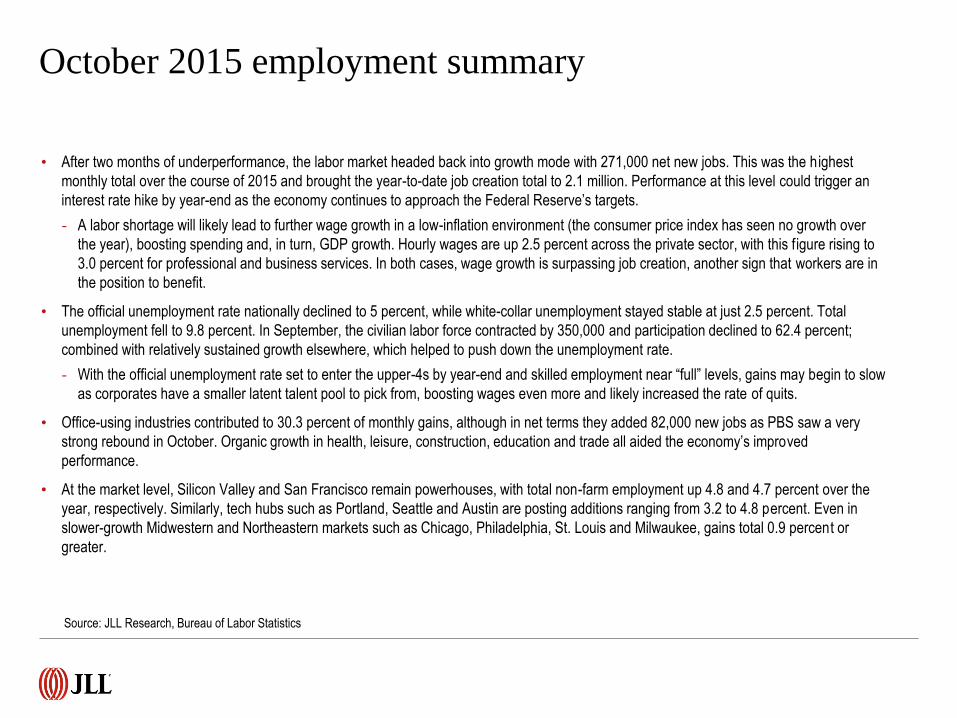
• After two months of underperformance, the labor market headed back into growth mode with 271,000 net new jobs. This was the highest
monthly total over the course of 2015 and brought the year-to-date job creation total to 2.1 million. Performance at this level could trigger an
interest rate hike by year-end as the economy continues to approach the Federal Reserve’s targets.
- A labor shortage will likely lead to further wage growth in a low-inflation environment (the consumer price index has seen no growth over
the year), boosting spending and, in turn, GDP growth. Hourly wages are up 2.5 percent across the private sector, with this figure rising to
3.0 percent for professional and business services. In both cases, wage growth is surpassing job creation, another sign that workers are in
the position to benefit.
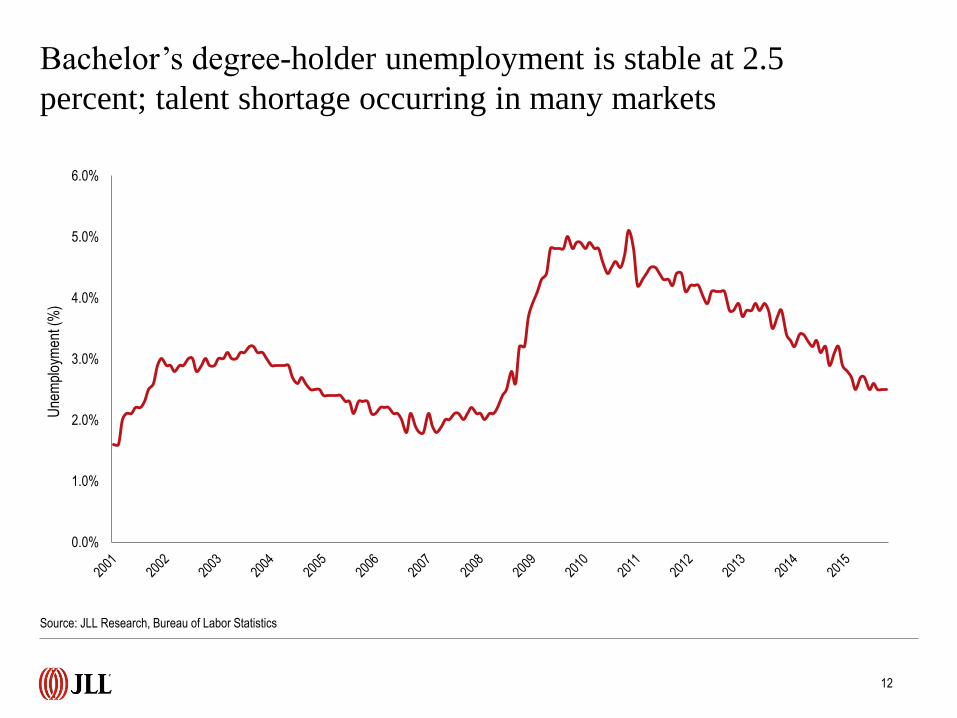
• The official unemployment rate nationally declined to 5 percent, while white-collar unemployment stayed stable at just 2.5 percent. Total
unemployment fell to 9.8 percent. In September, the civilian labor force contracted by 350,000 and participation declined to 62.4 percent;
combined with relatively sustained growth elsewhere, which helped to push down the unemployment rate.
- With the official unemployment rate set to enter the upper-4s by year-end and skilled employment near “full” levels, gains may begin to slow
as corporates have a smaller latent talent pool to pick from, boosting wages even more and likely increased the rate of quits.
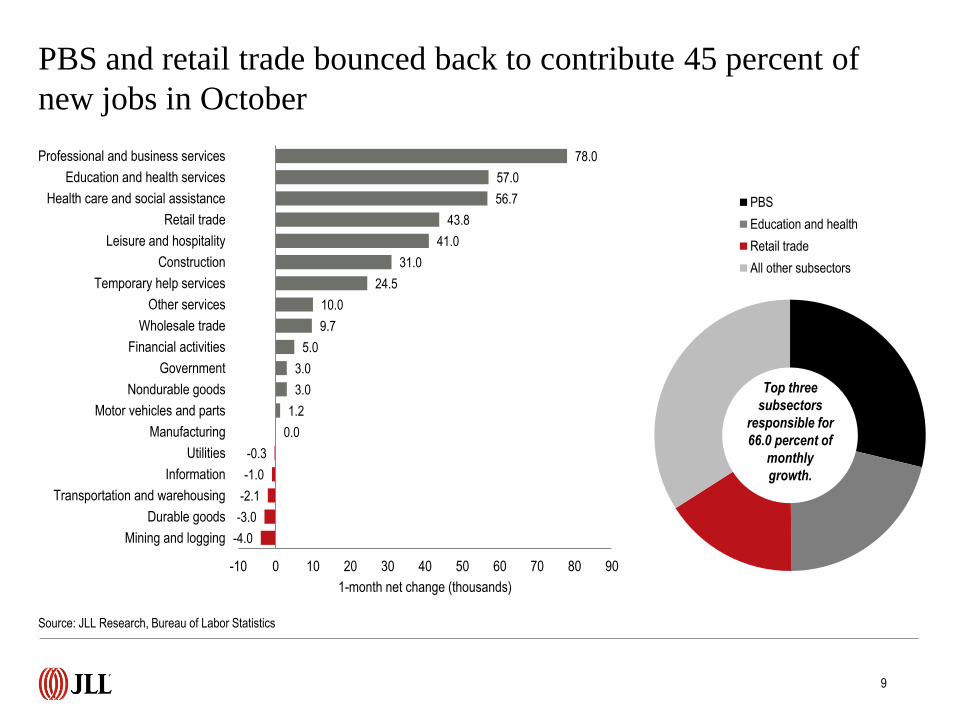
• Office-using industries contributed to 30.3 percent of monthly gains, although in net terms they added 82,000 new jobs as PBS saw a very
strong rebound in October. Organic growth in health, leisure, construction, education and trade all aided the economy’s improved
performance.
• At the market level, Silicon Valley and San Francisco remain powerhouses, with total non-farm employment up 4.8 and 4.7 percent over the
year, respectively. Similarly, tech hubs such as Portland, Seattle and Austin are posting additions ranging from 3.2 to 4.8 percent. Even in
slower-growth Midwestern and Northeastern markets such as Chicago, Philadelphia, St. Louis and Milwaukee, gains total 0.9 percent or
greater.
Source: JLL Research, Bureau of Labor Statistics
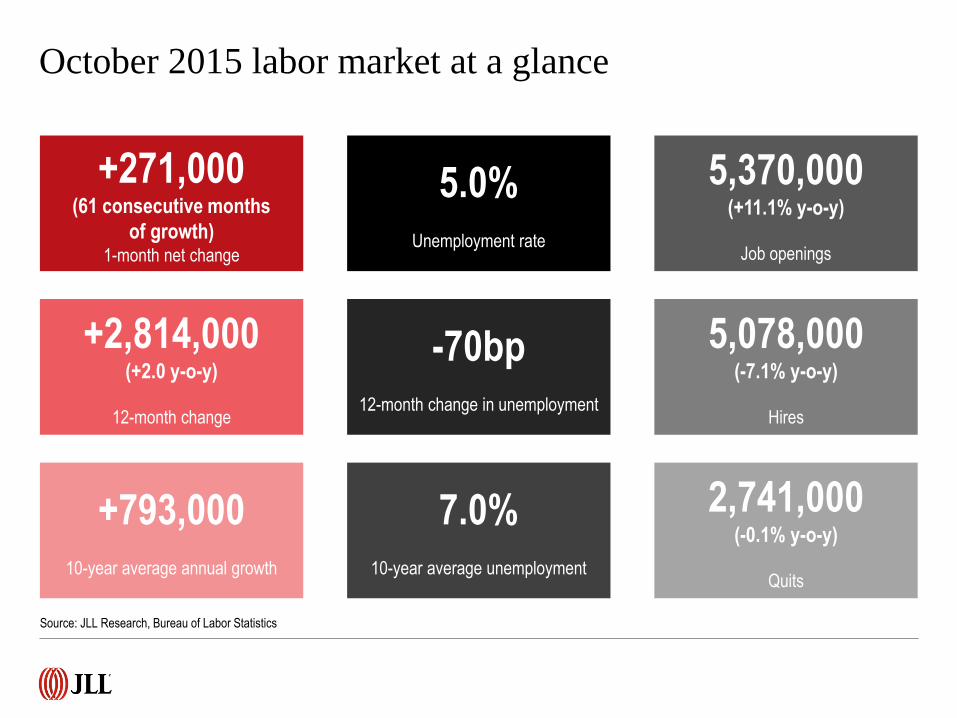
October 2015 labor market at a glance
+271,000(61 consecutive months
of growth)1-month net change
+2,814,000(+2.0 y-o-y)
12-month change
+793,00010-year average annual growth
Source: JLL Research, Bureau of Labor Statistics
5.0%Unemployment rate
-70bp12-month change in unemployment
7.0%10-year average unemployment
5,370,000(+11.1% y-o-y)
Job openings
5,078,000(-7.1% y-o-y)
Hires
2,741,000(-0.1% y-o-y)
Quits
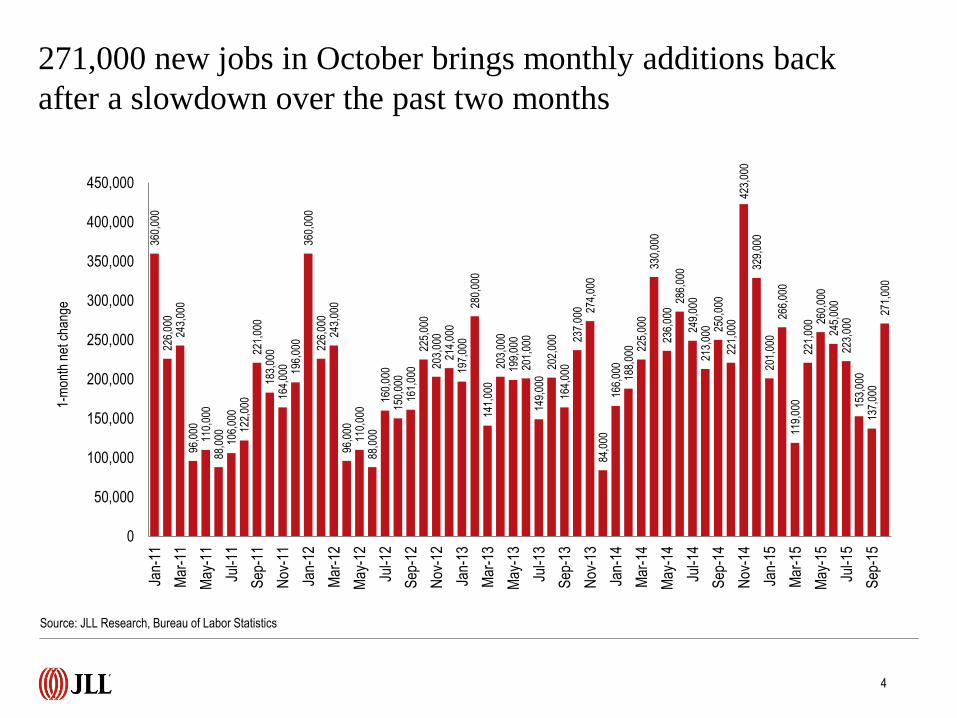
271,000 new jobs in October brings monthly additions back
after a slowdown over the past two months
360,
000
226,
000
243,
000
96,0
0011
0,00
088
,000 10
6,00
012
2,00
022
1,00
018
3,00
016
4,00
0 196,
000
360,
000
226,
000
243,
000
96,0
0011
0,00
088
,000
160,
000
150,
000
161,
000
225,
000
203,
000
214,
000
197,
000
280,
000
141,
000
203,
000
199,
000
201,
000
149,
000
202,
000
164,
000
237,
000 27
4,00
084
,000
166,
000
188,
000 22
5,00
033
0,00
023
6,00
028
6,00
024
9,00
021
3,00
0 250,
000
221,
000
423,
000
329,
000
201,
000
266,
000
119,
000
221,
000 26
0,00
024
5,00
022
3,00
015
3,00
013
7,00
027
1,00
0
0
50,000
100,000
150,000
200,000
250,000
300,000
350,000
400,000
450,000
Jan-
11
Mar
-11
May
-11
Jul-1
1
Sep
-11
Nov
-11
Jan-
12
Mar
-12
May
-12
Jul-1
2
Sep
-12
Nov
-12
Jan-
13
Mar
-13
May
-13
Jul-1
3
Sep
-13
Nov
-13
Jan-
14
Mar
-14
May
-14
Jul-1
4
Sep
-14
Nov
-14
Jan-
15
Mar
-15
May
-15
Jul-1
5
Sep
-15
1-m
onth
net
cha
nge
4
Source: JLL Research, Bureau of Labor Statistics
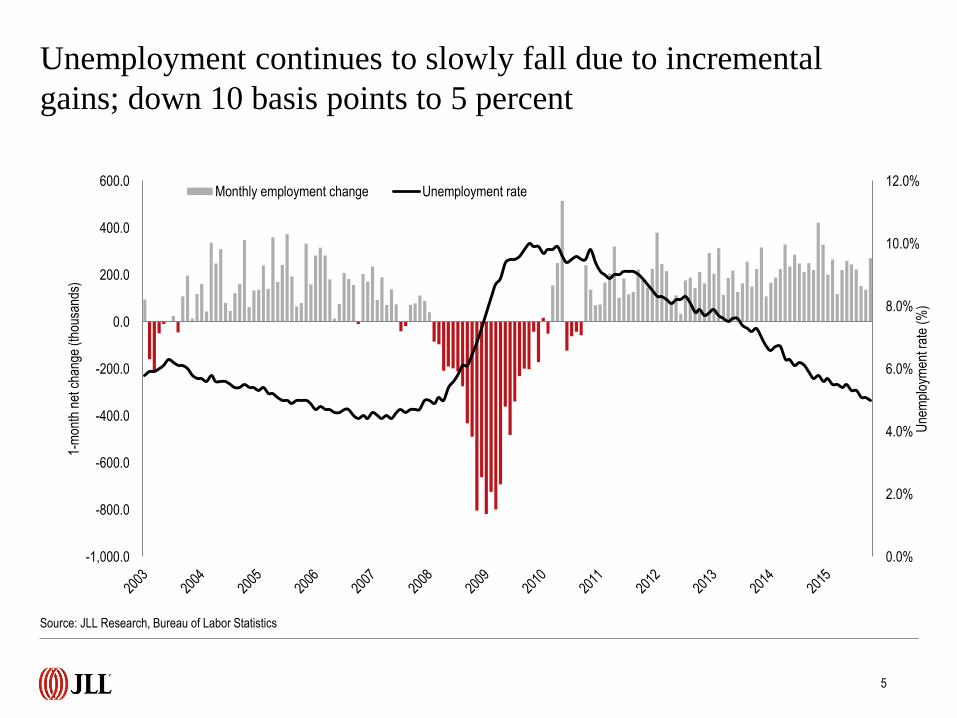
Unemployment continues to slowly fall due to incremental
gains; down 10 basis points to 5 percent
0.0%
2.0%
4.0%
6.0%
8.0%
10.0%
12.0%
-1,000.0
-800.0
-600.0
-400.0
-200.0
0.0
200.0
400.0
600.0
Une
mpl
oym
ent r
ate
(%)
1-m
onth
net
cha
nge
(tho
usan
ds)
Monthly employment change Unemployment rate
Source: JLL Research, Bureau of Labor Statistics
5
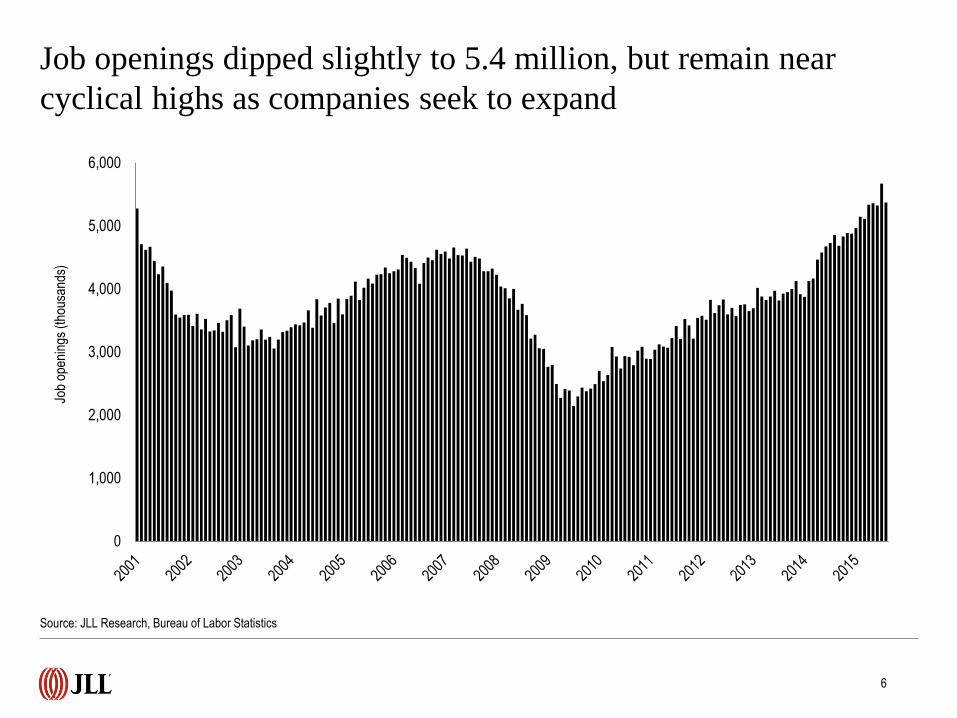
Job openings dipped slightly to 5.4 million, but remain near
cyclical highs as companies seek to expand
Source: JLL Research, Bureau of Labor Statistics
6
0
1,000
2,000
3,000
4,000
5,000
6,000
Job
open
ings
(th
ousa
nds)
0.0
20.0
40.0
60.0
80.0
100.0
120.0
140.0
Con
sum
er c
onfid
ence
inde
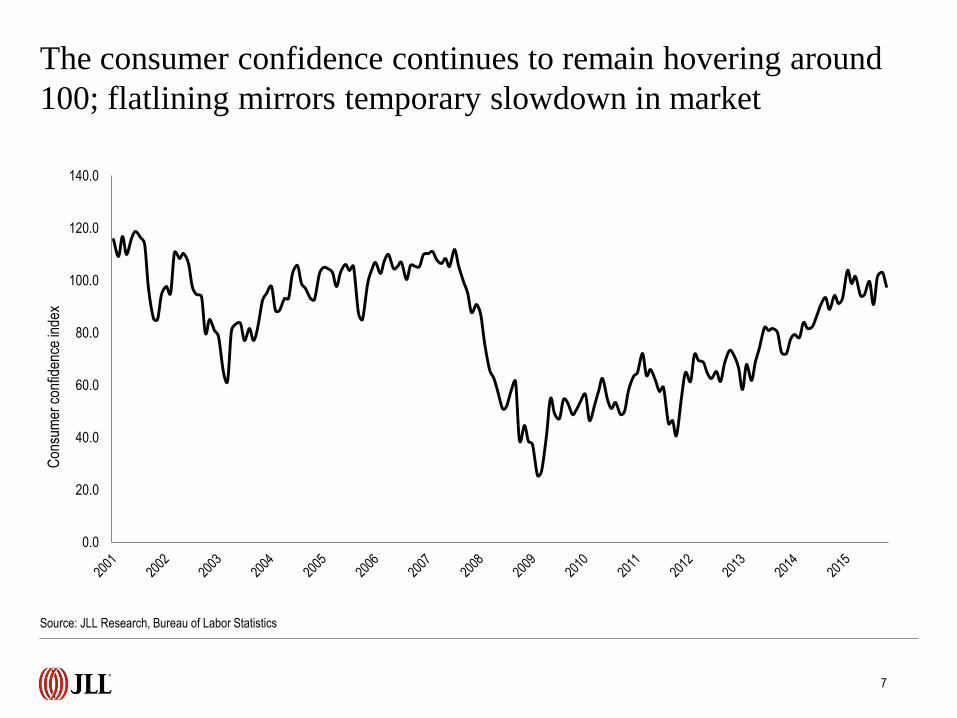
xThe consumer confidence continues to remain hovering around
100; flatlining mirrors temporary slowdown in market
Source: JLL Research, Bureau of Labor Statistics
7
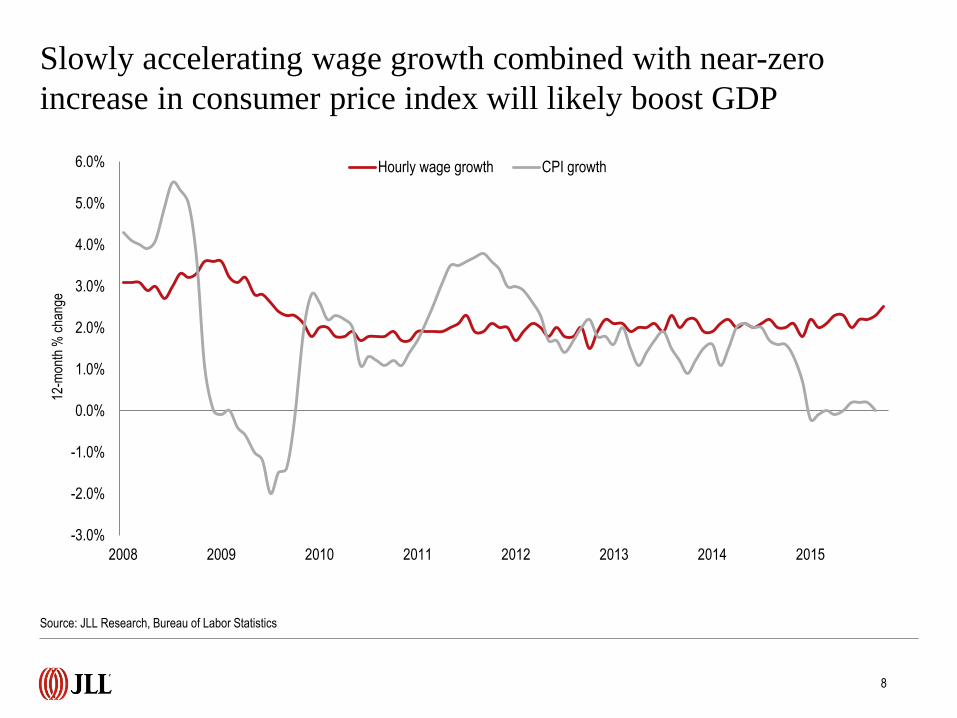
Slowly accelerating wage growth combined with near-zero
increase in consumer price index will likely boost GDP
Source: JLL Research, Bureau of Labor Statistics
8
-3.0%
-2.0%
-1.0%
0.0%
1.0%
2.0%
3.0%
4.0%
5.0%
6.0%
2008 2009 2010 2011 2012 2013 2014 2015
12-m
onth
% c
hang
e
Hourly wage growth CPI growth
-4.0
-3.0
-2.1
-1.0
-0.3
0.0
1.2
3.0
3.0
5.0
9.7
10.0
24.5
31.0
41.0
43.8
56.7
57.0
78.0
-10 0 10 20 30 40 50 60 70 80 90
Mining and logging
Durable goods
Transportation and warehousing
Information
Utilities
Manufacturing
Motor vehicles and parts
Nondurable goods
Government
Financial activities
Wholesale trade
Other services
Temporary help services
Construction
Leisure and hospitality
Retail trade
Health care and social assistance
Education and health services
Professional and business services
1-month net change (thousands)
PBS and retail trade bounced back to contribute 45 percent of
new jobs in October
Source: JLL Research, Bureau of Labor Statistics
9
PBS
Education and health
Retail trade
All other subsectors
Top three
subsectors
responsible for
66.0 percent of
monthly
growth.
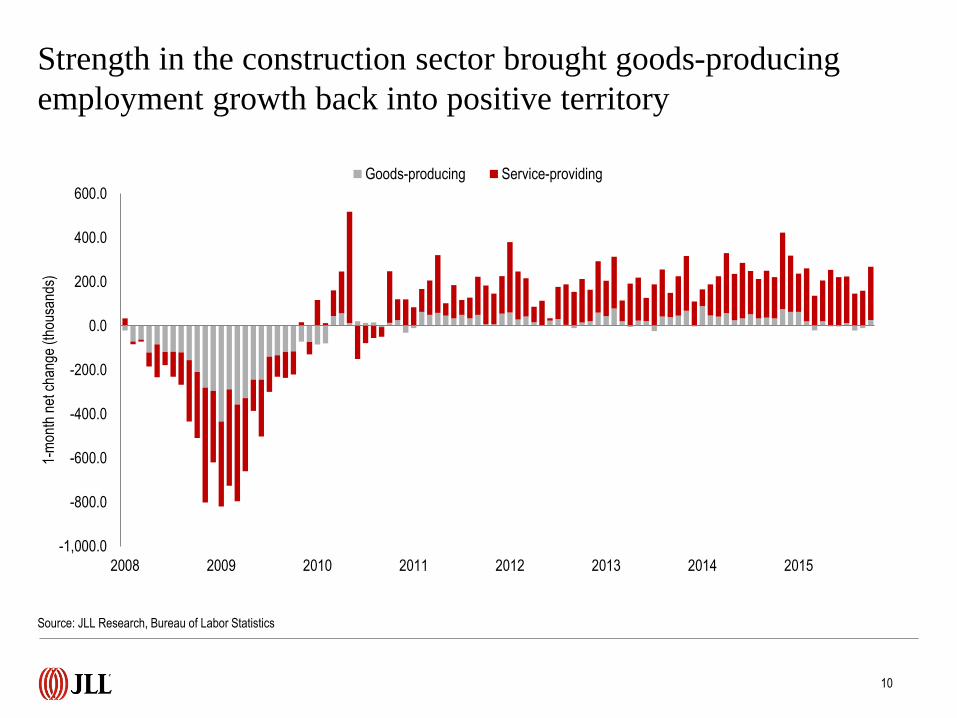
Strength in the construction sector brought goods-producing
employment growth back into positive territory
-1,000.0
-800.0
-600.0
-400.0
-200.0
0.0
200.0
400.0
600.0
2008 2009 2010 2011 2012 2013 2014 2015
1-m
onth
net
cha
nge
(tho
usan
ds)
Goods-producing Service-providing
Source: JLL Research, Bureau of Labor Statistics
10
-108.0
12.0
35.0
45.0
46.0
46.9
66.0
77.2
80.0
105.0
116.2
122.0
147.0
233.0
313.4
433.0
606.2
623.0
664.0
-200 0 200 400 600 800
Mining and logging
Utilities
Nondurable goods
Durable goods
Information
Motor vehicles and parts
Other services
Wholesale trade
Manufacturing
Government
Temporary help services
Transportation and warehousing
Financial activities
Construction
Retail trade
Leisure and hospitality
Health care and social assistance
Education and health services
Professional and business services
12-month net change (thousands)
PBS
Education and health
Leisure and hospitality
Retail trade
Financial activities
Manufacturing
All other jobs
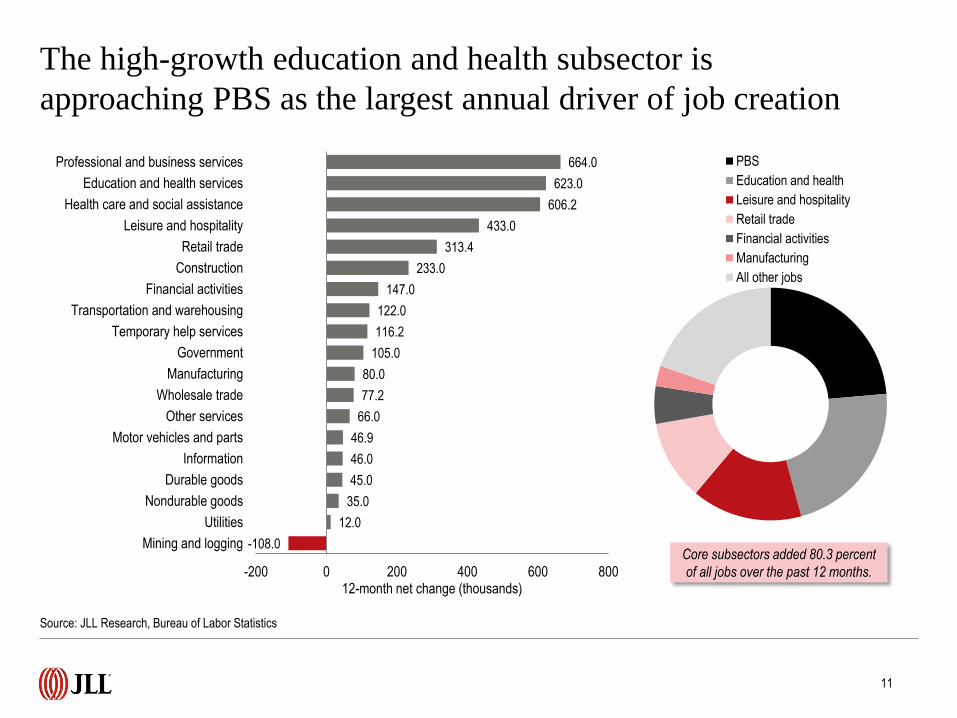
The high-growth education and health subsector is
approaching PBS as the largest annual driver of job creation
Source: JLL Research, Bureau of Labor Statistics
11
Core subsectors added 80.3 percent
of all jobs over the past 12 months.
0.0%
1.0%
2.0%
3.0%
4.0%
5.0%
6.0%
Une
mpl
oym
ent (
%)
Bachelor’s degree-holder unemployment is stable at 2.5
percent; talent shortage occurring in many markets
Source: JLL Research, Bureau of Labor Statistics
12
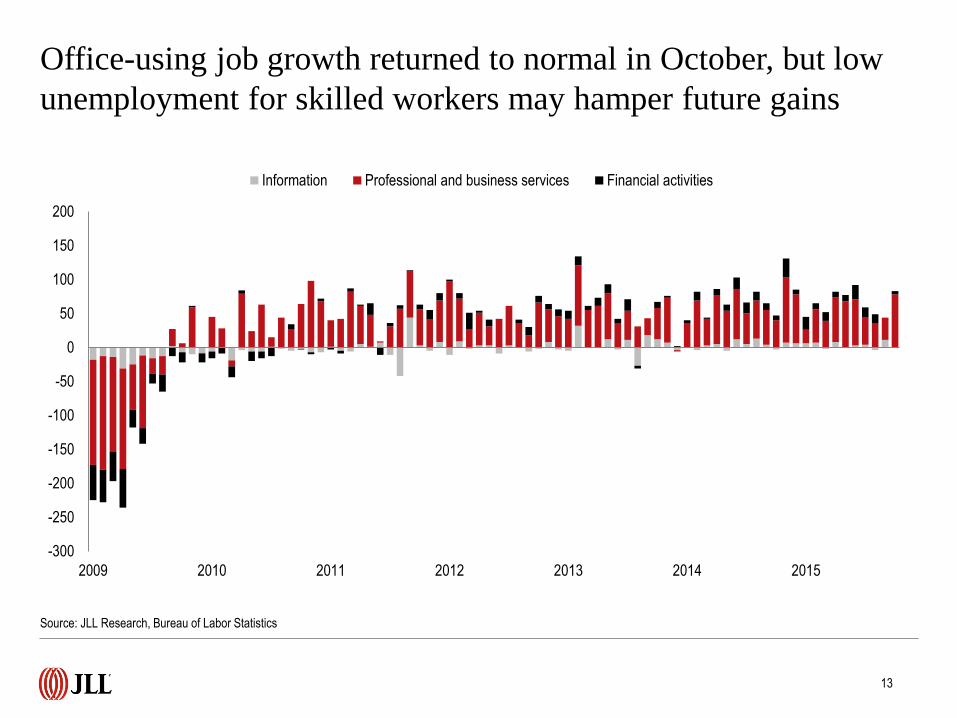
Office-using job growth returned to normal in October, but low
unemployment for skilled workers may hamper future gains
-300
-250
-200
-150
-100
-50
0
50
100
150
200
2009 2010 2011 2012 2013 2014 2015
Information Professional and business services Financial activities
Source: JLL Research, Bureau of Labor Statistics
13
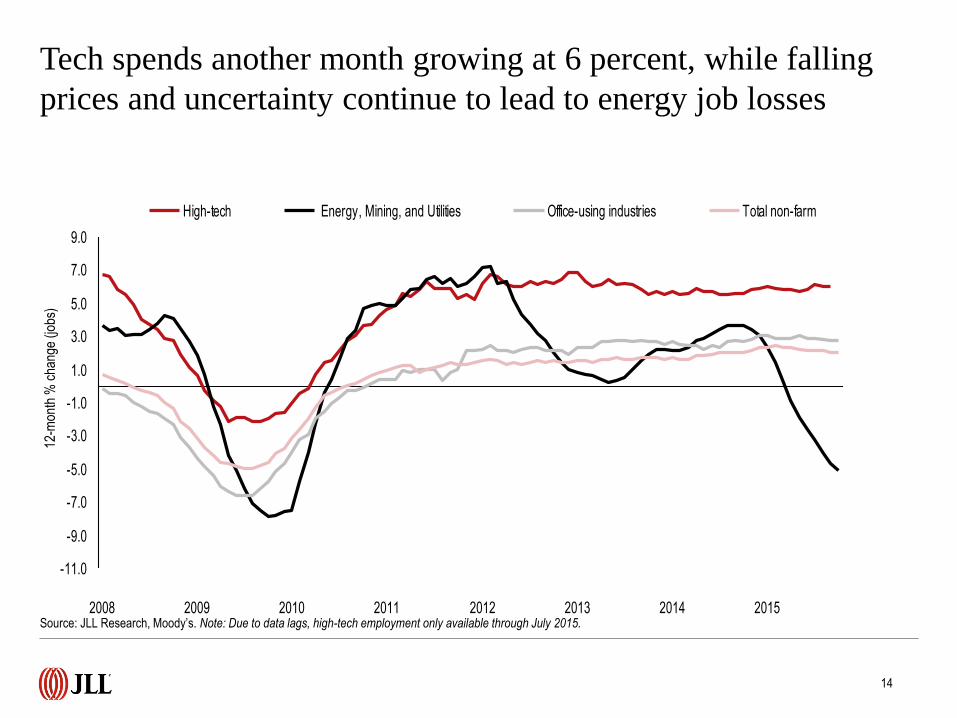
Tech spends another month growing at 6 percent, while falling
prices and uncertainty continue to lead to energy job losses
-11.0
-9.0
-7.0
-5.0
-3.0
-1.0
1.0
3.0
5.0
7.0
9.0
2008 2009 2010 2011 2012 2013 2014 2015
High-tech Energy, Mining, and Utilities Office-using industries Total non-farm
Source: JLL Research, Moody’s. Note: Due to data lags, high-tech employment only available through July 2015.
14
12-m
onth
% c
hang
e (jo
bs)
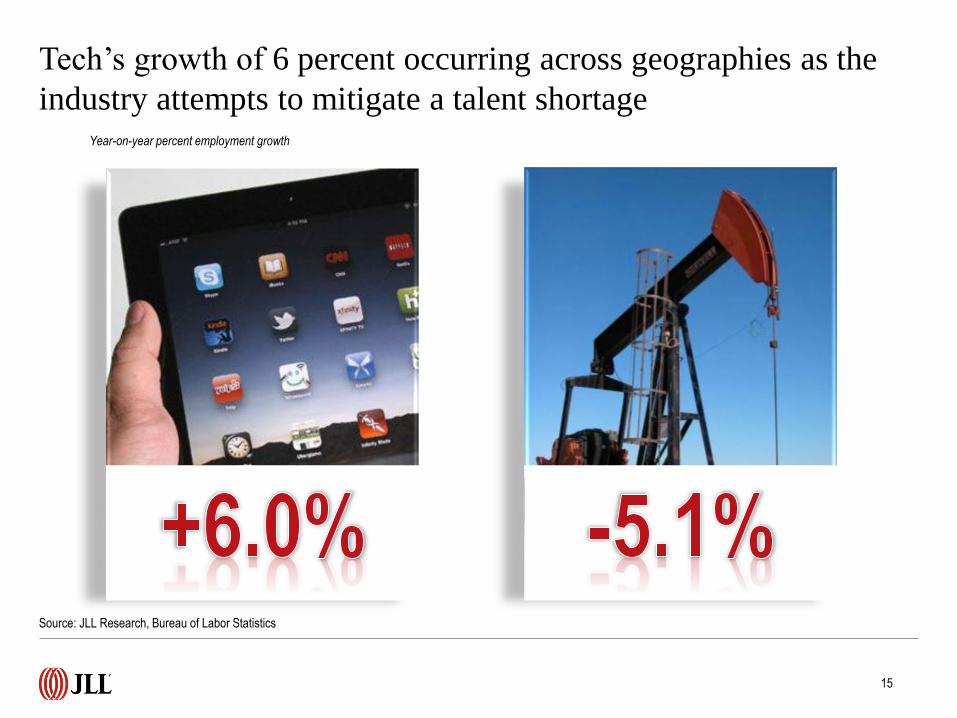
Tech’s growth of 6 percent occurring across geographies as the
industry attempts to mitigate a talent shortageYear-on-year percent employment growth
Source: JLL Research, Bureau of Labor Statistics
15
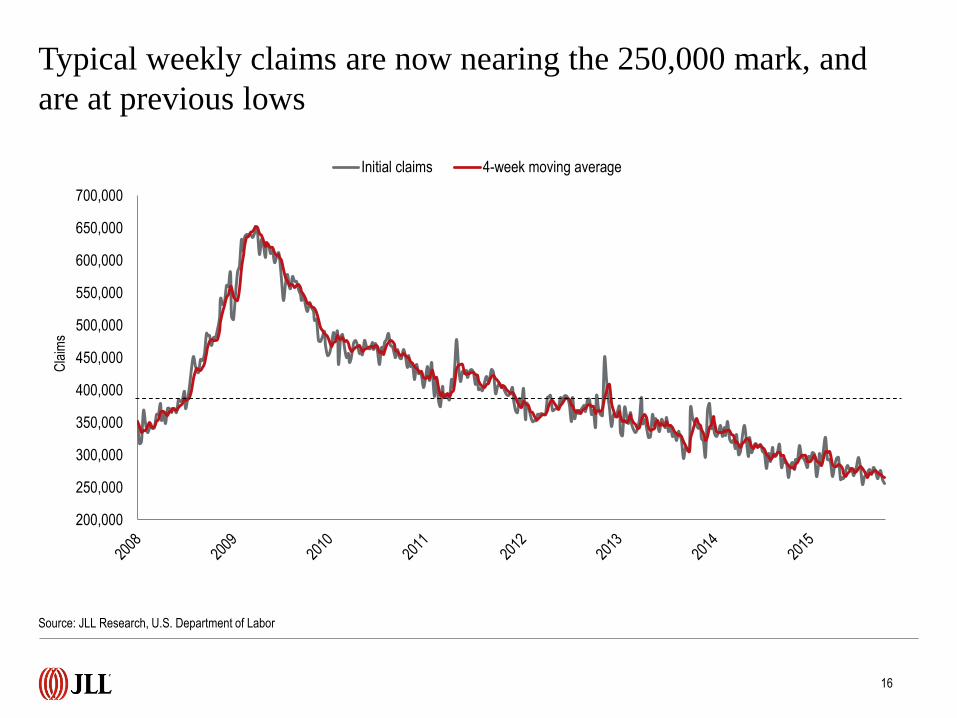
Typical weekly claims are now nearing the 250,000 mark, and
are at previous lows
Source: JLL Research, U.S. Department of Labor
16
200,000
250,000
300,000
350,000
400,000
450,000
500,000
550,000
600,000
650,000
700,000
Cla
ims
Initial claims 4-week moving average
0
1,000
2,000
3,000
4,000
5,000
6,000
2007 2008 2009 2010 2011 2012 2013 2014 2015
Hire
s an
d qu
its (
thou
sand
s)
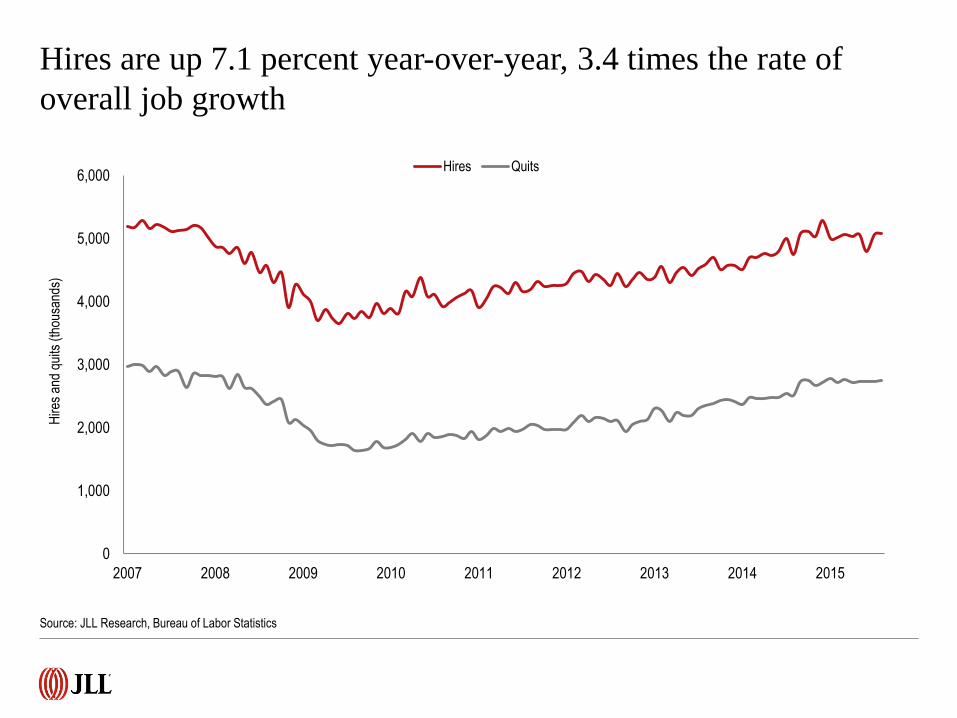
Hires Quits
Hires are up 7.1 percent year-over-year, 3.4 times the rate of
overall job growth
Source: JLL Research, Bureau of Labor Statistics
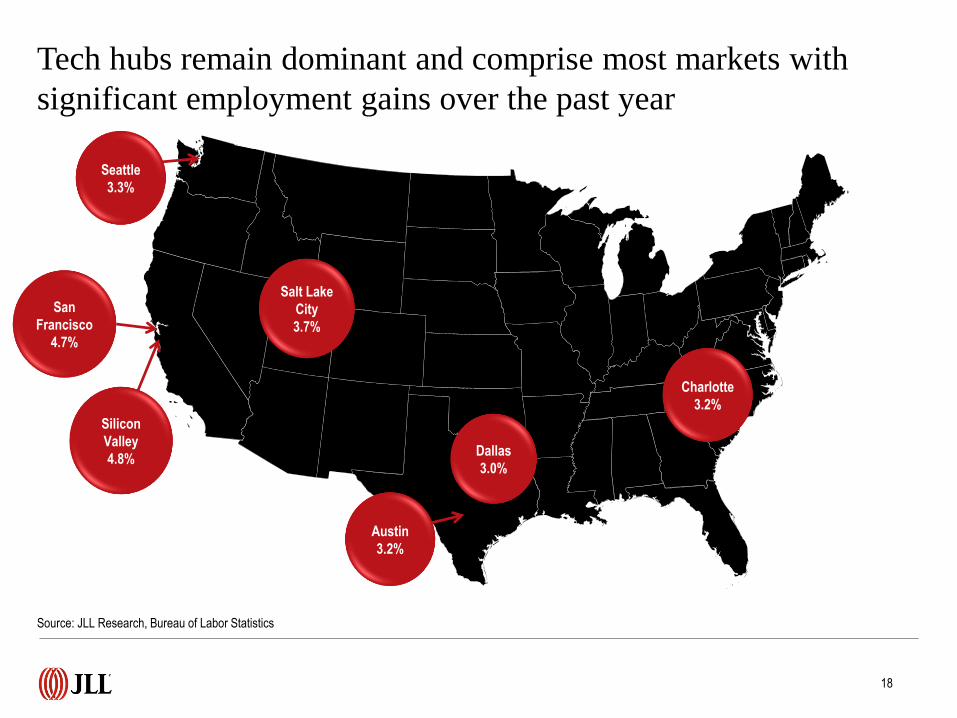
Tech hubs remain dominant and comprise most markets with
significant employment gains over the past year
Source: JLL Research, Bureau of Labor Statistics
18
Silicon
Valley
4.8%
San
Francisco
4.7%
Dallas
3.0%
Seattle
3.3%
Austin
3.2%
Salt Lake
City
3.7%
Charlotte
3.2%
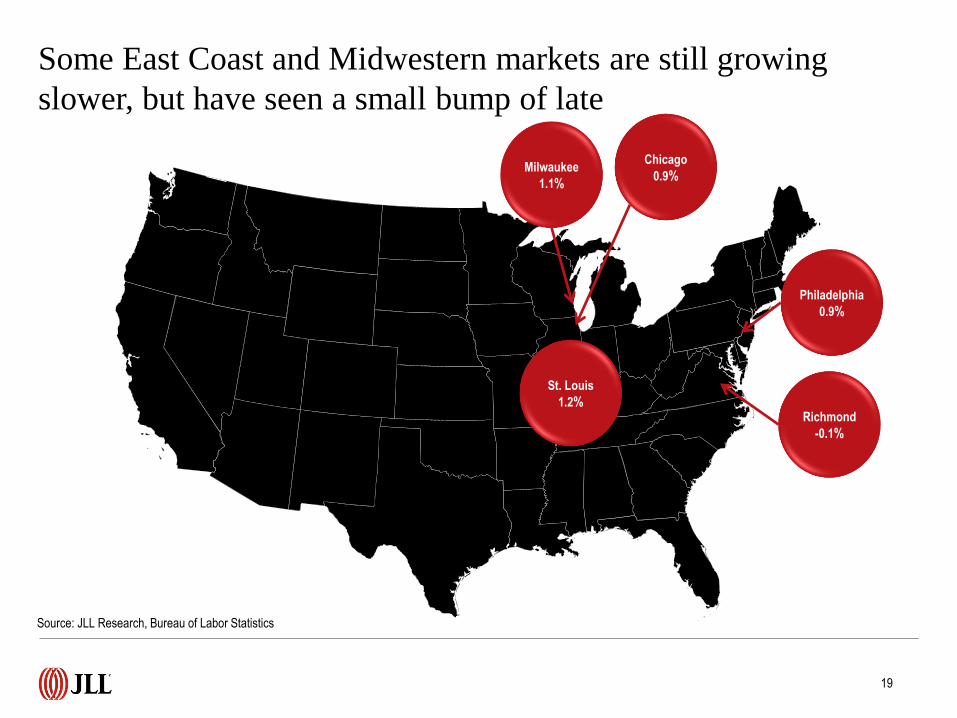
Some East Coast and Midwestern markets are still growing
slower, but have seen a small bump of late
19
Source: JLL Research, Bureau of Labor Statistics
Richmond
-0.1%
Philadelphia
0.9%
Chicago
0.9%Milwaukee
1.1%
St. Louis
1.2%
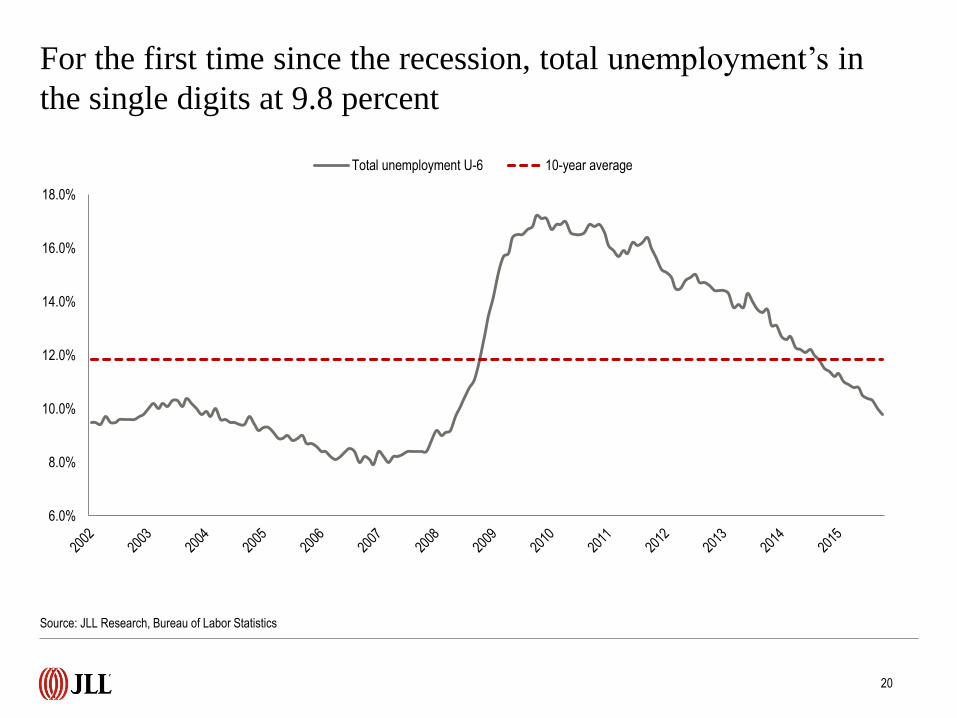
For the first time since the recession, total unemployment’s in
the single digits at 9.8 percent
6.0%
8.0%
10.0%
12.0%
14.0%
16.0%
18.0%
Total unemployment U-6 10-year average
Source: JLL Research, Bureau of Labor Statistics
20
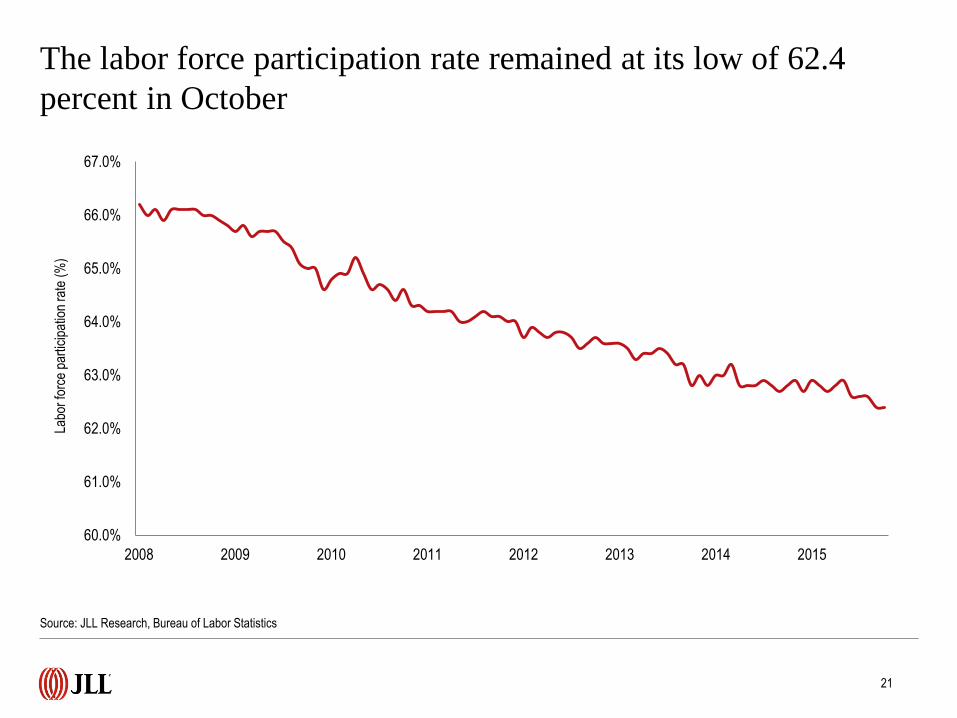
The labor force participation rate remained at its low of 62.4
percent in October
Source: JLL Research, Bureau of Labor Statistics
21
60.0%
61.0%
62.0%
63.0%
64.0%
65.0%
66.0%
67.0%
2008 2009 2010 2011 2012 2013 2014 2015
Labo
r fo
rce
part
icip
atio
n ra
te (
%)

©2015 Jones Lang LaSalle Research IP, Inc. All rights reserved. All information contained herein is from sources deemed reliable; however, no representation or warranty is made to the accuracy thereof.
For more information, please contact:
Ben Breslau
Managing Director - Americas Research
Phil Ryan
Research Analyst – Office and Economy Research
Or, find more employment, business and real estate
research at jll.com.
>>> Click here to check it out.