Embed Size (px)
Citation preview
Please refer to important disclosures at the end of this report 1
Y/E March (` cr) 2QFY11 2QFY10 % chg (yoy) Angel est. % diff
Net Sales 5,434 4,558 19.2 5,381 1.0
EBITDA 895 831 7.7 795 12.6
EBITDA margin (%) 16.5 18.2 (177)bp 14.8 169bp
PAT 758 703 7.9 635 19.4
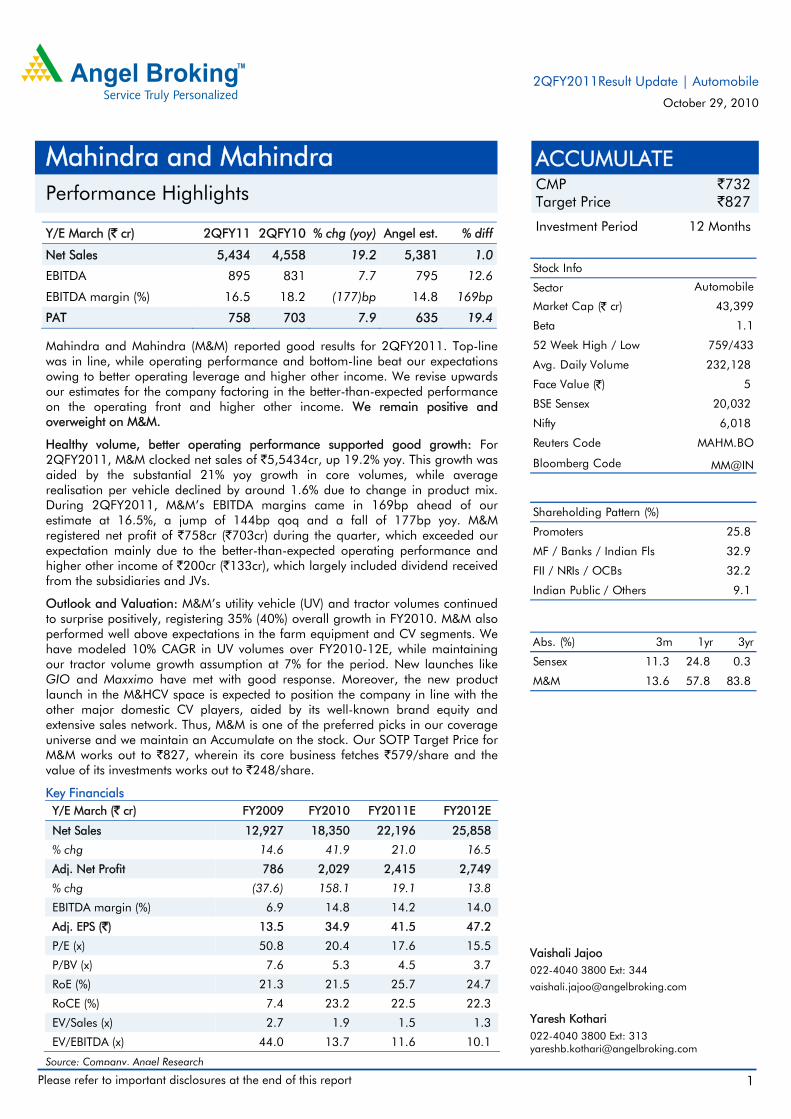
Mahindra and Mahindra (M&M) reported good results for 2QFY2011. Top-line was in line, while operating performance and bottom-line beat our expectations owing to better operating leverage and higher other income. We revise upwards our estimates for the company factoring in the better-than-expected performance on the operating front and higher other income. We remain positive and overweight on M&M.
Healthy volume, better operating performance supported good growth: For 2QFY2011, M&M clocked net sales of `5,5434cr, up 19.2% yoy. This growth was aided by the substantial 21% yoy growth in core volumes, while average realisation per vehicle declined by around 1.6% due to change in product mix. During 2QFY2011, M&M’s EBITDA margins came in 169bp ahead of our estimate at 16.5%, a jump of 144bp qoq and a fall of 177bp yoy. M&M registered net profit of `758cr (`703cr) during the quarter, which exceeded our expectation mainly due to the better-than-expected operating performance and higher other income of `200cr (`133cr), which largely included dividend received from the subsidiaries and JVs.
Outlook and Valuation: M&M’s utility vehicle (UV) and tractor volumes continued to surprise positively, registering 35% (40%) overall growth in FY2010. M&M also performed well above expectations in the farm equipment and CV segments. We have modeled 10% CAGR in UV volumes over FY2010-12E, while maintaining our tractor volume growth assumption at 7% for the period. New launches like GIO and Maxximo have met with good response. Moreover, the new product launch in the M&HCV space is expected to position the company in line with the other major domestic CV players, aided by its well-known brand equity and extensive sales network. Thus, M&M is one of the preferred picks in our coverage universe and we maintain an Accumulate on the stock. Our SOTP Target Price for M&M works out to `827, wherein its core business fetches `579/share and the value of its investments works out to `248/share.
Key Financials Y/E March (` cr) FY2009 FY2010 FY2011E FY2012E
Net Sales 12,927 18,350 22,196 25,858
% chg 14.6 41.9 21.0 16.5
Adj. Net Profit 786 2,029 2,415 2,749
% chg (37.6) 158.1 19.1 13.8
EBITDA margin (%) 6.9 14.8 14.2 14.0
Adj. EPS (`) 13.5 34.9 41.5 47.2
P/E (x) 50.8 20.4 17.6 15.5
P/BV (x) 7.6 5.3 4.5 3.7
RoE (%) 21.3 21.5 25.7 24.7
RoCE (%) 7.4 23.2 22.5 22.3
EV/Sales (x) 2.7 1.9 1.5 1.3
EV/EBITDA (x) 44.0 13.7 11.6 10.1
Source: Company, Angel Research
ACCUMULATE CMP `732 Target Price `827
Investment Period 12 Months
Stock Info
Sector
Bloomberg Code
Shareholding Pattern (%)
Promoters 25.8
MF / Banks / Indian Fls 32.9
FII / NRIs / OCBs 32.2
Indian Public / Others 9.1
Abs. (%) 3m 1yr 3yr
Sensex 11.3 24.8 0.3
M&M 13.6 57.8 83.8
6,018
MAHM.BO
43,399
1.1
759/433
232,128
Market Cap (` cr)
Beta
52 Week High / Low
5
20,032
MM@IN
Face Value (`)
BSE Sensex
Nifty
Reuters Code
Automobile
Avg. Daily Volume
Vaishali Jajoo 022-4040 3800 Ext: 344
Yaresh Kothari 022-4040 3800 Ext: 313 [email protected]
Mahindra and Mahindra Performance Highlights
2QFY2011Result Update | Automobile
October 29, 2010
M & M |2QFY2011 Result Update
October 29, 2010 2
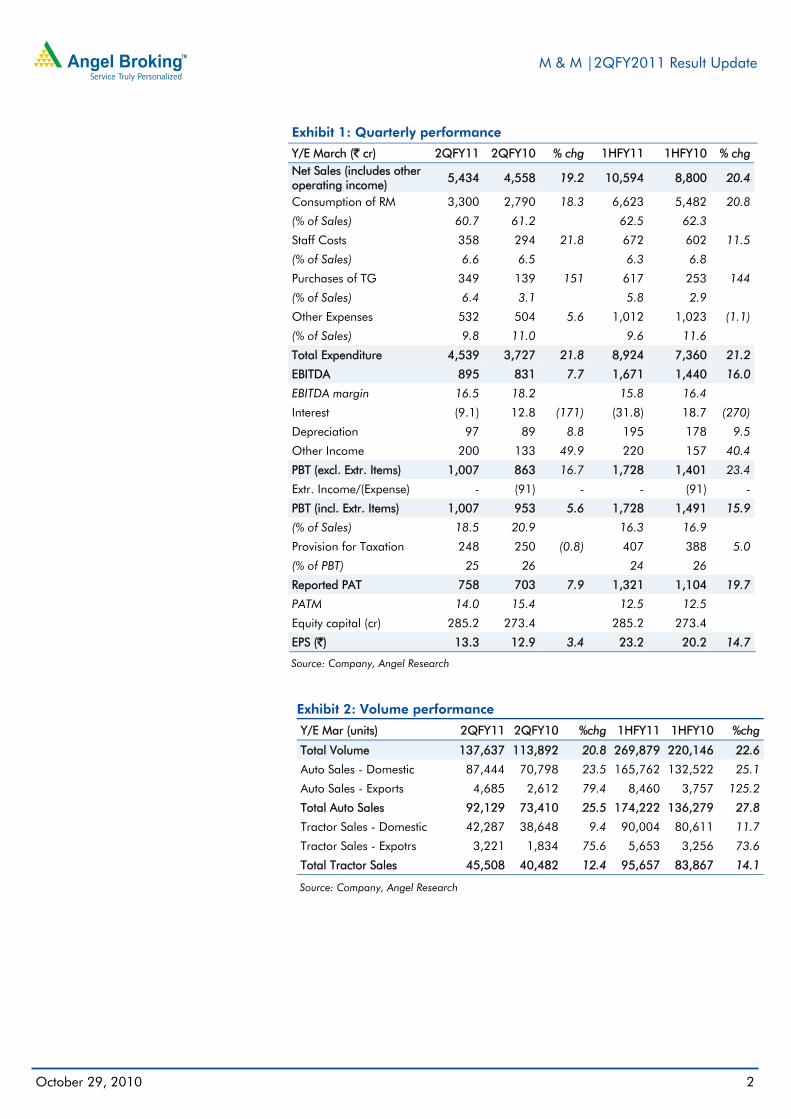
Exhibit 1: Quarterly performance
Y/E March (` cr) 2QFY11 2QFY10 % chg 1HFY11 1HFY10 % chg Net Sales (includes other operating income)
5,434 4,558 19.2 10,594 8,800 20.4
Consumption of RM 3,300 2,790 18.3 6,623 5,482 20.8
(% of Sales) 60.7 61.2 62.5 62.3 Staff Costs 358 294 21.8 672 602 11.5
(% of Sales) 6.6 6.5 6.3 6.8 Purchases of TG 349 139 151 617 253 144
(% of Sales) 6.4 3.1 5.8 2.9 Other Expenses 532 504 5.6 1,012 1,023 (1.1)
(% of Sales) 9.8 11.0 9.6 11.6 Total Expenditure 4,539 3,727 21.8 8,924 7,360 21.2
EBITDA 895 831 7.7 1,671 1,440 16.0
EBITDA margin 16.5 18.2 15.8 16.4 Interest (9.1) 12.8 (171) (31.8) 18.7 (270)
Depreciation 97 89 8.8 195 178 9.5
Other Income 200 133 49.9 220 157 40.4
PBT (excl. Extr. Items) 1,007 863 16.7 1,728 1,401 23.4
Extr. Income/(Expense) - (91) - - (91) -
PBT (incl. Extr. Items) 1,007 953 5.6 1,728 1,491 15.9
(% of Sales) 18.5 20.9 16.3 16.9 Provision for Taxation 248 250 (0.8) 407 388 5.0
(% of PBT) 25 26 24 26 Reported PAT 758 703 7.9 1,321 1,104 19.7
PATM 14.0 15.4 12.5 12.5 Equity capital (cr) 285.2 273.4 285.2 273.4 EPS (`) 13.3 12.9 3.4 23.2 20.2 14.7
Source: Company, Angel Research
Exhibit 2: Volume performance
Y/E Mar (units) 2QFY11 2QFY10 %chg 1HFY11 1HFY10 %chg
Total Volume 137,637 113,892 20.8 269,879 220,146 22.6
Auto Sales - Domestic 87,444 70,798 23.5 165,762 132,522 25.1
Auto Sales - Exports 4,685 2,612 79.4 8,460 3,757 125.2
Total Auto Sales 92,129 73,410 25.5 174,222 136,279 27.8
Tractor Sales - Domestic 42,287 38,648 9.4 90,004 80,611 11.7
Tractor Sales - Expotrs 3,221 1,834 75.6 5,653 3,256 73.6
Total Tractor Sales 45,508 40,482 12.4 95,657 83,867 14.1
Source: Company, Angel Research
M & M |2QFY2011 Result Update
October 29, 2010 3
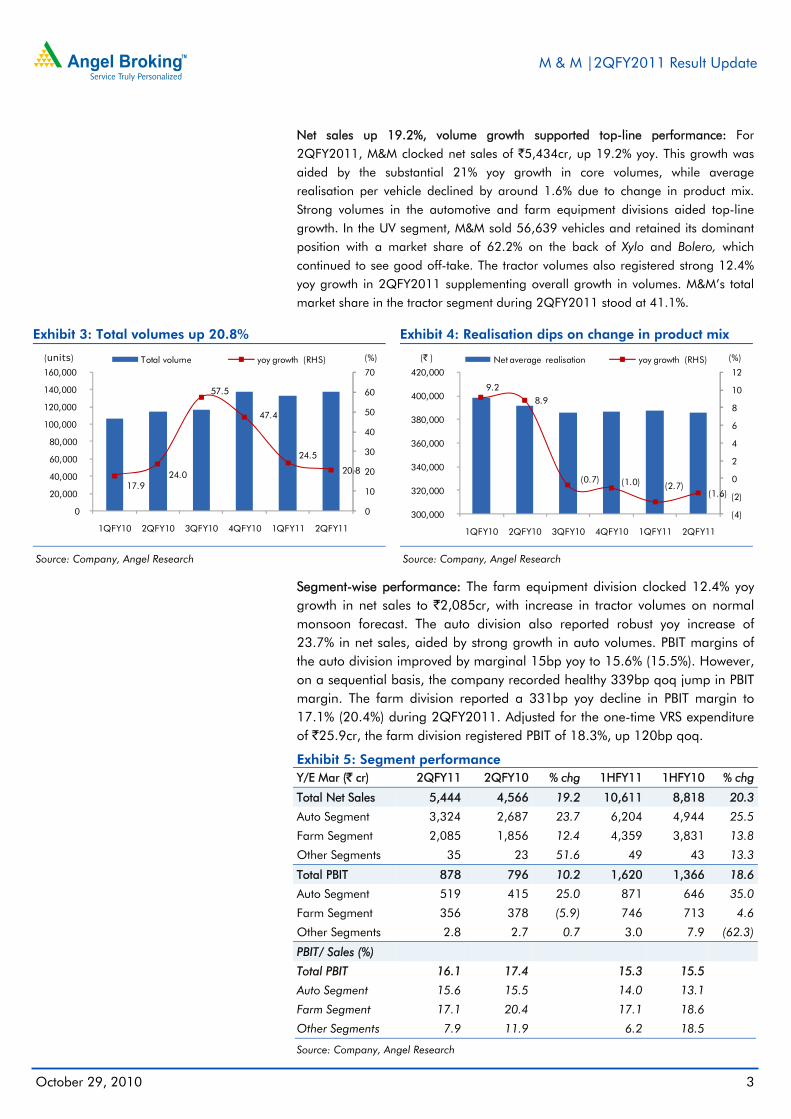
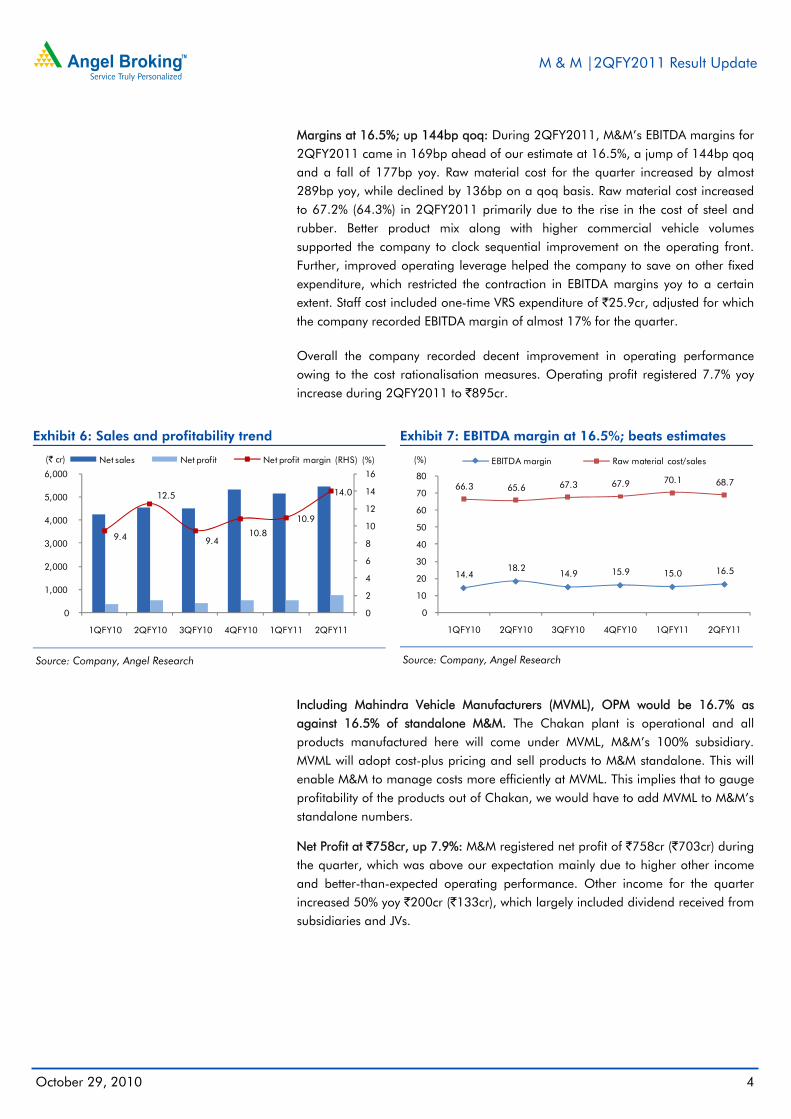
Net sales up 19.2%, volume growth supported top-line performance: For 2QFY2011, M&M clocked net sales of `5,434cr, up 19.2% yoy. This growth was aided by the substantial 21% yoy growth in core volumes, while average realisation per vehicle declined by around 1.6% due to change in product mix. Strong volumes in the automotive and farm equipment divisions aided top-line growth. In the UV segment, M&M sold 56,639 vehicles and retained its dominant position with a market share of 62.2% on the back of Xylo and Bolero, which continued to see good off-take. The tractor volumes also registered strong 12.4% yoy growth in 2QFY2011 supplementing overall growth in volumes. M&M’s total market share in the tractor segment during 2QFY2011 stood at 41.1%.
Exhibit 3: Total volumes up 20.8%
Source: Company, Angel Research
Exhibit 4: Realisation dips on change in product mix
Source: Company, Angel Research
Segment-wise performance: The farm equipment division clocked 12.4% yoy growth in net sales to `2,085cr, with increase in tractor volumes on normal monsoon forecast. The auto division also reported robust yoy increase of 23.7% in net sales, aided by strong growth in auto volumes. PBIT margins of the auto division improved by marginal 15bp yoy to 15.6% (15.5%). However, on a sequential basis, the company recorded healthy 339bp qoq jump in PBIT margin. The farm division reported a 331bp yoy decline in PBIT margin to 17.1% (20.4%) during 2QFY2011. Adjusted for the one-time VRS expenditure of `25.9cr, the farm division registered PBIT of 18.3%, up 120bp qoq.
Exhibit 5: Segment performance Y/E Mar (` cr) 2QFY11 2QFY10 % chg 1HFY11 1HFY10 % chg
Total Net Sales 5,444 4,566 19.2 10,611 8,818 20.3
Auto Segment 3,324 2,687 23.7 6,204 4,944 25.5
Farm Segment 2,085 1,856 12.4 4,359 3,831 13.8
Other Segments 35 23 51.6 49 43 13.3
Total PBIT 878 796 10.2 1,620 1,366 18.6
Auto Segment 519 415 25.0 871 646 35.0
Farm Segment 356 378 (5.9) 746 713 4.6
Other Segments 2.8 2.7 0.7 3.0 7.9 (62.3)
PBIT/ Sales (%)
Total PBIT 16.1 17.4
15.3 15.5
Auto Segment 15.6 15.5
14.0 13.1
Farm Segment 17.1 20.4
17.1 18.6
Other Segments 7.9 11.9 6.2 18.5
Source: Company, Angel Research
17.9 24.0
57.5
47.4
24.5
20.8
0
10
20
30
40
50
60
70
0
20,000
40,000
60,000
80,000
100,000
120,000
140,000
160,000
1QFY10 2QFY10 3QFY10 4QFY10 1QFY11 2QFY11
(%)(units) Total volume yoy growth (RHS)
9.2 8.9
(0.7) (1.0) (2.7)(1.6)
(4)
(2)
0
2
4
6
8
10
12
300,000
320,000
340,000
360,000
380,000
400,000
420,000
1QFY10 2QFY10 3QFY10 4QFY10 1QFY11 2QFY11
(%)(` ) Net average realisation yoy growth (RHS)
M & M |2QFY2011 Result Update
October 29, 2010 4
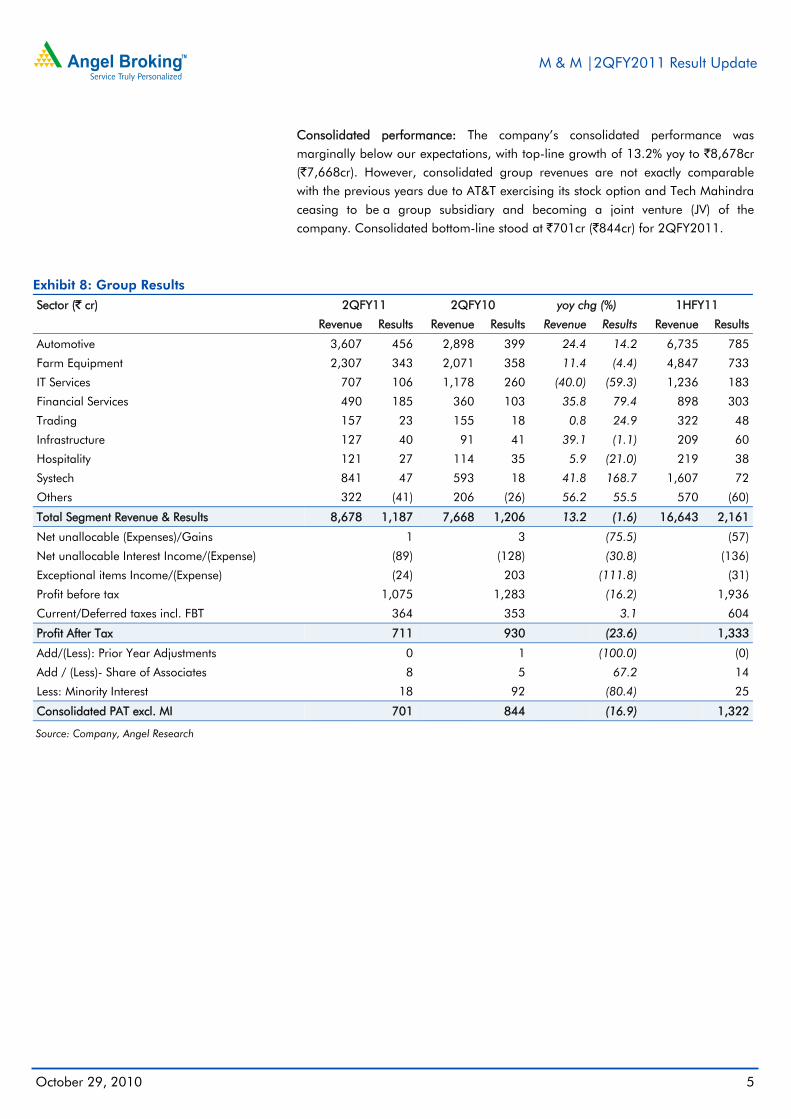
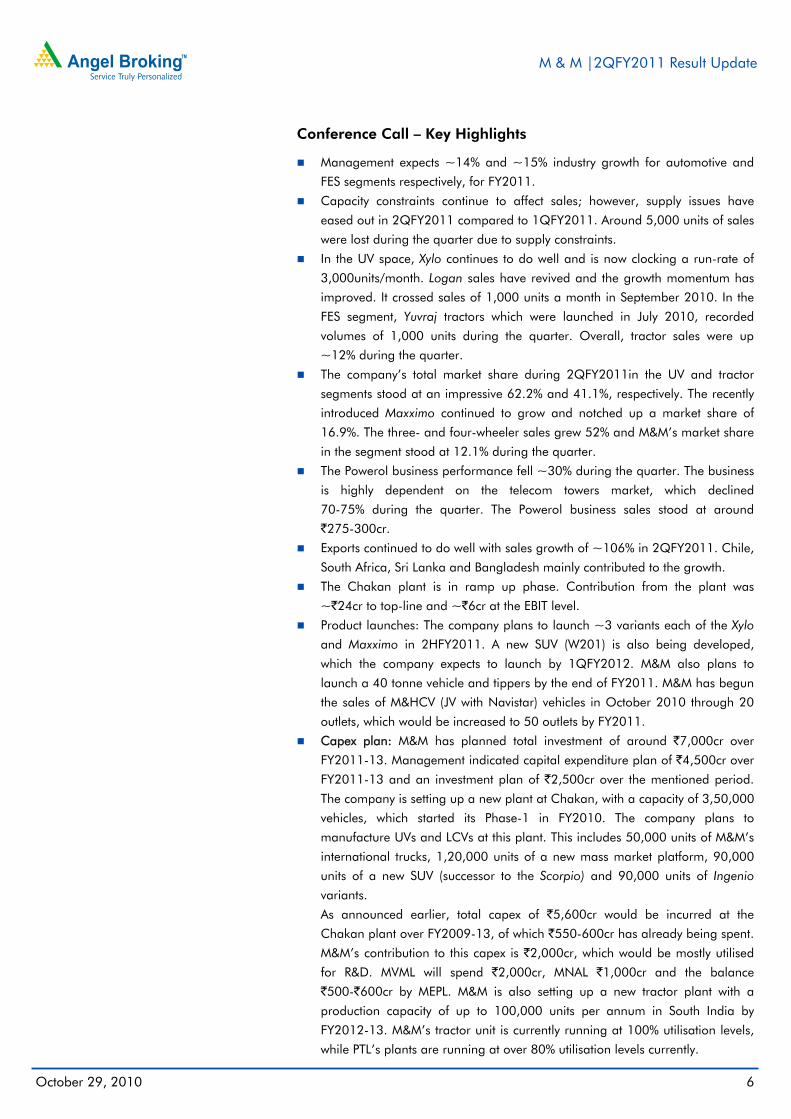
Margins at 16.5%; up 144bp qoq: During 2QFY2011, M&M’s EBITDA margins for 2QFY2011 came in 169bp ahead of our estimate at 16.5%, a jump of 144bp qoq and a fall of 177bp yoy. Raw material cost for the quarter increased by almost 289bp yoy, while declined by 136bp on a qoq basis. Raw material cost increased to 67.2% (64.3%) in 2QFY2011 primarily due to the rise in the cost of steel and rubber. Better product mix along with higher commercial vehicle volumes supported the company to clock sequential improvement on the operating front. Further, improved operating leverage helped the company to save on other fixed expenditure, which restricted the contraction in EBITDA margins yoy to a certain extent. Staff cost included one-time VRS expenditure of `25.9cr, adjusted for which the company recorded EBITDA margin of almost 17% for the quarter.
Overall the company recorded decent improvement in operating performance owing to the cost rationalisation measures. Operating profit registered 7.7% yoy increase during 2QFY2011 to `895cr.
Exhibit 6: Sales and profitability trend
Source: Company, Angel Research
Exhibit 7: EBITDA margin at 16.5%; beats estimates
Source: Company, Angel Research
Including Mahindra Vehicle Manufacturers (MVML), OPM would be 16.7% as against 16.5% of standalone M&M. The Chakan plant is operational and all products manufactured here will come under MVML, M&M’s 100% subsidiary. MVML will adopt cost-plus pricing and sell products to M&M standalone. This will enable M&M to manage costs more efficiently at MVML. This implies that to gauge profitability of the products out of Chakan, we would have to add MVML to M&M’s standalone numbers.
Net Profit at `758cr, up 7.9%: M&M registered net profit of `758cr (`703cr) during the quarter, which was above our expectation mainly due to higher other income and better-than-expected operating performance. Other income for the quarter increased 50% yoy `200cr (`133cr), which largely included dividend received from subsidiaries and JVs.
9.4
12.5
9.4 10.8
10.9
14.0
0
2
4
6
8
10
12
14
16
0
1,000
2,000
3,000
4,000
5,000
6,000
1QFY10 2QFY10 3QFY10 4QFY10 1QFY11 2QFY11
(%)(` cr) Net sales Net profit Net profit margin (RHS)
14.4 18.2
14.9 15.9 15.0 16.5
66.3 65.6 67.3 67.9 70.1 68.7
0
10
20
30
40
50
60
70
80
1QFY10 2QFY10 3QFY10 4QFY10 1QFY11 2QFY11
(%) EBITDA margin Raw material cost/sales
M & M |2QFY2011 Result Update
October 29, 2010 5
Consolidated performance: The company’s consolidated performance was marginally below our expectations, with top-line growth of 13.2% yoy to `8,678cr (`7,668cr). However, consolidated group revenues are not exactly comparable with the previous years due to AT&T exercising its stock option and Tech Mahindra ceasing to be a group subsidiary and becoming a joint venture (JV) of the company. Consolidated bottom-line stood at `701cr (`844cr) for 2QFY2011.
Exhibit 8: Group Results Sector (` cr) 2QFY11 2QFY10 yoy chg (%) 1HFY11
Revenue Results Revenue Results Revenue Results Revenue Results
Automotive 3,607 456 2,898 399 24.4 14.2 6,735 785
Farm Equipment 2,307 343 2,071 358 11.4 (4.4) 4,847 733
IT Services 707 106 1,178 260 (40.0) (59.3) 1,236 183
Financial Services 490 185 360 103 35.8 79.4 898 303
Trading 157 23 155 18 0.8 24.9 322 48
Infrastructure 127 40 91 41 39.1 (1.1) 209 60
Hospitality 121 27 114 35 5.9 (21.0) 219 38
Systech 841 47 593 18 41.8 168.7 1,607 72
Others 322 (41) 206 (26) 56.2 55.5 570 (60)
Total Segment Revenue & Results 8,678 1,187 7,668 1,206 13.2 (1.6) 16,643 2,161
Net unallocable (Expenses)/Gains
1
3
(75.5)
(57)
Net unallocable Interest Income/(Expense)
(89)
(128)
(30.8)
(136)
Exceptional items Income/(Expense)
(24)
203
(111.8)
(31)
Profit before tax
1,075
1,283
(16.2)
1,936
Current/Deferred taxes incl. FBT
364
353
3.1
604
Profit After Tax
711
930
(23.6)
1,333
Add/(Less): Prior Year Adjustments
0
1
(100.0)
(0)
Add / (Less)- Share of Associates
8
5
67.2
14
Less: Minority Interest
18
92
(80.4)
25
Consolidated PAT excl. MI
701
844
(16.9)
1,322
Source: Company, Angel Research
M & M |2QFY2011 Result Update
October 29, 2010 6
Conference Call – Key Highlights
Management expects ~14% and ~15% industry growth for automotive and
FES segments respectively, for FY2011.
Capacity constraints continue to affect sales; however, supply issues have
eased out in 2QFY2011 compared to 1QFY2011. Around 5,000 units of sales
were lost during the quarter due to supply constraints.
In the UV space, Xylo continues to do well and is now clocking a run-rate of
3,000units/month. Logan sales have revived and the growth momentum has
improved. It crossed sales of 1,000 units a month in September 2010. In the
FES segment, Yuvraj tractors which were launched in July 2010, recorded
volumes of 1,000 units during the quarter. Overall, tractor sales were up
~12% during the quarter.
The company’s total market share during 2QFY2011in the UV and tractor
segments stood at an impressive 62.2% and 41.1%, respectively. The recently
introduced Maxximo continued to grow and notched up a market share of
16.9%. The three- and four-wheeler sales grew 52% and M&M’s market share
in the segment stood at 12.1% during the quarter.
The Powerol business performance fell ~30% during the quarter. The business
is highly dependent on the telecom towers market, which declined
70-75% during the quarter. The Powerol business sales stood at around
`275-300cr.
Exports continued to do well with sales growth of ~106% in 2QFY2011. Chile,
South Africa, Sri Lanka and Bangladesh mainly contributed to the growth.
The Chakan plant is in ramp up phase. Contribution from the plant was
~`24cr to top-line and ~`6cr at the EBIT level.
Product launches: The company plans to launch ~3 variants each of the Xylo
and Maxximo in 2HFY2011. A new SUV (W201) is also being developed,
which the company expects to launch by 1QFY2012. M&M also plans to
launch a 40 tonne vehicle and tippers by the end of FY2011. M&M has begun
the sales of M&HCV (JV with Navistar) vehicles in October 2010 through 20
outlets, which would be increased to 50 outlets by FY2011.
Capex plan: M&M has planned total investment of around `7,000cr over
FY2011-13. Management indicated capital expenditure plan of `4,500cr over
FY2011-13 and an investment plan of `2,500cr over the mentioned period.
The company is setting up a new plant at Chakan, with a capacity of 3,50,000
vehicles, which started its Phase-1 in FY2010. The company plans to
manufacture UVs and LCVs at this plant. This includes 50,000 units of M&M’s
international trucks, 1,20,000 units of a new mass market platform, 90,000
units of a new SUV (successor to the Scorpio) and 90,000 units of Ingenio
variants.
As announced earlier, total capex of `5,600cr would be incurred at the
Chakan plant over FY2009-13, of which `550-600cr has already being spent.
M&M’s contribution to this capex is `2,000cr, which would be mostly utilised
for R&D. MVML will spend `2,000cr, MNAL `1,000cr and the balance
`500-`600cr by MEPL. M&M is also setting up a new tractor plant with a
production capacity of up to 100,000 units per annum in South India by
FY2012-13. M&M’s tractor unit is currently running at 100% utilisation levels,
while PTL’s plants are running at over 80% utilisation levels currently.
M & M |2QFY2011 Result Update
October 29, 2010 7
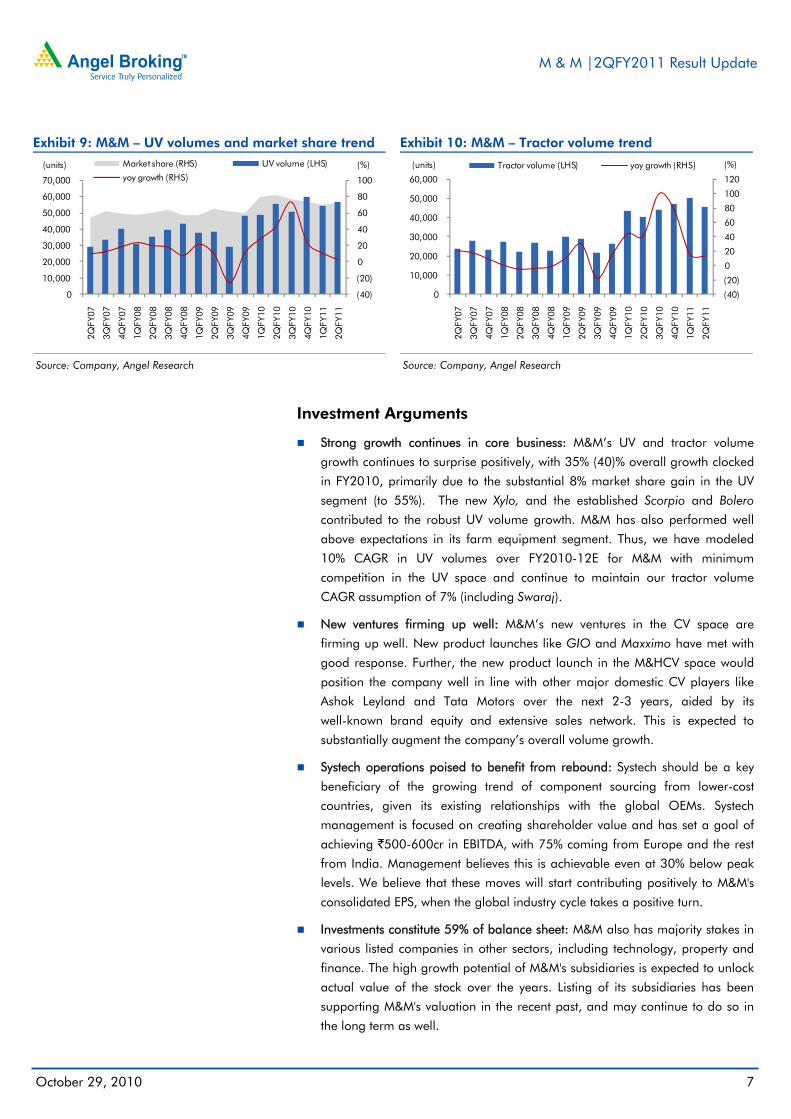
Exhibit 9: M&M – UV volumes and market share trend
Source: Company, Angel Research
Exhibit 10: M&M – Tractor volume trend
Source: Company, Angel Research
Investment Arguments
Strong growth continues in core business: M&M’s UV and tractor volume
growth continues to surprise positively, with 35% (40)% overall growth clocked
in FY2010, primarily due to the substantial 8% market share gain in the UV
segment (to 55%). The new Xylo, and the established Scorpio and Bolero
contributed to the robust UV volume growth. M&M has also performed well
above expectations in its farm equipment segment. Thus, we have modeled
10% CAGR in UV volumes over FY2010-12E for M&M with minimum
competition in the UV space and continue to maintain our tractor volume
CAGR assumption of 7% (including Swaraj).
New ventures firming up well: M&M’s new ventures in the CV space are
firming up well. New product launches like GIO and Maxximo have met with
good response. Further, the new product launch in the M&HCV space would
position the company well in line with other major domestic CV players like
Ashok Leyland and Tata Motors over the next 2-3 years, aided by its
well-known brand equity and extensive sales network. This is expected to
substantially augment the company’s overall volume growth.
Systech operations poised to benefit from rebound: Systech should be a key
beneficiary of the growing trend of component sourcing from lower-cost
countries, given its existing relationships with the global OEMs. Systech
management is focused on creating shareholder value and has set a goal of
achieving `500-600cr in EBITDA, with 75% coming from Europe and the rest
from India. Management believes this is achievable even at 30% below peak
levels. We believe that these moves will start contributing positively to M&M's
consolidated EPS, when the global industry cycle takes a positive turn.
Investments constitute 59% of balance sheet: M&M also has majority stakes in
various listed companies in other sectors, including technology, property and
finance. The high growth potential of M&M's subsidiaries is expected to unlock
actual value of the stock over the years. Listing of its subsidiaries has been
supporting M&M's valuation in the recent past, and may continue to do so in
the long term as well.
(40)
(20)
0
20
40
60
80
100
0
10,000
20,000
30,000
40,000
50,000
60,000
70,000
2QFY
07
3QFY
07
4QFY
07
1QFY
08
2QFY
08
3QFY
08
4QFY
08
1QFY
09
2QFY
09
3QFY
09
4QFY
09
1QFY
10
2QFY
10
3QFY
10
4QFY
10
1QFY
11
2QFY
11
(%)(units) Market share (RHS) UV volume (LHS)
yoy growth (RHS)
(40)
(20)
0
20
40
60
80
100
120
0
10,000
20,000
30,000
40,000
50,000
60,000
2QFY
07
3QFY
07
4QFY
07
1QFY
08
2QFY
08
3QFY
08
4QFY
08
1QFY
09
2QFY
09
3QFY
09
4QFY
09
1QFY
10
2QFY
10
3QFY
10
4QFY
10
1QFY
11
2QFY
11
(%)(units) Tractor volume (LHS) yoy growth (RHS)
M & M |2QFY2011 Result Update
October 29, 2010 8
Outlook and Valuation
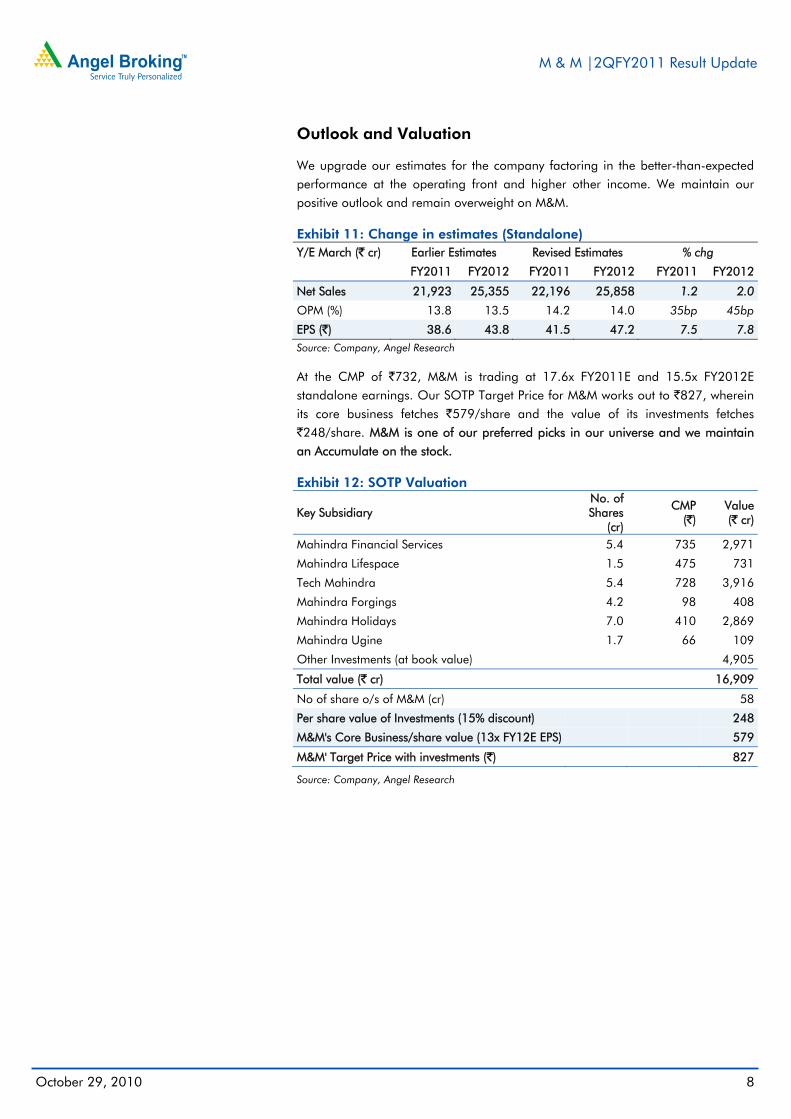
We upgrade our estimates for the company factoring in the better-than-expected performance at the operating front and higher other income. We maintain our positive outlook and remain overweight on M&M. Exhibit 11: Change in estimates (Standalone) Y/E March (` cr) Earlier Estimates Revised Estimates % chg
FY2011 FY2012 FY2011 FY2012 FY2011 FY2012
Net Sales 21,923 25,355 22,196 25,858 1.2 2.0
OPM (%) 13.8 13.5 14.2 14.0 35bp 45bp
EPS (`) 38.6 43.8 41.5 47.2 7.5 7.8
Source: Company, Angel Research
At the CMP of `732, M&M is trading at 17.6x FY2011E and 15.5x FY2012E standalone earnings. Our SOTP Target Price for M&M works out to `827, wherein its core business fetches `579/share and the value of its investments fetches `248/share. M&M is one of our preferred picks in our universe and we maintain an Accumulate on the stock. Exhibit 12: SOTP Valuation
Key Subsidiary No. of Shares
(cr)
CMP (`)
Value (` cr)
Mahindra Financial Services 5.4 735 2,971
Mahindra Lifespace 1.5 475 731
Tech Mahindra 5.4 728 3,916
Mahindra Forgings 4.2 98 408
Mahindra Holidays 7.0 410 2,869
Mahindra Ugine 1.7 66 109
Other Investments (at book value)
4,905
Total value (` cr)
16,909
No of share o/s of M&M (cr)
58
Per share value of Investments (15% discount)
248
M&M's Core Business/share value (13x FY12E EPS)
579
M&M' Target Price with investments (`)
827
Source: Company, Angel Research
M & M |2QFY2011 Result Update
October 29, 2010 9
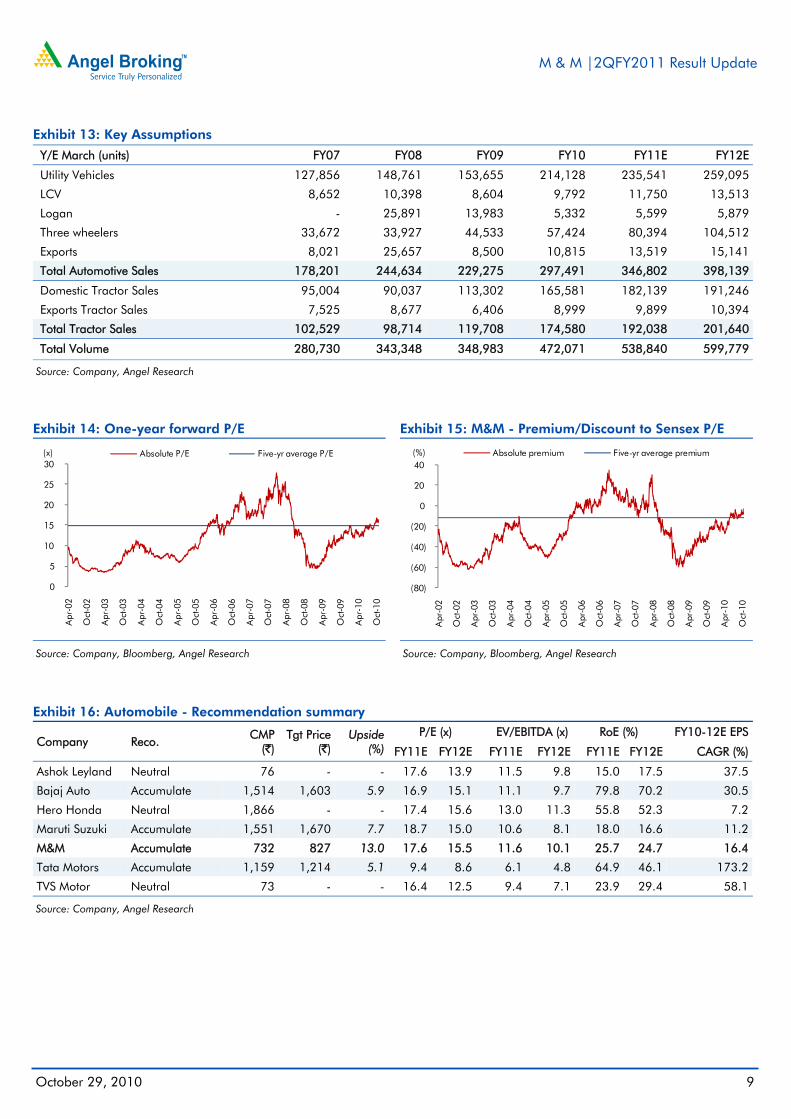
Exhibit 13: Key Assumptions
Y/E March (units) FY07 FY08 FY09 FY10 FY11E FY12E
Utility Vehicles 127,856 148,761 153,655 214,128 235,541 259,095
LCV 8,652 10,398 8,604 9,792 11,750 13,513
Logan - 25,891 13,983 5,332 5,599 5,879
Three wheelers 33,672 33,927 44,533 57,424 80,394 104,512
Exports 8,021 25,657 8,500 10,815 13,519 15,141
Total Automotive Sales 178,201 244,634 229,275 297,491 346,802 398,139
Domestic Tractor Sales 95,004 90,037 113,302 165,581 182,139 191,246
Exports Tractor Sales 7,525 8,677 6,406 8,999 9,899 10,394
Total Tractor Sales 102,529 98,714 119,708 174,580 192,038 201,640
Total Volume 280,730 343,348 348,983 472,071 538,840 599,779
Source: Company, Angel Research
Exhibit 14: One-year forward P/E
Source: Company, Bloomberg, Angel Research
Exhibit 15: M&M - Premium/Discount to Sensex P/E
Source: Company, Bloomberg, Angel Research
Exhibit 16: Automobile - Recommendation summary
Company Reco. CMP
(`) Tgt Price
(`) Upside
(%) P/E (x) EV/EBITDA (x) RoE (%) FY10-12E EPS
FY11E FY12E FY11E FY12E FY11E FY12E CAGR (%)
Ashok Leyland Neutral 76 - - 17.6 13.9 11.5 9.8 15.0 17.5 37.5
Bajaj Auto Accumulate 1,514 1,603 5.9 16.9 15.1 11.1 9.7 79.8 70.2 30.5
Hero Honda Neutral 1,866 - - 17.4 15.6 13.0 11.3 55.8 52.3 7.2
Maruti Suzuki Accumulate 1,551 1,670 7.7 18.7 15.0 10.6 8.1 18.0 16.6 11.2
M&M Accumulate 732 827 13.0 17.6 15.5 11.6 10.1 25.7 24.7 16.4
Tata Motors Accumulate 1,159 1,214 5.1 9.4 8.6 6.1 4.8 64.9 46.1 173.2
TVS Motor Neutral 73 - - 16.4 12.5 9.4 7.1 23.9 29.4 58.1
Source: Company, Angel Research
0
5
10
15
20
25
30
Apr
-02
Oct
-02
Apr
-03
Oct
-03
Apr
-04
Oct
-04
Apr
-05
Oct
-05
Apr
-06
Oct
-06
Apr
-07
Oct
-07
Apr
-08
Oct
-08
Apr
-09
Oct
-09
Apr
-10
Oct
-10
(x) Absolute P/E Five-yr average P/E
(80)
(60)
(40)
(20)
0
20
40
Apr
-02
Oct
-02
Apr
-03
Oct
-03
Apr
-04
Oct
-04
Apr
-05
Oct
-05
Apr
-06
Oct
-06
Apr
-07
Oct
-07
Apr
-08
Oct
-08
Apr
-09
Oct
-09
Apr
-10
Oct
-10
(%) Absolute premium Five-yr average premium
M & M |2QFY2011 Result Update
October 29, 2010 10
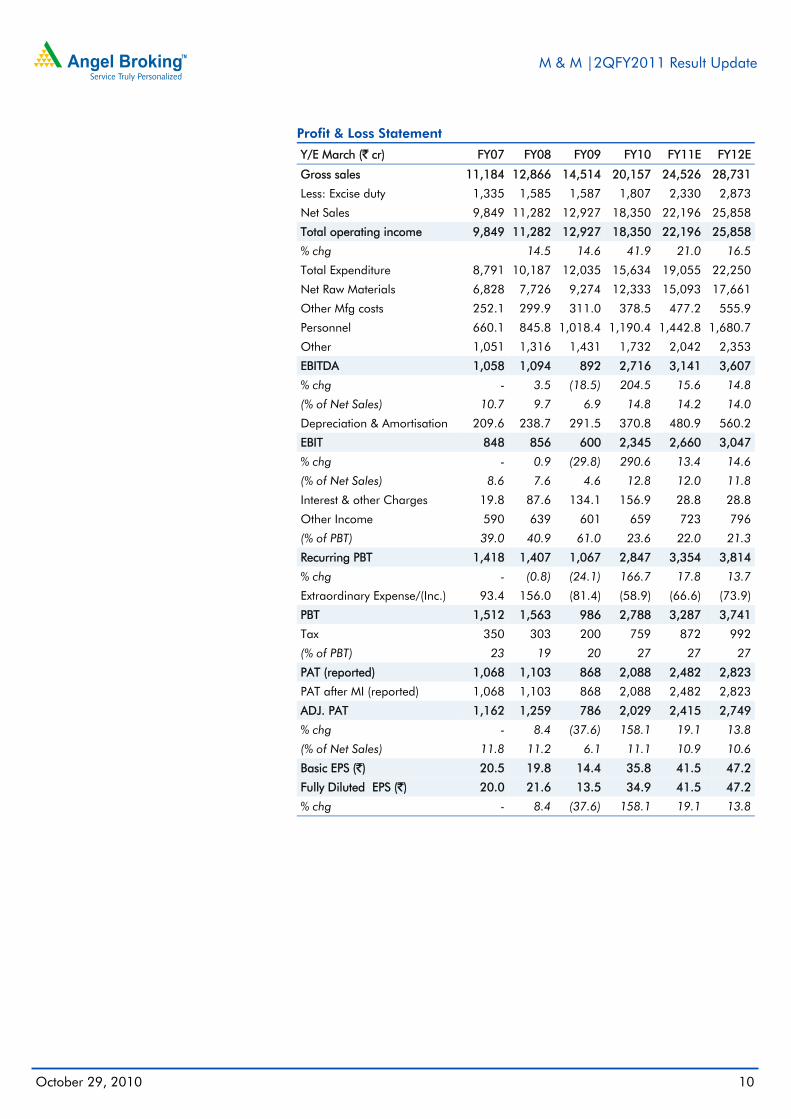
Profit & Loss Statement
Y/E March (` cr) FY07 FY08 FY09 FY10 FY11E FY12E
Gross sales 11,184 12,866 14,514 20,157 24,526 28,731
Less: Excise duty 1,335 1,585 1,587 1,807 2,330 2,873
Net Sales 9,849 11,282 12,927 18,350 22,196 25,858
Total operating income 9,849 11,282 12,927 18,350 22,196 25,858
% chg
14.5 14.6 41.9 21.0 16.5
Total Expenditure 8,791 10,187 12,035 15,634 19,055 22,250
Net Raw Materials 6,828 7,726 9,274 12,333 15,093 17,661
Other Mfg costs 252.1 299.9 311.0 378.5 477.2 555.9
Personnel 660.1 845.8 1,018.4 1,190.4 1,442.8 1,680.7
Other 1,051 1,316 1,431 1,732 2,042 2,353
EBITDA 1,058 1,094 892 2,716 3,141 3,607
% chg - 3.5 (18.5) 204.5 15.6 14.8
(% of Net Sales) 10.7 9.7 6.9 14.8 14.2 14.0
Depreciation & Amortisation 209.6 238.7 291.5 370.8 480.9 560.2
EBIT 848 856 600 2,345 2,660 3,047
% chg - 0.9 (29.8) 290.6 13.4 14.6
(% of Net Sales) 8.6 7.6 4.6 12.8 12.0 11.8
Interest & other Charges 19.8 87.6 134.1 156.9 28.8 28.8
Other Income 590 639 601 659 723 796
(% of PBT) 39.0 40.9 61.0 23.6 22.0 21.3
Recurring PBT 1,418 1,407 1,067 2,847 3,354 3,814
% chg - (0.8) (24.1) 166.7 17.8 13.7
Extraordinary Expense/(Inc.) 93.4 156.0 (81.4) (58.9) (66.6) (73.9)
PBT 1,512 1,563 986 2,788 3,287 3,741
Tax 350 303 200 759 872 992
(% of PBT) 23 19 20 27 27 27
PAT (reported) 1,068 1,103 868 2,088 2,482 2,823
PAT after MI (reported) 1,068 1,103 868 2,088 2,482 2,823
ADJ. PAT 1,162 1,259 786 2,029 2,415 2,749
% chg - 8.4 (37.6) 158.1 19.1 13.8
(% of Net Sales) 11.8 11.2 6.1 11.1 10.9 10.6
Basic EPS (`) 20.5 19.8 14.4 35.8 41.5 47.2
Fully Diluted EPS (`) 20.0 21.6 13.5 34.9 41.5 47.2
% chg - 8.4 (37.6) 158.1 19.1 13.8
M & M |2QFY2011 Result Update
October 29, 2010 11
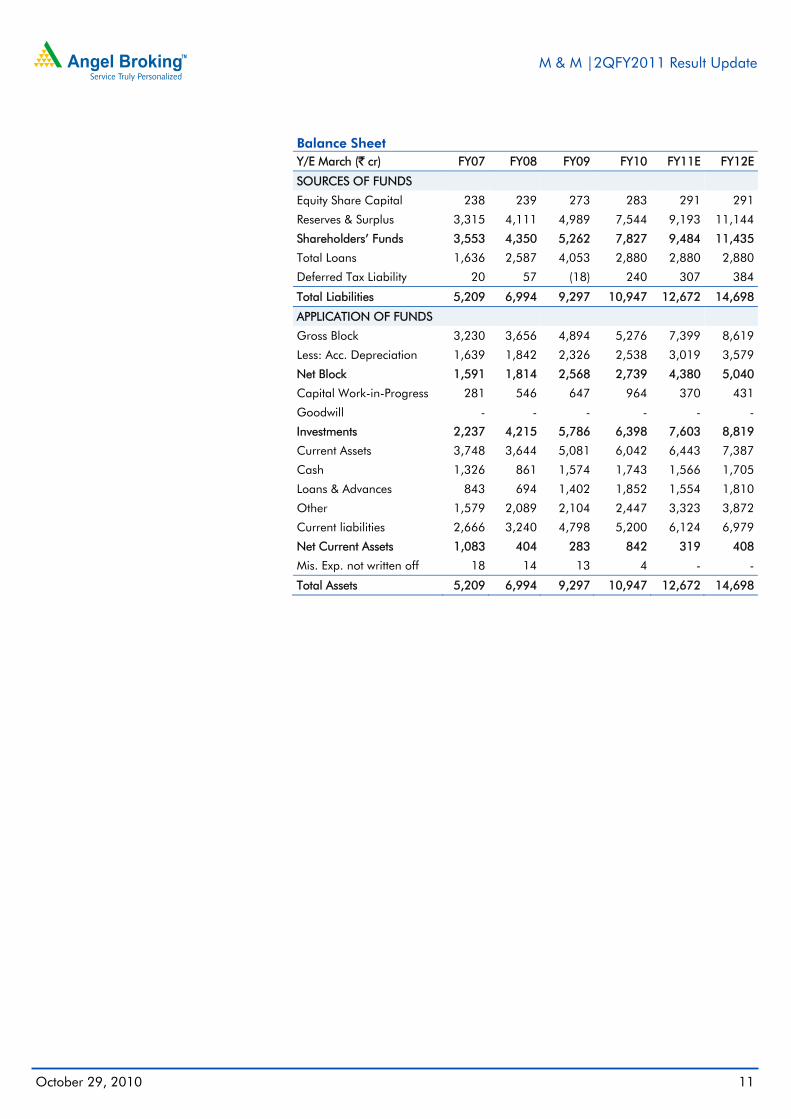
Balance Sheet Y/E March (` cr) FY07 FY08 FY09 FY10 FY11E FY12E
SOURCES OF FUNDS
Equity Share Capital 238 239 273 283 291 291
Reserves & Surplus 3,315 4,111 4,989 7,544 9,193 11,144
Shareholders’ Funds 3,553 4,350 5,262 7,827 9,484 11,435
Total Loans 1,636 2,587 4,053 2,880 2,880 2,880
Deferred Tax Liability 20 57 (18) 240 307 384
Total Liabilities 5,209 6,994 9,297 10,947 12,672 14,698
APPLICATION OF FUNDS
Gross Block 3,230 3,656 4,894 5,276 7,399 8,619
Less: Acc. Depreciation 1,639 1,842 2,326 2,538 3,019 3,579
Net Block 1,591 1,814 2,568 2,739 4,380 5,040
Capital Work-in-Progress 281 546 647 964 370 431
Goodwill - - - - - -
Investments 2,237 4,215 5,786 6,398 7,603 8,819
Current Assets 3,748 3,644 5,081 6,042 6,443 7,387
Cash 1,326 861 1,574 1,743 1,566 1,705
Loans & Advances 843 694 1,402 1,852 1,554 1,810
Other 1,579 2,089 2,104 2,447 3,323 3,872
Current liabilities 2,666 3,240 4,798 5,200 6,124 6,979
Net Current Assets 1,083 404 283 842 319 408
Mis. Exp. not written off 18 14 13 4 - -
Total Assets 5,209 6,994 9,297 10,947 12,672 14,698
M & M |2QFY2011 Result Update
October 29, 2010 12
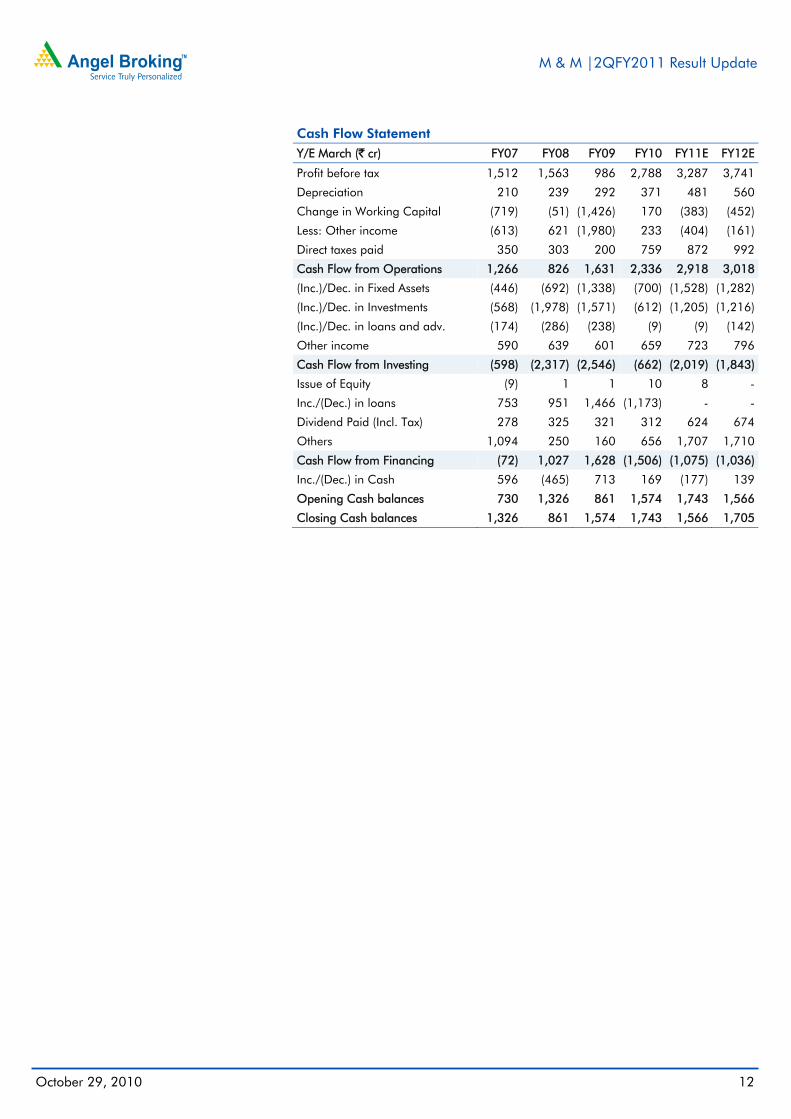
Cash Flow Statement Y/E March (` cr) FY07 FY08 FY09 FY10 FY11E FY12E
Profit before tax 1,512 1,563 986 2,788 3,287 3,741
Depreciation 210 239 292 371 481 560
Change in Working Capital (719) (51) (1,426) 170 (383) (452)
Less: Other income (613) 621 (1,980) 233 (404) (161)
Direct taxes paid 350 303 200 759 872 992
Cash Flow from Operations 1,266 826 1,631 2,336 2,918 3,018
(Inc.)/Dec. in Fixed Assets (446) (692) (1,338) (700) (1,528) (1,282)
(Inc.)/Dec. in Investments (568) (1,978) (1,571) (612) (1,205) (1,216)
(Inc.)/Dec. in loans and adv. (174) (286) (238) (9) (9) (142)
Other income 590 639 601 659 723 796
Cash Flow from Investing (598) (2,317) (2,546) (662) (2,019) (1,843)
Issue of Equity (9) 1 1 10 8 -
Inc./(Dec.) in loans 753 951 1,466 (1,173) - -
Dividend Paid (Incl. Tax) 278 325 321 312 624 674
Others 1,094 250 160 656 1,707 1,710
Cash Flow from Financing (72) 1,027 1,628 (1,506) (1,075) (1,036)
Inc./(Dec.) in Cash 596 (465) 713 169 (177) 139
Opening Cash balances 730 1,326 861 1,574 1,743 1,566
Closing Cash balances 1,326 861 1,574 1,743 1,566 1,705
M & M |2QFY2011 Result Update
October 29, 2010 13
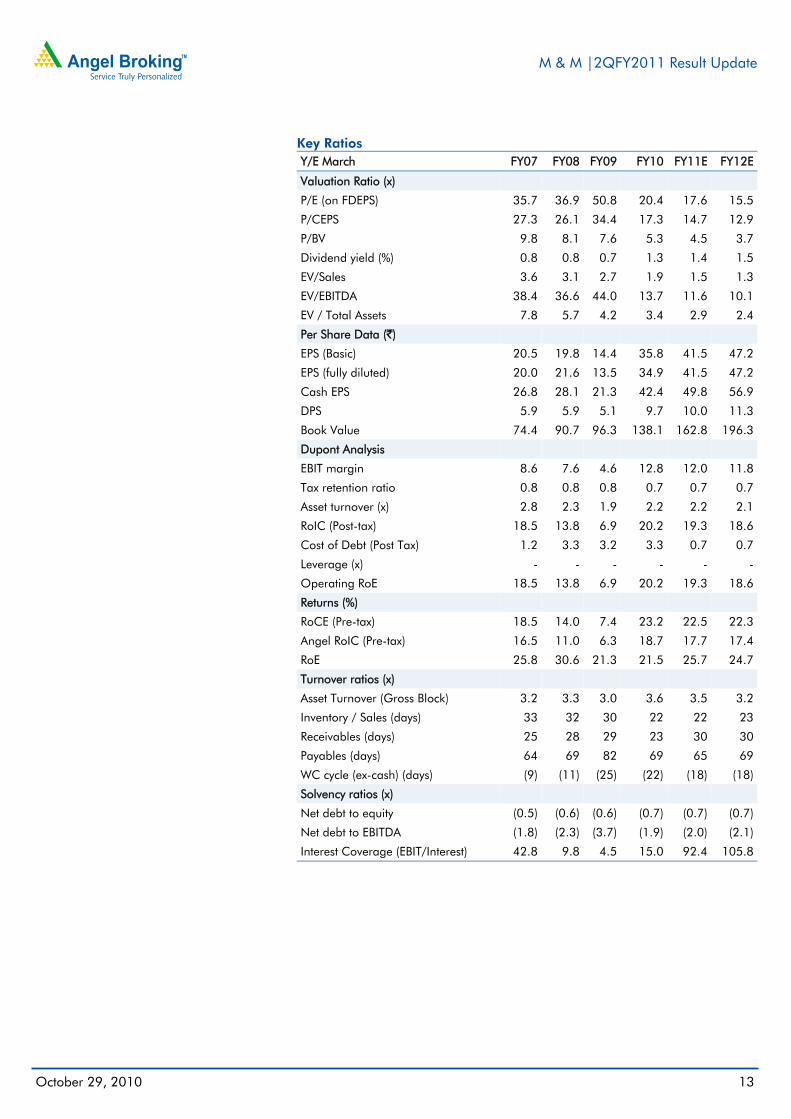
Key Ratios Y/E March FY07 FY08 FY09 FY10 FY11E FY12E
Valuation Ratio (x)
P/E (on FDEPS) 35.7 36.9 50.8 20.4 17.6 15.5
P/CEPS 27.3 26.1 34.4 17.3 14.7 12.9
P/BV 9.8 8.1 7.6 5.3 4.5 3.7
Dividend yield (%) 0.8 0.8 0.7 1.3 1.4 1.5
EV/Sales 3.6 3.1 2.7 1.9 1.5 1.3
EV/EBITDA 38.4 36.6 44.0 13.7 11.6 10.1
EV / Total Assets 7.8 5.7 4.2 3.4 2.9 2.4
Per Share Data (`)
EPS (Basic) 20.5 19.8 14.4 35.8 41.5 47.2
EPS (fully diluted) 20.0 21.6 13.5 34.9 41.5 47.2
Cash EPS 26.8 28.1 21.3 42.4 49.8 56.9
DPS 5.9 5.9 5.1 9.7 10.0 11.3
Book Value 74.4 90.7 96.3 138.1 162.8 196.3
Dupont Analysis
EBIT margin 8.6 7.6 4.6 12.8 12.0 11.8
Tax retention ratio 0.8 0.8 0.8 0.7 0.7 0.7
Asset turnover (x) 2.8 2.3 1.9 2.2 2.2 2.1
RoIC (Post-tax) 18.5 13.8 6.9 20.2 19.3 18.6
Cost of Debt (Post Tax) 1.2 3.3 3.2 3.3 0.7 0.7
Leverage (x) - - - - - -
Operating RoE 18.5 13.8 6.9 20.2 19.3 18.6
Returns (%)
RoCE (Pre-tax) 18.5 14.0 7.4 23.2 22.5 22.3
Angel RoIC (Pre-tax) 16.5 11.0 6.3 18.7 17.7 17.4
RoE 25.8 30.6 21.3 21.5 25.7 24.7
Turnover ratios (x)
Asset Turnover (Gross Block) 3.2 3.3 3.0 3.6 3.5 3.2
Inventory / Sales (days) 33 32 30 22 22 23
Receivables (days) 25 28 29 23 30 30
Payables (days) 64 69 82 69 65 69
WC cycle (ex-cash) (days) (9) (11) (25) (22) (18) (18)
Solvency ratios (x)
Net debt to equity (0.5) (0.6) (0.6) (0.7) (0.7) (0.7)
Net debt to EBITDA (1.8) (2.3) (3.7) (1.9) (2.0) (2.1)
Interest Coverage (EBIT/Interest) 42.8 9.8 4.5 15.0 92.4 105.8
M & M |2QFY2011 Result Update
October 29, 2010 14
Research Team Tel: 022 - 4040 3800 E-mail: [email protected] Website: www.angeltrade.com DISCLAIMER
This document is solely for the personal information of the recipient, and must not be singularly used as the basis of any investment decision. Nothing in this document should be construed as investment or financial advice. Each recipient of this document should make such investigations as they deem necessary to arrive at an independent evaluation of an investment in the securities of the companies referred to in this document (including the merits and risks involved), and should consult their own advisors to determine the merits and risks of such an investment.
Angel Broking Limited, its affiliates, directors, its proprietary trading and investment businesses may, from time to time, make investment decisions that are inconsistent with or contradictory to the recommendations expressed herein. The views contained in this document are those of the analyst, and the company may or may not subscribe to all the views expressed within.
Reports based on technical and derivative analysis center on studying charts of a stock's price movement, outstanding positions and trading volume, as opposed to focusing on a company's fundamentals and, as such, may not match with a report on a company's fundamentals.
The information in this document has been printed on the basis of publicly available information, internal data and other reliable sources believed to be true, but we do not represent that it is accurate or complete and it should not be relied on as such, as this document is for general guidance only. Angel Broking Limited or any of its affiliates/ group companies shall not be in any way responsible for any loss or damage that may arise to any person from any inadvertent error in the information contained in this report. Angel Broking Limited has not independently verified all the information contained within this document. Accordingly, we cannot testify, nor make any representation or warranty, express or implied, to the accuracy, contents or data contained within this document. While Angel Broking Limited endeavours to update on a reasonable basis the information discussed in this material, there may be regulatory, compliance, or other reasons that prevent us from doing so. This document is being supplied to you solely for your information, and its contents, information or data may not be reproduced, redistributed or passed on, directly or indirectly.
Angel Broking Limited and its affiliates may seek to provide or have engaged in providing corporate finance, investment banking or other advisory services in a merger or specific transaction to the companies referred to in this report, as on the date of this report or in the past.
Neither Angel Broking Limited, nor its directors, employees or affiliates shall be liable for any loss or damage that may arise from or in connection with the use of this information.
Note: Please refer to the important `Stock Holding Disclosure' report on the Angel website (Research Section). Also, please refer to the latest update on respective stocks for the disclosure status in respect of those stocks. Angel Broking Limited and its affiliates may have investment positions in the stocks recommended in this report.
Disclosure of Interest Statement M & M 1. Analyst ownership of the stock Yes 2. Angel and its Group companies ownership of the stock No 3. Angel and its Group companies' Directors ownership of the stock No 4. Broking relationship with company covered No Note: We have not considered any Exposure below ` 1 lakh for Angel, its Group companies and Directors. Ratings (Returns) : Buy (> 15%) Accumulate (5% to 15%) Neutral (-5 to 5%) Reduce (-5% to 15%) Sell (< -15%)


![arXiv:1208.2144v1 [cond-mat.mes-hall] 10 Aug 2012 · C1 C3 C2 C1 B S S' Ru1 Ru2 Gr Ru C2 C1 Si dose c d b a C1 C tot C2 1.0 0.8 0.6 0.4 0.2 0.0 Intensity (arb. units) 0 4000 8000](https://img.pdfslide.us/doc/110x75/5f03b3577e708231d40a57fb/arxiv12082144v1-cond-matmes-hall-10-aug-2012-c1-c3-c2-c1-b-s-s-ru1-ru2-gr.jpg)