Embed Size (px)
Citation preview
October 29, 2008
Third Quarter 2008 Earnings Report
John A. Luke, Jr.Chairman and CEO
James A. BuzzardPresident
E. Mark RajkowskiSenior Vice President and CFO
Results presented on a continuing operations basis
2 Third Quarter 2008 Earnings Report
Forward-looking Statements Certain statements in this document and elsewhere by management of the company that are neither reported financial results nor other historical information are “forward-looking statements” within the meaning of the Private Securities Litigation Reform Act of 1995. Such information includes, without limitation, the business outlook, assessment of market conditions, anticipated financial and operating results, strategies, future plans, contingencies and contemplated transactions of the company. Such forward-looking statements are not guarantees of future performance and are subject to known and unknown risks, uncertainties and other factors which may cause or contribute to actual results of company operations, or the performance or achievements of each company, or industry results, to differ materially from those expressed or implied by the forward-looking statements. In addition to any such risks, uncertainties and other factors discussed elsewhere herein, risks, uncertainties, and other factors that could cause or contribute to actual results differing materially from those expressed or implied for the forward-looking statements include, but are not limited to, events or circumstances which affect the ability of MeadWestvaco to realize improvements in operating earnings from the company’s ongoing cost reduction initiatives; the ability of MeadWestvaco to close announced and pending transactions, including divestitures; the reorganization of the company’s packaging business units; competitive pricing for the company’s products; impact from inflation on raw materials, energy and other costs; fluctuations in demand and changes in production capacities; changes to economic growth in the United States and international economies; government policies and regulations, including, but not limited to those affecting the environment and the tobacco industry; the company’s continued ability to reach agreement with its unionized employees on collective bargaining agreements; the company’s ability to execute its plans to divest or otherwise realize the greater value associated with its land holdings; adverse results in current or future litigation; currency movements; continued volatility and further deterioration of the capital markets; and other risk factors discussed in the company’s Annual Report on Form 10-K for the year ended December 31, 2007, and in other filings made from time to time with the SEC. MeadWestvaco undertakes no obligation to publicly update any forward-looking statement, whether as a result of new information, future events or otherwise. Investors are advised, however, to consult any further disclosures made on related subjects in the company’s reports filed with the SEC.
3 Third Quarter 2008 Earnings Report
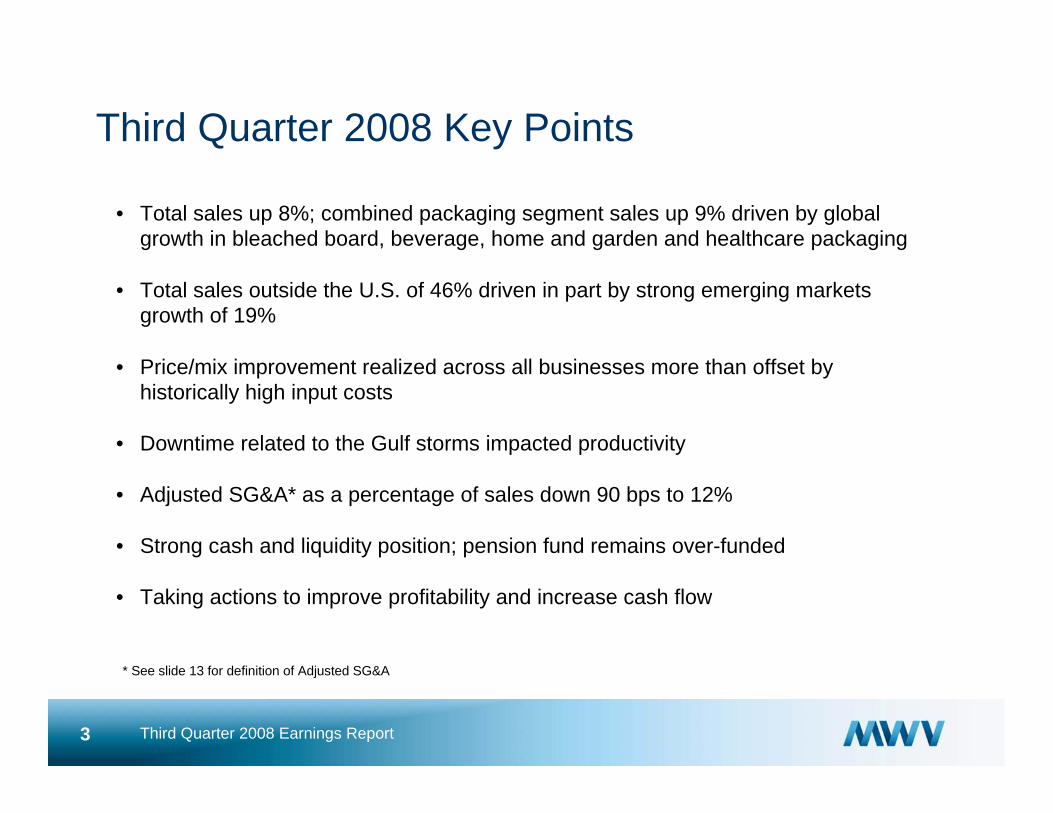
Third Quarter 2008 Key Points
• Total sales up 8%; combined packaging segment sales up 9% driven by global growth in bleached board, beverage, home and garden and healthcare packaging
• Total sales outside the U.S. of 46% driven in part by strong emerging markets growth of 19%
• Price/mix improvement realized across all businesses more than offset by historically high input costs
• Downtime related to the Gulf storms impacted productivity
• Adjusted SG&A* as a percentage of sales down 90 bps to 12%
• Strong cash and liquidity position; pension fund remains over-funded
• Taking actions to improve profitability and increase cash flow
* See slide 13 for definition of Adjusted SG&A
4 Third Quarter 2008 Earnings Report
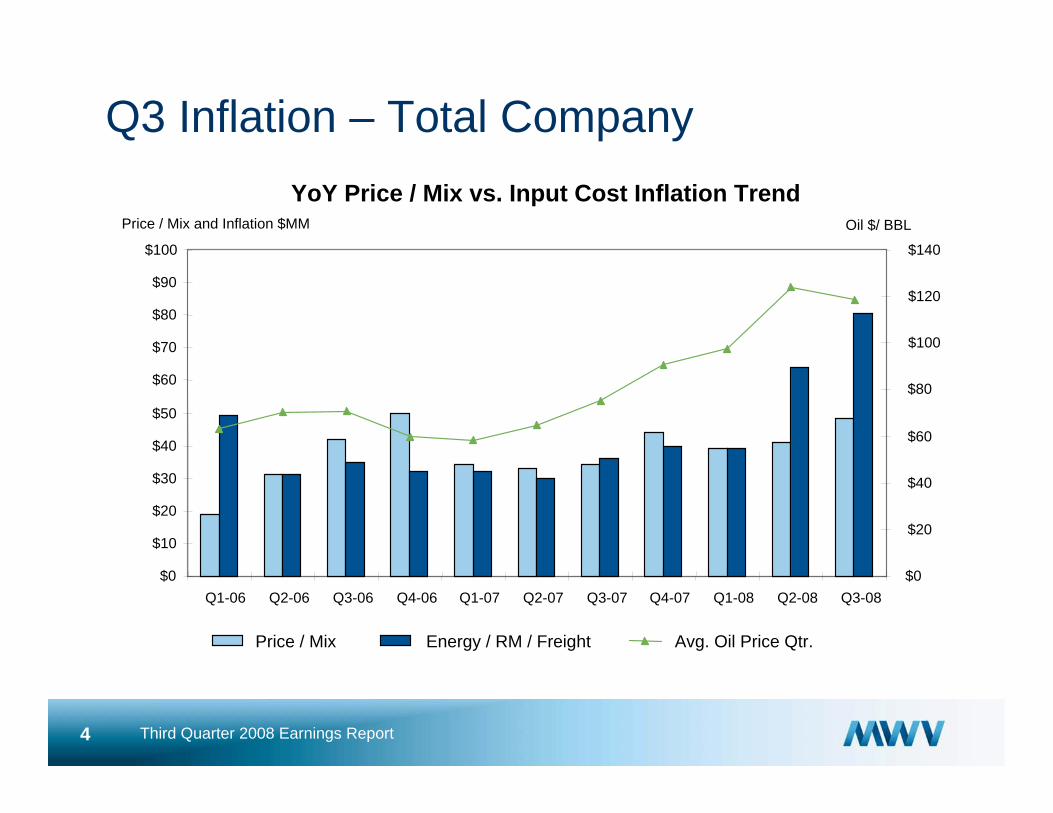
Q3 Inflation – Total CompanyYoY Price / Mix vs. Input Cost Inflation Trend
$0
$10
$20
$30
$40
$50
$60
$70
$80
$90
$100
Q1-06 Q2-06 Q3-06 Q4-06 Q1-07 Q2-07 Q3-07 Q4-07 Q1-08 Q2-08 Q3-08$0
$20
$40
$60
$80
$100
$120
$140
Price / Mix Energy / RM / Freight Avg. Oil Price Qtr.
Oil $/ BBLPrice / Mix and Inflation $MM
5 Third Quarter 2008 Earnings Report
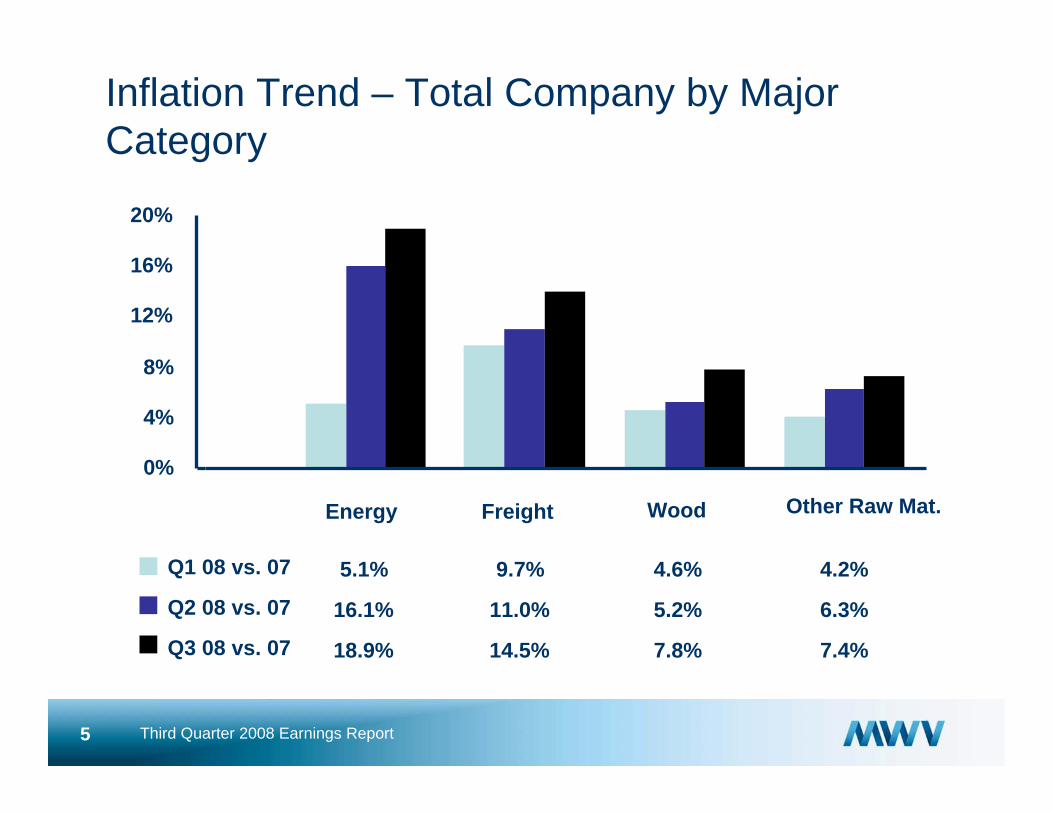
Inflation Trend – Total Company by Major Category
0%
4%
8%
12%
16%
20%
Q1 08 vs. 07 5.1% 9.7% 4.6% 4.2%
Q2 08 vs. 07 16.1% 11.0% 5.2% 6.3%
Q3 08 vs. 07 18.9% 14.5% 7.8% 7.4%
Energy Freight Wood Other Raw Mat.
6 Third Quarter 2008 Earnings Report
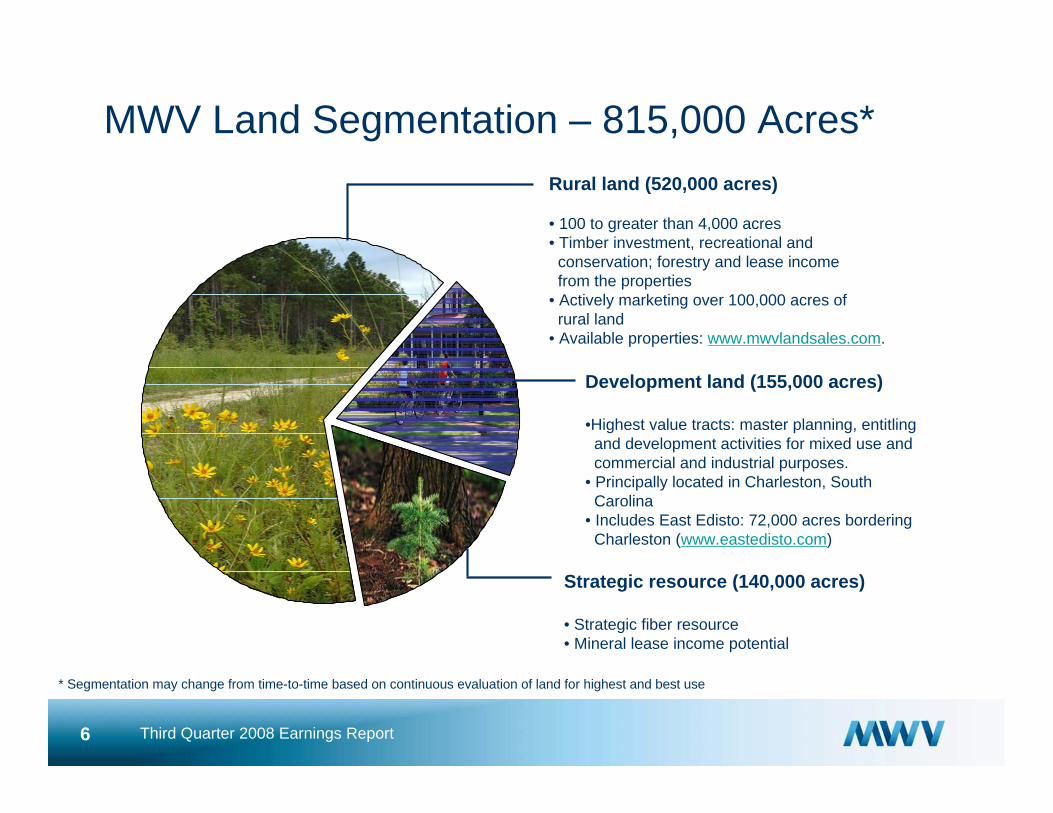
MWV Land Segmentation – 815,000 Acres* Rural land (520,000 acres)
• 100 to greater than 4,000 acres• Timber investment, recreational and
conservation; forestry and lease incomefrom the properties
• Actively marketing over 100,000 acres of rural land
• Available properties: www.mwvlandsales.com.
Development land (155,000 acres)
•Highest value tracts: master planning, entitling and development activities for mixed use andcommercial and industrial purposes.
• Principally located in Charleston, SouthCarolina
• Includes East Edisto: 72,000 acres borderingCharleston (www.eastedisto.com)
Strategic resource (140,000 acres)
• Strategic fiber resource • Mineral lease income potential
* Segmentation may change from time-to-time based on continuous evaluation of land for highest and best use
7 Third Quarter 2008 Earnings Report
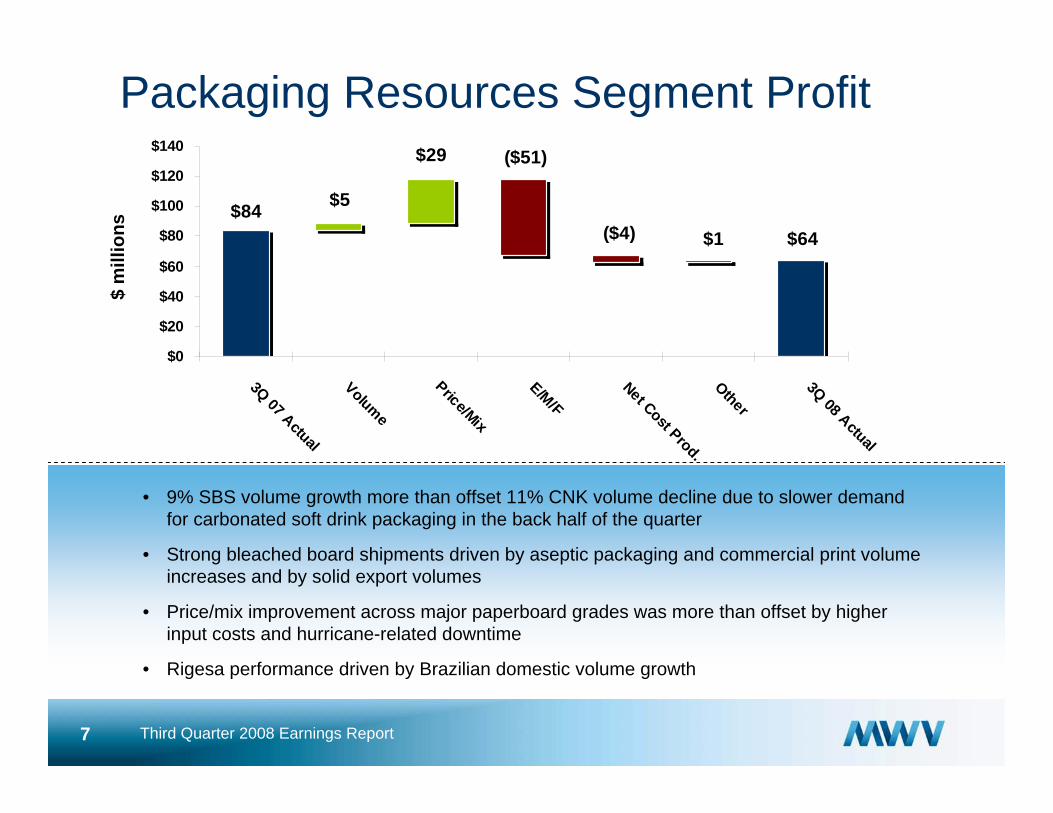
$84 $5
$29 ($51)
($4) $1 $64
$0
$20
$40
$60
$80
$100
$120
$140
3Q 07 Actual
Volume
Price/Mix
E/M/F
Net Cost Prod.Other
3Q 08 Actual
Packaging Resources Segment Profit
• 9% SBS volume growth more than offset 11% CNK volume decline due to slower demand for carbonated soft drink packaging in the back half of the quarter
• Strong bleached board shipments driven by aseptic packaging and commercial print volume increases and by solid export volumes
• Price/mix improvement across major paperboard grades was more than offset by higher input costs and hurricane-related downtime
• Rigesa performance driven by Brazilian domestic volume growth
$ m
illio
ns
8 Third Quarter 2008 Earnings Report
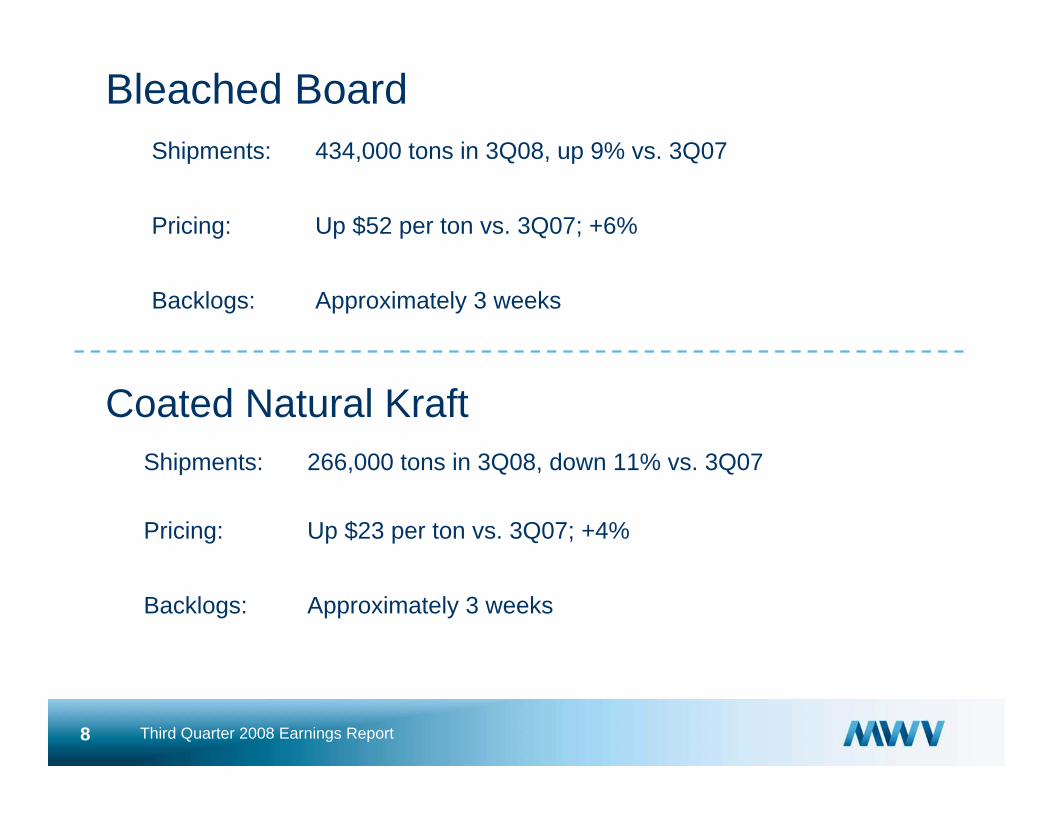
Bleached BoardShipments: 434,000 tons in 3Q08, up 9% vs. 3Q07
Pricing: Up $52 per ton vs. 3Q07; +6%
Backlogs: Approximately 3 weeks
Coated Natural KraftShipments: 266,000 tons in 3Q08, down 11% vs. 3Q07
Pricing: Up $23 per ton vs. 3Q07; +4%
Backlogs: Approximately 3 weeks
9 Third Quarter 2008 Earnings Report
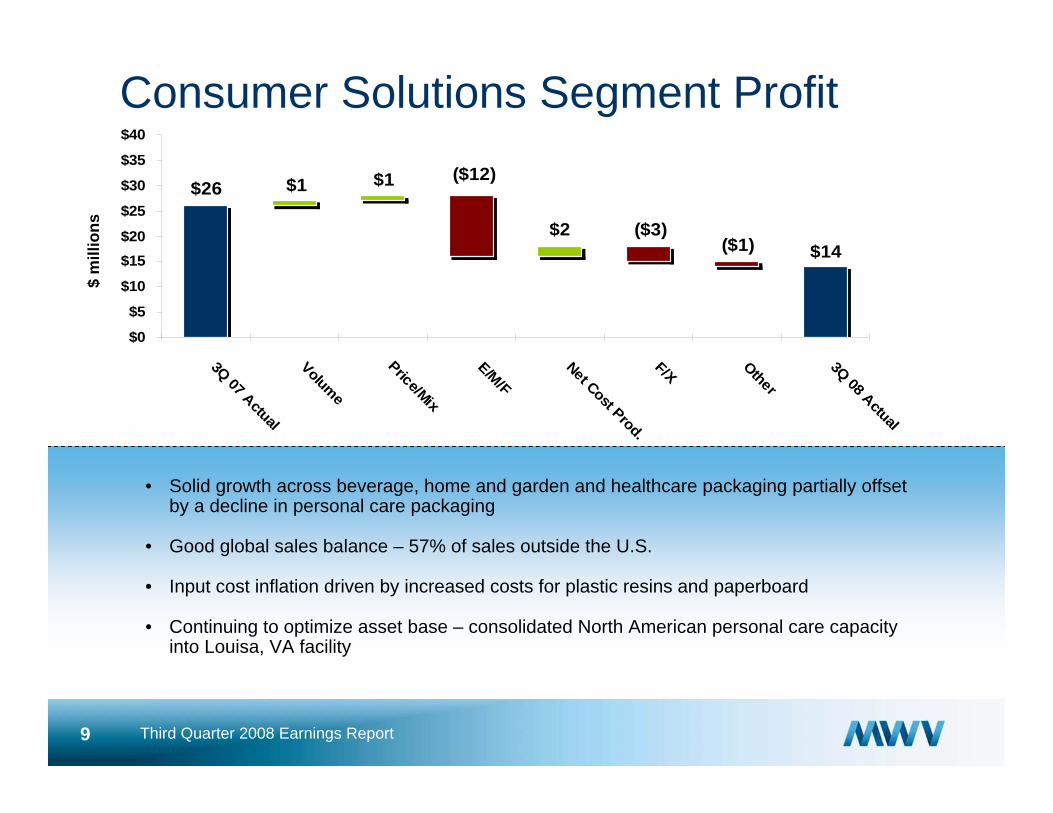
$14($1) ($3) $2
($12)$1 $1 $26
$0
$5
$10
$15$20
$25
$30
$35
$40
3Q 07 Actual
Volume
Price/Mix
E/M/F
Net Cost Prod.F/X
Other
3Q 08 Actual
Consumer Solutions Segment Profit
• Solid growth across beverage, home and garden and healthcare packaging partially offset by a decline in personal care packaging
• Good global sales balance – 57% of sales outside the U.S.
• Input cost inflation driven by increased costs for plastic resins and paperboard
• Continuing to optimize asset base – consolidated North American personal care capacity into Louisa, VA facility
$ m
illio
ns
10 Third Quarter 2008 Earnings Report
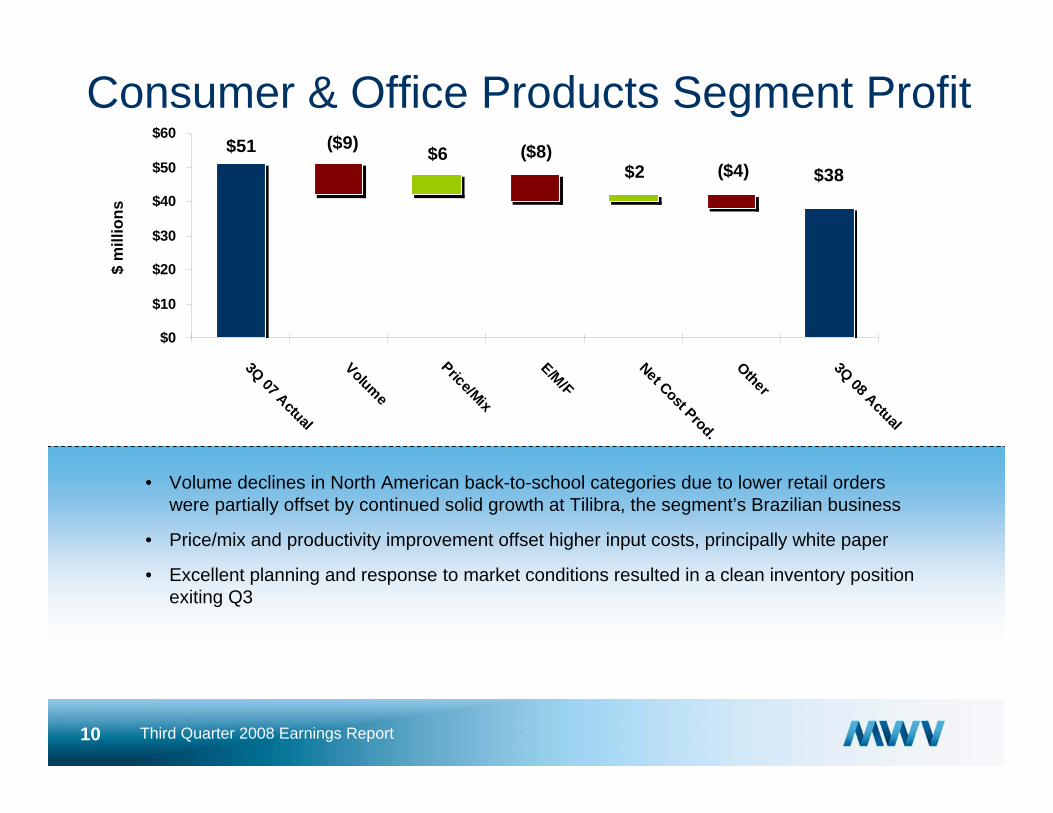
($9) ($8) ($4)
$51 $6$2 $38
$0
$10
$20
$30
$40
$50
$60
3Q 07 Actual
Volume
Price/Mix
E/M/F
Net Cost Prod.
Other
3Q 08 Actual
Consumer & Office Products Segment Profit
• Volume declines in North American back-to-school categories due to lower retail orders were partially offset by continued solid growth at Tilibra, the segment’s Brazilian business
• Price/mix and productivity improvement offset higher input costs, principally white paper
• Excellent planning and response to market conditions resulted in a clean inventory position exiting Q3
$ m
illio
ns
11 Third Quarter 2008 Earnings Report
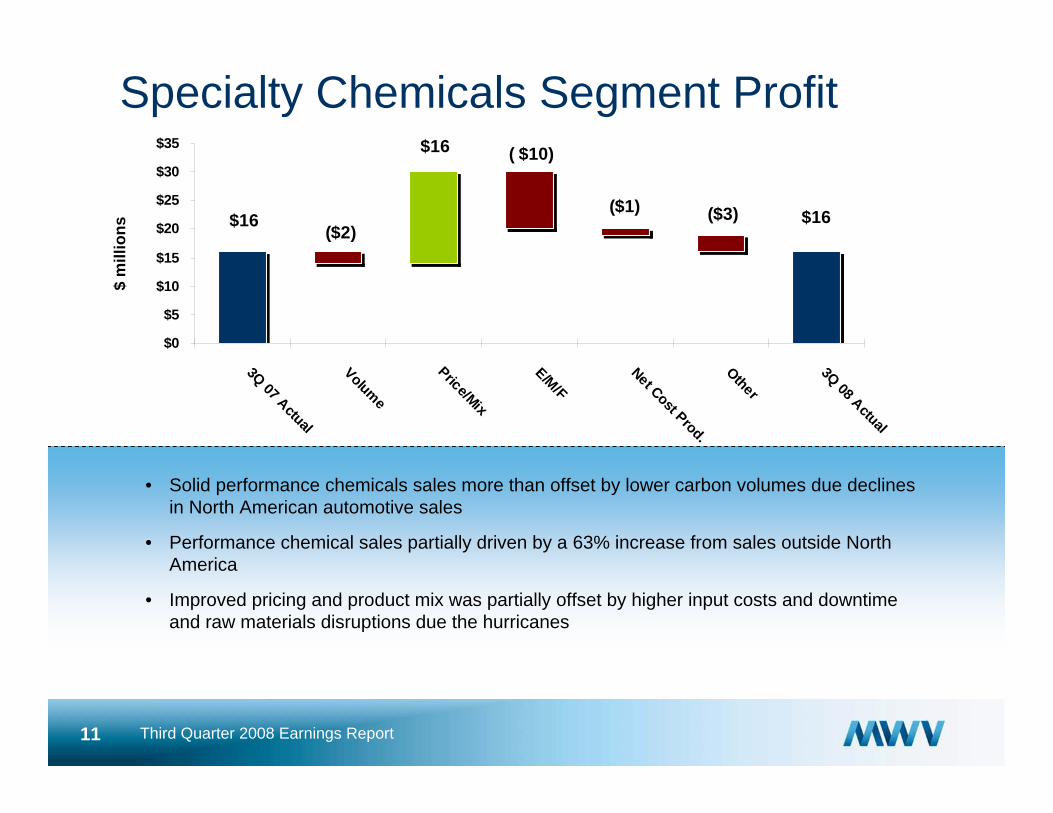
( $10)
($1) $16($3)
$16
($2) $16
$0
$5
$10
$15
$20
$25
$30
$35
3Q 07 Actual
Volume
Price/Mix
E/M/F
Net Cost Prod.
Other
3Q 08 Actual
Specialty Chemicals Segment Profit
• Solid performance chemicals sales more than offset by lower carbon volumes due declines in North American automotive sales
• Performance chemical sales partially driven by a 63% increase from sales outside North America
• Improved pricing and product mix was partially offset by higher input costs and downtime and raw materials disruptions due the hurricanes
$ m
illio
ns
12 Third Quarter 2008 Earnings Report
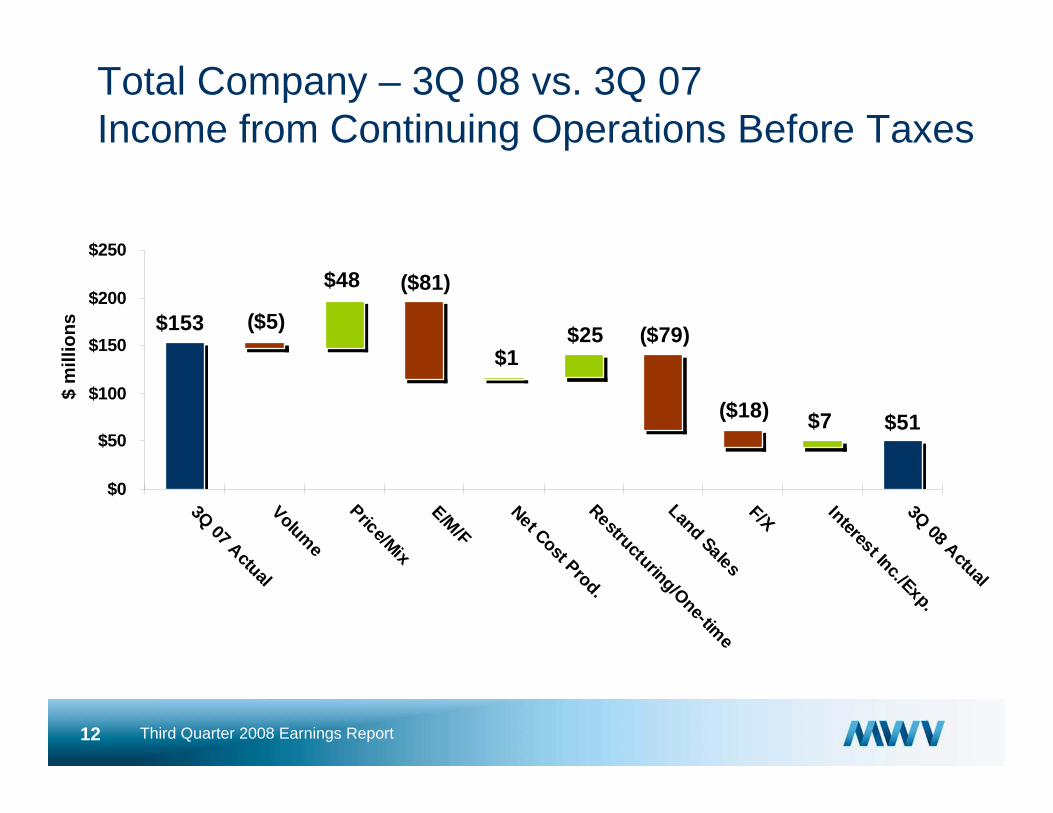
Total Company – 3Q 08 vs. 3Q 07Income from Continuing Operations Before Taxes
$ m
illio
ns ($5)
$51
($81)
$7($18)
($79) $25 $1
$48
$153
$0
$50
$100
$150
$200
$250
3Q 07 ActualVolume
Price/Mix
E/M/F
Net Cost Prod.Restructuring/One-time
Land SalesF/X Interest Inc./Exp.3Q 08 Actual
13 Third Quarter 2008 Earnings Report
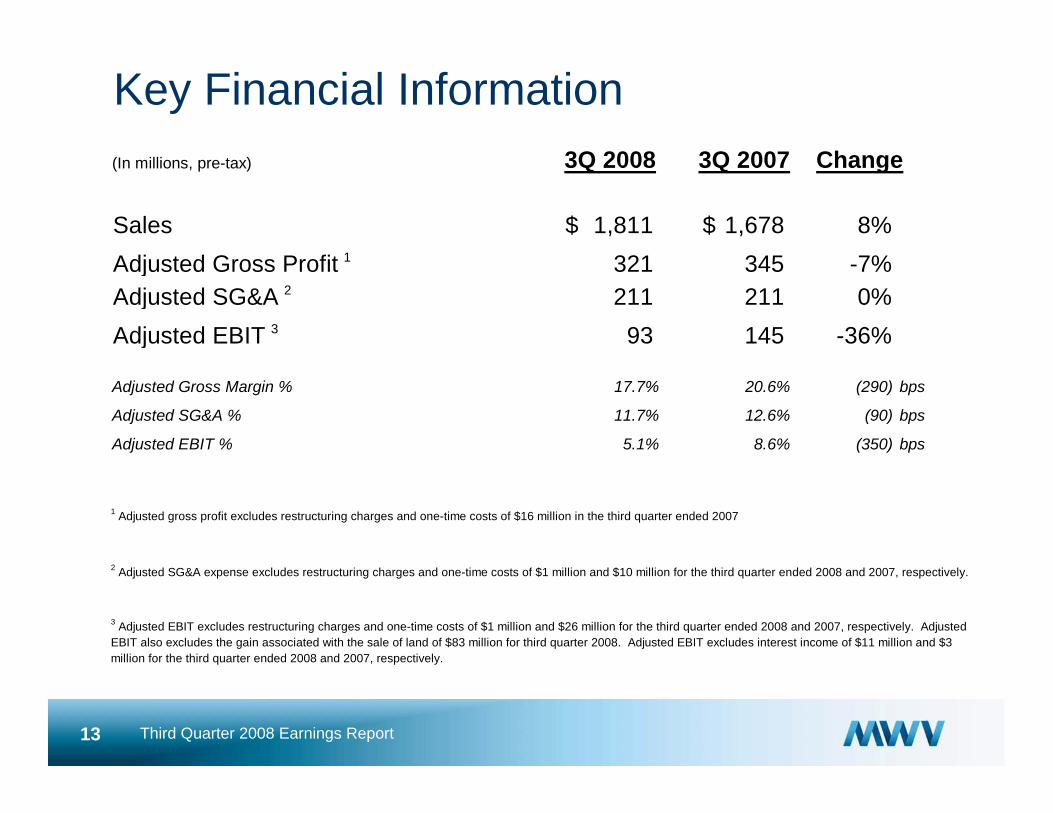
Key Financial Information(In millions, pre-tax) 3Q 2008 3Q 2007 Change
Sales 1,811$ 1,678$ 8%Adjusted Gross Profit 1 321 345 -7%Adjusted SG&A 2 211 211 0%Adjusted EBIT 3 93 145 -36% Adjusted Gross Margin % 17.7% 20.6% (290) bps
Adjusted SG&A % 11.7% 12.6% (90) bps
Adjusted EBIT % 5.1% 8.6% (350) bps
1 Adjusted gross profit excludes restructuring charges and one-time costs of $16 million in the third quarter ended 2007
2 Adjusted SG&A expense excludes restructuring charges and one-time costs of $1 million and $10 million for the third quarter ended 2008 and 2007, respectively.
3 Adjusted EBIT excludes restructuring charges and one-time costs of $1 million and $26 million for the third quarter ended 2008 and 2007, respectively. Adjusted EBIT also excludes the gain associated with the sale of land of $83 million for third quarter 2008. Adjusted EBIT excludes interest income of $11 million and $3 million for the third quarter ended 2008 and 2007, respectively.
14 Third Quarter 2008 Earnings Report
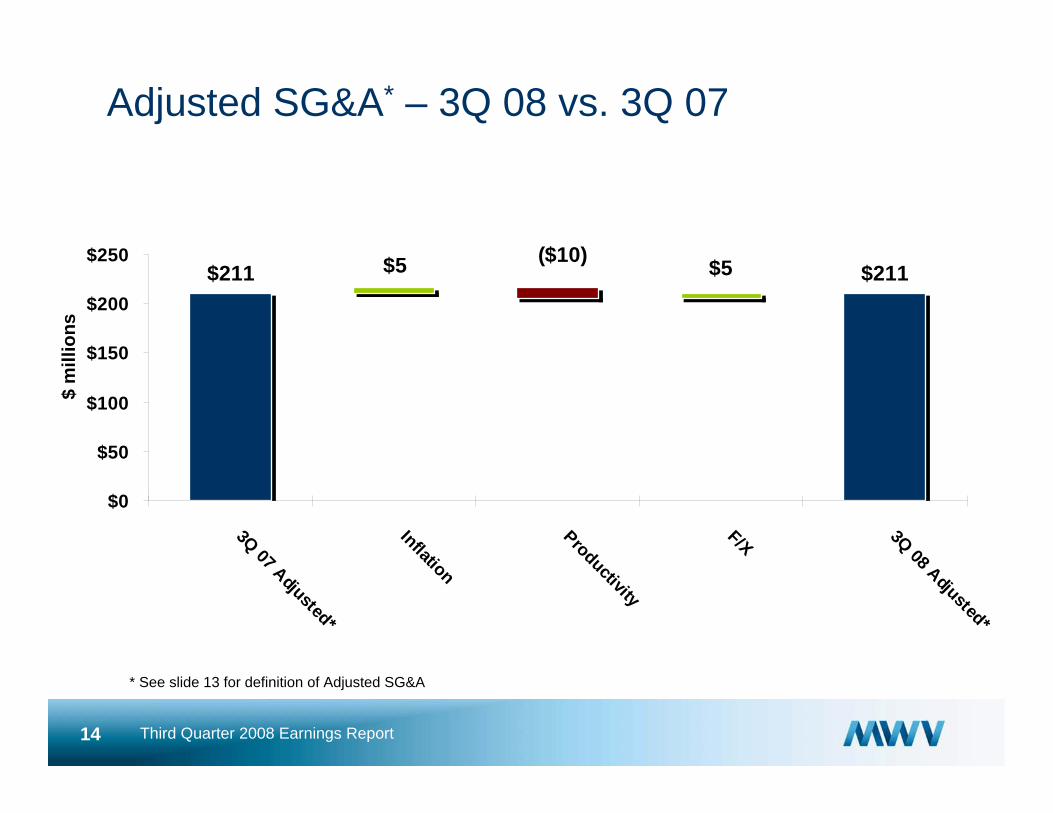
Adjusted SG&A* – 3Q 08 vs. 3Q 07
* See slide 13 for definition of Adjusted SG&A
$ m
illio
ns
$211 ($10)
$211 $5 $5
$0
$50
$100
$150
$200
$250
3Q 07 Adjusted*
Inflation
Productivity
F/X 3Q 08 Adjusted*
15 Third Quarter 2008 Earnings Report
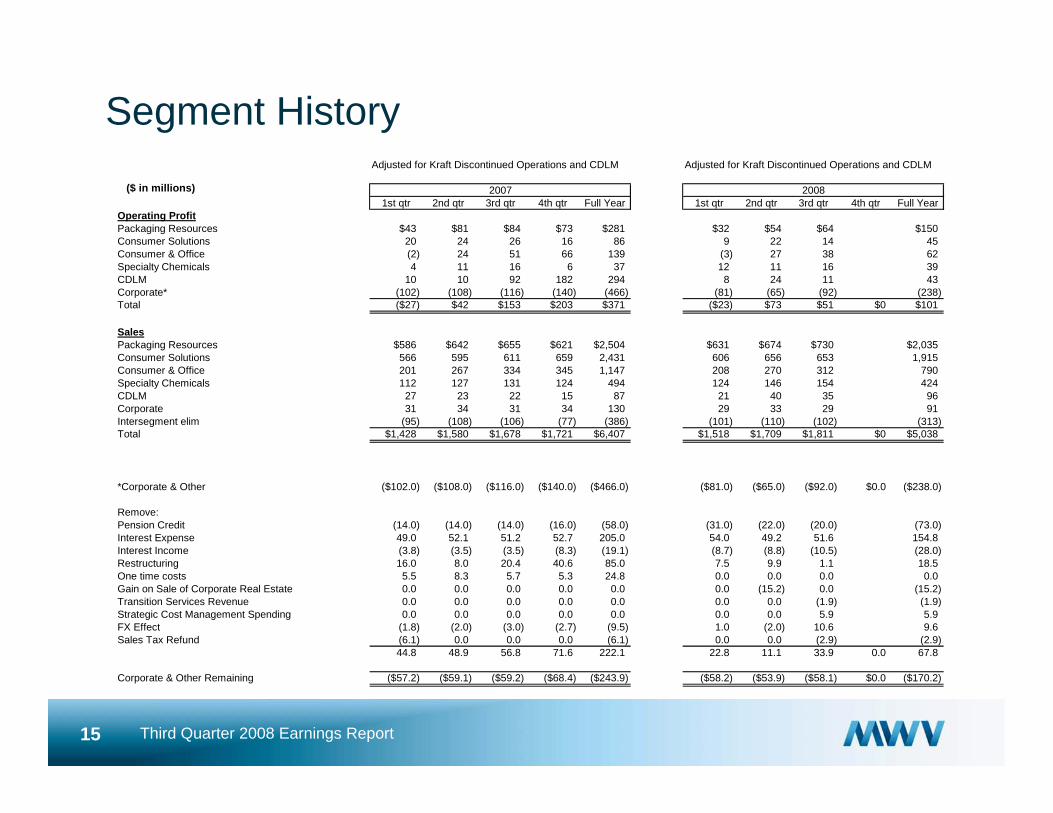
Segment HistoryAdjusted for Kraft Discontinued Operations and CDLM Adjusted for Kraft Discontinued Operations and CDLM
2007 20081st qtr 2nd qtr 3rd qtr 4th qtr Full Year 1st qtr 2nd qtr 3rd qtr 4th qtr Full Year
Operating ProfitPackaging Resources $43 $81 $84 $73 $281 $32 $54 $64 $150Consumer Solutions 20 24 26 16 86 9 22 14 45Consumer & Office (2) 24 51 66 139 (3) 27 38 62Specialty Chemicals 4 11 16 6 37 12 11 16 39CDLM 10 10 92 182 294 8 24 11 43Corporate* (102) (108) (116) (140) (466) (81) (65) (92) (238)Total ($27) $42 $153 $203 $371 ($23) $73 $51 $0 $101
SalesPackaging Resources $586 $642 $655 $621 $2,504 $631 $674 $730 $2,035Consumer Solutions 566 595 611 659 2,431 606 656 653 1,915Consumer & Office 201 267 334 345 1,147 208 270 312 790Specialty Chemicals 112 127 131 124 494 124 146 154 424CDLM 27 23 22 15 87 21 40 35 96Corporate 31 34 31 34 130 29 33 29 91Intersegment elim (95) (108) (106) (77) (386) (101) (110) (102) (313)Total $1,428 $1,580 $1,678 $1,721 $6,407 $1,518 $1,709 $1,811 $0 $5,038
*Corporate & Other ($102.0) ($108.0) ($116.0) ($140.0) ($466.0) ($81.0) ($65.0) ($92.0) $0.0 ($238.0)
Remove:Pension Credit (14.0) (14.0) (14.0) (16.0) (58.0) (31.0) (22.0) (20.0) (73.0)Interest Expense 49.0 52.1 51.2 52.7 205.0 54.0 49.2 51.6 154.8Interest Income (3.8) (3.5) (3.5) (8.3) (19.1) (8.7) (8.8) (10.5) (28.0)Restructuring 16.0 8.0 20.4 40.6 85.0 7.5 9.9 1.1 18.5One time costs 5.5 8.3 5.7 5.3 24.8 0.0 0.0 0.0 0.0Gain on Sale of Corporate Real Estate 0.0 0.0 0.0 0.0 0.0 0.0 (15.2) 0.0 (15.2)Transition Services Revenue 0.0 0.0 0.0 0.0 0.0 0.0 0.0 (1.9) (1.9)Strategic Cost Management Spending 0.0 0.0 0.0 0.0 0.0 0.0 0.0 5.9 5.9FX Effect (1.8) (2.0) (3.0) (2.7) (9.5) 1.0 (2.0) 10.6 9.6Sales Tax Refund (6.1) 0.0 0.0 0.0 (6.1) 0.0 0.0 (2.9) (2.9)
44.8 48.9 56.8 71.6 222.1 22.8 11.1 33.9 0.0 67.8
Corporate & Other Remaining ($57.2) ($59.1) ($59.2) ($68.4) ($243.9) ($58.2) ($53.9) ($58.1) $0.0 ($170.2)
($ in millions)