Embed Size (px)
Citation preview
Insights &Innovation
PackagingMaterials
Primary &SecondaryPackaging
Systems &Services
John A. Luke, Jr.Chairman and CEO
James A. BuzzardPresident
E. Mark RajkowskiSenior Vice President and CFO
THIRD QUARTER 2007 EARNINGS
October 25, 2007
2
Forward-Looking Statements
Certain statements in this document and elsewhere by management of the company that are neither reported financial results nor other historical information are “forward-looking statements”within the meaning of the Private Securities Litigation Reform Act of 1995. Such information includes, without limitation, the business outlook, assessment of market conditions, anticipated financial and operating results, strategies, future plans, contingencies and contemplated transactions of the company. Such forward-looking statements are not guarantees of future performance and are subject to known and unknown risks, uncertainties and other factors which may cause or contribute to actual results of company operations, or the performance or achievements of each company, or industry results, to differ materially from those expressed or implied by the forward-looking statements. In addition to any such risks, uncertainties and other factors discussed elsewhere herein, risks, uncertainties and other factors that could cause or contribute to actual results differing materially from those expressed or implied for the forward-looking statements include, but are not limited to, events or circumstances which affect the ability of MeadWestvaco to realize improvements in operating earnings expected from the company’s cost reduction initiative; competitive pricing for the company’s products; changes in raw materials pricing; energy and other costs; fluctuations in demand and changes in production capacities; changes to economic growth in the United States and international economies; government policies and regulations, including, but not limited to those affecting the environment and the tobacco industry; the company’s continued ability to reach agreement with its unionized employees on collective bargaining agreements; the company’s ability to execute its plans to divest or otherwise realize the greater value associated with its forestlands; adverse results in current or future litigation; currency movements; and other risk factors discussed in the company’s Annual Report on Form 10-K for the year ended December 31, 2006, and in other filings made from time to time with the SEC. MeadWestvaco undertakes no obligation to publicly update any forward-looking statement, whether as a result of new information, future events or otherwise. Investors are advised, however, to consult any further disclosures made on related subjects in the company’s reports filed with the SEC.
3
John A. Luke, Jr.Chairman and Chief Executive Officer
4
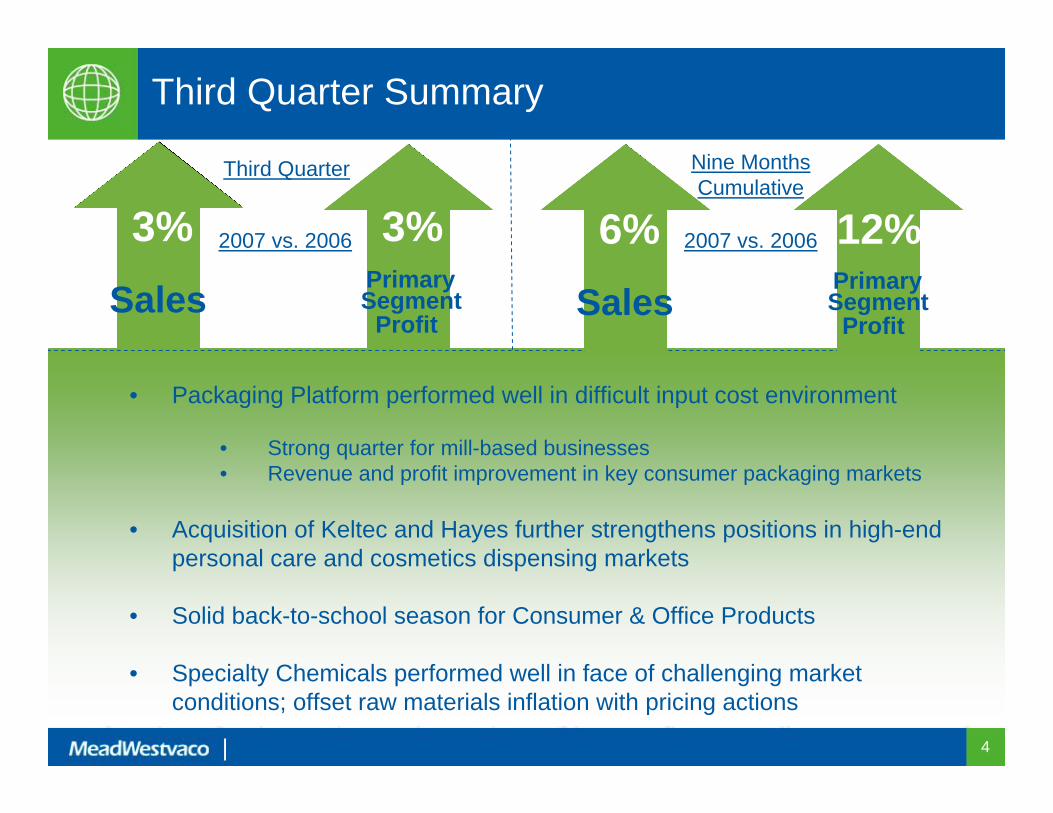
Third Quarter Summary
• Packaging Platform performed well in difficult input cost environment
• Strong quarter for mill-based businesses• Revenue and profit improvement in key consumer packaging markets
• Acquisition of Keltec and Hayes further strengthens positions in high-end personal care and cosmetics dispensing markets
• Solid back-to-school season for Consumer & Office Products
• Specialty Chemicals performed well in face of challenging marketconditions; offset raw materials inflation with pricing actions
3%Sales
2007 vs. 2006 3% 6%Sales
12%2007 vs. 2006
Nine Months Cumulative
Third Quarter
Segment Profit
PrimarySegment
Profit
Primary
5
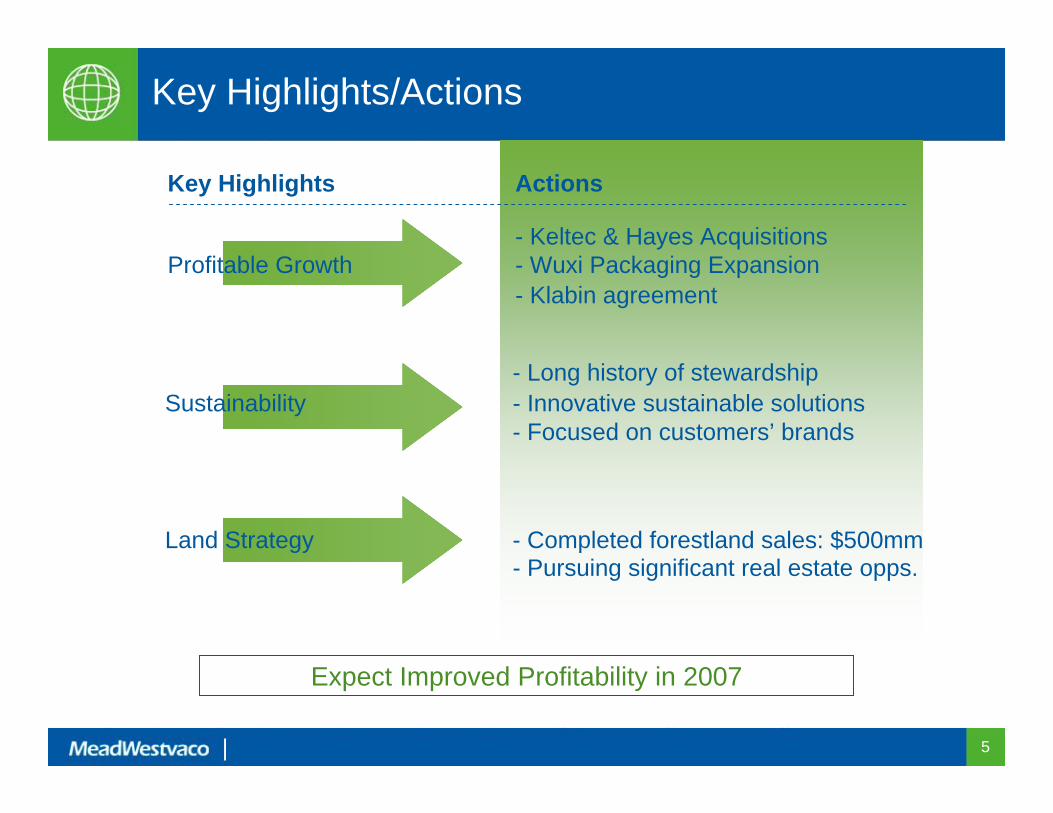
Key Highlights/Actions
Expect Improved Profitability in 2007
Key Highlights Actions
- Keltec & Hayes Acquisitions Profitable Growth - Wuxi Packaging Expansion
- Klabin agreement
- Long history of stewardshipSustainability - Innovative sustainable solutions
- Focused on customers’ brands
Land Strategy - Completed forestland sales: $500mm- Pursuing significant real estate opps.
6
James A. BuzzardPresident

7
Total Company – 3Q 07 vs. 3Q 06Income Before Taxes
$ m
illio
ns
$162$83 $1 $5
$14 ($36) $34
($7) $68
$0$20$40$60$80
$100$120$140$160
3Q 06 ActualVolume
Price/Mix
Energy/Mat'l/Frght Price
Net Cost Productivity
West Va. Timberland Sale
Restruct./One-time Charges
Other
3Q 07 Actual

8
Packaging Resources
4%3Q07 vs. 3Q06
8%
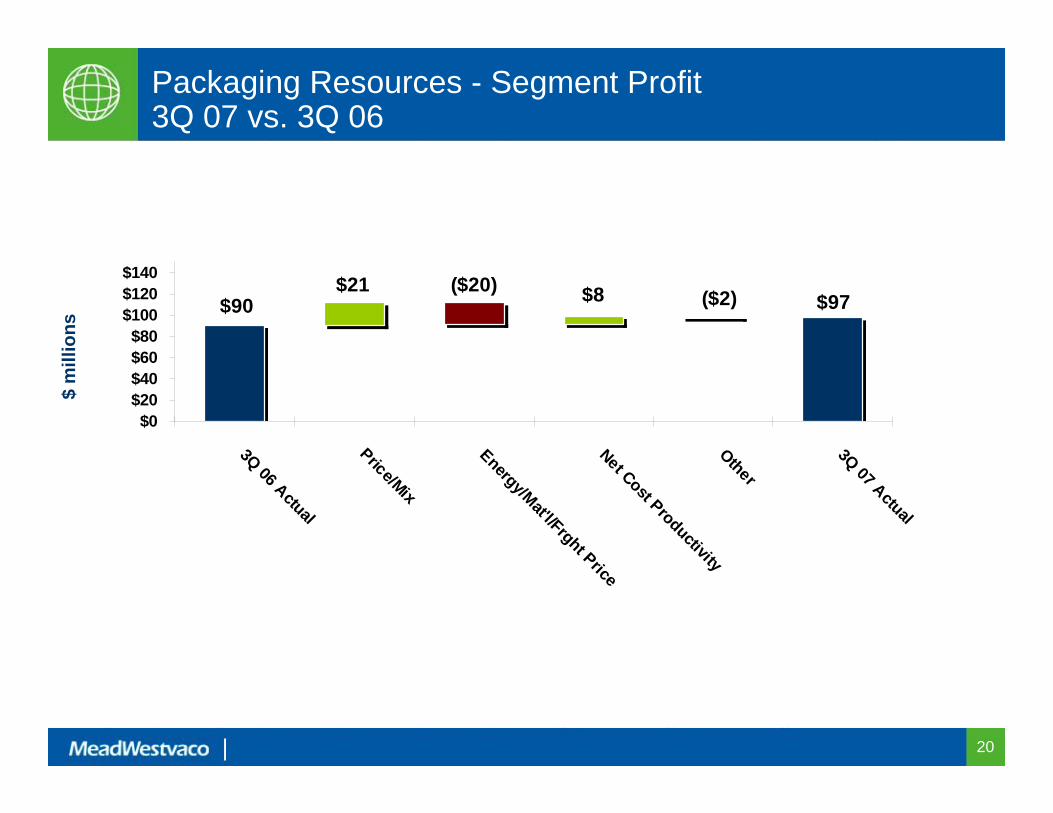
• Improved pricing and increased productivity more than offset input cost inflation
• Volume growth in targeted high-value grades – CNK and tobacco
• 4Q Outlook – Solid year-over-year segment profit growth. Expect to overcome elevated input costs with price realizations, mix improvements, and productivity gains
Segment Sales$779 million $97 million
Segment Profit

9
Consumer Solutions
4%Segment Sales
3Q07 vs. 3Q06
$611 million
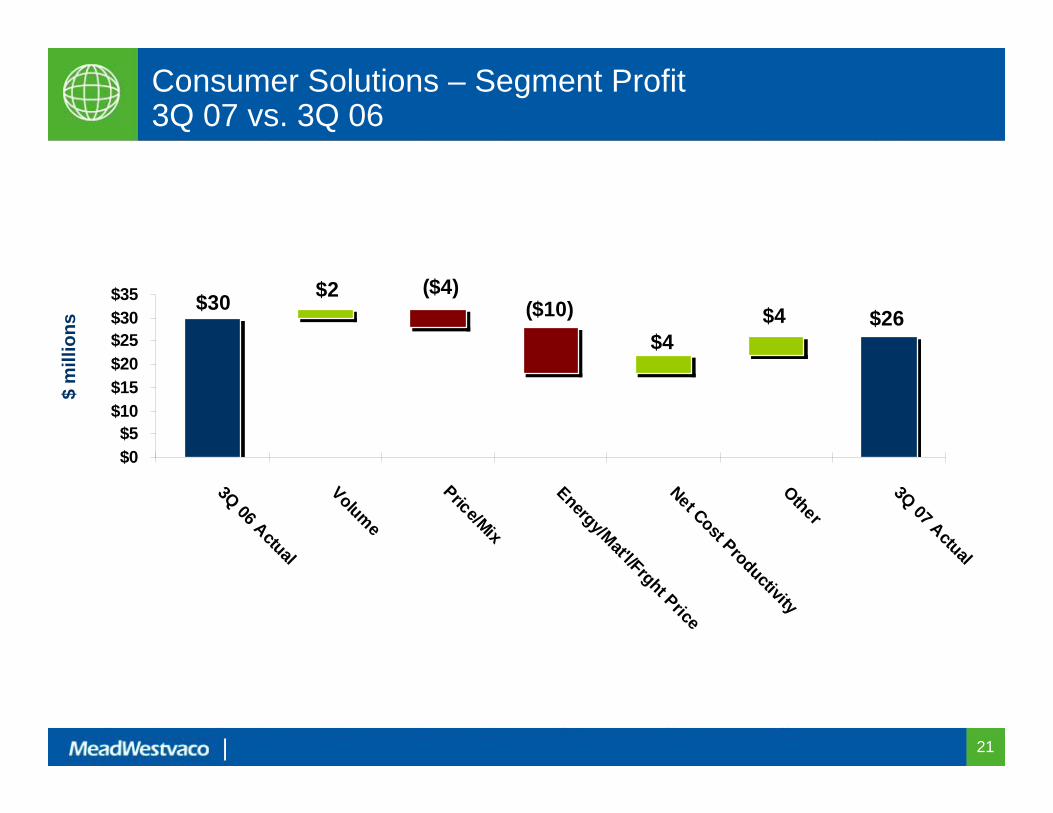
• Increased sales and improved profitability in media, healthcare, and personal care businesses
• Lawn and garden business significantly weaker due to drought conditions in parts of U.S.
• Higher resin and steel costs impacted profitability
• 4Q Outlook – Modest year-over-year segment profit growth. Expect improved demand in lawn and garden, solid performance in beverage and food packaging, and continued growth in personal care and healthcare businesses
13%Segment Profit
$26 million
10
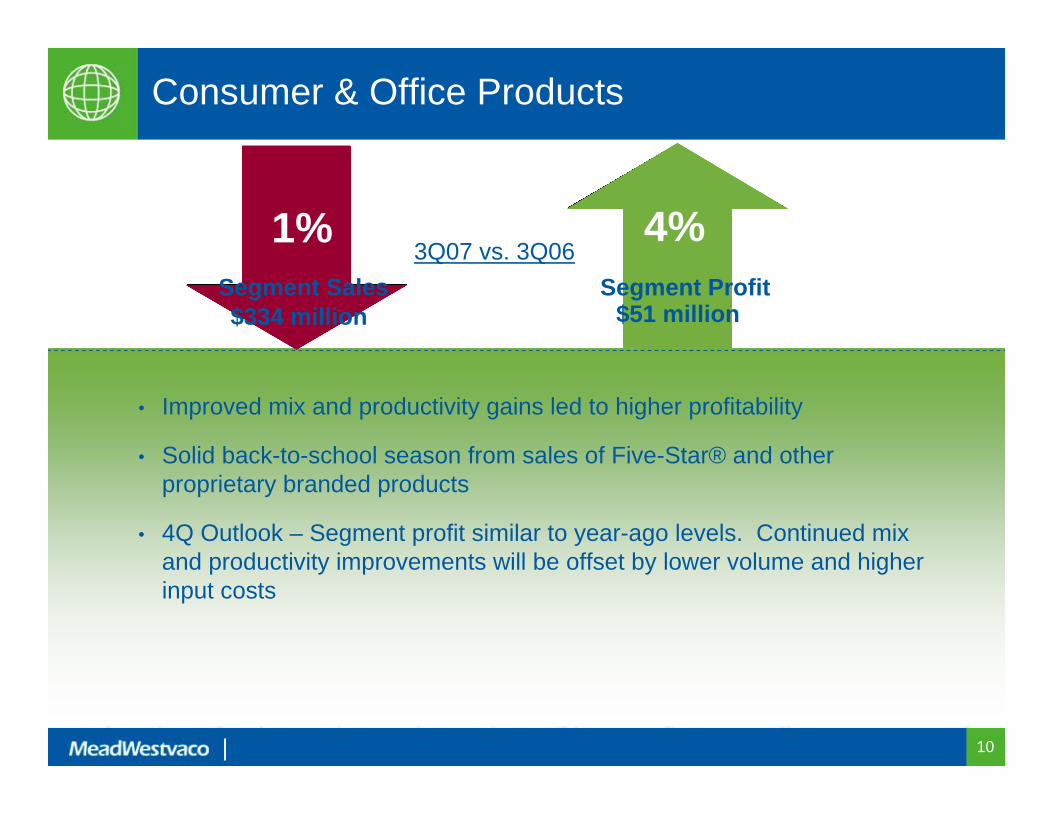
Consumer & Office Products
3Q07 vs. 3Q064%
Segment Profit$51 million
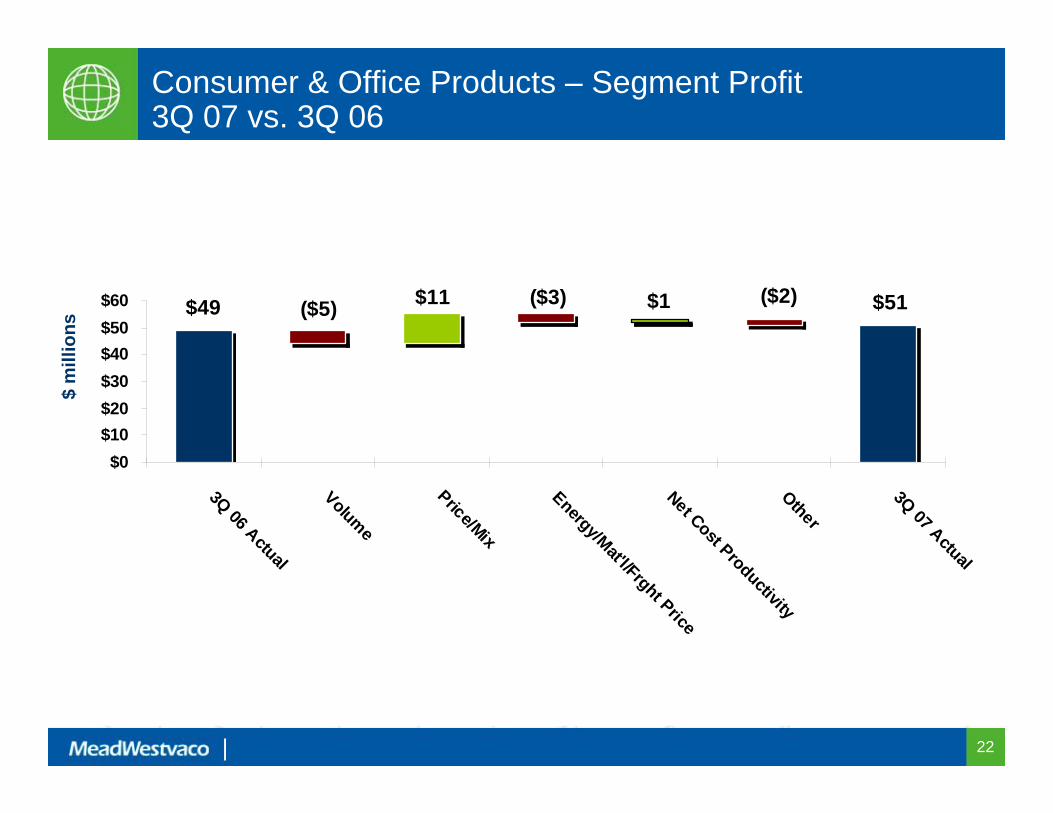
• Improved mix and productivity gains led to higher profitability
• Solid back-to-school season from sales of Five-Star® and other proprietary branded products
• 4Q Outlook – Segment profit similar to year-ago levels. Continued mix and productivity improvements will be offset by lower volume and higher input costs
1%Segment Sales$334 million

11
Specialty Chemicals
flat 3Q07 vs. 3Q067%
Segment Profit$16 million
FLAT
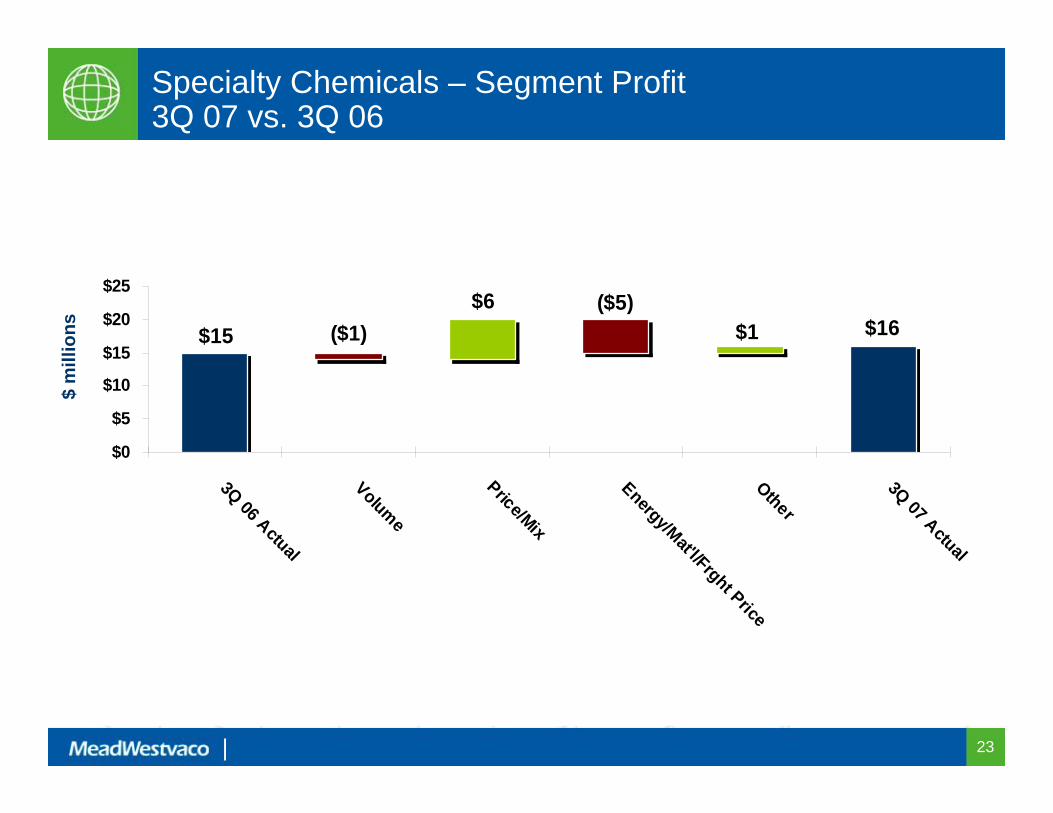
• Price improvements more than offset higher costs for CTO and other inputs
• Asphalt sales increased with late-season volume
• Carbon business impacted by continued weakness in North American automotive sales
• Weaker housing market negatively impacting volume and mix for certain pine chemical products
• 4Q Outlook – Segment profit similar to year-ago levels. Pricing improvement will offset higher input costs and volume declines in carbon and building materials products.
Segment Sales$131 million

12
E. Mark RajkowskiSenior Vice President and CFO
13
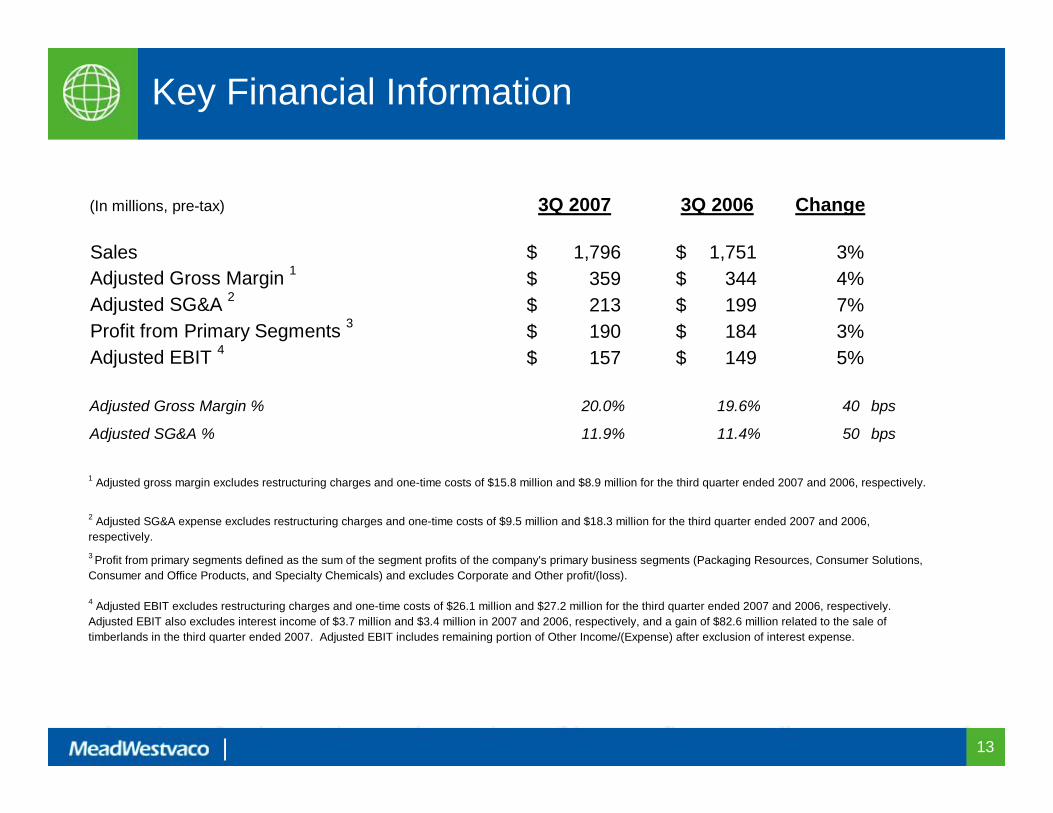
Key Financial Information
(In millions, pre-tax) 3Q 2007 3Q 2006 Change
Sales 1,796$ 1,751$ 3%Adjusted Gross Margin 1 359$ 344$ 4%Adjusted SG&A 2 213$ 199$ 7%Profit from Primary Segments 3 190$ 184$ 3%Adjusted EBIT 4 157$ 149$ 5% Adjusted Gross Margin % 20.0% 19.6% 40 bps
Adjusted SG&A % 11.9% 11.4% 50 bps
1 Adjusted gross margin excludes restructuring charges and one-time costs of $15.8 million and $8.9 million for the third quarter ended 2007 and 2006, respectively.
2 Adjusted SG&A expense excludes restructuring charges and one-time costs of $9.5 million and $18.3 million for the third quarter ended 2007 and 2006, respectively.
4 Adjusted EBIT excludes restructuring charges and one-time costs of $26.1 million and $27.2 million for the third quarter ended 2007 and 2006, respectively. Adjusted EBIT also excludes interest income of $3.7 million and $3.4 million in 2007 and 2006, respectively, and a gain of $82.6 million related to the sale of timberlands in the third quarter ended 2007. Adjusted EBIT includes remaining portion of Other Income/(Expense) after exclusion of interest expense.
3 Profit from primary segments defined as the sum of the segment profits of the company's primary business segments (Packaging Resources, Consumer Solutions, Consumer and Office Products, and Specialty Chemicals) and excludes Corporate and Other profit/(loss).
14
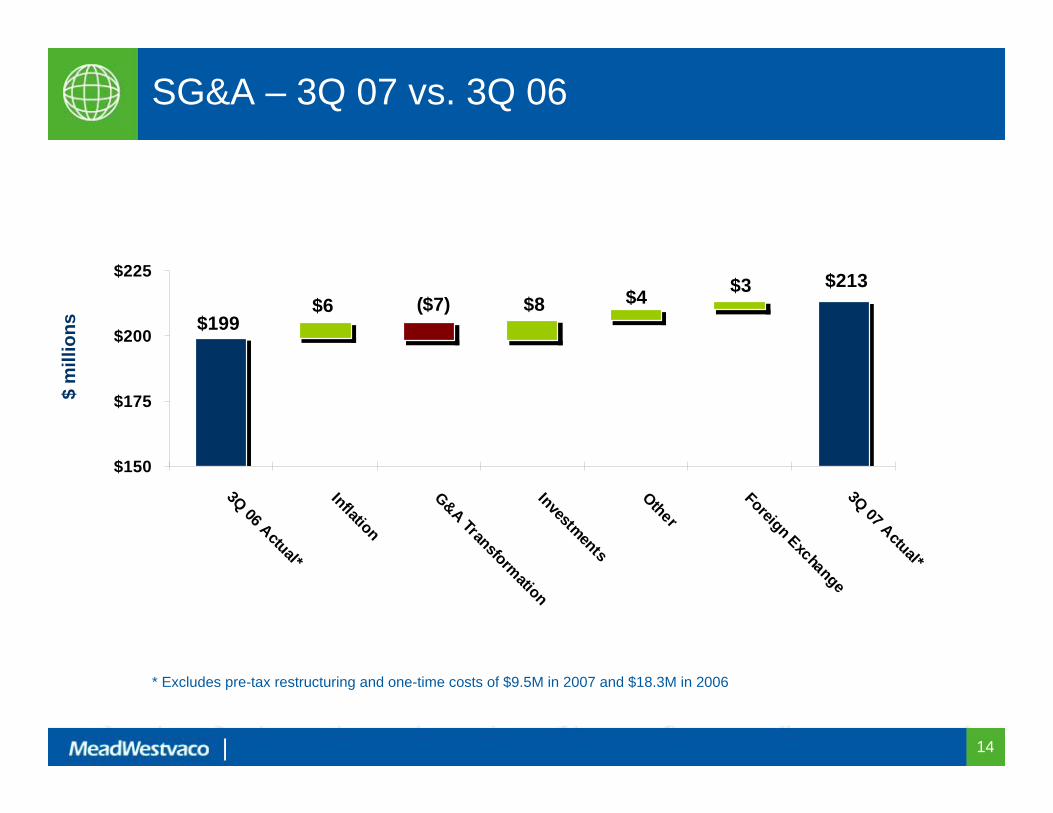
SG&A – 3Q 07 vs. 3Q 06
* Excludes pre-tax restructuring and one-time costs of $9.5M in 2007 and $18.3M in 2006
$ m
illio
ns
$3 $213$4 $8 ($7) $6
$199
$150
$175
$200
$225
3Q 06 Actual*
Inflation
G&A TransformationInvestments
Other
Foreign Exchange3Q 07 Actual*
15
Appendix
16
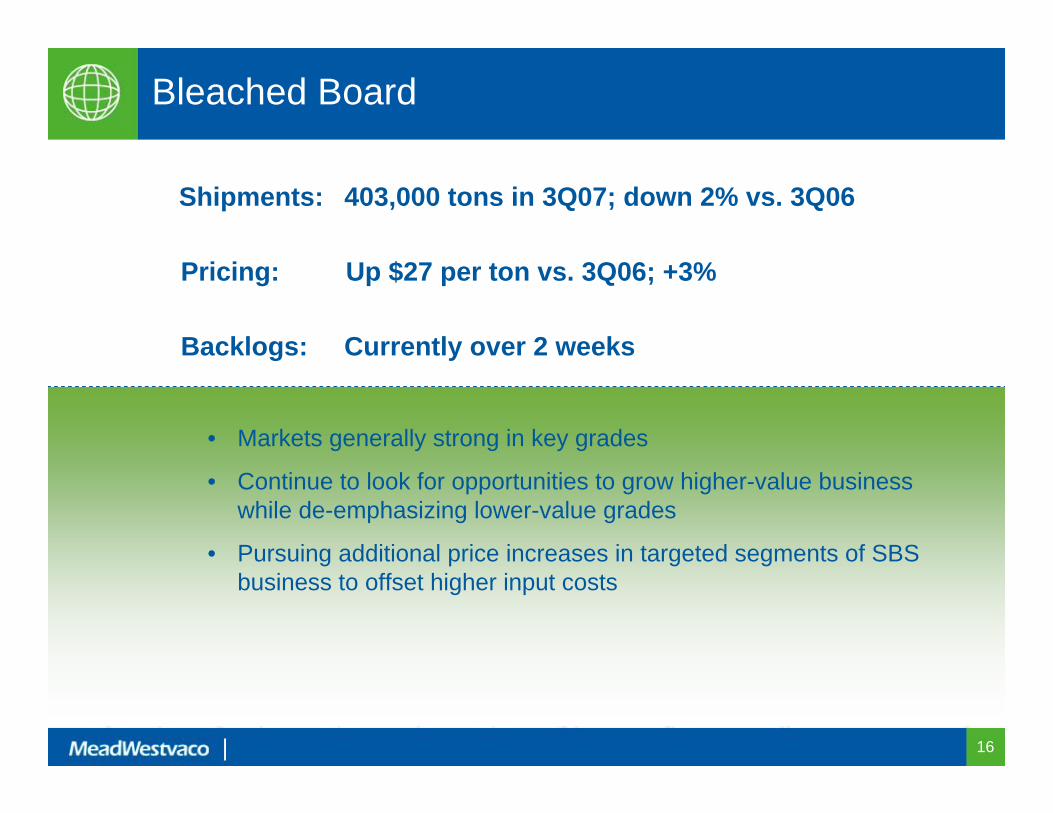
Bleached Board
• Markets generally strong in key grades
• Continue to look for opportunities to grow higher-value business while de-emphasizing lower-value grades
• Pursuing additional price increases in targeted segments of SBS business to offset higher input costs
Shipments: 403,000 tons in 3Q07; down 2% vs. 3Q06
Pricing: Up $27 per ton vs. 3Q06; +3%
Backlogs: Currently over 2 weeks
17
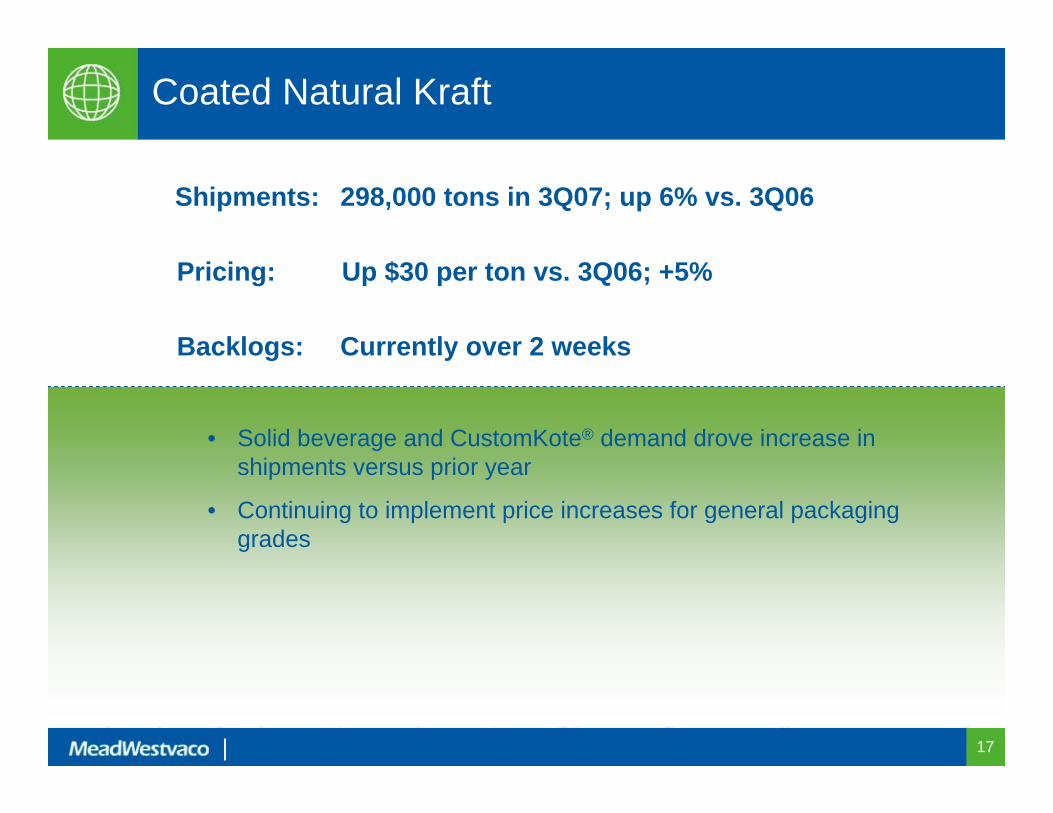
Coated Natural Kraft
• Solid beverage and CustomKote® demand drove increase in shipments versus prior year
• Continuing to implement price increases for general packaging grades
Shipments: 298,000 tons in 3Q07; up 6% vs. 3Q06
Pricing: Up $30 per ton vs. 3Q06; +5%
Backlogs: Currently over 2 weeks
18
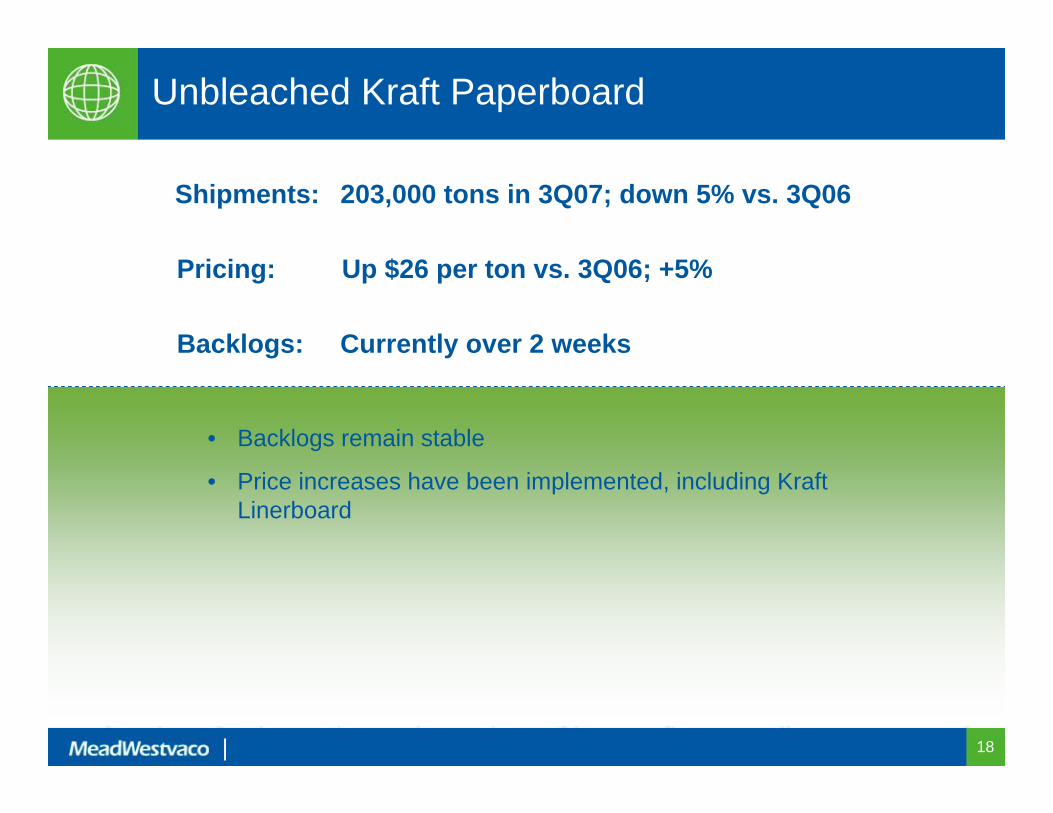
Unbleached Kraft Paperboard
• Backlogs remain stable
• Price increases have been implemented, including Kraft Linerboard
Shipments: 203,000 tons in 3Q07; down 5% vs. 3Q06
Pricing: Up $26 per ton vs. 3Q06; +5%
Backlogs: Currently over 2 weeks
19
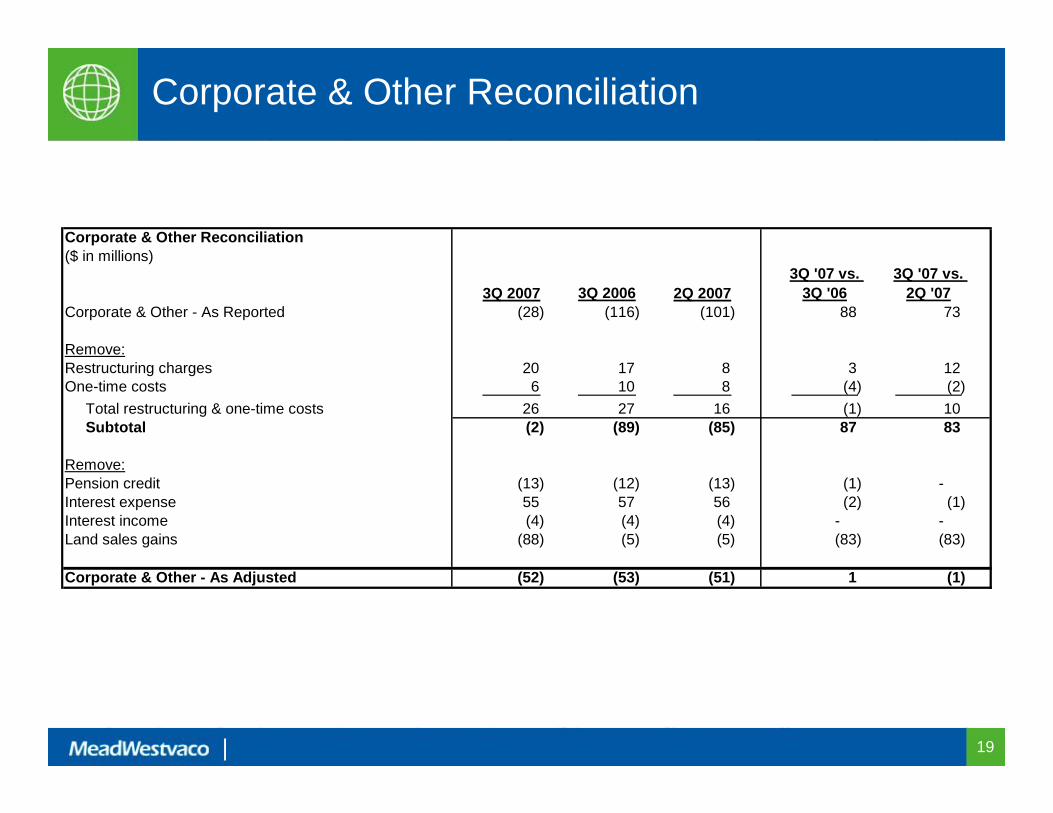
Corporate & Other Reconciliation
Corporate & Other Reconciliation($ in millions)
3Q 2007 3Q 2006 2Q 20073Q '07 vs.
3Q '063Q '07 vs.
2Q '07Corporate & Other - As Reported (28) (116) (101) 88 73
Remove:Restructuring charges 20 17 8 3 12 One-time costs 6 10 8 (4) (2) Total restructuring & one-time costs 26 27 16 (1) 10 Subtotal (2) (89) (85) 87 83
Remove:Pension credit (13) (12) (13) (1) - Interest expense 55 57 56 (2) (1) Interest income (4) (4) (4) - - Land sales gains (88) (5) (5) (83) (83)
Corporate & Other - As Adjusted (52) (53) (51) 1 (1)
20
Packaging Resources - Segment Profit3Q 07 vs. 3Q 06
$ m
illio
ns
$90 ($20) $21 $8 ($2) $97
$0$20$40$60$80
$100$120$140
3Q 06 Actual
Price/Mix
Energy/Mat'l/Frght PriceNet Cost ProductivityOther
3Q 07 Actual
21
Consumer Solutions – Segment Profit3Q 07 vs. 3Q 06
$ m
illio
ns $4 $26 $4($10)
$2 ($4) $30
$0$5
$10$15$20$25$30$35
3Q 06 Actual
Volume
Price/Mix
Energy/Mat'l/Frght PriceNet Cost ProductivityOther
3Q 07 Actual
22
Consumer & Office Products – Segment Profit3Q 07 vs. 3Q 06
$ m
illio
ns
($2) $51 $1 ($3) ($5) $11$49
$0$10$20$30$40$50$60
3Q 06 Actual
Volume
Price/Mix
Energy/Mat'l/Frght PriceNet Cost ProductivityOther
3Q 07 Actual
23
Specialty Chemicals – Segment Profit3Q 07 vs. 3Q 06
$ m
illio
ns $15 $6
($1) ($5)
$1 $16
$0
$5
$10
$15
$20
$25
3Q 06 Actual
Volume
Price/Mix
Energy/Mat'l/Frght PriceOther
3Q 07 Actual