Embed Size (px)
Citation preview

Management Practices, Workforce
Selection, and Productivity
2016 Conference of the Global Forum on Productivity
Lisbon, 7-8 July 2016
Stefan Bender (Bundesbank), Nicholas Bloom (Stanford),
David Card (UC Berkeley), John Van Reenen (LSE),
Stefanie Wolter (IAB)
Disclaimer: Any opinions expressed in this paper are those of the authors and do not necessarily reflect the views
of the Deutsche Bundesbank or the Institute for Employment Research.

Are Management practices just due to
folks like these?
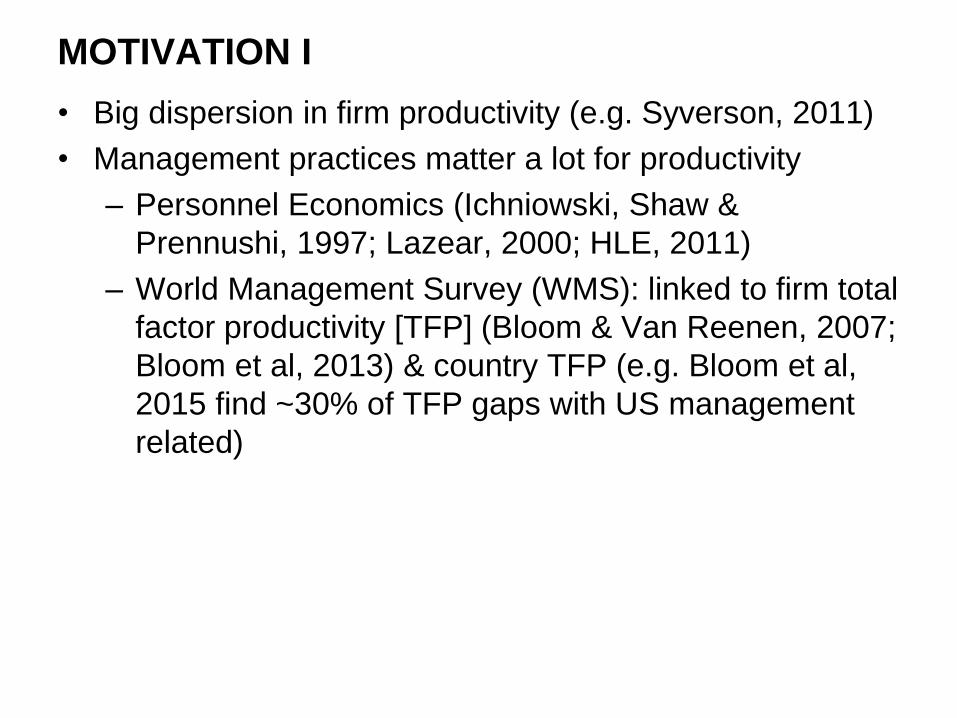
MOTIVATION I
• Big dispersion in firm productivity (e.g. Syverson, 2011)
• Management practices matter a lot for productivity
– Personnel Economics (Ichniowski, Shaw &
Prennushi, 1997; Lazear, 2000; HLE, 2011)
– World Management Survey (WMS): linked to firm total
factor productivity [TFP] (Bloom & Van Reenen, 2007;
Bloom et al, 2013) & country TFP (e.g. Bloom et al,
2015 find ~30% of TFP gaps with US management
related)

MOTIVATION II
• Do “good management practices” simply reflect human
capital: e.g. more talented CEOs (Lucas, 1978), senior
managers, or employees in general?
• Or are these firms more than just the sum of the
“atoms” of human capital of managers– e.g. Toyota
corporate culture persists when managers leave or
founder dies?

IEB: Data: German Employer-Employee Panel
Management Practices & Human Capital
Productivity
WMS Data: World Management Survey
Selection – Inflows & Outflows
Extensions & Robustness
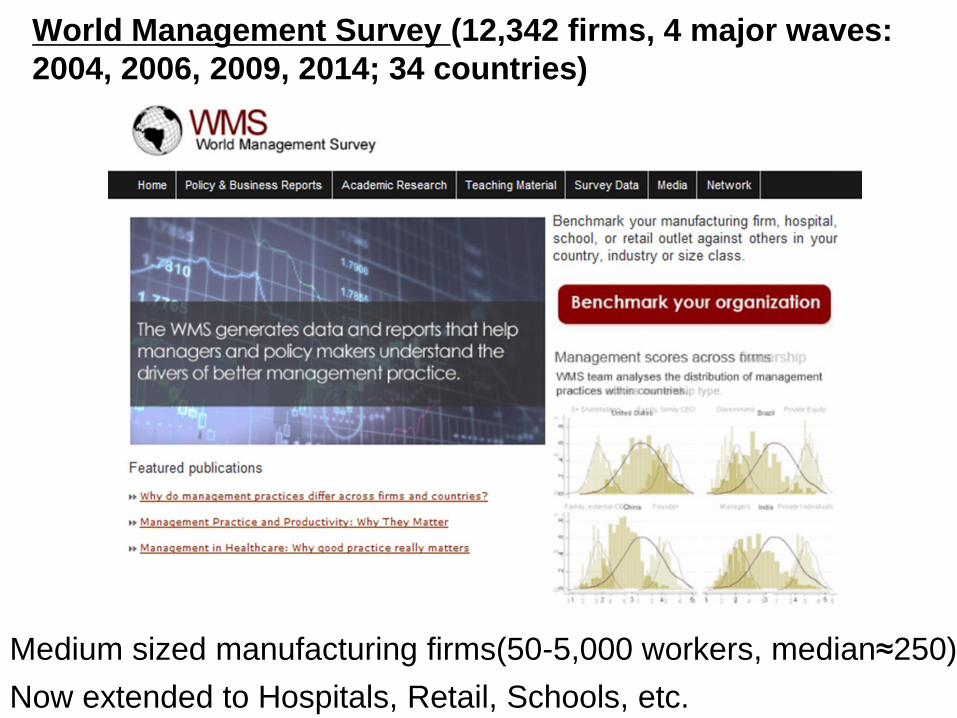
World Management Survey (12,342 firms, 4 major waves:
2004, 2006, 2009, 2014; 34 countries)
Medium sized manufacturing firms(50-5,000 workers, median≈250)
Now extended to Hospitals, Retail, Schools, etc.
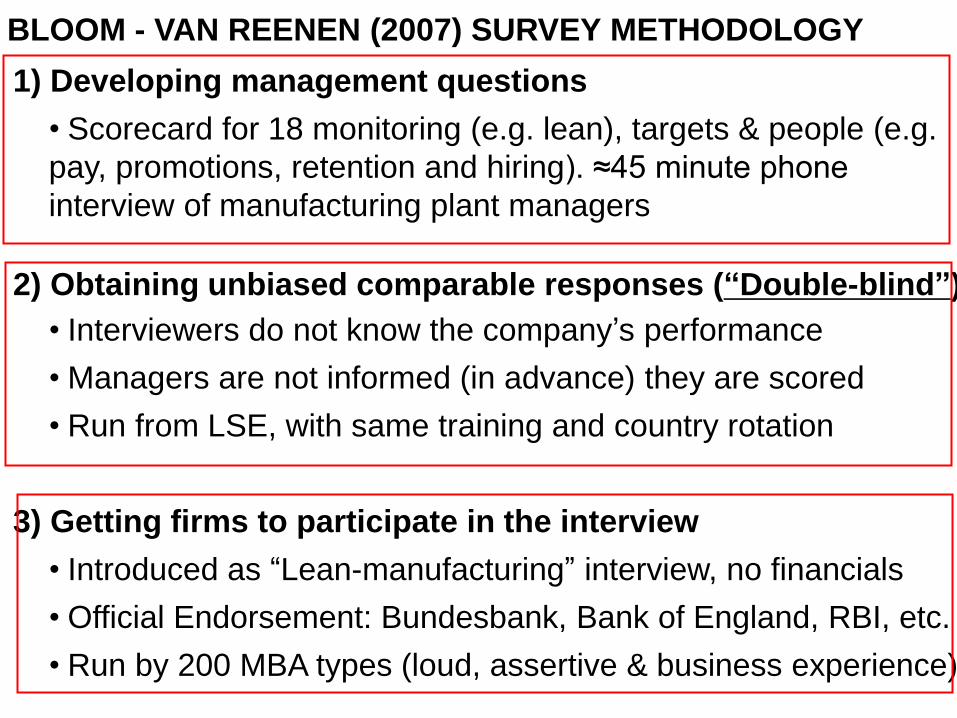
1) Developing management questions
• Scorecard for 18 monitoring (e.g. lean), targets & people (e.g.
pay, promotions, retention and hiring). ≈45 minute phone
interview of manufacturing plant managers
2) Obtaining unbiased comparable responses (“Double-blind”)
• Interviewers do not know the company’s performance
• Managers are not informed (in advance) they are scored
• Run from LSE, with same training and country rotation
3) Getting firms to participate in the interview
• Introduced as “Lean-manufacturing” interview, no financials
• Official Endorsement: Bundesbank, Bank of England, RBI, etc.
• Run by 200 MBA types (loud, assertive & business experience)
BLOOM - VAN REENEN (2007) SURVEY METHODOLOGY

Score (1): Measures
tracked do not
indicate directly
if overall
business
objectives are
being met.
Certain
processes
aren’t tracked at
all
(3): Most key
performance
indicators
are tracked
formally.
Tracking is
overseen by
senior
management
(5): Performance is
continuously
tracked and
communicated,
both formally and
informally, to all
staff using a range
of visual
management tools
MONITORING – e.g. “HOW IS PERFORMANCE TRACKED?”
8
Note: All 18 questions and over 50 examples in Bloom & Van Reenen (2007) &
Appendix
http://worldmanagementsurvey.org/
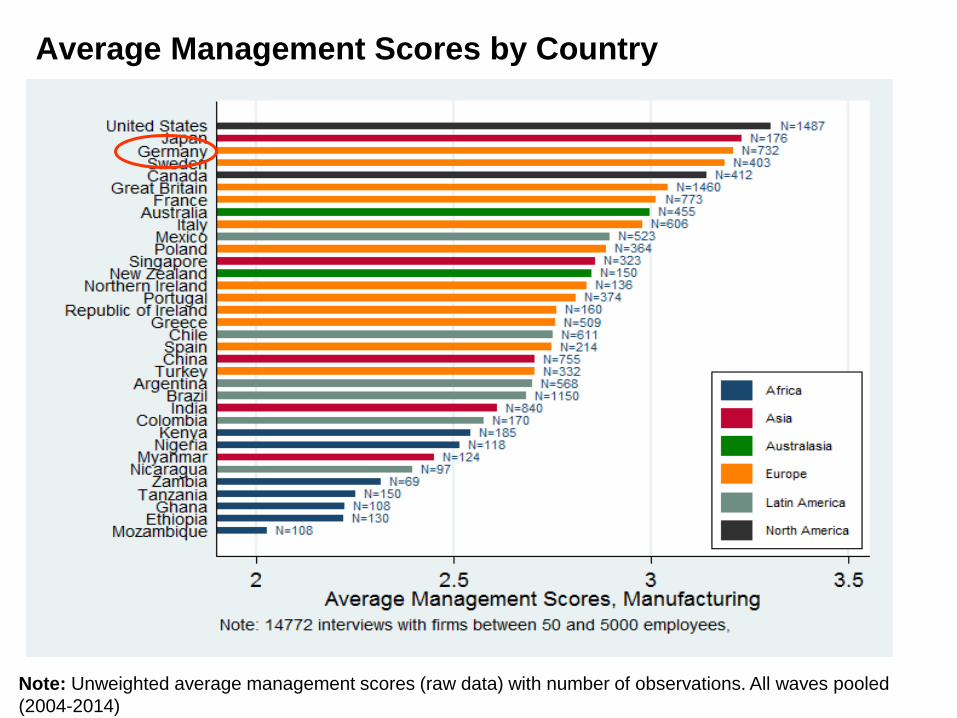
Average Management Scores by Country
Note: Unweighted average management scores (raw data) with number of observations. All waves pooled
(2004-2014)
0.5
11.5
20
.51
1.5
20
.51
1.5
20
.51
1.5
20
.51
1.5
20
.51
1.5
2
1 2 3 4 5
1 2 3 4 5 1 2 3 4 5 1 2 3 4 5 1 2 3 4 5 1 2 3 4 5
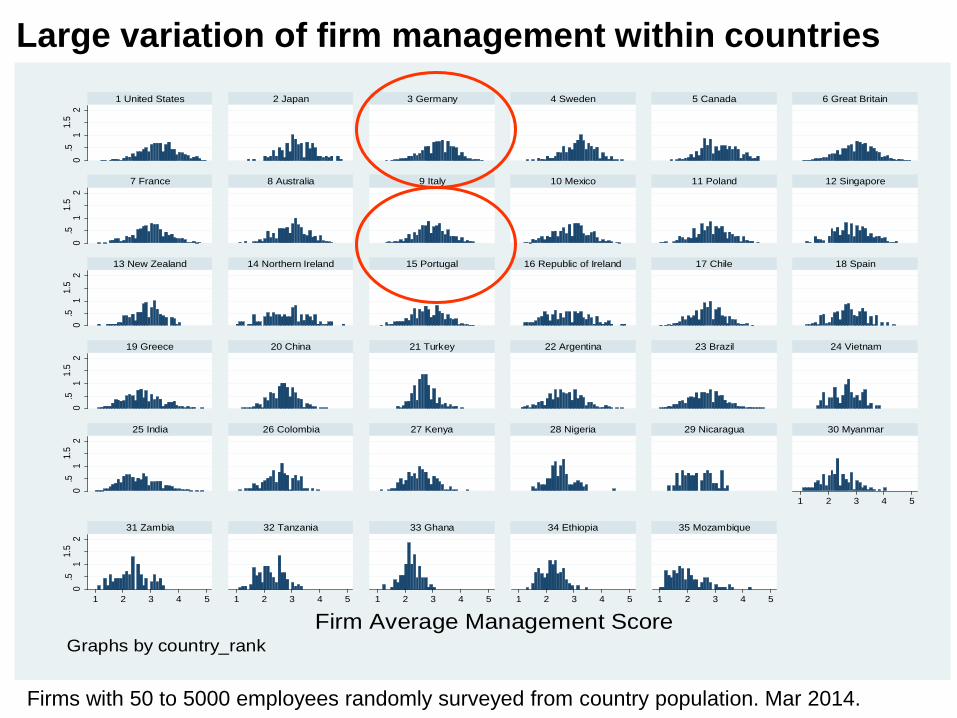
1 United States 2 Japan 3 Germany 4 Sweden 5 Canada 6 Great Britain
7 France 8 Australia 9 Italy 10 Mexico 11 Poland 12 Singapore
13 New Zealand 14 Northern Ireland 15 Portugal 16 Republic of Ireland 17 Chile 18 Spain
19 Greece 20 China 21 Turkey 22 Argentina 23 Brazil 24 Vietnam
25 India 26 Colombia 27 Kenya 28 Nigeria 29 Nicaragua 30 Myanmar
31 Zambia 32 Tanzania 33 Ghana 34 Ethiopia 35 Mozambique
De
nsi
ty
Firm Average Management ScoreGraphs by country_rank
Firms with 50 to 5000 employees randomly surveyed from country population. Mar 2014.
Large variation of firm management within countries

IEB Data: German Employer-Employee Panel
Management Practices & Human Capital
Productivity
WMS Data: World Management Survey
Selection – Inflows & Outflows
Extensions & Robustness
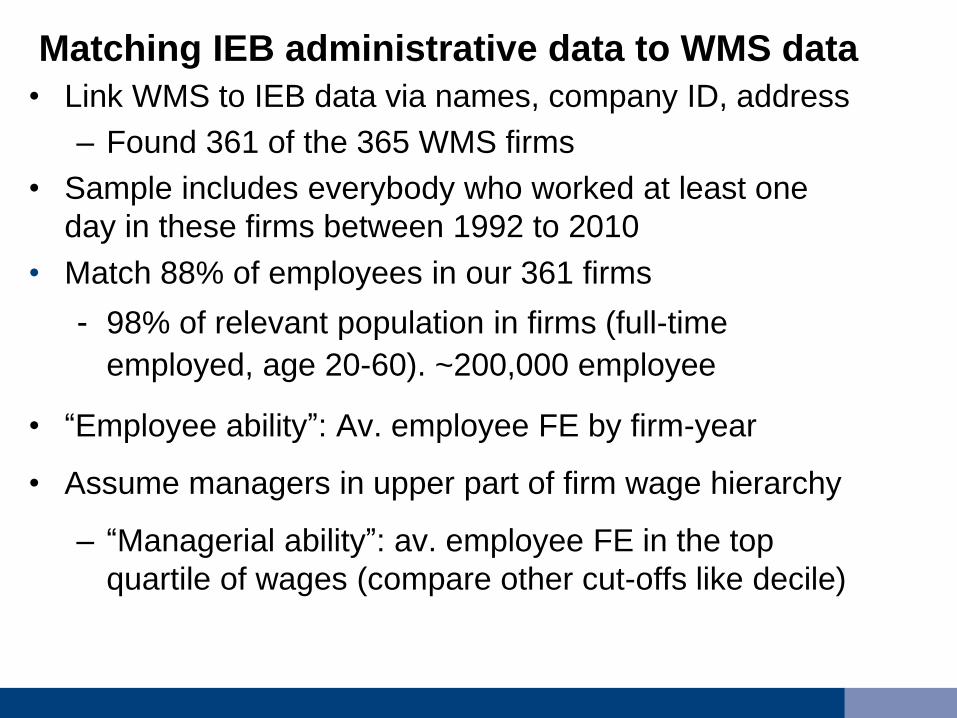
Matching IEB administrative data to WMS data
• Link WMS to IEB data via names, company ID, address
– Found 361 of the 365 WMS firms
• Sample includes everybody who worked at least one
day in these firms between 1992 to 2010
• Match 88% of employees in our 361 firms
‐ 98% of relevant population in firms (full-time
employed, age 20-60). ~200,000 employee
• “Employee ability”: Av. employee FE by firm-year
• Assume managers in upper part of firm wage hierarchy
– “Managerial ability”: av. employee FE in the top
quartile of wages (compare other cut-offs like decile)
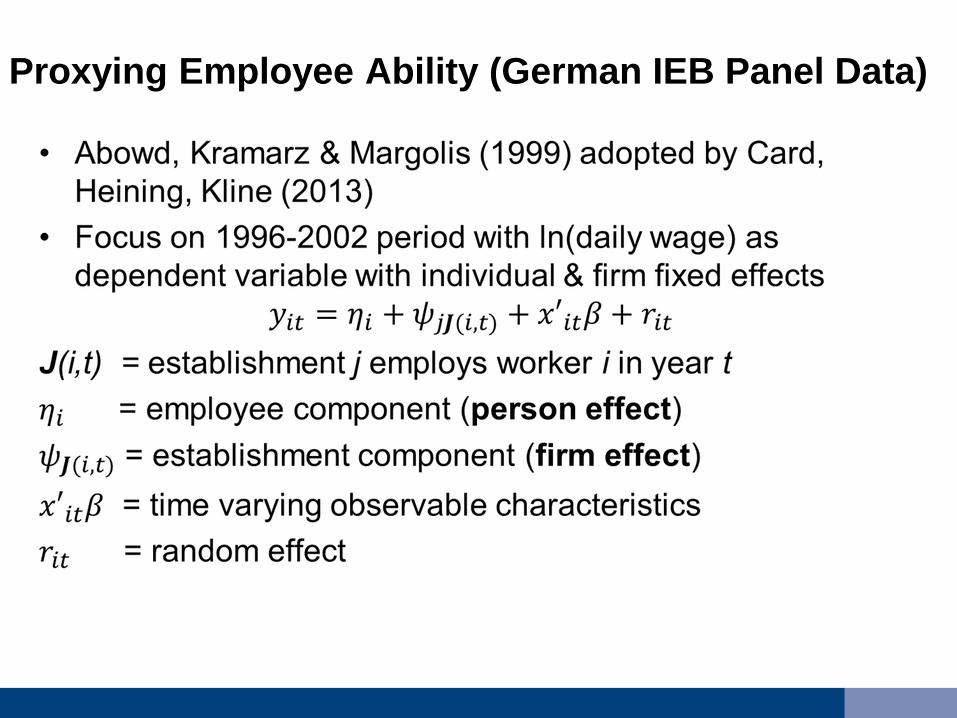
Proxying Employee Ability (German IEB Panel Data)

Data: German Employer-Employee Panel
Management Practices & Human Capital
Productivity
Data: World Management Survey
Selection – Inflows & Outflows
Extensions & Robustness
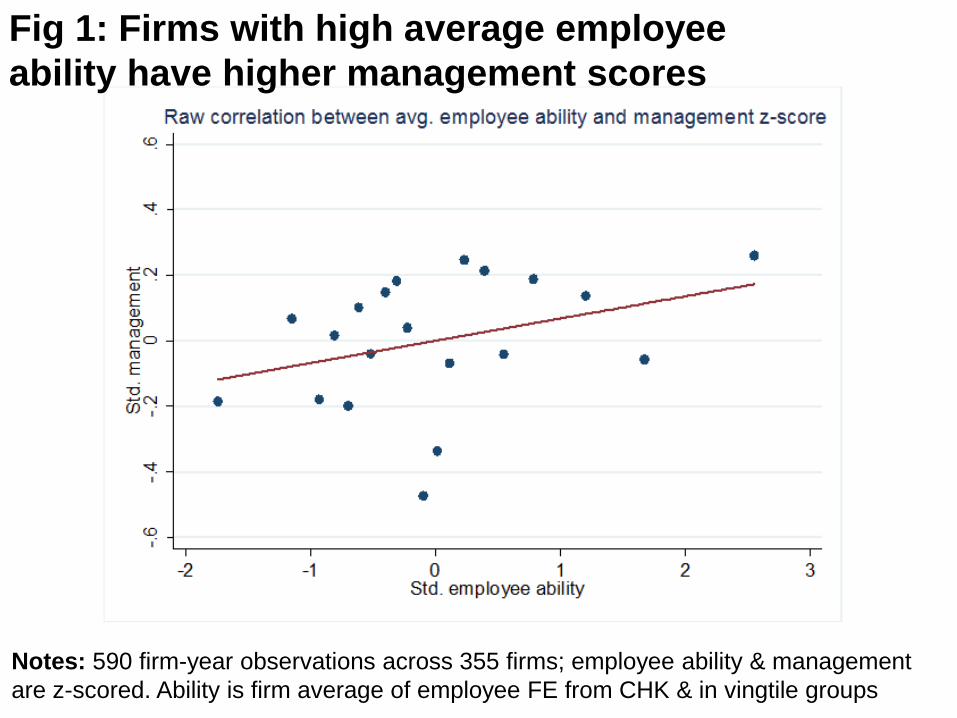
Fig 1: Firms with high average employee
ability have higher management scores
Notes: 590 firm-year observations across 355 firms; employee ability & management
are z-scored. Ability is firm average of employee FE from CHK & in vingtile groups

Data: German Employer-Employee Panel
Management Practices & Human Capital
Productivity
Data: World Management Survey
Selection – Inflows & Outflows
Extensions & Robustness
17
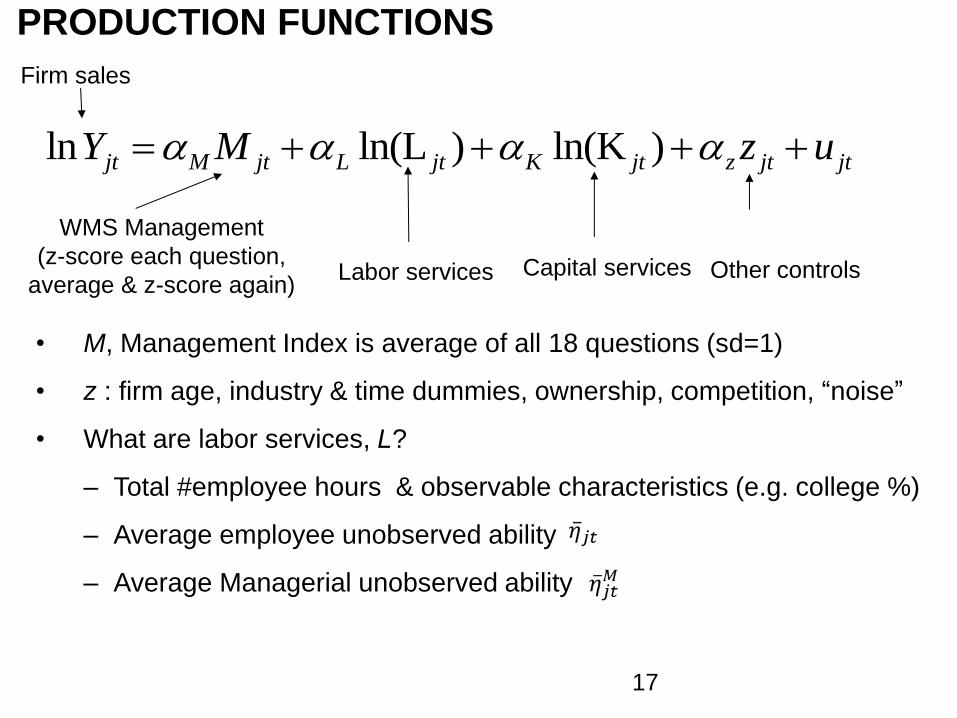
Firm sales
ln ln(L ) ln(K )jt M jt L jt K jt z jt jtY M z u
Capital services
WMS Management
(z-score each question,
average & z-score again) Labor services Other controls
• M, Management Index is average of all 18 questions (sd=1)
• z : firm age, industry & time dummies, ownership, competition, “noise”
• What are labor services, L?
– Total #employee hours & observable characteristics (e.g. college %)
– Average employee unobserved ability
– Average Managerial unobserved ability
PRODUCTION FUNCTIONS
5.5
66
.57
lpro
d
-2 -1 0 1 2zmanagement_sub1
Lab
or
Pro
ductivity
Management Z-score
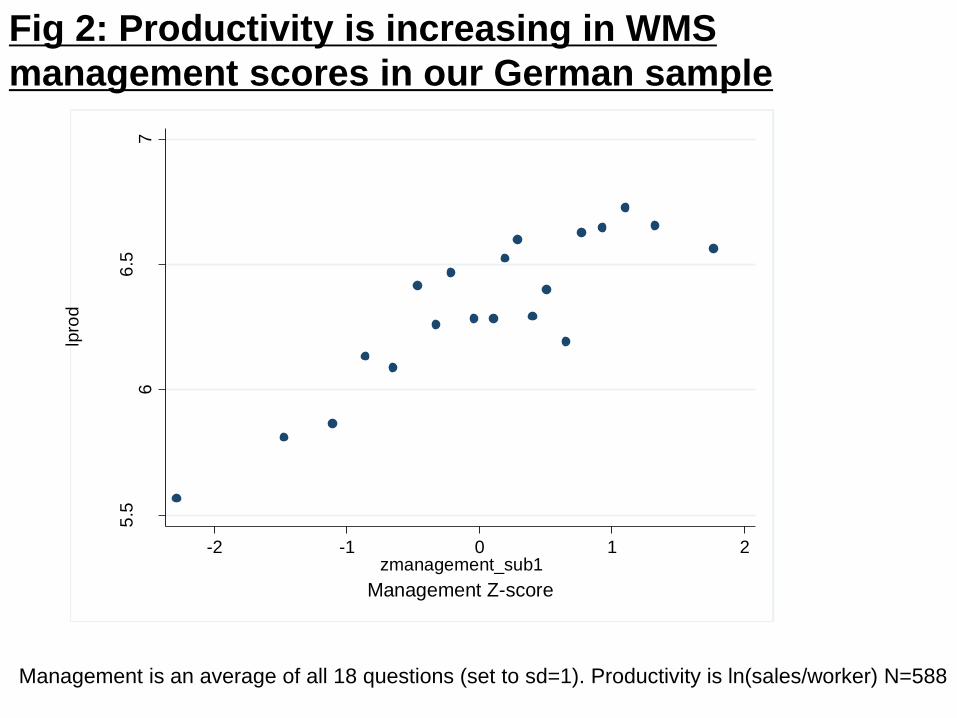
Fig 2: Productivity is increasing in WMS
management scores in our German sample
Management is an average of all 18 questions (set to sd=1). Productivity is ln(sales/worker) N=588
67
89
10
lpro
d
-2 -1 0 1 2zpeff_9602_mean_june
Lab
or
Pro
duct
ivity
Av. employee FE in firm
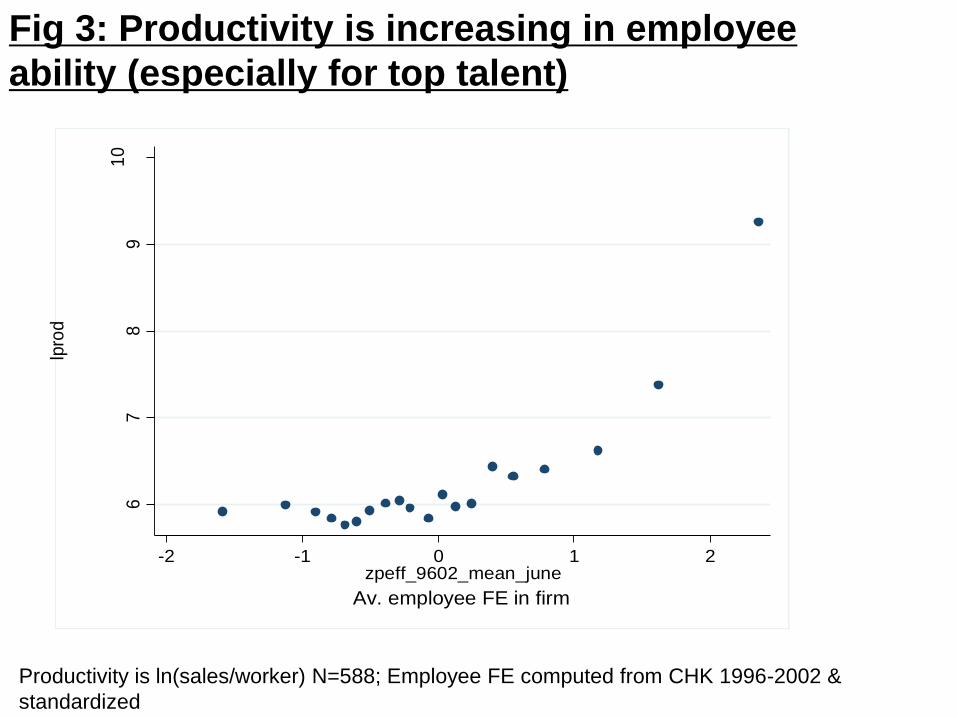
Fig 3: Productivity is increasing in employee
ability (especially for top talent)
Productivity is ln(sales/worker) N=588; Employee FE computed from CHK 1996-2002 &
standardized
-.5
0.5
zm
ean
_zm
ana
ge
men
t_an
-2 -1 0 1 2zfirm_eff_9602
Man
ag
em
en
t S
co
re
Firm FE
55
.56
6.5
77
.5
lpro
d
-2 -1 0 1 2zfirm_eff_9602
Lab
or
Pro
ductivity
Firm FE
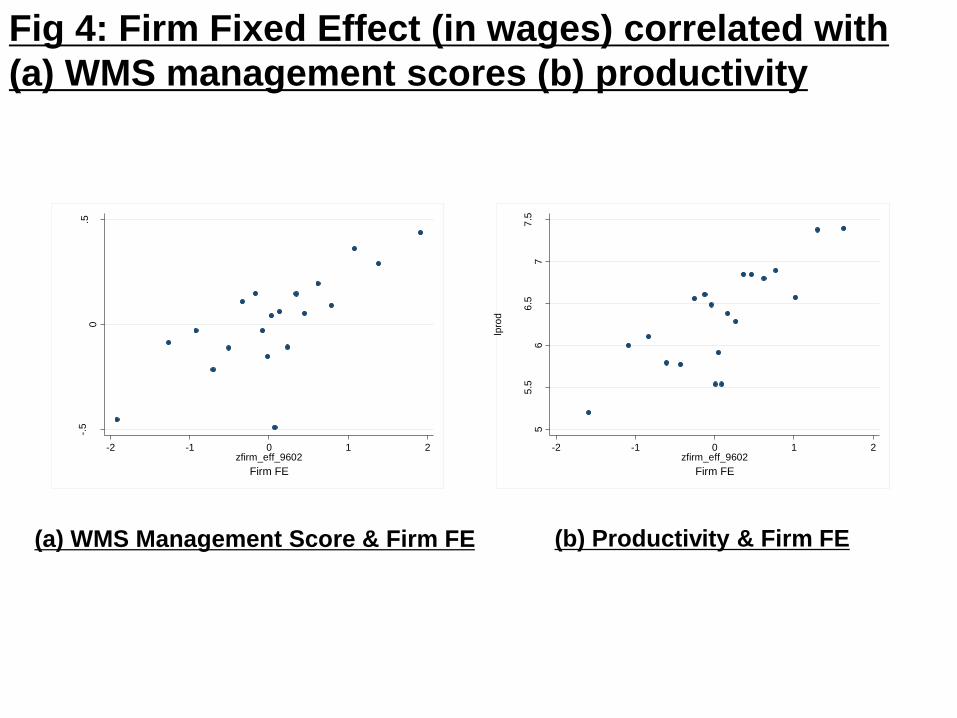
Fig 4: Firm Fixed Effect (in wages) correlated with
(a) WMS management scores (b) productivity
(a) WMS Management Score & Firm FE (b) Productivity & Firm FE
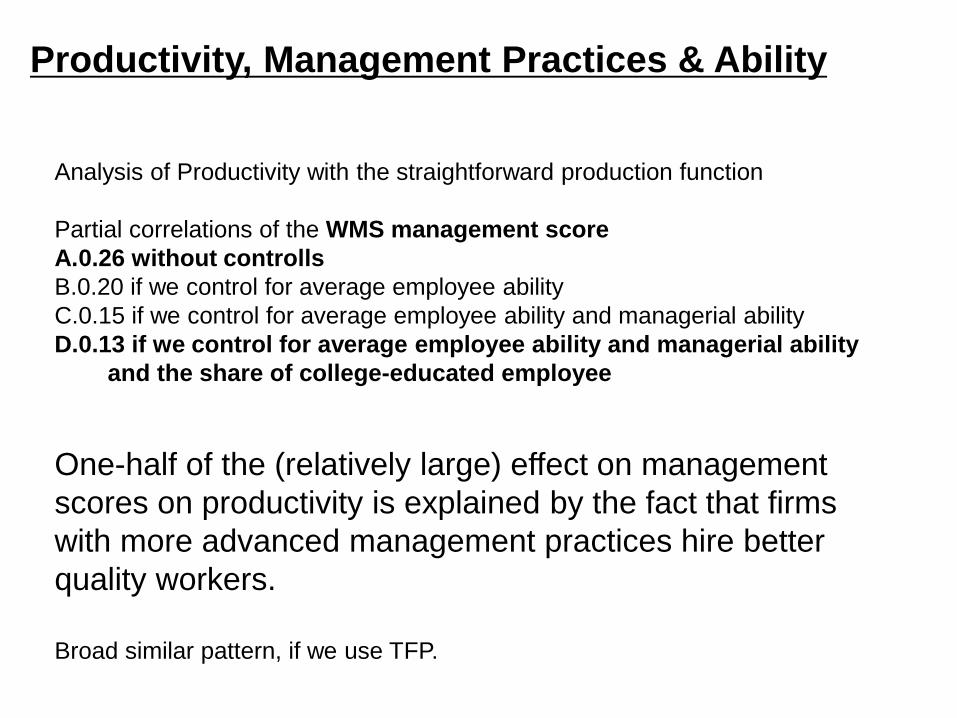
Productivity, Management Practices & Ability
Analysis of Productivity with the straightforward production function
Partial correlations of the WMS management score
A.0.26 without controlls
B.0.20 if we control for average employee ability
C.0.15 if we control for average employee ability and managerial ability
D.0.13 if we control for average employee ability and managerial ability
and the share of college-educated employee
One-half of the (relatively large) effect on management
scores on productivity is explained by the fact that firms
with more advanced management practices hire better
quality workers.
Broad similar pattern, if we use TFP.

Data: German Employer-Employee Panel
Management Practices & Human Capital
Productivity
Data: World Management Survey
Selection – Inflows & Outflows
Extensions & Robustness
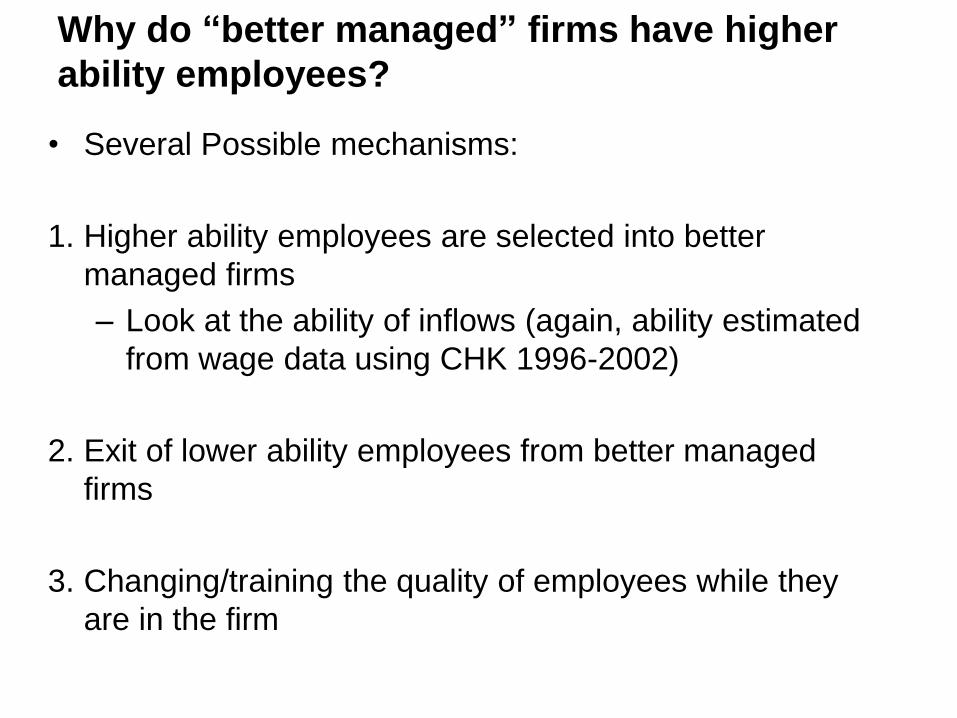
Why do “better managed” firms have higher
ability employees?
• Several Possible mechanisms:
1. Higher ability employees are selected into better
managed firms
– Look at the ability of inflows (again, ability estimated
from wage data using CHK 1996-2002)
2. Exit of lower ability employees from better managed
firms
3. Changing/training the quality of employees while they
are in the firm
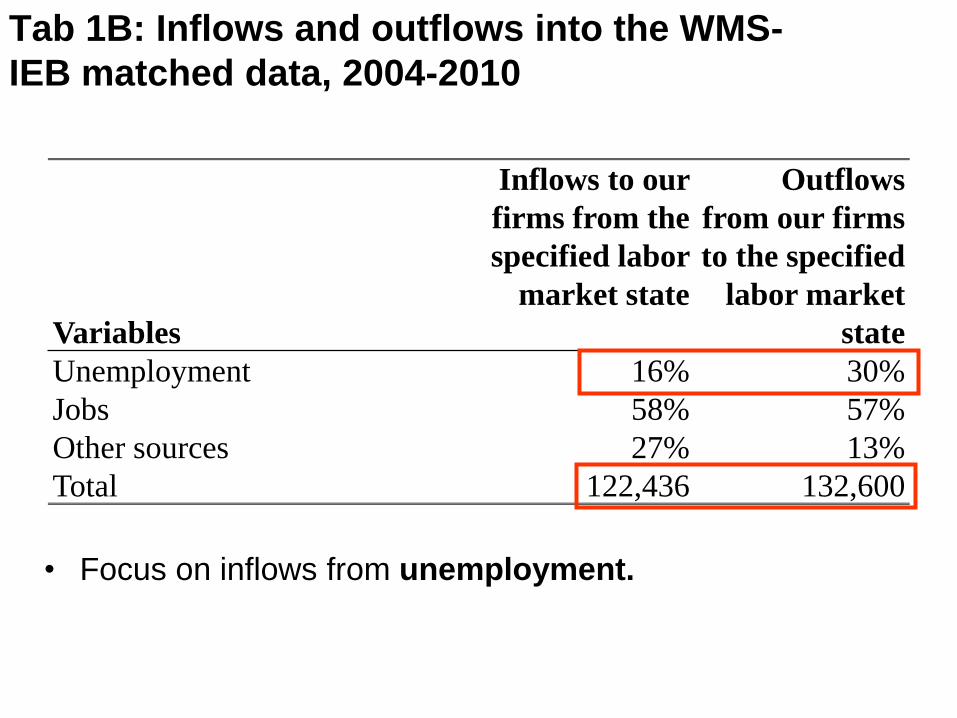
Variables
Inflows to our
firms from the
specified labor
market state
Outflows
from our firms
to the specified
labor market
state
Unemployment 16% 30%
Jobs 58% 57%
Other sources 27% 13%
Total 122,436 132,600
Tab 1B: Inflows and outflows into the WMS-
IEB matched data, 2004-2010
• Focus on inflows from unemployment.
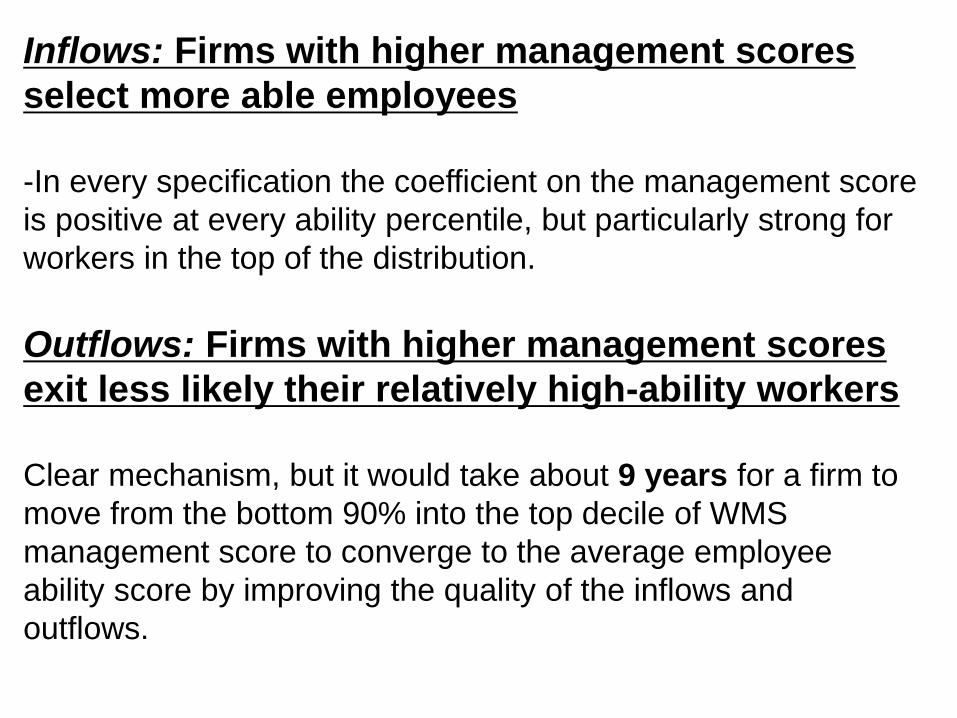
Inflows: Firms with higher management scores
select more able employees
-In every specification the coefficient on the management score
is positive at every ability percentile, but particularly strong for
workers in the top of the distribution.
Outflows: Firms with higher management scores
exit less likely their relatively high-ability workers
Clear mechanism, but it would take about 9 years for a firm to
move from the bottom 90% into the top decile of WMS
management score to converge to the average employee
ability score by improving the quality of the inflows and
outflows.
Conclusions I
• We combine:
– WMS data on management & firm performance
– IEB data on near population of German workers
1975-2011. Use Abowd et al (1999) approach to
recover employee fixed effects (“ability”) & firm FE
• We find: Firms with high WMS management scores
have more talented managers & workers (observable &
unobservable human capital). Also higher firm wage FE
– Partly via selection of employee inflows & outflows
Conclusions II
• Also find: ~ ¼ to ½ of firm TFP-WMS management
practices correlation is because of human capital (esp.
managerial talent)
– Consistent with important role for practices over and
above human capital
• Managerial human capital is important for the ability to
sustain successful mangement practices
• We found an effect of „corporate culture“, because there
is information in the management practice scores that
predicts productivity