Embed Size (px)
Citation preview
American Economic Association
Entry, Exit, Growth, and Innovation over the Product Life CycleAuthor(s): Steven KlepperReviewed work(s):Source: The American Economic Review, Vol. 86, No. 3 (Jun., 1996), pp. 562-583Published by: American Economic AssociationStable URL: http://www.jstor.org/stable/2118212 .Accessed: 09/10/2012 08:02
Your use of the JSTOR archive indicates your acceptance of the Terms & Conditions of Use, available at .http://www.jstor.org/page/info/about/policies/terms.jsp
.JSTOR is a not-for-profit service that helps scholars, researchers, and students discover, use, and build upon a wide range ofcontent in a trusted digital archive. We use information technology and tools to increase productivity and facilitate new formsof scholarship. For more information about JSTOR, please contact [email protected].
.
American Economic Association is collaborating with JSTOR to digitize, preserve and extend access to TheAmerican Economic Review.
http://www.jstor.org
Entry, Exit, Growth, and Innovation over the Product Life Cycle
By STEVEN KLEPPER *
Regularities concerning how entry, exit, market structure, and innovation vary from the birth of technologically progressive industries through maturity are summarized. A model emphasizing differences infirm innovative capabilities and the importance of firm size in appropriating the returns from innovation is de- veloped to explain the regularities. The model also explains regularities regard- ing the relationship within industries betweenfirm size andfirm innovative effort, innovative productivity, cost, and profitability. It predicts that over time firms devote more effort to process innovation but the number of firms and the rate and diversity of product innovation eventually wither. (JEL L10)
A similar view has emerged from a number of disciplinary perspectives about how tech- nologically progressive industries evolve from birth through maturity.' When industries are new, there is a lot of entry, firns offer many different versions of the industry's product, the rate of product innovation is high, and mar- ket shares change rapidly. Despite continued market growth, subsequently entry slows, exit overtakes entry and there is a shakeout in the number of producers, the rate of product in- novation and the diversity of competing ver- sions of the product decline, increasing effort is devoted to improving the production pro- cess, and market shares stabilize. In some
quarters, this evolutionary pattern has come to be known as the product life cycle (PLC).
While numerous authors have contributed to this description, perhaps the most influential have been William J. Abernathy and James M. Utterback.2 Building on the work of Dennis C. Mueller and John E. Tilton (1969) and using the automobile industry as a leading case, they depict the PLC as driven by the way new technologies evolve. They stress that when a product is introduced, there is considerable un- certainty about user preferences (even among the users themselves) and the technological means of satisfying them. As a result, many firms producing different variants of the prod- uct enter the market and competition focuses on product innovation. As users experiment with the alternative versions of the product and producers learn about how to improve the product, opportunities to improve the product are depleted and a defacto product standard, dubbed a dominant design, emerges. Produc-' ers who are unable to produce efficiently the dominant design exit, contributing to a shake- out in the number of producers. The depletion of opportunities to improve the product cou- pled with locked-in of the dominant design leads to a decrease in product innovation. This in turn reduces producers' fears that invest- ments in the production process will be ren- dered obsolete by technological change in the
* Department of Social and Decision Sciences, Car- negie Mellon University, Pittsburgh, PA 15213. I thank Wesley Cohen, Mark Kamlet, Jon Leland, John Miller, Richard Nelson, Ken Simons, Peter Swann, Bill Williams, and participants at the 1992 Conference of the Interna- tional Joseph A. Schumpeter Society, the 1992 Conference on Market Processes and the Dynamics of Corporate Net- works, Wissenschaftszentrum Berlin, and the Industrial Organization Seminars at the University of Maryland, Berkeley, Penn State, and the London School of Econom- ics for helpful comments. The paper was greatly improved by the unstinting suggestions of two anonymous referees and the co-editor, Preston McAfee.
'See, for example, Oliver E. Williamson's (1975) ac- count of how economists depict the evolution of new in- dustries, Kim B. Clark's (1985) description of how technology and internal firm organization change over the course of industry evolution, and how a business consult- ant, Philip G. Drew (1987), describes the way business schools depict the evolution of industries.
2 See in particular James M. Utterback and William J. Abernathy (1975) and Abernathy and Utterback (1978).
562
VOL. 86 NO. 3 KLEPPER: INNOVATION OVER THE PRODUCT LIFE CYCLE 563
product. Consequently, they increase their at- tention to the production process and invest more in capital-intensive methods of produc- tion, which reinforces the shakeout of produc- ers by increasing the minimum efficient size firm.
While this view has helped to popularize the PLC, it rests critically on the notion of a dom- inant design, an imprecise concept that does not appear to apply to all new products, es- pecially ones for which buyer tastes are di- verse (Michael E. Porter, 1983). Furthermore, it incorporates some questionable assumptions about technological change. It assumes that product and process innovation are inextrica- bly linked and that firms will not attend to the production process until product innovation has slowed sufficiently. Yet the history of the automobile industry and others, such as tires and antibiotics, indicates that great improve- ments were made in the production process well before the emergence of any kind of dom- inant design (S. Klepper and Kenneth L. Simons, 1993). Indeed, many of these im- provements were based on human and physi- cal investments that were not rendered obsolete by subsequent major product inno- vations. The dominant-design view also min- imizes the influence of industry demand on incentives to innovate, attributing the slow- down in product innovation and rise in process innovation entirely to the depletion of oppor- tunities for product innovation and the emer- gence of a dominant design. While the relative importance of demand and supply factors has been hotly debated (David C. Mowery and Nathan Rosenberg, 1982), it has never been questioned that demand factors play an im- portant role in shaping the rate and direction of technological change.
This paper proposes a new explanation for the PLC. Empirical regularities characterizing the PLC are first identified. A formal model is then constructed to explain the regularities. The model builds on recent theories of indus- try evolution (Richard R. Nelson and Sidney G. Winter, 1982; Boyan Jovanovic, 1982) and efforts to model the link between market struc- ture and R&D (Nelson and Winter, 1978; Partha Dasgupta and Joseph Stiglitz, 1980; Therese M. Flaherty, 1980). The model fo- cuses on the role of firm innovative capabili-
ties and size in conditioning firm R&D spending, innovation, and market structure. Following various theoretical models of asym- metric industry structure (Flaherty; Avner Shaked and John Sutton, 1987), it incorpo- rates the notion that the value of a unit cost reduction achieved through innovation is pro- portional to the level of output produced by the firm. Coupled with convex adjustment costs, this imparts an advantage to the earliest entrants which eventually causes a cessation in entry and a shakeout in the number of pro- ducers. It also provides firms with a greater incentive to engage in process innovation as they grow, which leads to an increase over time in their efforts to improve the production process. Firns are also assumed to have different capabilities that lead them to pursue different types of product innovations, a theme promoted by Nelson (1981) and used by Wesley M. Cohen and Klepper (1992) to explain differ- ences within industries in firm R&D intensities. This provides the basis for explaining the decline in product innovation that occurs over time, link- ing it to the decline in the number of competitors brought about by the shakeout of producers. It is shown that the model can also explain various cross-sectional regularities that have accumu- lated concerning the relationship within indus- tries between firm size and firm R&D effort, R&D productivity, cost, and profitability. Thus, the model provides a unified explanation for a wide range of temporal and cross-sectional reg- ularities concerning industry evolution and finn behavior.
The paper is organized as follows. In Sec- tion I, the prominent features of the PLC are summarized. In Section II, the model is spec- ified. In Section III, preliminary implications of the model are developed. In Section IV, the model is shown to explain all the prominent features of the PLC. In Section V, the model is used to explain various cross-sectional reg- ularities between firm size, R&D, and firm performance. In Section VI, the implications of the model are discussed and extensions of the model are considered.
I. The Nature of the Product Life Cycle
The depiction of industry evolution con- veyed in the PLC is based upon case studies
564 THE AMERICAN ECONOMIC REVIEW JUNE 1996
and quantitative analyses of the evolution of new industries. In this section, six regularities concerning how entry, exit, market structure, and technological change vary from the birth of technologically progressive industries through maturity are summarized. While every itidustry has its idiosyncrasies, these regularities provide a composite picture of the evolution of techno- logically progressive industries.
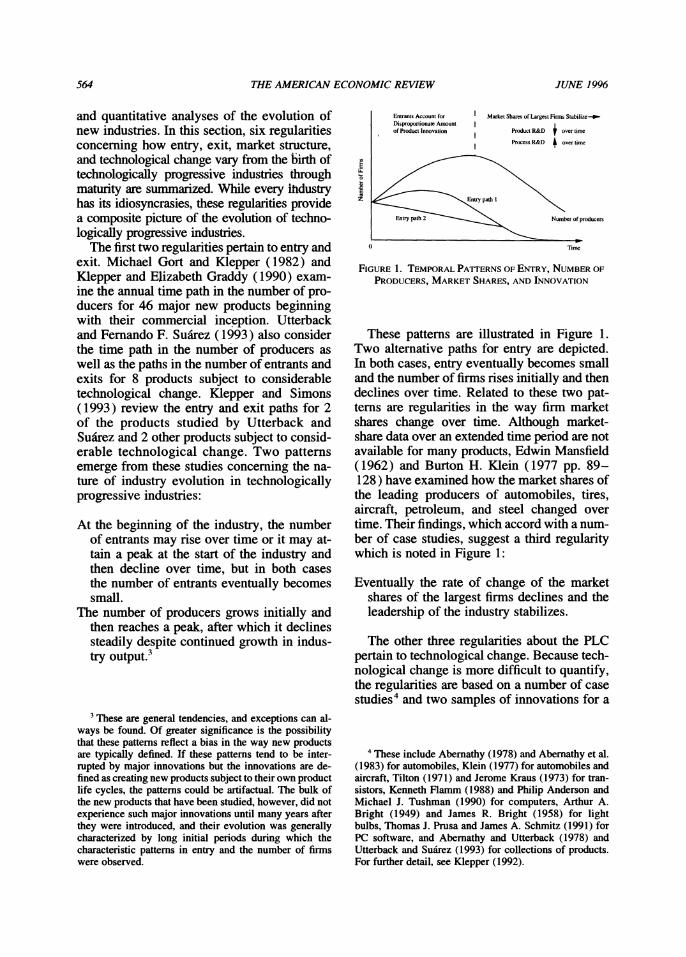
The first two regularities pertain to entry and exit. Michael Gort and Klepper (1982) and Klepper and Elizabeth Graddy (1990) exam- ine the annual time path in the number of pro- ducers for 46 major new products beginning with their commercial inception. Utterback and Fernando F. Suarez (1993) also consider the time path in the number of producers as well as the paths in the number of entrants and exits for 8 products subject to considerable technological change. Klepper and Simons (1993) review the entry and exit paths for 2 of the products studied by Utterback and Suarez and 2 other products subject to consid- erable technological change. Two patterns emerge from these studies concerning the na- ture of industry evolution in technologically progressive industries:
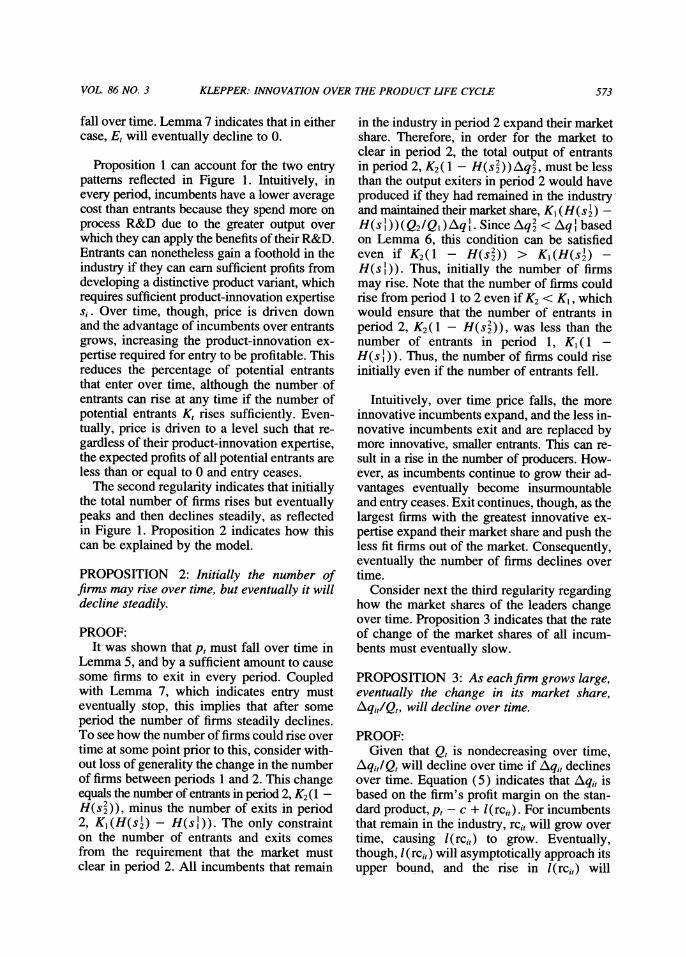
At the beginning of the industry, the number of entrants may rise over time or it may at- tain a peak at the start of the industry and then decline over time, but in both cases the number of entrants eventually becomes small.
The number of producers grows initially and then reaches a peak, after which it declines steadily despite continued growth in indus- try output.3
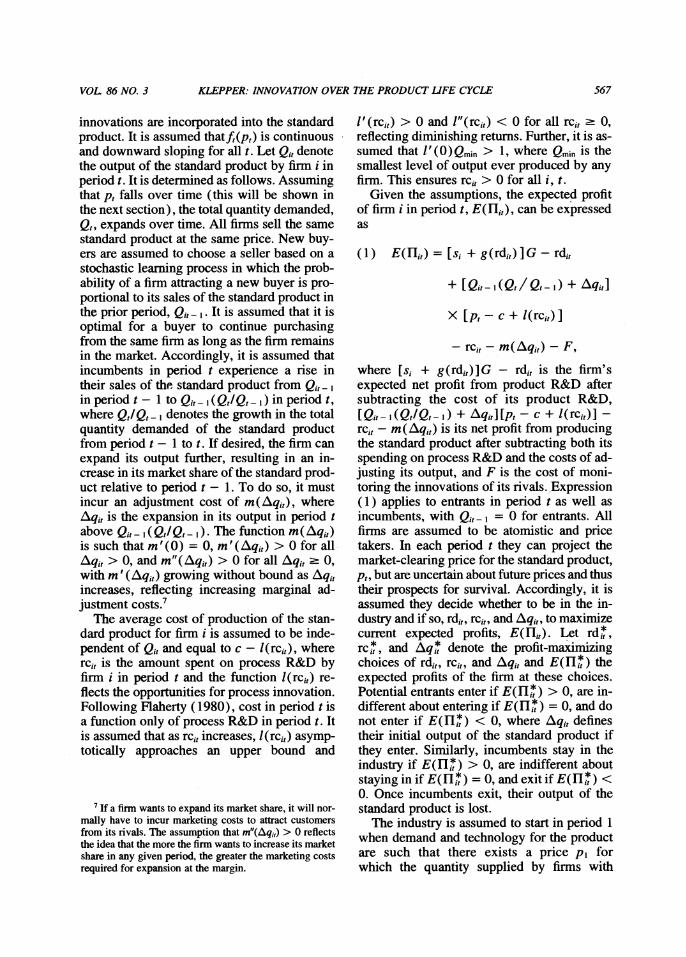
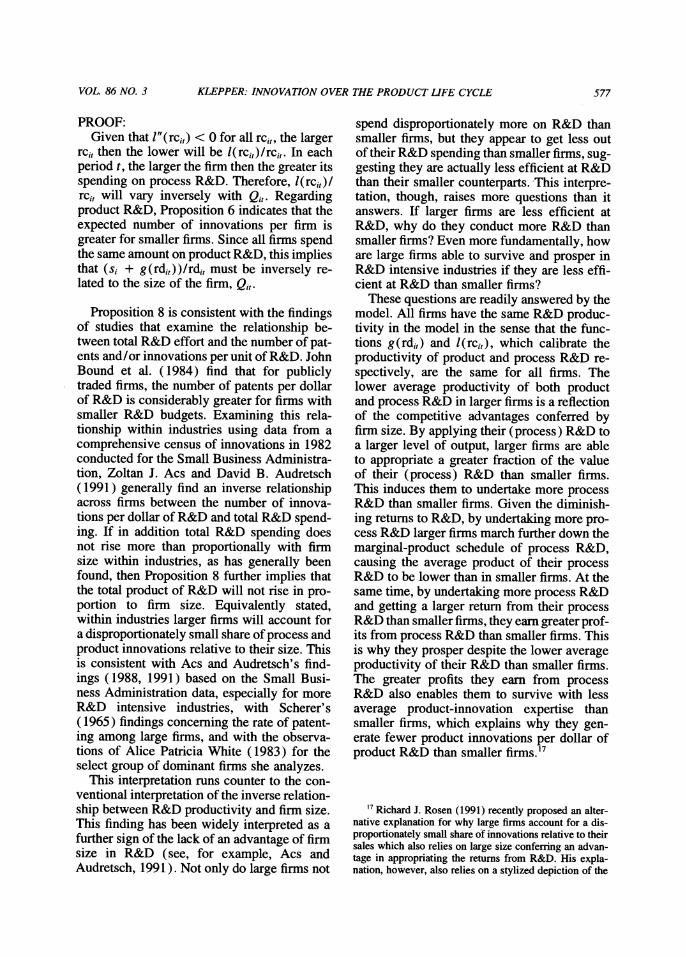
Entrants Account for Market Shares of Largest Fitms Stabilize--_ Disproportionate Amount of Product Innovation Product R&D overtime
Process R&D over timc
E Rut
= > pathI\
Entry path 2 Number of producers
0 Time
FIGURE 1. TEMPORAL PATTERNS OF ENTRY, NUMBER OF
PRODUCERS, MARKET SHARES, AND INNOVATION
These patterns are illustrated in Figure 1. Two alternative paths for entry are depicted. In both cases, entry eventually becomes small and the number of firms rises initially and then declines over time. Related to these two pat- terns are regularities in the way firm market shares change over time. Although market- share data over an extended time period are not available for many products, Edwin Mansfield (1962) and Burton H. Klein (1977 pp. 89- 128) have examined how the market shares of the leading producers of automobiles, tires, aircraft, petroleum, and steel changed over time. Their findings, which accord with a num- ber of case studies, suggest a third regularity which is noted in Figure 1:
Eventually the rate of change of the market shares of the largest firms declines and the leadership of the industry stabilizes.
The other three regularities about the PLC pertain to technological change. Because tech- nological change is more difficult to quantify, the regularities are based on a number of case studies4 and two samples of innovations for a
'These are general tendencies, and exceptions can al- ways be found. Of greater significance is the possibility that these patterns reflect a bias in the way new products are typically defined. If these patterns tend to be inter- rupted by major innovations but the innovations are de- fined as creating new products subject to their own product life cycles, the patterns could be artifactual. The bulk of the new products that have been studied, however, did not experience such major innovations until many years after they were introduced, and their evolution was generally characterized by long initial periods during which the characteristic patterns in entry and the number of firms were observed.
'These include Abernathy (1978) and Abernathy et al. (1983) for automobiles, Klein (1977) for automobiles and aircraft, Tilton (1971) and Jerome Kraus (1973) for tran- sistors, Kenneth Flamm (1988) and Philip Anderson and Michael J. Tushman (1990) for computers, Arthur A. Bright (1949) and James R. Bright (1958) for light bulbs, Thomas J. Prusa and James A. Schmitz (1991) for PC software, and Abernathy and Utterback (1978) and Utterback and Suarez (1993) for collections of products. For further detail, see Klepper (1992).
VOL. 86 NO. 3 KLEPPER: INNOVATION OVER THE PRODUCT LIFE CYCLE 565
limited number of industries in the United States (Utterback and Abernathy, 1975) and the United Kingdom (C. De Bresson and J. Townsend, 1981). These studies suggest that for industries with rich opportunities for both product and process R&D, three patterns in product and process innovation can be identi- fied:5
The diversity of competing versions of the product and the number of major product innovations tend to reach a peak during the growth in the number of producers and then fall over time.
Over time, producers devote increasing effort to process relative to product innovation.
During the period of growth in the number of producers, the most recent entrants account for a disproportionate share of product innovations.
These three regularities are also noted in Figure 1. Together, the six regularities laid out above and summarized in Figure 1 provide the focus for the theoretical analysis of the paper.
II. The Model
The model depicts the evolution from birth through maturity of an industry with rich op-
portunities for product and process innovation. Two aspects of innovation are featured. First, following Jacob Schmookler (1966) and a number of theoretical models (for example, Dasgupta and Stiglitz, 1980; Shaked and Sutton, 1987), the demand for a firm's product is as- sumed to condition its incentive to innovate. This is assumed to be manifested differently for process and product innovation. Process innovation is principally designed to lower a firm's average cost of production. Since the value of a reduction in average cost is propor- tional to the total output of the firm, it is as- sumed that the incentive for process innovation is conditioned by the total quantity demanded of the firm's product. Product innovations, in contrast, are often designed to attract new buy- ers for a product. Accordingly, it is assumed that the incentive for product innovation is conditioned by the demand of new buyers. Second, firms are assumed to be randomly en- dowed with distinctive capabilities which in- fluence the kinds of innovations they develop. The idea of distinctive firm competencies lies at the heatt of the business-strategy literature (Porter, 1980) and its relevance for innovation appears prominently in many industry case studies.6 It is assumed that these differences in capabilities manifest themselves principally in product innovations, where firms often spe- cialize in innovations that service distinctive types of users (Eric von Hippel, 1988). In contrast, process innovations tend to be incre- mental and based on information that firms commonly generate through production (com- pare Bright, 1958; Samuel Hollander, 1965).
The model is stylized to highlight the two featured aspects of innovation. It has the fol- lowing structure. Time is discrete. In each period, incumbent firms decide whether to
' The three patterns are ascribed only to products with rich opportunities for both product and process innovation because the bulk of the products for which patterns in innovation have been studied are, not surprisingly, ones with such characteristics. Indeed, Abernathy (1978 p. 84), K. Pavitt and R. Rothwell (1976), and Porter (1983 pp. 23-24), among others, contend that products without rich opportunities for both product and process innovation do not follow the prototypical PLC. Examples cited as ex- ceptions to the PLC include synthetic fibers and plastics, which are claimed to be relatively homogeneous and pri- marily subject to process but not product innovation, and heavy electrical equipment, which is produced in small batches and is claimed to be subject primarily to product and not process innovation. While no evidence is pre- sented to buttress these claims and not all observers sub- scribe to them (for example, see David A. Hounshell [1988] regarding synthetic fibers), it is important to rec- ognize that the evidence regarding innovation during the PLC is primarily based on products with rich opportunities for both product and process innovation. This is reflected in the model, which presupposes that the joint nature of product and process innovation drives the PLC.
6 For example, a number of studies emphasize how sig- nificant innovations can be traced back to expertise ac- quired fortuitously. This is featured in Hugh G. J. Aitken's (1985) analysis of early radio innovations, Flamm's (1988) discussion of the influence of government spon- sored cryptography efforts during World War II on sub- sequent innovation by computer firms, and Klein's (1977 pp. 89-109) discussion of the skills brought into the automobile industry at the 'turn of the century by entre- preneurs with experience in mass production and inter- changeable parts manufacture.
566 THE AMERICAN ECONOMIC REVIEW JUNE 1996
remain in the industry and a limited number of potential entrants decide whether to enter. All firms produce a standard product. They decide how much process R&D to perform, which de- termines the average cost of the standard prod- uct. They also decide how much product R&D to perform. Firms randomly differ in their product innovation expertise, which influences their success at product R&D. In each period, successful product innovators develop a dis- tinctive product innovation which they com- bine with the standard product to market a unique, distinctive product. Distinctive prod- ucts appeal to all buyers, but only new buyers pay the premiums for them, with each distinc- tive product sold to a different class of new buyers. All firms monitor the product inno- vations of their rivals. This enables them to imitate all product innovations one period after they are introduced and incorporate them into the standard product at no additional produc- tion cost. When the last period's product in- novations are incorporated into the standard product, buyers of the distinctive products be- come buyers of the standard product and the demand for the standard product by all other buyers increases, causing the demand curve for the standard product to shift to the right. Producers share in the expansion in demand for the standard product in proportion to their prior output and decide how much further to expand their output subject to a cost of ad- justment. All decisions are made to maximize current profits, firms are price takers, and in each period the price of the standard product clears the market.
The model is formally specified as follows. In each period t, there are K, potential entrants. As firms enter and others randomly develop the innovative capabilities required to enter, K, changes. A priori no restrictions are placed on whether K, rises or falls over time; this may differ across industries and also within indus- tries over time. Each potential entrant is ran- domly endowed with innovative expertise which it cannot modify over time. Let si de- note the innovation expertise of firm i, which it knows prior to entry, and smax the maximum possible innovation expertise. To simplify the dynamics of the model, it is assumed that in each period there are one or more potential entrants with innovative expertise Smax and the
cumulative distribution of innovative expertise is the same for the potential entrants in each period. This distribution is denoted as H(s), where H(s) is assumed to be continuous for all s < smax and H(Smax) = 1 by definition.
The firm's innovative expertise influences its success at product R&D. The probability of firm i developing a product innovation in pe- riod t is si + g (rdi,), where rdi, is its spending on product R&D and the function g(rdi,) re- flects the opportunities for product innovation. Each successful innovator adds its innovation to the standard product and markets a distinc- tive variant of the industry's product, which it sells at a price exceeding the price of the stan- dard product, reflecting the value of its inno- vation. Distinctive variants are assumed to appeal to all buyers but only new buyers have a positive demand for them at the prices charged, with each distinctive variant pur- chased by a different class of new buyers. Af- ter one period, all product innovations are copied and incorporated into the standard product, so successful innovators have a one- period monopoly over their distinctive variants. Let G denote the one-period gross monopoly profit (before subtracting the amount spent on product R&D) earned by each seller of a dis- tinctive variant. It is assumed that g' (rdi) > 0 and g"(rdit) < 0 for all rdit 2 0, reflecting diminishing returns, and that g'(0)G > 1, which ensures rdit > 0 for all i, t. In order to be able to imitate costlessly the innovations of its rivals, which is required to market a dis- tinctive product variant and also the standard product, firms monitor the innovations of their rivals at a cost of F per period. Thus, if a firm engaged in only product innovation and did not produce the standard product, its expected profits in period t would be [si + g(rdit)] G -
rdit - F. To simplify the model, it is assumed that F > [si + g(rdit)] G - rdit for all rdit. This ensures that in order to have nonnegative ex- pected profits, all firms must produce the stan- dard product.
Let Qt = f(pt) denote the total market de- mand for the standard product in period t, where Qt is the quantity demanded, Pt is the price of the standard product, andft(pt) is the market demand schedule for the standard product in period t. Over time, f (pt) shifts to the right at every price as last period's product
VOL 86 NO. 3 KLEPPER: INNOVATION OVER THE PRODUCT LIFE CYCLE 567
innovations are incorporated into the standard product. It is assumed thatfi(p,) is continuous and downward sloping for all t. Let Qit denote the output of the standard product by firm i in period t. It is determined as follows. Assuming that Pt falls over time (this will be shown in the next section), the total quantity demanded, Qt, expands over time. All firms sell the same standard product at the same price. New buy- ers are assumed to choose a seller based on a stochastic learning process in which the prob- ability of a firm attracting a new buyer is pro- portional to its sales of the standard product in the prior period, Qit - I. It is assumed that it is optimal for a buyer to continue purchasing from the same firm as long as the firm remains in the market. Accordingly, it is assumed that incumbents in period t experience a rise in their sales of the standard product from Qit- I in period t - Ito Qit- I (Qt/Qt- I ) in period t, where Qt/Qt - l denotes the growth in the total quantity demanded of the standard product from period t - 1 to t. If desired, the firm can expand its output further, resulting in an in- crease in its market share of the standard prod- uct relative to period t - 1. To do so, it must incur an adjustment cost of m(Aqit), where Aqit is the expansion in its output in period t above Qit- I (Qt/Qt- ). The function m(Lqit) is such that m'(0) = 0, m'(Aqit) > 0 for all zqit > 0, and m"(Aqit) > 0 for all Aqit ' 0, with m' (Aqit) growing without bound as Aqit increases, reflecting increasing marginal ad- justment costs.7
The average cost of production of the stan- dard product for firm i is assumed to be inde- pendent of Qit and equal to c - l(rcit), where rcit is the amount spent on process R&D by firm i in period t and the function l(rcit) re- flects the opportunities for process innovation. Following Flaherty (1980), cost in period t is a function only of process R&D in period t. It is assumed that as rcit increases, l(rcit) asymp- totically approaches an upper bound and
l'(rcit) > 0 and l"(rcit) < 0 for all rcit 2 0, reflecting diminishing returns. Further, it is as- sumed that 1'(0)QQm1,i > 1, where Qmnin is the smallest level of output ever produced by any firm. This ensures rcit > 0 for all i, t.
Given the assumptions, the expected profit of firm i in period t, E(IIit), can be expressed as
(1) E(Hit) = [si + g(rdit)]G - rdit
+ [Qit_ I (Qt/ Qt- l) + Aqit]
X [Pt - c + I(rcit)]
- rcit - m(Aqit) - F,
where [si + g(rdit)]G - rdit is the firm's expected net profit from product R&D after subtracting the cost of its product R&D, I[Qit-l(QtlQt_l + Aqit [pt - c + l(rcit)I - rcit - m(Aqit) is its net profit from producing the standard product after subtracting both its spending on process R&D and the costs of ad- justing its output, and F is the cost of moni- toring the innovations of its rivals. Expression (1) applies to entrants in period t as well as incumbents, with Qit - = 0 for entrants. All firms are assumed to be atomistic and price takers. In each period t they can project the market-clearing price for the standard product, Pt, but are uncertain about future prices and thus their prospects for survival. Accordingly, it is assumed they decide whether to be in the in- dustry and if so, rdit, rcit, and Aqit, to maximize current expected profits, E(nit). Let rdi,t, rc *, and Aq * denote the profit-maximizing choices of rdit, rci,, and \qit and E(HI*t) the expected profits of the firm at these choices. Potential entrants enter if E(n*) > 0, are in- different about entering if E(HI*t ) = 0, and do not enter if E(HI*) < 0, where Aqit defines their initial output of the standard product if they enter. Similarly, incumbents stay in the industry if E(Hll*) > 0, are indifferent about staying in if E(HI) =0, and exit if E(HI*) < 0. Once incumbents exit, their output of the standard product is lost.
The industry is assumed to start in period 1 when demand and technology for the product are such that there exists a price pi for which the quantity supplied by firms with
7 If a firm wants to expand its market share, it will nor- mally have to incur marketing costs to attract customers from its rivals. The assumption that m"(Aqi,) > 0 reflects the idea that the more the finn wants to increase its market share in any given period, the greater the marketing costs required for expansion at the margin.
568 THE AMERICAN ECONOMIC REVIEW JUNE 1996
nonnegative expected profits equals the quan- tity demanded, Ql, where Q, > 0. Similarly, in every subsequent period p, is assumed to clear the market. This requires that the quan- tity demanded in period t, Q, = f,(p,), equals the quantity supplied by producers in period t taking p, as given:
(2) Q, = , {Qit-I(Qt/Qt-1) + /qit}, i,t
where the index i, t of the summation denotes that the summation is over firms i in the market in period t. In terms of the actual mechanism governing the change in price from period t - I to t, the dynamics of the model are simplified by assuming that for all incumbent firms in period t, dE(H1*)/dp, > 0 for all prices pt within a broad neighborhood of pt 8 with the equilibrium price constrained to lie in this broad neighborhood. The existence of such a price in each period satisfying equation (2) is demonstrated in the next section. As will be shown, market clearing is achieved through the effects of pt on Qt, Aqit, and on entry and exit in period t.9
The model is stylized to keep it tractable and to highlight the two key features of innovation that underlie it. Product innovations are as- sumed to be introduced into distinctive ver- sions of the product and then incorporated into the products of all firms, which conforms to the way many products evolve over time.'0 This preserves the notion of an industry in which all firms produce the same product while allowing for (limited) product differ- entiation. Each product innovation is assumed to be sold to a different class of new buyers to reflect the idea that firms have different kinds of innovative expertise that lead them to ser- vice different groups of buyers. Coupled with the assumption that product innovations do not affect the demand for the standard product, this ensures that the incentive to engage in product innovation is determined solely by the demand of new buyers." Differences in firm innovative abilities are structured so that they do not affect the firm's output of the standard product nor the amount spent on product or process R&D. Consequently, the firm's output of the standard product is related to the firm's R&D spending only through its effects on the returns from process R&D, which highlights the influence of the demand for the standard product on process R&D. Opportunities for in- novation, as reflected in the functions g(rdi,) and l(rci,), are assumed constant to abstract from the effects of changing technological op- portunities on the firm's R&D spending. All decisions are based on current expected profits and process innovations are not cumulative to simplify the dynamics of the model and to reflect the limited horizons of firms in new in- dustries. Many of these assumptions are re- considered in the conclusion, where it is argued that the spirit and principal implica- tions of the model would not change if the assumptions were relaxed.
8 This condition requires that in each period t, the lower p, then the lower the maximum possible expected profits of each firm, assuming the firm can sell as much of the standard product as it wants at p,. The price of the standard product affects E(r,*) in two ways: through its effect on the profit per unit of the standard product, p, - c + l(rci,), and through its effect on each firm's output of the standard product via the total quantity demanded of the standard product, Qt. These two effects work in opposite direc- tions-the lower pt then the lower the firm's profit per unit on the standard product, ceteris paribus, but the greater the firm's total output of the standard product, cet- eris paribus. Given that l(rcj,) is bounded, at sufficiently low prices E(rlH*) must be less than zero for all firms, hence at sufficiently low prices the first effect must dom- inate the second and dE(rI ,*)dpt > 0. If dft(pt)ldpt = 0 at the relevant prices (that is, the price elasticity of demand equaled zero), then pt would have no effect on the firm's output of the standard p,roduct and it is easy to see from equation (1) that dE(Hlit)ldpt > 0 for all prices. More gen- erally, if suitable constraints are placed on the function dft(pt)ldpt at the relevant prices then dE(rH*)/dpt > 0 for all prices within a broad neighborhood of pt
9 Note that if exit occurs in period t then 1j, Qit- I < li, t- I Qit-I = Q,_ ,, where the index i, t - 1 denotes summation over firms in the market in period t - 1. As developed in the next section, exit will be necessary for the market to clear in each period.
'? For example, in automobiles innovations such as the electric starter and the inexpensive closed body were in- troduced into distinctive models and then copied widely by all manufacturers.
" This abstracts from strategic incentives to innovate associated with the preemption of rivals (Richard J. Gilbert and David M. G. Newbery, 1982) and cannibalism of prior innovations (Jennifer Reinganum, 1983, 1985).
VOL 86 NO. 3 KLEPPER: INNOVATION OVER THE PRODUCT LIFE CYCLE 569
III. Preliminary Results
In order to facilitate the proof of later re- sults, a series of intermediate implications of the model are developed as lemmas. In deriv- ing these lemmas, it is assumed that there ex- ists a price p, in each period that clears the market given the choices firms make about en- try, exit, rdi,, rci,, and Aqi, taking p, as given. The existence of such a path for price is estab- lished at the end of this section.
The first results pertain to firms in the mar- ket in period t, including firms that entered the market during period t as well as earlier en- trants. Differentiating (1) with respect to rdi,, rci,, and Aqi, establishes the following first- order conditions for an interior maximum for each firm i in the market in period t:
(3) g'(rd1)G = 1
(4) [Qit- (Qt/Qt-i) + Aq*]l'(rc*) = 1
(5) m'(Aq*) = pt
- c + l(rc *),
where optimal values are denoted by an aster- isk. Furthermore, for a firm to be in the market in period t, its expected profits in period t must be nonnegative. Given the assumption of F > [si + g(rdi,)]G - rdi, for all rdi,, a necessary condition for E(nit) 2 0 is that for each firm i in the market in period t:
(6) ~Pt - c + l(rcit)>
Assuming -1"(rc*)[Qit-1(Qt/Qt-1)
+ Aq*] X m(Aq*) > lP(rc*)2 to ensure that the joint solution of (4) and (5) for rc1, and Aqi, is a max- imum, the solutions to equations (3)- (6) will satisfy the second-order conditions. Conse- quently, for each firm i and period t, rd * > 0, rc * > 0, and Aq * > 0, with these choices satisfying equations (3) - (6). Thus, all firms in the market in period t perform product and process R&D and increase their market share of the standard product relative to period t - 1.
Conditions (3) -(6) imply two results which reflect the simplified nature of the model.
LEMMA 1: For all i and t, rdi, = rd *, where rd * satisfies g'(rd *)G = 1.
PROOF: The profit-maximizing value of rdi, is de-
fined by equation (3), which is the same for all firms and does not change over time. Con- sequently, all firms spend the same amount rd * on product R&D, where rd * satisfies (3).
Analogous to E(fl *), letVi =V Qit - (Q Qt-1) + Aq*][p, - c + l(rc*)] - rci* m( Aq*) denote the firm's (incremental) profit from the standard product. Lemma 1 im- plies that the firm's incremental profit earned from product R&D in each period, [si + g (rdi,) ] G - rdi,, remains constant over time. Consequently, changes in the firm's expected profits over time arise only from changes in V i*. Accordingly, most of the analysis of the model focuses on the standard product.
The second result indicates that in each pe- riod t, firms in each entry cohort make the same choices for rci, and Aqi, and have the same output and incremental profits from the standard product. Letting the values of these variables for entry cohort k in period t be de- noted as rc', Aq k, Q,k, and V k, the following result is established.
LEMMA 2: For allfirms i that entered in pe- riod k and are still in the market in period t >
k, rci, = rck, Aqit* = AqkI Qi = Qk, and V = V t t
PROOF: Since Qi - I = 0 for entrants in period t,
equations (4) and (5) imply rc * and Aq , hence Qit and V i*, must be the same for all entrants in t. It then follows from (4) and (5) that rc *, Aq * , Qit, and V * must be the same for these firms in every period they are in the market.
Lemmas 1 and 2 imply that in each period t the expected profits of firms that entered in the same period differ only according to their product-iniovation expertise si. Consequently, in each period the distribution of E(fli,) across firms in the same entry cohort will be the same as the distribution of si for these firms.
The firm's output in the prior period, Qit - I, will determine its choice of rci, and Aqi, and hence Vit. This is reflected in Lemma 3.
570 THE AMERICAN ECONOMIC REVIEW JUNE 1996
LEMMA 3: For each firm i in the market in period t, the larger Qi -, then the larger rci,, Aqi,, and Vi.
PROOF: Differentiating (3) -(5) with respect to
Qit- 1 and rearranging yields
drc * / dQi,_ -
= g"(rd *) Gm"(A\q
*)I P(rc*)
x (Qt / Qt _) / D
dzAq*ldQi, _ I
= g"(rd )Gl'(rci*)2
X (Qt / Qt- ) / D
d V i*/dQit- I = a3V i* / a3Qit- I
= [p, - c + l(rci*t) ] (Qt / Qt- 1),
where D is the determinant of the matrix of second partials of E(ni,) with respect to rdi,, rci,, and Aqi, evaluated at rd *, rc *, and Aq *. Since D < 0 based on the second-order conditions and p, - c + I(rc*) > 0 based on (6), each of these derivatives is positive. Therefore, the larger Qit - I then the greater rci,, Aqi,, and Vit.
Since Aq * is determined by Qit- I and Aq* > 0 for all i, t, Lemmas 2 and 3 imply that in each period t the age of the firm fully determines rci,, Aqi,, Vi,, and Qit, with each greater the older the firm. Coupled with Lemma 1, this implies that in each period t differences across firms in E(ni,) are fully de- termined by two factors: the age of the firm and its product innovation expertise si.
Lemma 1 establishes the time path of rdi, for each firm while Lemmas 2 and 3 establish how rci,, Aqi,, Qit, and Vit vary across firms in each period. It is also possible to investigate how rci,, Aqi,, Qit, and Vit change over time for each firm. For incumbents, Qit and rci, change over time as follows.
LEMMA 4: For each firm i in the market in periods t - 1 and t, Qit > Qit- and rci, > rci, -l.
PROOF: Since Aqi, > 0 for all i, t, it follows that
Qit > Qit - I for all i, t. Rewriting equation (4) as Qi,l' (rc * ) = 1, it follows from Qit > Qit - and l"(rci,) < 0 for all rci, that rci, > rci,t - .
The time paths for Aqi, and Vit for incum- bents cannot be so easily characterized. Equa- tion (5) indicates that for each incumbent Aqi, will change over time according to the time path of p, - c + I(rci,), the firm's profit per unit of the standard product. The change in Vit over time will also depend on the time path in Pt - c + I(rci,). Lemma 4 implies that l(rci,) rises over time, but Lemma 5 below indicates p, falls over time. Consequently, without fur- ther assumptions it cannot be determined whether Aqi, and Vit generally rise or fall over time for incumbents.
That pt must fall over time can be easily established.
LEMMA 5: For each period t, pt < p.- I
PROOF: Recall that it was assumed that for each in-
cumbent firm i in period t, dE(n*)Idp, > O for all prices p, within a broad neighborhood of pt - I, with the equilibrium price in period t lying in this neighborhood. Lemma 5 is estab- lished by showing that for all prices p, 2 pt -I in this neighborhood, the market cannot clear in period t. Suppose p, = pt - I. Then, Qit must exceed Qi - I for all producers in period t - 1. This implies E(n*) > E(n1*) 20 for all producers in period t - 1 and hence that no incumbent would exit in period t. The same condition must be true for all prices pt > p.- I within a broad neighborhood of pt - I given that dE(n* )Idp, > 0 for all such prices. But every firm that remains in the industry will expand its market share, hence the market cannot clear if all firms remain in the industry. Therefore, pt must be less than pt - .
In order for every firm that remains in the market to expand its market share, some firms must exit in every period. This will occur only if price falls over time. It must fall sufficiently in each period t that E(n*) falls below zero for some firms in the market in period t - 1, causing these firms to exit.
VOL. 86 NO. 3 KLEPPER: INNOVATION OVER THE PRODUCT LIFE CYCLE 571
Using p, < p, - , it is possible to character- ize how the size of entrants, Aq,, the process R&D of entrants, rc t, and the profits of en- trants from the standard product, V t, change over time. Let s' denote the minimum product innovation expertise in period t among firms that entered in period k ? t. It is also possible to characterize how st, the minimum product innovation expertise among entrants, changes over time. Over time, rc,, Aqt, V,, and s, change as follows.
LEMMA 6: For all periods I > k, rc' < rck, AqI < Aqk, VI < Vk , and sl > Sk.
PROOF: The choices of rci, and Aqi, for entrants in
period t must satisfy equations (3) - (6) with Qit- -= 0. These equations differ across pe- riods only because pt falls over time. To see how changes in pt affect rc t, Aq ,, and also V,, set Qi1 = 0 in (3 )-(5 ) and differentiate with respect to pt. This yields
drci* / dp, = g"(rd * )Gl'(rc)/ D > 0
dAq /dp,
- g"(rd*)Gl"(rc* )Aq* /D > 0
dV /dp, = aV a/p, = Aq* > 0.
Given that pt < Pt- 1, it follows that rct, Aq,, and V must fall over time. Furthermore, if V falls over time, the marginal entrant must earn greater incremental profits from product innovation over time, which implies st must rise over time.
Lemma 6 indicates that the minimum in- novative expertise required for entry rises over time. Lemma 7 indicates that it eventu- ally rises to the point where no further entry occurs.
LEMMA 7: After some period, st > sna,
and no firms enter the industry.
PROOF: Recall that it was assumed that the distri-
bution of innovative expertise H(s) was such that at least one potential entrant in every entry
cohort had innovative expertise Smax. If St '
Smax for all t then in every period E(fl*) 2 0 for potential entrants with innovation expertise Smax, hence E(II*) > 0 for all prior entrants with innovative expertise Smax. Consequently, no incumbent with innovative expertise Smax would ever exit the industry. Since Aqi, > 0 for all firms that remain in the industry, firms with innovative expertise Smax will expand their market share in every period. This cannot, however, occur indefinitely, as eventually these firms would capture the entire market and would not be able to expand further with- out some of them exiting. This requires p, eventually to fall to a level such that E(fI*) < 0 for some incumbents with innovative exper- tise smax. At this point E(H*) < 0 for all po- tential entrants with si = Smax. Since pt falls over time, after this point E(II*) will con- tinue to be negative for potential entrants with Si = Smax, hence s will exceed Smax and no fur- ther entry will occur.
One final result that will be useful concerns how s' differs across entry cohorts in each pe- riod. This is summarized as follows.
LEMMA 8: In each period t, s' > s' for I > k.
PROOF: In each period, E(J7i,) 2 0 for producers.
Given that V * is lower the younger the firm based on Lemma 3, it follows that the mini- mum si required for survival must be greater for younger firms. Coupled with the fact that entrants start with higher minimum product innovation expertise than all prior entry co- horts based on Lemma 6, it follows that the younger the cohort of firms then the greater the minimum product innovation expertise of the cohort.
The various lemmas indicate how: (1) the price of the standard product changes over time; (2) the initial values of rdi,, rcit, Aqi,, and Vit change over time for entrants; and (3) the values of rdi,, rci,, and Qit change over time for incumbents. Summarizing results, over time pt declines, rdi, remains the same for en- trants and incumbents, rci,, Aqi,, and Vit de- cline over time for entrants, st rises over time
572 THE AMERICAN ECONOMIC REVIEW JUNE 1996
for entrants, and rci, and Qt rise over time for incumbents after entry. The other time paths, which involve how Aqi,, V1t, and E(Ji,) change over time for incumbents after entry, cannot be characterized generally. The only pattern that must hold is that in each period, Vi, and E(Fi,) must fall for some firms.
It was assumed that a price p, existed in each period such that the market cleared given the choices of firms taking p, as given. This will now be established via induction. It was as- sumed that such a price existed in period 1- this was how period 1 was defined. Suppose such a price exists in period t - 1. It will be shown that a market-clearing price pt then must exist in period t given the choices of firms taking this price pt as given. Given that the market cleared in period t - 1, Qt - =
-i,-I Qit- , where the summation is over firms in the market in period t - 1. In period t, pt must satisfy equation (2), which can be expressed as
(7) f,(p,){ 1 - Y; Qit- I/ Qt- I i7t
- X Aqit = 0, i,t
where the summation is over firms in the mar- ket in period t. In the proof of Lemma 5 it was established that pt must be less than pt - and must induce some firms to exit; otherwise 1 - Yi,t Qit - 1 /Qt - I = 0 since the market cleared in period t - 1 and equation (7) would be violated given that Aqi, > 0 for each firm in the market. Given the assumption of dE(nHt* )Idpt > 0, the lower pt then the more firms for which E(l*) < 0 and thus the greater the number of finns exiting in period t. The more firms that exit then the greater {I - Yi,t Qi- 1/Qt -1 } and the smaller Xi,t Aqi, in equation (7). Further- more, the smaller pt then the greater f (pt) and the smaller Aqt, for each firm, which reinforces the effect of exit on the market-clearing condi- tion. Thus, as pt decreases relative to pt -I, f (pt){ I- Yi,t Q1t-I/QIQt} rises and Ei,t Aqit falls in equation (7). Given that l(rc,t) is bounded, at a low enough price E(nl* ) < 0 for each firm and all firms would exit the industry. Thus, at a low enough pricef (p,) I 1 - Yjit Q,t- I Q }- I I - Yi,t Aqit > 0, whereas for prices pt 2
p,_ 1,f(p,) {1 -Yi,t Qit- /Q,- | }-2i,tAqit <
0. Given thatf,(pt) and Aqi, are continuous func- tions of p, and all firms are assumed to be atomistic and indifferent about being in the in- dustry when E(ll* ) = 0, it then follows that there must be a price pt which satisfies equation (7) and thus clears the market in period t.'2
Note that the existence of such a path for price does not depend on positive entry in each period, nor does it depend on the time paths in the number of entrants, number of exits, and number of firms. These time paths are ad- dressed in the next section.
IV. The Regularities of the PLC
Six propositions are developed in this sec- tion corresponding to each of the empirical regularities summarized in Section 2.
Consider the first regularity about entry over time. Let Et denote the number of entrants in period t. The possible time paths in Et implied by the model are characterized in Proposition 1.
PROPOSITION 1: Initially the number of entrants may rise or decline, but eventually it will decline to zero.
PROOF: The entry process is such that Et = Kt( 1 -
H(st)). Lemma 6 indicates st rises over time. Hence Et will fall over time unless Kt rises over time at a sufficient rate, which cannot be ruled out a priori. Therefore, initially E, may rise or
2 The assumption that all firms are atomistic ensures the continuity of f(p,){ 1 - .1j, Qit- ,IQt, - I-i, Aqi, as a function of p, and hence the existence of a price pt sat- isfying equation (7). A similar assumption is invoked in Jovanovic and Glenn H. MacDonald (1994) and Hugo A. Hopenhayn (1993) in their models of industry shakeouts (these are discussed further below). Alternatively, if firms were nonatomistic then the quantity supplied, Y, . Qi.- I (Q, I Q,- ) + Yi,t Aqi,, could exceed the quantity demanded, f(p1), at all prices Pt insufficient to induce the marginal firm to exit but could fall short of the quantity demanded at all prices sufficient to induce the marginal firm to exit. Then, there would be no price that would clear the market in period t. Although beyond the scope of the paper, non- atomistic firms might be accommodated by allowing firms to maintain backlogs of unfilled orders so that unsatisfied demand at the equilibrium price in period t was satisfied through firm expansion in subsequent periods.
VOL 86 NO. 3 KLEPPER: INNOVATION OVER THE PRODUCT LIFE CYCLE 573
fall over time. Lemma 7 indicates that in either case, E, will eventually decline to 0.
Proposition 1 can account for the two entry patterns reflected in Figure 1. Intuitively, in every period, incumbents have a lower average cost than entrants because they spend more on process R&D due to the greater output over which they can apply the benefits of their R&D. Entrants can nonetheless gain a foothold in the industry if they can earn sufficient profits from developing a distinctive product variant, which requires sufficient product-innovation expertise si. Over time, though, price is driven down and the advantage of incumbents over entrants grows, increasing the product-innovation ex- pertise required for entry to be profitable. This reduces the percentage of potential entrants that enter over time, although the number of entrants can rise at any time if the number of potential entrants K, rises sufficiently. Even- tually, price is driven to a level such that re- gardless of their product-innovation expertise, the expected profits of all potential entrants are less than or equal to 0 and entry ceases.
The second regularity indicates that initially the total number of firms rises but eventually peaks and then declines steadily, as reflected in Figure 1. Proposition 2 indicates how this can be explained by the model.
PROPOSITION 2: Initially the number of finns may rise over time, but eventually it will decline steadily.
PROOF: It was shown that p, must fall over time in
Lemma 5, and by a sufficient amount to cause some firms to exit in every period. Coupled with Lemma 7, which indicates entry must eventually stop, this implies that after some period the number of firms steadily declines. To see how the number of firms could rise over time at some point prior to this, consider with- out loss of generality the change in the number of firms between periods 1 and 2. This change equals the number of entrants in period 2, K2(1 - H(s2)), minus the number of exits in period 2, K1(H(s )-H(s )). The only constraint on the number of entrants and exits comes from the requirement that the market must clear in period 2. All incumbents that remain
in the industry in period 2 expand their market share. Therefore, in order for the market to clear in period 2, the total output of entrants in period 2, K2( 1 - H(s2))\Aq2, must be less than the output exiters in period 2 would have produced if they had remained in the industry and maintained their market share, K1 (H(s ) - H(s 1 )l) (Q2/Q1 ) Aq 1 . Since Aq 2< Aq 1 based on Lemma 6, this condition can be satisfied even if K2(1 - H(s2)) > K1 (H(s ) -
H(sl)). Thus, initially the number of firms may rise. Note that the number of firms could rise from period 1 to 2 even if K2 < K1, which would ensure that the number of entrants in period 2, K2(1 - H(s2)), was less than the number of entrants in period 1, K1 ( 1 -
H(s I)). Thus, the number of firms could rise initially even if the number of entrants fell.
Intuitively, over time price falls, the more innovative incumbents expand, and the less in- novative incumbents exit and are replaced by more innovative, smaller entrants. This can re- sult in a rise in the number of producers. How- ever, as incumbents continue to grow their ad- vantages eventually become insurmountable and entry ceases. Exit continues, though, as the largest firms with the greatest innovative ex- pertise expand their market share and push the less fit firms out of the market. Consequently, eventually the number of firms declines over time.
Consider next the third regularity regarding how the market shares of the leaders change over time. Proposition 3 indicates that the rate of change of the market shares of all incum- bents must eventually slow.
PROPOSITION 3: As eachfirm grows large, eventually the change in its market share, Aqi,/Q,, will decline over time.
PROOF: Given that Q, is nondecreasing over time,
Aqi,/Q, will decline over time if Aqi, declines over time. Equation (5) indicates that Aqi, is based on the firm's profit margin on the stan- dard product, p, - c + I(rci,). For incumbents that remain in the industry, rci, will grow over time, causing l(rci,) to grow. Eventually, though, I(rci,) will asymptotically approach its upper bound, and the rise in l(rci,) will
574 THE AMERICAN ECONOMIC REVIEW JUNE 1996
approach zero. In contrast, Lemma 5 indicates thatp, will fall in every period to accommodate the desires of incumbents to expand. There- fore, for incumbents that remain in the indus- try, p, - c + l(rci,) will eventually decline, causing the increase in their market share, Aqi,/Q,, to decline.
Intuitively, in every period incumbents ex- pand. The rate at which they expand depends on their profit margin on the standard product. With the marginal product of process R&D eventually approaching zero, all firms even- tually experience a decline in their profit mar- gin. This will induce them to decrease the rate at which they expand their market share. Since the largest firms perform the most process R&D, they will be the first to decrease the rate at which they expand their market share. Sub- sequently, smaller firms will follow.'
The other three regularities pertain to the na- ture of innovation over the PLC. Regarding first the trend over time in the rate of product innovation, it is straightforward to establish the following.
PROPOSITION 4: After entry ceases, the ex- pected number of product innovations of all finns, 1j, (si + g(rdi,)), declines over time.
PROOF: Since rdi, = rd * for all firms according to
Lemma 1, si + g(rdi,) remains the same for any firm i that remains in the market. Conse-
quently, once entry ceases, li,t(si + g(rdi,)) declines over time as the number of firms falls.
Proposition 4 explains the eventual decline in the rate of product innovation in new in- dustries reflected in the fourth regularity. Since each firm performs a constant amount of product innovation over time, once entry ceases and the number of firms declines then the expected number of product innovations must decline. Corresponding to this is a de- cline in the number of distinctive variants of the product for sale. This explains the other part of the fourth regularity concerning the decline in the number of competing versions of the product that eventually occurs in new industries. Note that prior to the shakeout in the number of producers, the number of firms increases over time as more innovative en- trants displace larger, less innovative incum- bents. This causes the number of competing versions of the product to rise over time. Thus, initially the market induces a rise in the diversity of competing product versions, which eventually gives way to a steady de- cline in this diversity. In this sense, the emer- gence of a "dominant design" for a product can be interpreted as the result rather than the cause of the shakeout in the number of pro- ducers. In effect, the private benefits of large size eventually compromise the diversity of competing product versions in the market. Since all product innovations are introduced in competing versions of the product and sub- sequently incorporated into the standard product, over time the rate of product inno- vation in the standard product will also de- cline as the number of firms falls.
Consider next the trend over time in the ef- fort devoted to process and product R&D. It is easy to establish the following.
PROPOSITION 5: For each firm i that re- mains in the market in period t, rci,/rdi, > rci, - 1/rdi, - 1i
PROOF: For each firm, Lemma 1 indicates rdi, is con-
stant over time and Lemma 4 indicates that rci, rises over time. Hence rci,/rdi, must rise over time.
1' Note, though, that there is nothing in the model to ensure that the largest firms remain in the market in every period. Exit will occur in every period, and there is nothing in the model to rule out exit from the first cohort, which contains the largest finns. Nonetheless, it is possible to establish that the largest cohorts will be subject to the low- est rate of exit in the following sense. In each cohort that experiences exit, the firms with the least innovative ex- pertise will exit. Eventually, whole entry cohorts become extinct. This will occur for entry cohort k when sk, the minimum innovation expertise required for survival, ex- ceeds Smax. Based on Lemma 8, sk will exceed Smax first for the youngest cohorts, which always have the greatest min- imum product-innovation expertise. Thus, once entry ceases the youngest cohorts, which are also the smallest, will experience the greatest rates of exit. This accords with the findings of numerous studies (for example, David S. Evans, 1987; Timothy Dunne et al., 1989).
VOL 86 NO. 3 KLEPPER: INNOVATION OVER THE PRODUCT LIFE CYCLE 575
Proposition 5 establishes that over time every firm that remains in the market in- creases its effort on process relative to prod- uct R&D, which explains the fifth regularity. Intuitively, since the returns to product R&D are independent of firm size while the returns to process R&D are a direct function of firm size, as firms grow they increase their effort on process relative to product R&D. This is just an extreme case of the general idea that the returns to product R&D are less depen- dent on the output of the firm (prior to the R&D) than the returns to process R&D. In this sense process and product R&D, which are often collapsed into one based on an ap- peal to a Lancasterian attributes framework, are different.
Proposition 5 applies to individual firms. Eventually the trends at the firm level must also be mirrored at the market level. Once en- try ceases, the smallest firms are dispropor- tionately driven from the market given their cost disadvantage. These firms have the high- est ratio of product to process R&D because they conduct the least amount of process R&D. Thus, as they disproportionately exit and incumbents increase their level of process relative to product R&D, the ratio of total pro- cess to total product R&D for all firms rises.'4 Note, though, that once entry ceases the total process R&D of all firms might decline over time, just at a slower rate than the decline in total product R&D.'"
The last regularity concerning innovation is that entrants tend to account for a dispro- portionate share of product innovations rel- ative to incumbents. Let ik = (i,t(si + g(rdit))/N' denote the expected number of
innovations per firm in period t of firms that entered in period k, where N' is the number of firms in period t that entered in period k and the summation is over these firms. Prop- osition 6 indicates that ik must be greater the younger the cohort.
PROPOSITION 6: For all periods t, ik < ia
fork < 1.
PROOF: Since all firms spend the same amount on
product R&D, the expected number of inno- vations per firm, si + g(rdi,), is determined exclusively by si. This implies that on average the expected number of innovations per firm in each entry cohort will be determined by the average innovative expertise of firms in the co- hort. For each period t, Lemma 8 indicates that the minimum innovative expertise of cohort k, Sk, is greater the younger the cohort (that is, the larger k). Therefore, the average value of si will be greater the younger the cohort, hence ak < il for k < 1.
Proposition 6 implies that entrants will be more innovative on average than incum- bents, which explains the last regularity. In- tuitively, the most recent entrants are smaller than all other firms and thus earn the least profits from the standard product. The only way they survive given this disadvantage is if they are more innovative on average than incumbents. Thus, it is not necessary to ap- peal to some kind of disadvantage of size in innovation, or to entrants having a greater incentive than incumbents to innovate be- cause they have less to protect (compare Reinganum, 1983, 1985), to explain the greater innovativeness of entrants. Rather, the greater innovativeness of entrants may be attributable to the selection process gov- erning the evolution of the market coupled with an advantage of large firm size in ap- propriating the returns from R&D. Indeed, if incumbents either had strategic disincentives to innovate or were less efficient at innova- tion because of their larger size, then oppor- tunities for profitable entry would persist over time, which is not consistent with the first regularity concerning entry eventually becoming small.
4 Prior to entry ceasing, there is a counteracting force at the level of the market to the trend in the ratio of firm process to product R&D: smaller, more innovative en- trants displace larger, less innovative incumbents. Because the entrants are smaller, they have a higher ratio of product to process R&D than the incumbents, which contributes toward a higher ratio of product to process R&D at the market level. Thus, it is possible that prior to entry ceas- ing, the ratio of process to product R&D at the market level might fall over time. Once entry ceases, however, the ratio must rise.
I Whether the total amount of process R&D of all firms declines over time depends on the rate at which incumbent firms expand their process R&D relative to the rate of firm exit, which is not determined within the model.
576 THE AMERICAN ECONOMIC REVIEW JUNE 1996
V. Cross-Sectional Implications of the Model
In this section it is shown that the model can explain various cross-sectional regularities re- garding how within industries R&D effort, R&D productivity, cost, and profitability dif- fer across firms according to their size. Since the model was not set up to explain these reg- ularities, its ability to explain them can be viewed as support for its account of the PLC.
A simple cross-sectional implication of the model is that larger firms should perform more total R&D and also devote a greater fraction of their R&D to process innovation.
PROPOSITION 7: For each period t, the larger the output of the firm at the start of the period, Qit - 1, then the greater its total spend- ing on R&D, rdi, + rci,, and the greater the fraction of its total R&D devoted to process innovation, rci,/(rdi, + rci,).
PROOF: This follows directly from Lemmas 1 and 3.
There have been numerous studies of the relationship between total R&D spending and contemporaneous firm size. It has been re- peatedly found that R&D and contemporane- ous firm size are closely related, with firm size explaining over 50 percent of the variation in firm R&D in more R&D-intensive industries (see Cohen and Klepper [1996b] for a review of these studies). In terms of the composition of firm R&D, F. M. Scherer (1991) analyzes the patents issued to firms in the Federal Trade Commission Line of Business Program in the 10-month period from June 1976 to March 1977. Assigning these patents to business units and classifying them according to whether they are process or product patents, Scherer finds that among business units with patents, the fraction of patents that are process in- creases with the sales of the business unit. Based on the assumption that the returns to process R&D are more closely tied to the size of the firm than the returns to product R&D, Cohen and Klepper (1996a) develop addi- tional predictions at the level of the industry about the relationship between the fraction of patents that are process and business unit sales. Using Scherer's data, they find support for
Proposition 7 at the level of the industry as well as for their more detailed predictions.
The intuition behind Proposition 7 is simple: the larger the firm then the greater the returns from process R&D, hence the greater the effort devoted to R&D in general and process in par- ticular. Alternatively stated, the larger the firm then the greater the output over which it can average the fixed costs of (process) R&D, hence the greater its R&D effort. This implies that the close relationship between R&D and firm size is indicative of an advantage of size. In contrast, most studies have interpreted the close relationship to indicate no advantage of size. They note that R&D does not tend to rise more than proportionally with firm size, which implies that increasing the average firm size would not increase total industry R&D spend- ing. This has been widely interpreted to imply there are no advantages of large firm size in R&D (William L. Baldwin and John T. Scott, 1987 p. 111). But as Cohen and Klepper (1996b) emphasize, without such an advan- tage it is difficult to explain why there is a close relationship between R&D and firm size. 16
In addition to predictions about R&D effort and firm size, the model has distinctive impli- cations about how firm size and R&D produc- tivity are related.
PROPOSITION 8: For each period t, the av- erage product of process R&D, l(rci,)/rci,, and the average product of product R&D, (si + g(rdj,))/rdj,, vary inversely with the size of the firm, Qj.
6 Note that in the model there is no innate advantage of firm size in R&D, as Cohen and Klepper (1996b) point out in a related setting. The advantage of large firm size stems from the inability of firms to sell their innovations in disembodied form and the costliness of rapid growth. In the absence of these restrictions, successful innovations could be embodied in the entire industry output through the sale of the innovations and/or the expansion of suc- cessful innovators, and the contemporaneous size of the firm would have no bearing on the firm's incentives to conduct R&D. While many other models assume, either implicitly or explicitly, that innovations cannot be sold and thus link the returns to innovation to the size of the innovator, few assume any restrictions on firm growth.
VOL. 86 NO. 3 KLEPPER: INNOVATION OVER THE PRODUCT LIFE CYCLE 577
PROOF: Given that l"(rci,) < 0 for all rci,, the larger
rci, then the lower will be l(rcj,)/rcj,. In each period t, the larger the firm then the greater its spending on process R&D. Therefore, l(rci,)/ rci, will vary inversely with Qt. Regarding product R&D, Proposition 6 indicates that the expected number of innovations per firm is greater for smaller firms. Since all firms spend the same amount on product R&D, this implies that (si + g(rdj,))/rdj, must be inversely re- lated to the size of the firm, Qit.
Proposition 8 is consistent with the findings of studies that examine the relationship be- tween total R&D effort and the number of pat- ents and/or innovations per unit of R&D. John Bound et al. (1984) find that for publicly traded firms, the number of patents per dollar of R&D is considerably greater for firms with smaller R&D budgets. Examining this rela- tionship within industries using data from a comprehensive census of innovations in 1982 conducted for the Small Business Administra- tion, Zoltan J. Acs and David B. Audretsch (1991) generally find an inverse relationship across firms between the number of innova- tions per dollar of R&D and total R&D spend- ing. If in addition total R&D spending does not rise more than proportionally with firm size within industries, as has generally been found, then Proposition 8 further implies that the total product of R&D will not rise in pro- portion to firm size. Equivalently stated, within industries larger firms will account for a disproportionately small share of process and product innovations relative to their size. This is consistent with Acs and Audretsch's find- ings (1988, 1991) based on the Small Busi- ness Administration data, especially for more R&D intensive industries, with Scherer's (1965) findings concerning the rate of patent- ing among large firms, and with the observa- tions of Alice Patricia White (1983) for the select group of dominant firms she analyzes.
This interpretation runs counter to the con- ventional interpretation of the inverse relation- ship between R&D productivity and firm size. This finding has been widely interpreted as a further sign of the lack of an advantage of firm size in R&D (see, for example, Acs and Audretsch, 1991). Not only do large firms not
spend disproportionately more on R&D than smaller firms, but they appear to get less out of their R&D spending than smaller firms, sug- gesting they are actually less efficient at R&D than their smaller counterparts. This interpre- tation, though, raises more questions than it answers. If larger firms are less efficient at R&D, why do they conduct more R&D than smaller firms? Even more fundamentally, how are large firms able to survive and prosper in R&D intensive industries if they are less effi- cient at R&D than smaller firms?
These questions are readily answered by the model. All firms have the same R&D produc- tivity in the model in the sense that the func- tions g(rdi,) and l(rci,), which calibrate the productivity of product and process R&D re- spectively, are the same for all firms. The lower average productivity of both product and process R&D in larger firms is a reflection of the competitive advantages conferred by firm size. By applying their (process) R&D to a larger level of output, larger firms are able to appropriate a greater fraction of the value of their (process) R&D than smaller firms. This induces them to undertake more process R&D than smaller firms. Given the diminish- ing returns to R&D, by undertaking more pro- cess R&D larger firms march further down the marginal-product schedule of process R&D, causing the average product of their process R&D to be lower than in smaller firms. At the same time, by undertaking more process R&D and getting a larger return from their process R&D than smaller firms, they earn greater prof- its from process R&D than smaller firms. This is why they prosper despite the lower average productivity of their R&D than smaller firms. The greater profits they earn from process R&D also enables them to survive with less average product-innovation expertise than smaller firms, which explains why they gen- erate fewer product innovations per dollar of product R&D than smaller firms.'7
'7 Richard J. Rosen (1991) recently proposed an alter- native explanation for why large firms account for a dis- proportionately small share of innovations relative to their sales which also relies on large size conferring an advan- tage in appropriating the returns from R&D. His expla- nation, however, also relies on a stylized depiction of the
578 THE AMERICAN ECONOMIC REVIEW JUNE 1996
The model has further implications regard- ing how the advantages conferred by size in R&D will be reflected in firm cost and profit- ability. It predicts that larger firms will have lower average cost.
PROPOSITION 9: For each period t, firm average cost c - l(rcj,) varies inversely with Qit.
PROOF: Since rci, varies directdy with Qit and P'(rci,) >
0 for all rci,, it follows directly that c - l(rci,) varies inversely with Qit.
This prediction is consistent with the find- ings of Richard E. Caves and David R. Barton (1990), who use plant data from the Census of Manufacturers to estimate production func- tions for 4-digit SIC manufacturing industries. Allowing productivity to differ across plants, they find that for the average industry larger plants are more productive than smaller plants. In light of the high correlation between plant and business size, this finding is supportive of Proposition 9. Consistent with the role of R&D in the model in imparting a lower cost to larger firms, Caves and Barton (p. 126) find the re- lationship between productivity and plant size to be stronger in more R&D intensive indus- tries. Proposition 9 is also consistent with E. Ralph Biggadike's (1979 pp. 65-66) findings about entrants. Using detailed data on new business units of a subset of firms in the PIMS data set, Biggadike finds that entrants tend to start with a pronounced production-cost dis- advantage that declines over time as the en- trants capture a larger share of the market.
The model has further implications regard- ing how the advantages conferred by firm size in R&D will be reflected in firm cost and profitability.
PROPOSITION 10: The largest and most profitable firms will come from thefirst cohort of entrants. These firms will increase their market shares over time and consistently earn supernormal profits.
PROOF: Firms that entered in period 1 with innova-
tive expertise Smax will always be larger than all subsequent entrants and will earn greater profits than all other firms. Consequently, they will consistently earn supernormal profits and will never exit. Since Aqi, > 0 for all incum- bents, over time these firms will also increase their market shares.
Proposition 10 implies that the market shares of the largest and most profitable firms in the industry will not decline over time. Fur- thermore, although the profits of these firms may decline over time as price falls, they will consistently earn supernormal profits. These predictions are consistent with Mueller's (1986) findings concerning the persistence of market share and profitability among the larg- est manufacturing firms over the period 1950- 1972. Mueller finds that a number of these firms maintained their market shares over this 22-year period. While the average profitability of these firms declined over time, they were still eaming supernormal returns on invest- ment in 1972. Consistent with the role played by R&D in the model in conferring an advan- tage to larger firms, Mueller finds that the per- sistence of market share and profitability was stronger for firms in more R&D-intensive in- dustries. Proposition 10 also predicts that the most successful and long-lived firms will dis- proportionately come from the earliest entry cohorts. This is consistent with the findings of Klepper and Simons (1993) concerning four products that experienced sharp shakeouts: au- tos, tires, televisions, and penicillin. They find that the chances of surviving at least 10 years were significantly greater for the earliest en- trants, particularly in autos and tires, and that on average the largest firms entered earlier.
In summary, the cross-sectional regularities indicate that the larger the firm then the greater its spending on R&D, the greater the fraction of its R&D devoted to process innovation, the smaller the number of patents and innovations
returns to risky R&D projects which suggests, counter to the evidence assembled in Mansfield (1981), that large firms will account for a disproportionately small share of riskier R&D. As the model indicates, as long as R&D is subject to diminishing returns and large firm size provides an advantage in appropriating the returns to R&D, there is little need to resort to other stylizations to account for the disproportionately small number of innovations ac- counted for by larger firms.
VOL. 86 NO. 3 KLEPPER: INNOVATION OVER THE PRODUCT LIFE CYCLE 579
it generates per dollar of R&D, and the lower its average costs. Furthermore, earlier entrants tend to grow larger and survive longer. Since all of these patterns are predicted by the model, they provide support for it. The extent of the support, though, depends on the degree to which these same patterns can be explained by other theories, particularly theories that can account for various features of the PLC. The most relevant alternative theories are the dominant design view reviewed in the introduc- tion (compare Utterback and Suairez, 1993), which explains many features of the PLC, and theories recently advanced in Jovanovic and MacDonald (1994) and Hopenhayn (1993) to explain shakeouts.
Each of these theories posits technology- based mechanisms which increase exit and/or make entry harder, contributing to a shakeout. In Utterback and Suairez (1993) the mecha- nism is a dominant design, which leads to exit of firms less able to manage the production process for the dominant design. In Jovanovic and MacDonald (1994) it is a major (exoge- nous) technological change which leads to exit of firms that are unable to innovate in the new regime. In Hopenhayn (1993) it is a slowdown in product innovation that favors firms that in- vest in process innovation, in the manner of the dominant design theory.'8
While the theories do not directly address the cross-sectional regularities, they can none- theless be used to speak to them. In each the- ory, the firms that prosper and remain in the industry during the shakeout are the better in- novators.1t might be expected these firms would spend more on R&D, particularly pro- cess R&D in the Utterback and Suairez (1993) and Hopenhayn (1993) models, have lower costs, and grow to be larger. This could ex- plain the cross-sectional regularities involving firm size and total R&D, the fraction of R&D devoted to process innovation, and average cost. The other two regularities, however, are more difficult for the alternative theories to ex- plain. If larger firms are better innovators, they
might be expected to generate at least as many, if not more, innovations per dollar of R&D than the smaller finns. Yet the cross-sectional regularities indicate that the number of patents and innovations per dollar of R&D declines with firm size. In terms of the significance of early entry, none of the theories emphasizes the importance of entry timing in conditioning the length of survival of firms that entered prior to the shakeout.'9 Yet the cross-sectional regularities indicate that among products ex- periencing sharp shakeouts, the date of entry was an important determinant of the length of survival for the preshakeout entrants.20
Thus, the alternative theories cannot readily explain all the regularities. This does not imply that the forces they feature are not operative. Indeed, these forces are largely complemen- tary to the ones featured in the model. Judging from the cross-sectional regularities, however, the model appears to capture important forces that are not present in the other theories.
VI. Implications and Extensions
The notion that entry, exit, market structure, and innovation follow a common pattern for new products has become part of the folklore of a number of disciplines, including econom- ics. Although the features of this pattern are based on a limited number of products and much of the evidence is impressionistic, they appear to resonate with our experience. De- spite its popularity, though, there are many skeptics about the PLC, both in terms of its logic and its universality. The principal pur- pose of this paper was to shore up its logical
18 Hopenhayn (1993) also posits other, nontechnology- based mechanisms that could trigger a shakeout. These are not considered because they cannot address the cross- sectional regularities involving R&D.
'9 In each theory the shakeout is triggered by events which change the basis for competition among incum- bents, which if anything might be expected to undermine the value of prior experience.
20 Moreover, it does not appear to be the shakeout itself which accounts for this effect. Klepper (1996) finds that differences in survival rates for the preshakeout entrants were most pronounced when they were older and had sur- vived a number of years of the shakeout. In the model, this can be explained by the selection process (compare Klepper, 1996). On average, later entrants are better in- novators. At young ages, this can offset the disadvantage of late entry for firm survival, but as firms age and the selection process continues to operate, eventually later en- trants must experience higher hazard rates.
580 THE AMERICAN ECONOMIC REVIEW JUNE 1996
foundations by showing how a simple model could explain all the central features of the PLC.
The proposed model grounds the PLC with two simple forces. One is that the ability to appropriate the returns to process R&D de- pends centrally on the size of the firm. The other is that firms possess different types of expertise which lead them to pursue different types of product innovations. The advantage of size in process R&D causes firm process R&D to rise over time and eventually puts en- trants at such a cost disadvantage that entry is foreclosed. After entry ceases, firms compete on the basis of their size and also their inno- vative prowess. As firms exit and the number of firms falls, the diversity of product R&D is compromised, causing the number of product innovations and the diversity of competing product variants to decline. The same two forces also explain the relationship within in- dustries between firm size and total R&D spending, relative spending on product and process R&D, the productivity of R&D, av- erage cost, and profitability. The ability of the model to explain these cross-sectional regu- larities in addition to the temporal patterns that define the PLC provides support for its expla- nation of the PLC. It also lends credence to the PLC as a leading case that captures the salient features of the evolution of technologically progressive industries.
A number of stylizations were invoked to highlight the two key forces featured in the model. Perhaps the most noteworthy were the assumptions that average cost was a function of only contemporaneous process R&D, de- cisions were made solely on the basis of short- term profits, and all innovations were ultimately embodied in the industry's standard product. Although relaxing these assumptions would complicate the model, it need not fundamen- tally alter the ability of the model to explain the PLC. Regarding process innovation, sup- pose process improvements were allowed to cumulate. If all process improvements were assumed to be costlessly imitated one period after they were introduced, firm differences in average cost would still be a function of only differences in contemporaneous firm spending on process R&D. Firm average costs would equal c, - I (rci,), where c, reflects the cumu-
lative effect on cost of all past process inno- vations by all firms. This change would not fundamentally affect the model.2' Even if cost differences across firms were allowed to cu- mulate, it would only reinforce the advantages of the largest firms. If firms were allowed to be forward looking, all firms would accelerate the growth in their output to take account of the advantages of size in R&D and accord- ingly undertake greater process R&D in each period (Klepper, 1992). But given the costs of expanding output, firms would still grow by finite rates in each period and it would still be advantageous to enter earlier. Indeed, the firms that would accelerate the growth in their out- put the most would be those that expected to survive longest, which would be the firms that entered earliest with the greatest innovative expertise. Thus, allowing firms to be forward looking would not alter the advantages of early entry and greater innovation expertise and thus would not fundamentally alter the model. Fi- nally, suppose some product innovations were not embodied in the standard product but formed the basis for separate product niches. If all permanent product variants could be costlessly imitated one period after they were developed and process innovation lowered the average cost of all product variants, then the implications of the model would not change. All firms would produce all product variants and the incentives for process R&D would de- pend on the total output of all variants.22
The depiction in the model of how market structure and performance evolve over time for new products is different from the conven- tional industrial organization paradigm on structure and performance. Historically, indus- try characteristics were seen as shaping the na- ture of firm cost functions and barriers to entry, which in turn determined structure and performance. With few exceptions, firm dif- ferences within industries were thought to be
2' The only implication of the model that would change is Proposition 3, which would require further structuring of the model to establish.
22 The only way the model would be fundamentally al- tered is if each product niche required its own process R&D. In this case, each product niche would be analogous to a separate industry, and the model would no longer be a model of industry evolution but of industry fragmentation.
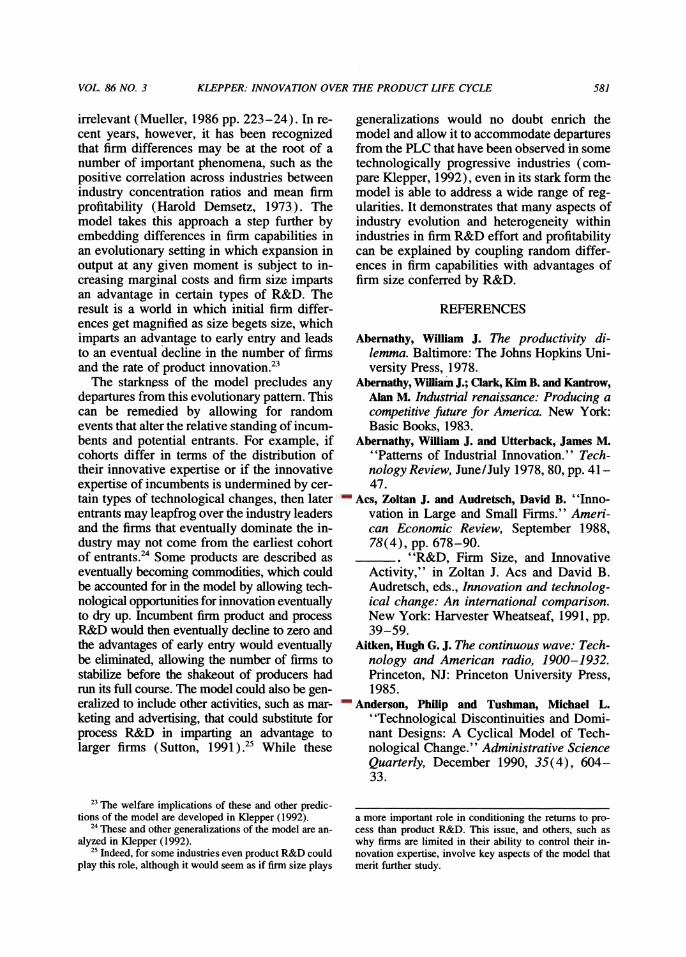
VOL 86 NO. 3 KLEPPER: INNOVATION OVER THE PRODUCT LIFE CYCLE 581
irrelevant (Mueller, 1986 pp. 223-24). In re- cent years, however, it has been recognized that firm differences may be at the root of a number of important phenomena, such as the positive correlation across industries between industry concentration ratios and mean firm profitability (Harold Demsetz, 1973). The model takes this approach a step further by embedding differences in firm capabilities in an evolutionary setting in which expansion in output at any given moment is subject to in- creasing marginal costs and firm size imparts an advantage in certain types of R&D. The result is a world in which initial firm differ- ences get magnified as size begets size, which imparts an advantage to early entry and leads to an eventual decline in the number of firms and the rate of product innovation.23
The starkness of the model precludes any departures from this evolutionary pattern. This can be remedied by allowing for random events that alter the relative standing of incum- bents and potential entrants. For example, if cohorts differ in terms of the distribution of their innovative expertise or if the innovative expertise of incumbents is undermined by cer- tain types of technological changes, then later entrants may leapfrog over the industry leaders and the firms that eventually dominate the in- dustry may not come from the earliest cohort of entrants.24 Some products are described as eventually becoming commodities, which could be accounted for in the model by allowing tech- nological opportunities for innovation eventually to dry up. Incumbent firm product and process R&D would then eventually decline to zero and the advantages of early entry would eventually be eliminated, allowing the number of firms to stabilize before the shakeout of producers had run its full course. The model could also be gen- eralized to include other activities, such as mar- keting and advertising, that could substitute for process R&D in imparting an advantage to larger firms (Sutton, 1991).25 While these
generalizations would no doubt enrich the model and allow it to accommodate departures from the PLC that have been observed in some technologically progressive industries (com- pare Klepper, 1992), even in its stark form the model is able to address a wide range of reg- ularities. It demonstrates that many aspects of industry evolution and heterogeneity within industries in firm R&D effort and profitability can be explained by coupling random differ- ences in firm capabilities with advantages of firm size conferred by R&D.
REFERENCES
Abernathy, William J. The productivity di- lemma. Baltimore: The Johns Hopkins Uni- versity Press, 1978.
Abernathy, William J.; Clark, Kim B. and Kantrow, Alan M. Industrial renaissance: Producing a competitive fiture for America. New York: Basic Books, 1983.
Abernathy, William J. and Utterback, James M. "Patterns of Industrial Innovation." Tech- nology Review, June/July 1978, 80, pp. 41- 47.
Acs, Zoltan J. and Audretsch, David B. "Inno- vation in Large and Small Firms." Ameri- can Economic Review, September 1988, 78(4), pp. 678-90.
. "R&D, Finn Size, and Innovative Activity," in Zoltan J. Acs and David B. Audretsch, eds., Innovation and technolog- ical change: An international comparison. New York: Harvester Wheatseaf, 1991, pp. 39-59.
Aitken, Hugh G. J. The continuous wave: Tech- nology and American radio, 1900-1932. Princeton, NJ: Princeton University Press, 1985.
Anderson, Philip and Tushman, Michael L. "Technological Discontinuities and Domi- nant Designs: A Cyclical Model of Tech- nological Change." Administrative Science Quarterly, December 1990, 35(4), 604- 33.
23 The welfare implications of these and other predic- tions of the model are developed in Klepper (1992).
2 These and other generalizations of the model are an- alyzed in Klepper (1992).
25 Indeed, for some industries even product R&D could play this role, although it would seem as if firm size plays
a more important role in conditioning the returms to pro- cess than product R&D. This issue, and others, such as why firms are limited in their ability to control their in- novation expertise, involve key aspects of the model that merit further study.
582 THE AMERICAN ECONOMIC REVIEW JUNE 1996
Baldwin, William L. and Scott, John T. Market structure and technological change. Chur, Switzerland: Harwood Academic Publish- ers, 1987.
Biggadike, E. Ralph. Corporate diversification: Entry strategy and performance. Cambridge, MA: Harvard University Press, 1979.
Bound, John; Cummins, Clint; Griliches, Zvi; Hall, Bronwyn H. and Jaffe, Adam. "Who Does R&D and Who Patents?" in Zvi Griliches, ed., R&D, patents, and produc- tivity. Chicago: University of Chicago Press for the National Bureau of Economic Re- search, 1984, pp. 21-54.
Bright, Arthur A. The electric lamp industry. New York: Macmillan, 1949.
Bright, James R. Automation and management. Boston: Graduate School of Business Ad- ministration, Harvard University, 1958.
Caves, Richard E. and Barton, David R. Effi- ciency in U.S. manufacturing industries. Cambridge, MA: MIT Press, 1990.
Clark, Kim B. "The Interaction of Design Hi- erarchies and Market Concepts in Techno- logical Evolution." Research Policy, October 1985, 14(5), pp. 235-51.
Cohen, Wesley M. and Klepper, Steven. "The Anatomy of Industry R&D Intensity Distri- butions." American Economic Review, Sep- tember 1992, 82(4), pp. 773-99.
. "Firm Size and the Nature of Inno- vation within Industries: The Case of Pro- cess and Product R&D." Review of Economics and Statistics, 1996a.
. "A Reprise of Size and R&D." Eco- nomic Journal, forthcoming 1996b.
Dasgupta, Partha and Stiglitz, Joseph. "Indus- trial Structure and the Nature of Innovative Activity." Economic Journal, June 1980, 90(358), pp. 266-93.
De Bresson, C. and Townsend, J. "Multivariate Models for Innovation: Looking at the Abernathy-Utterback Model with Other Data." Omega, 1981, 9(4), pp. 429-36.
Demsetz, Harold. "Industry Structure, Market Rivalry, and Public Policy." Journal of Law and Economics, April 1973,16(1), pp. 1-9.
Drew, Philip G. "Despite Shakeout, Imaging Industry Not Doomed to Being Greek Trag- edy." Diagnostic Imaging, November 1987, 9, pp. 95-99.
Dunne, Timothy; Roberts, Mark J. and Samuelson, Larry. "The Growth and Failure of U.S. Manufacturing Plants." Quarterly Journal of Economics, November 1989,104(4), pp. 671-98.
Evans, David S. "Tests of Alternative Theories of Firm Growth." Journal of Political Economy, August 1987, 95(4), pp. 657- 74.
Flaherty, M. Therese. "Industry Structure and Cost-Reducing Investment." Economet- rica, July 1980, 48(5), pp. 1187-209.
Flamm, Kenneth. Creating the computer. Washington, DC: The Brookings Institu- tion, 1988.
Gilbert, Richard J. and Newbery, David M. G. "Preemptive Patenting and the Persistence of Monopoly." American Economic Re- view, June 1982, 72(3), pp. 514-26.
Gort, Michael and Klepper, Steven. "Time Paths in the Diffusion of Product Innovations." Economic Journal, September 1982, 92(367), pp. 630-53.
Hollander, Samuel. The sources of increased ef- ficiency: A study of Du Pont rayon plants. Cambridge, MA: MIT Press, 1965.
Hopenhayn, Hugo A. "The Shakeout." Work- ing Paper No. 33, Universitat Pompeu Fa- bra, 1993.
Hounshell, David A. "The Making of the Syn- thetic Fiber Industry in the United States." Mimeo, Harvard Business School, 1988.
Jovanovic, Boyan. "Selection and the Evolution of Industry." Econometrica, May 1982, 50(3), pp. 649-70.
Jovanovic, Boyan and MacDonald, Glenn H. "The Life Cycle of a Competitive Indus- try." Journal of Political Economy, April 1994, 102(2), pp. 322-47.
Klein, Burton H. Dynamic economics. Cam- bridge, MA: Harvard University Press, 1977.
Klepper, Steven. "Entry, Exit, and Innovation over the Product Life Cycle: The Dynamics of First Mover Advantages, Declining Prod- uct Innovation, and Market Failure." Mimeo, Carnegie Mellon University, 1992.
. "Evolution, Market Concentration, and Firm Survival." Mimeo, Carnegie Mel- lon University, 1996.
Klepper, Steven and Graddy, Elizabeth. "The Evolution of New Industries and the Deter-
VOL. 86 NO. 3 KLEPPER: INNOVATION OVER THE PRODUCT LIFE CYCLE 583
minants of Market Structure." Rand Jour- nal of Economics, Spring 1990, 21 (1), pp. 27-44.
Klepper, Steven and Simons, Kenneth L. "Tech- nological Change and Industry Shakeouts." Mimeo, Carnegie Mellon University, 1993.
Kraus, Jerome. "An Economic Study of the U.S. Semiconductor Industry." Ph.D. Dis- sertation, New School for Social Research, 1973.
Mansfield, Edwin. "Entry, Gibrat's Law, In- novation and the Growth of Firms." Amer- ican Economic Review, December 1962, 52(5), pp. 1031-51.
. "Composition of R and D Expendi- tures: Relationship to Size of Firm, Concen- tration, and Innovative Output." Review of Economics and Statistics, November 1981, 63(4), pp. 610-15.
Mowery, David C. and Rosenberg, Nathan. Inside the black box: Technology and economics. New York: Cambridge University Press, 1982.
Mueller, Dennis C. Profits in the long run. Cam- bridge: Cambridge University Press, 1986.
Mueller, Dennis C. and Tilton, John. "Research and Development Costs as a Barrier to En- try." Canadian Journal of Economics, No- vember 1969, 2(4), pp. 570-79.
Nelson, Richard R. "Assessing Private Enter- prise: An Exegesis of Tangled Doctrine." Bell Journal of Economics, Spring 1981, 12(1), pp. 93-111.
Nelson, Richard R. and Winter, Sidney G. "Forces Generating and Limiting Concen- tration under Schumpeterian Competition." Bell Journal of Economics, Autumn 1978, 9(2), pp. 524-48.
. An evolutionary theory of economic change. Cambridge, MA: Harvard Univer- sity Press, 1982.
Pavitt, K. and Rothwell, R. "A Comment on 'A Dynamic Model of Process and Product In- novation.' " Omega, 1976, 4(4), pp. 375- 77.
Porter, Michael E. Competitive strategy. New York: The Free Press, 1980.
. "The Technological Dimension of Competitive Strategy," in Richard S. Rosenbloom, ed., Research on technologi- cal innovation, management and policy. Greenwich, CT: JAI Press, 1983.
Prusa, Thomas J. and Schmitz, James A. "Are New Firms an Important Source of Inno- vation?" Economics Letters, March 1991, 35(3), pp. 339-42.
Reinganum, Jennifer. "Uncertain Innovation and the Persistence of Monopoly." Ameri- can Economic Review, September 1983, 73(4), pp. 741-48.
. "Innovation and Industry Evolu- tion." Quarterly Journal of Economics, February 1985, 100(1), pp. 81-99.
Rosen, Richard J. "Research and Development with Asymmetric Firm Sizes." Rand Jour- nal of Economics, Autumn 1991,22(3), pp. 411-29.
Scherer, F. M. "Firm Size, Market Structure, Opportunity, and the Output of Patented In- ventions." American Economic Review, December 1965, 55(5), pp. 1097-125.
. "Changing Perspectives on the Firm Size Problem," in Zoltan J. Acs and David B. Audretsch, eds., Innovation and techno- logical change: An international compari- son. New York: Harvester Wheatseaf, 1991, pp. 24-38.
Schmookler, Jacob. Invention and economic growth. Cambridge, MA: Harvard Univer- sity Press, 1966.
Shaked, Avner and Sutton, John. "Product Dif- ferentiation and Industrial Structure." Jour- nal of Industrial Economics, December 1987, 36(2), pp. 131-46.
Sutton, John. Sunk costs and market structure. Cambridge, MA: MIT Press, 1991.
Tilton, John E. International diffusion of tech- nology: The case of semiconductors. Wash- ington, DC: The Brookings Institution, 1971.
Utterback, James M. and Abernathy, William J. "A Dynamic Model of Process and Product Innovation." Omega, 1975,3(6), pp. 639-56.
Utterback, James M. and Suairez, Fernando F. "Innovation, Competition, and Industry Structure." Research Policy, February 1993, 22(1), pp. 1-21.
von Hippel, Eric. The sources of innovation. Oxford: Oxford University Press, 1988.
White, Alice Patricia. The dominant firm. Ann Arbor, MI: UMI Research Press, 1983.
Williamson, Oliver E. Markets and hierarchies: Analysis and antitrust implications. New York: The Free Press, 1975.