Embed Size (px)
Citation preview

Submitted ToProf. Sudhir Kamath
Submitted ByAjay Prathap ChopparaBhavyaruna Chittajallu
Sri Harsha NoriNaveena KodaliSadiq Khan Md
Venkata Sai Akhil Sadhu M N

Indian Automobile Industry
• GST, Make in India• The two large initiatives are rural and infrastructure
development• There's an allocation of Rs 64,000 Crore for highway
development• Tax cut will see disposable income in hands of buyers

Source: ATMA & CMIE
Indian Tyre IndustryNo. of Companies 39
No. of Tyre plants 60
Industry Turnover (estimation) Rs. 50000 Crore (USD$ 8.5Bn)
Exports (estimation) Rs. 10500 (USD$ 1.7Bn)
While the tyre industry is largely dominated by the organized sector, the unorganized sector is predominant with respect to bicycle tyres.
Major players are MRF, JK Tyres, and Apollo Tyres & CEAT which account for 63 per cent of the organized tyre market. As per the Automotive Tyre Manufacturers’ Association (ATMA), the revenues of the tyre manufacturing firms have grown
at a CAGR of 12% between FY 2009-10 and FY 2014-15. The revenues of the industry in FY 2015-16 remained muted with almost negligible growth, year-on-year.
Major players have their own distribution channels and they spend huge on the R & D departments. The major factors affecting the demand for tyres include the level of industrial activity, availability and cost of credit,
transportation volumes and network of roads, execution of vehicle loading rules, radialization, retreading and exports.
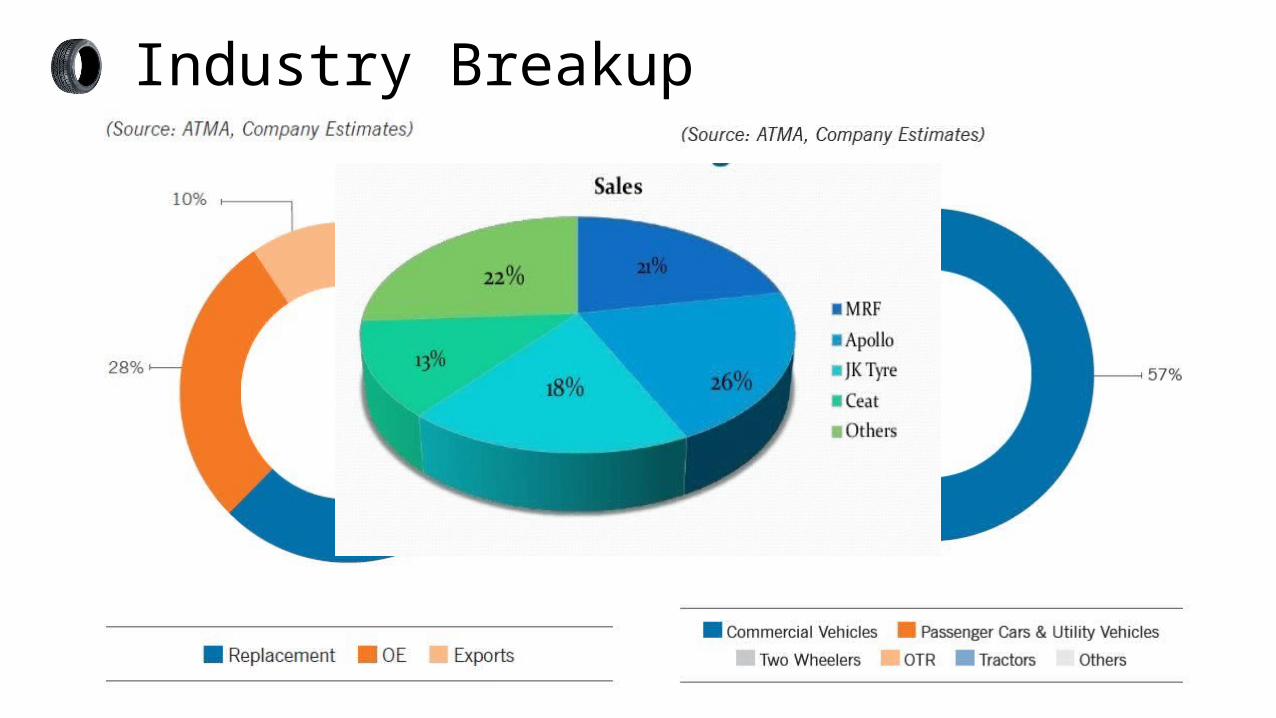
Industry Breakup

Opportunities Threats
Focus of the Government of India on infrastructure growth
Growth in Automobile Sector
Chinese tyre manufacturers
Volatility in raw material prices

12 Plants across India
141 Jk Tyre selling points
4000 Dealers
23 Tyre Truck Wheels
150+ JK Tyre Steel Wheels
Market Leader in TBR Segment
Key Partners

6953 Cr
Ranked No. 1 in Customer (OEM) Satisfaction by JD Power Asia Pacific Study 2015
Awarded brand of the year 2015 by world branding forum London.
JK Tyre -TATA Motors Best Supplier of the Year - at TATA Motors vendor’s conference 2015 in Pune
National Award for Excellence in Talent Management 2015
Product Mix: Till 2010 2015-2016
65% revenues from Bias
Tyres
58% revenues from Radial
Tyres
Aggressive in new product launches according to customer needs. In 2016 itself JK launched 121 products
They are trying to penetrate into the two wheeler segment in recent years
JK tyre intend to reinforce their position as one of the brands recalled by customers for endurance, service, choice and price value

STRENGHTS They have wide distribution network They have built a very good brand name over decades
and are an aggressive company They are continuously innovating and improving the
efficiency levels Market Leader in TBR segment
WEAKNESSES Limited market share due to the presence of other major
brands in the segment Low presence in two/three wheeler segment
OPPORTUNITIRES Emerging markets and improved lifestyle More tie-ups with Automobile companies as it’s mainly
into B2B market. Horizontal and concentric Diversification Improved Infrastructure has fuelled more and more
transportation Emergence of India as a hub for small car production
THREATS China’s product dumping Stiff competition from national and international brands Volatality in raw material prices Government Policies w.r.t export duties, import duties,
tax levied on automobile industries and economic condition of nation as it determines the sale of automobiles
SWOT
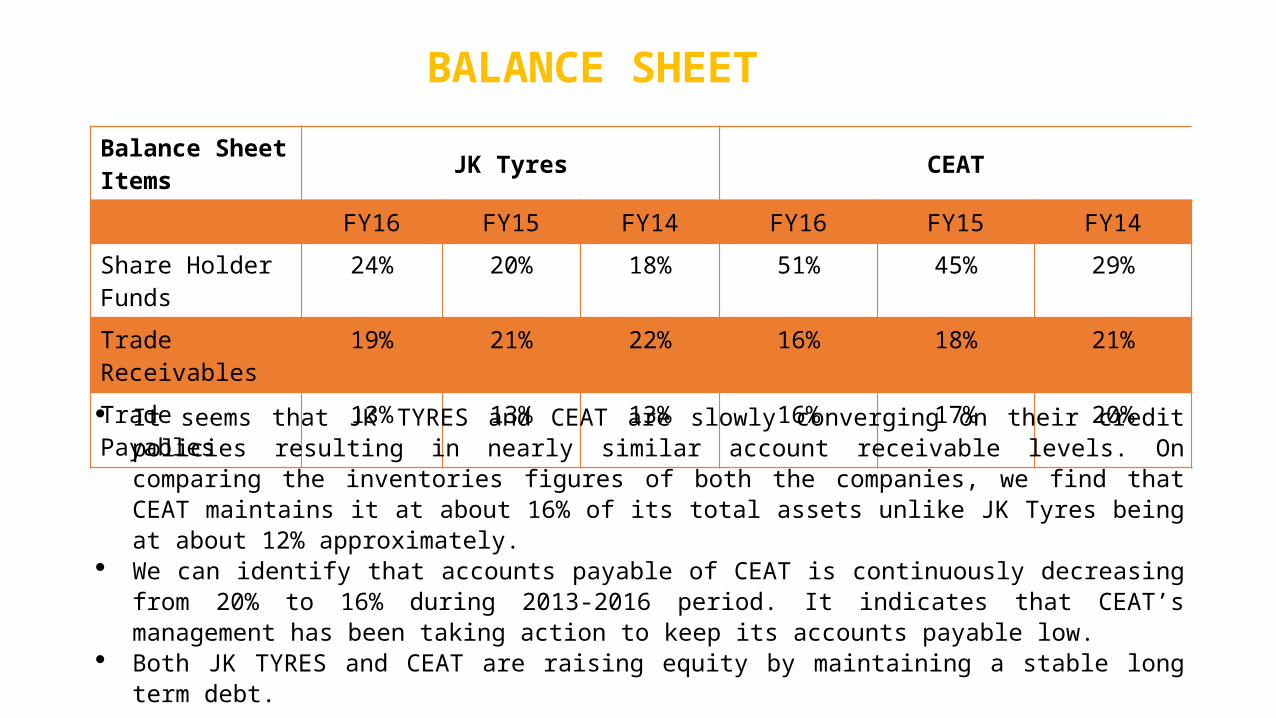
Balance Sheet Items JK Tyres CEAT
FY16 FY15 FY14 FY16 FY15 FY14
Share Holder Funds 24% 20% 18% 51% 45% 29%
Trade Receivables 19% 21% 22% 16% 18% 21%
Trade Payables 13% 13% 13% 16% 17% 20%
It seems that JK TYRES and CEAT are slowly converging on their credit policies resulting in nearly similar account receivable levels. On comparing the inventories figures of both the companies, we find that CEAT maintains it at about 16% of its total assets unlike JK Tyres being at about 12% approximately.
We can identify that accounts payable of CEAT is continuously decreasing from 20% to 16% during 2013-2016 period. It indicates that CEAT’s management has been taking action to keep its accounts payable low.
Both JK TYRES and CEAT are raising equity by maintaining a stable long term debt.
BALANCE SHEET

Better operating efficiencies, all-round cost reduction,
deeper rural penetration, launch of several new products across categories and stable input costs by JK TYRES and reduction in the Finance cost & cost of materials consumed by CEAT helped the companies achieve this significant improvement in performance.
We can also identify that there has been a decrease in the COGS and total expenses made by both the companies, which resulted in the inclining trend of net profits.
INCOME STATEMENT

ANALYSIS POINTS JK TYRES CEAT
MAJOR SOURCES OF CASH
Cash from operations - 902Borrowings - 301
Cash from operations-687Borrowings - 499
Short term buyer credit – 142
MAJOR USES OF CASH DURING THE PERIOD.
Purchase of Fixed Assets – 559Repayments – 432
Finance Costs – 250
Purchase of Fixed Assets – 706Repayments – 629
CASH FLOWS FROM OPERATIONS COMPARED TO NET PROFIT FIGURES OF THE FIRM. CF0 – 902 > Net Profit – 453
CF0 – 687 > Net Profit – 445.
IS CASH FROM OPERATIONS GREATER THAN CAPEX?
YES, CFO – 902 > CAPEX – 559
No.CAPEX – 706 > CFO – 687
CASHFLOW STATEMENT

ANALYSIS POINTS JK TYRES CEAT
CASH FROM OPERATIONS > CAPEX+INT PAID+ DIV PAID? IF YES, WHERE WAS THE
EXCESS CASH INVESTED?
IF NO, WHAT ARE THE SOURCES OF CASH FOR PAYMENT OF DIV, INT AND CAPEX?
CFO – 902CAPEX+INT PAID+ DIV PAID =850. NA YES.Net borrowings, CFO.
CFO – 687CAPEX+INT PAID+ DIV PAID – 890 NA YES.Net Borrowings, CFO.
Both the companies are generating good amount of cash from operations which shows the characteristics of a matured company.

2016 2015 2014 2016 2015 2014JK CEAT
-30
-20
-10
0
10
20
30
40
ACTIVITY RATIOS
Inventory Turnover Ratio Receivables Turnover Ratio Payables Turnover Ratio Working Capital Turnover Ratio
Though the average inventory on hand is 60 days a year for the both companies comparatively CEAT turns 5 times a year, where JK inventory turns over 4 times a year, which shows that CEAT is playing a volume game.
Comparatively CEAT has higher receivables turnover ratio than JK which means that it is collecting more receivables throughout the year.
Comparatively CEAT has higher payables turnover ratio than JK which means that it is paying more frequently and regularly.
JK has better working capital turnover ratio than CEAT as it has high turnover ratio, which means JK is efficiently using firm’s short term assets and liabilities. CEAT which has comparatively low ratio indicates that it is investing in too many accounts receivables and inventory assets to support its sale.

2016 2015 2014 2016 2015 2014JK CEAT
0
0.2
0.4
0.6
0.8
1
1.2
1.4
LIQUIDITY RATIO
Current Ratio Quick Ratio Cash Ratio
The ideal current ratio is 2. If we identify, both the companies have less current ratio but comparatively CEAT has a better current ratio. The reason for JK’s current ratio being less than 1 is there has been an increase in the short term borrowings of the company.
The average quick ratio of JK and CEAT is almost 0.5, which means that the company can cover it’s 50% of current liabilities through its quick assets. CEAT is mainly dependent on inventory to cover its liabilities.
Both the companies do not have sufficient cash and cash equivalents to cover its current liabilities. CEAT has better cash conversion cycle i.e. on an average CEAT is taking 30 days in converting its sales into cash,
whereas JK is taking 50 days on an average to convert its sales into cash.

2016 2015 2014 2016 2015 2014
0.76 0.8 0.820.5 0.55 0.7
3.2
3.93
4.51
0.971.23
2.41
3.77
3.092.58
8.8
5.17
3.91
SOLVENCY RATIO
Debt-Asset Ratio Debt-Equity Ratio Interest Coverage Ratio
Both the companies have good Debt Asset Ratio, which is less than 1. It shows that the companies have more assets than liabilities and could pay off its obligations by selling its assets if it needed to and both companies are not exposed to risk.
JK is exposed to more risk than CEAT, because JK has more debt to equity ratio. JK has a stable interest coverage whereas CEAT has an increase in the interest coverage ratio because of increase in its ebit and
decrease in interest expense.

2016 2015 2014 2016 2015 2014JK CEAT
0
0.05
0.1
0.15
0.2
0.25
0.3
0.35
0.4
PROFITABILITY RATIOS
Gross Profit Margin Net Profit Margin Operating Gross ProfitROI ROA
2016 2015 2014 2016 2015 2014JK CEAT
0
5
10
15
20
25
PROFITABILITY RATIO
ROCE ROE
The gross profit of JK is higher than that of CEAT, because JK has been efficient in reducing their COGS which resulted in higher gross profits. Though JK has good gross profit its net profit is lower because of its increasing depreciation expenses and other expenses. Both the companies have stable operating gross profit.
Both the companies have good ROCE and ROE, but comparatively JK has edge over CEAT. Both companies are generating major portion of revenues through capital employed and a little from assets. Both the companies have a very little ROI but comparatively CEAT has better ROI.
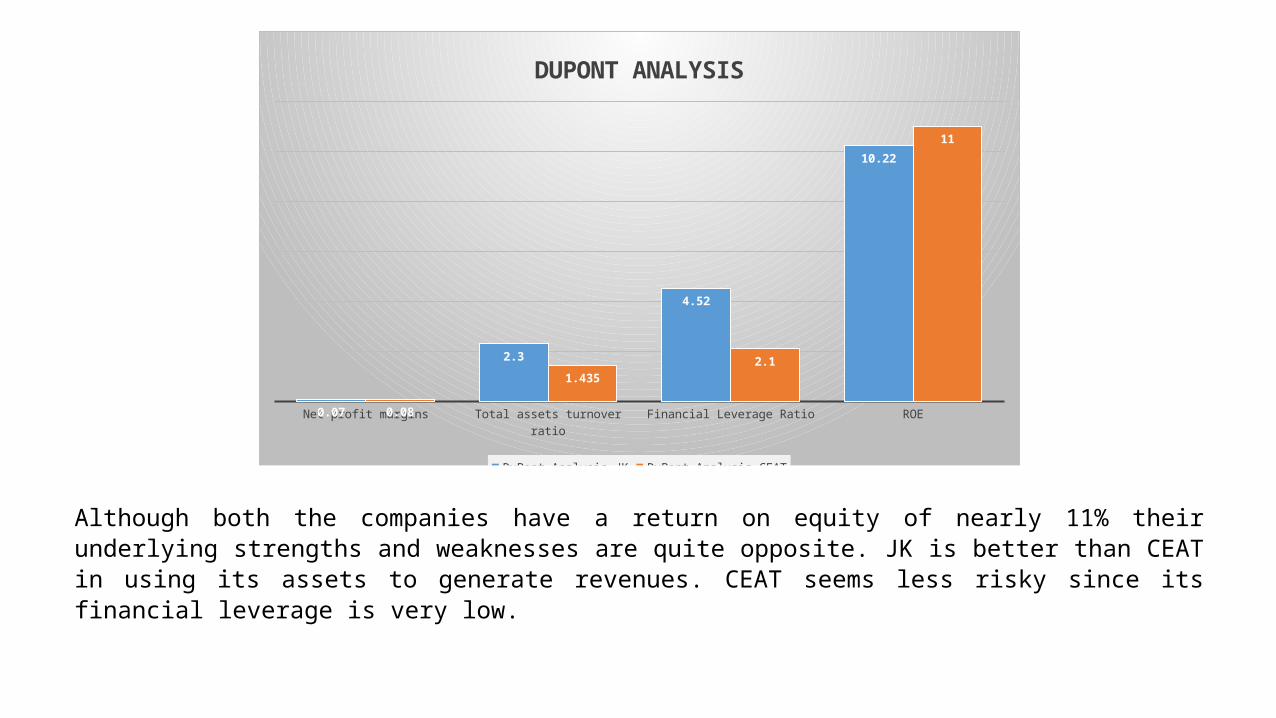
Net profit margins Total assets turnover ratio Financial Leverage Ratio ROE0.07
2.3
4.52
10.22
0.08
1.4352.1
11
DUPONT ANALYSIS
DuPont Analysis JK DuPont Analysis CEAT
Although both the companies have a return on equity of nearly 11% their underlying strengths and weaknesses are quite opposite. JK is better than CEAT in using its assets to generate revenues. CEAT seems less risky since its financial leverage is very low.

JK CEAT
ACTIVITY RATIO
LIQUIDITY RATIO
SOLVENCY RATIO
PROFITABILITY

WHERE TO INVEST?
• Though JK has 28% of share in the automobile sector, ratio analysis suggests that CEAT with 5% market share has strong financials .
• CEAT has better investment options as it can be understood by looking at its debt-equity ratio which is low when compared to JK.
• CEAT has better net profit margin when compared to JK.
• CEAT has better ROI than JK.
SO, on the whole CEAT has better investment options.