Embed Size (px)
Citation preview
Please refer to important disclosures at the end of this report 1
Y/E March (` cr) 2QFY11 2QFY10 % chg (yoy) 1QFY11 %chg (qoq)
Net Sales 1,139 941 20.9 1,168 (2.5)
EBITDA 74.5 136.9 (45.6) 68.6 8.5
EBITDA margin (%) 6.5 14.5 (800)bp 5.9 67bp
Reported PAT 20.2 59.5 (66.1) 19.5 3.4
Source: Company, Angel Research
JK Tyre (JK) reported decent top-line growth for 2QFY2011 following higher off-take in OE volumes. However, EBITDA margin declined substantially due to the sharp increase in rubber prices and other input cost. As a result, the company recorded a substantial dip in net profit despite the hike in product prices. We maintain a Buy on the stock owing to attractive valuations.
Top-line up 20.9%; OPM at 6.5%: JK Tyre reported turnover of `1,139cr (`941cr) for 2QFY2011, an increase of 20.9% yoy. Top-line growth was aided by volume growth of ~14% in tonnage terms and ~6% growth in net sales realisation. The company posted 45.6% yoy decline in operating profit to `74cr (`137cr) for 2QFY2011. Operating margin dipped by a substantial 800bp yoy basis primarily due to the spurt in rubber prices leading to a significant 1,187bp yoy increase in raw material cost to 70.6% (58.7%) of sales in 2QFY2011. Net profit came in at `20.2cr (`59.5cr), registering a 958bp yoy dip in NPM at 1.8% (6.3%).
Outlook and Valuation: We are revising downwards our earnings estimate owing to the rubber prices sustaining at high levels going ahead and the substantial impact on OPM thereof. Further, JK’s plans of incurring higher capex would leverage the balance sheet and poses downside risk to our earnings estimates. We estimate EPS of `31.1 for FY2011E and `40.4 for FY2012E. At the CMP of `160, the stock is available at attractive valuations of 5.2x and 4x FY2011E and FY2012E EPS, respectively. We maintain a Buy on the stock, with a Target Price of `202, based on 5x, 4.2x and 0.8x FY2012E EPS, EV/EBITDA and P/BV, respectively.
Key Financials (Consolidated)
Y/E March (` cr) FY2009* FY2010 FY2011E FY2012E
Net Sales (includes other. op. inc.) 5,523 4,571 5,588 6,362
% chg 97.6 (17.2) 22.3 13.9
Net Profit (108.0) 219.7 127.6 166.0
% chg - - (41.9) 30.1
OPM (%) 3.0 11.0 7.9 8.5
EPS (`) (26.3) 53.5 31.1 40.4
P/E (x) - 3.0 5.2 4.0
P/BV (x) 1.0 0.8 0.7 0.6
RoE (%) (31.2) 28.5 14.1 16.1
RoCE (%) 3.9 18.6 13.6 14.4
EV/Sales (x) 0.3 0.4 0.4 0.3
EV/EBITDA (x) 11.6 3.3 4.4 3.8 Source: Company, Angel Research; Note: *FY2009 numbers are for 18 months
BUY CMP `160 Target Price `202
Investment Period 12 Months
Stock Info
Sector
Bloomberg Code
Shareholding Pattern (%)
Promoters 47.0
MF / Banks / Indian Fls 28.1
FII / NRIs / OCBs 10.7
Indian Public / Others 14.2
Abs. (%) 3m 1yr 3yr
Sensex 12.5 28.0 1.8
JK Tyre (3.0) 8.5 20.8
6,119
JKIN.BO
658
0.9
236/144
163,010
Market Cap (Rs cr)
Beta
52 Week High / Low
10
20,346
JKI@IN
Face Value (Rs)
BSE Sensex
Nifty
Reuters Code
Tyre
Avg. Daily Volume
Vaishali Jajoo 022-4040 3800 Ext: 344
Yaresh Kothari 022-4040 3800 Ext: 313 [email protected]
JK Tyre Performance Highlights
2QFY2011 Result Update | Tyre
November 2, 2010
JK Tyre | 2QFY2011 Result Update
November 2, 2010 2
Exhibit 1: Quarterly performance (Standalone) Y/E March (` cr) 2QFY11 2QFY10 % chg 1HFY11 1HFY10 % chg
Net Sales (incl. otr. op. inc.) 1,139 941 20.9 2,306 1,842 25.2
Consumption of RM 804 553 45.4 1,644 1,124 46.3
(% of Sales) 70.6 58.7 71.3 61.0
Staff Costs 69.4 71.4 (2.8) 133.3 129.8 2.7
(% of Sales) 6.1 7.6 5.8 7.0
Purchase of TG 8.8 10.7 (18.4) 17.0 24.0 (29.2)
(% of Sales) 0.8 1.1 0.7 1.3
Other Expenses 181.9 169.4 7.4 364.2 320.4 13.7
(% of Sales) 16.0 18.0 15.8 17.4
Total Expenditure 1,064 804 32.3 2,159 1,599 35.1
Operating Profit 74.5 136.9 (45.6) 147.6 243.6 (39.4)
OPM (%) 6.5 14.5 6.4 13.2
Interest 20.7 23.4 (11.3) 41.5 49.2 (15.6)
Depreciation 22.7 22.2 2.3 45.1 41.4 8.9
Other Income 0.1 0.2 (13.3) 0.3 0.7 (57.6)
PBT (excl. Extr. Items) 31.2 91.5 (65.9) 61.3 153.7 (60.1)
(% of Sales) 2.7 9.7 2.7 8.3
Provision for Taxation 11.0 32.0 (65.6) 21.6 53.4 (59.5)
(% of PBT) 35.2 35.0 35.2 34.8
PAT Reported 20.2 59.5 (66.1) 39.7 100.3 (60.4)
PATM (%) 1.8 6.3 1.7 5.4
Equity capital (cr) 41.1 41.1 41.1 41.1
EPS (`) 4.9 14.5 (66.1) 9.7 24.4 (60.4)
Source: Company, Angel Research
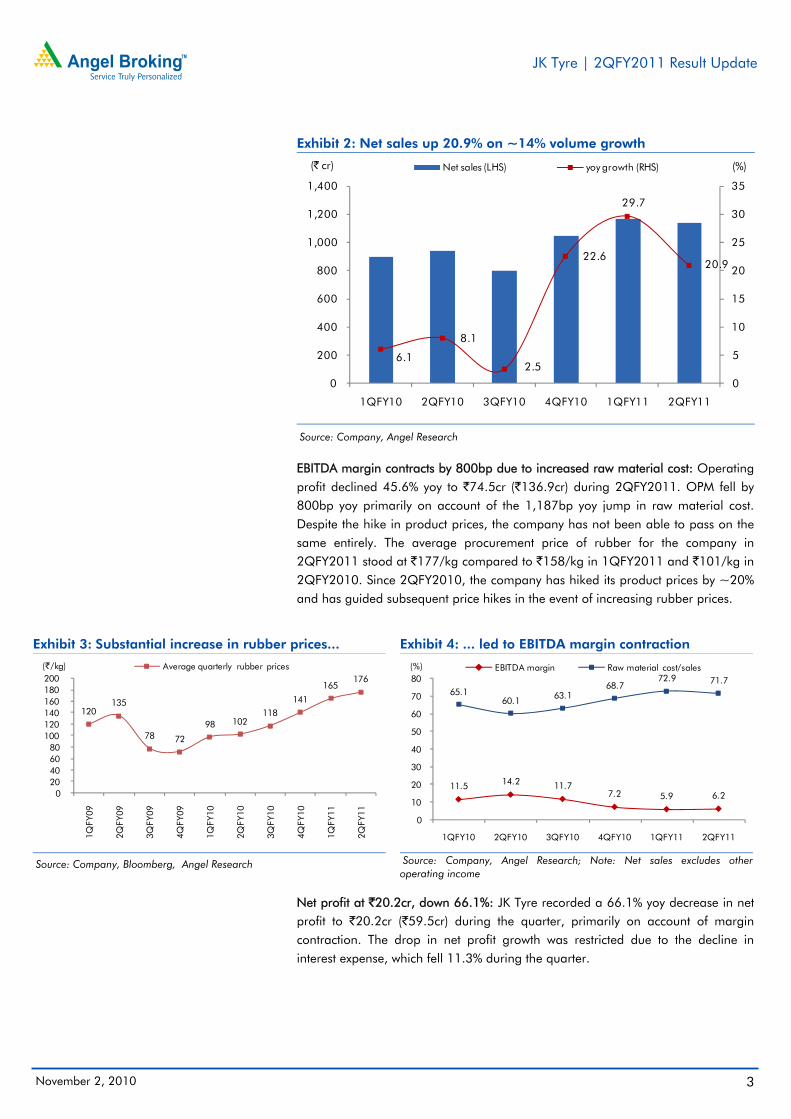
Top-line up 20.9%: JK Tyre reported 20.9% yoy growth in net sales to `1,139cr (`941cr) in 2QFY2011. In tonnage terms, the company registered ~14% yoy growth in volume, while net sales realisation grew ~6% during 2QFY2011. JK hiked its product prices by 2-3% in 2QFY2011 to pass through the increase in raw material cost. On the utilisation front, JK operated at higher utilisation levels of ~93%.
JK Tyre | 2QFY2011 Result Update
November 2, 2010 3
Exhibit 2: Net sales up 20.9% on ~14% volume growth
Source: Company, Angel Research
EBITDA margin contracts by 800bp due to increased raw material cost: Operating profit declined 45.6% yoy to `74.5cr (`136.9cr) during 2QFY2011. OPM fell by 800bp yoy primarily on account of the 1,187bp yoy jump in raw material cost. Despite the hike in product prices, the company has not been able to pass on the same entirely. The average procurement price of rubber for the company in 2QFY2011 stood at `177/kg compared to `158/kg in 1QFY2011 and `101/kg in 2QFY2010. Since 2QFY2010, the company has hiked its product prices by ~20% and has guided subsequent price hikes in the event of increasing rubber prices.
Exhibit 3: Substantial increase in rubber prices...
Source: Company, Bloomberg, Angel Research
Exhibit 4: ... led to EBITDA margin contraction
Source: Company, Angel Research; Note: Net sales excludes other operating income
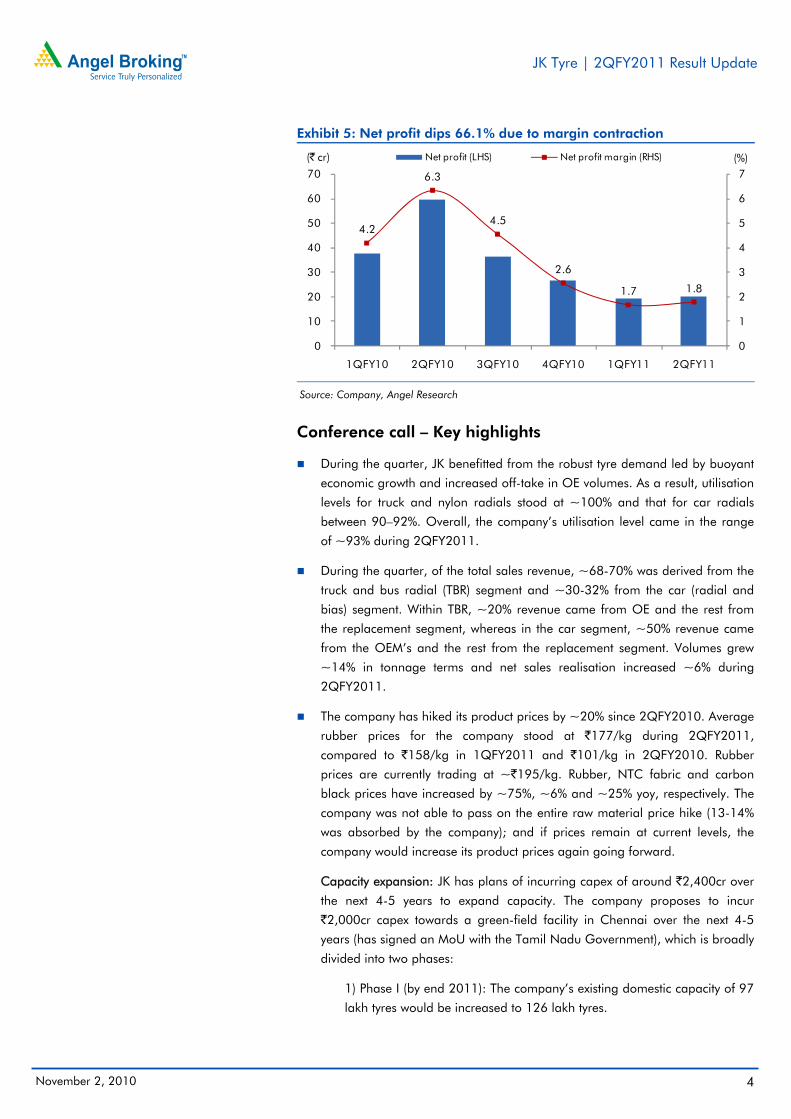
Net profit at `20.2cr, down 66.1%: JK Tyre recorded a 66.1% yoy decrease in net profit to `20.2cr (`59.5cr) during the quarter, primarily on account of margin contraction. The drop in net profit growth was restricted due to the decline in interest expense, which fell 11.3% during the quarter.
6.1
8.1
2.5
22.6
29.7
20.9
0
5
10
15
20
25
30
35
0
200
400
600
800
1,000
1,200
1,400
1QFY10 2QFY10 3QFY10 4QFY10 1QFY11 2QFY11
(%)(` cr) Net sales (LHS) yoy growth (RHS)
120 135
78 72
98 102 118
141
165 176
0 20 40 60 80
100 120 140 160 180 200
1QFY
09
2QFY
09
3QFY
09
4QFY
09
1QFY
10
2QFY
10
3QFY
10
4QFY
10
1QFY
11
2QFY
11
(`/kg) Average quarterly rubber prices
11.5 14.2 11.77.2 5.9 6.2
65.1 60.1 63.1
68.7 72.9 71.7
0
10
20
30
40
50
60
70
80
1QFY10 2QFY10 3QFY10 4QFY10 1QFY11 2QFY11
(%) EBITDA margin Raw material cost/sales
JK Tyre | 2QFY2011 Result Update
November 2, 2010 4
Exhibit 5: Net profit dips 66.1% due to margin contraction
Source: Company, Angel Research
Conference call – Key highlights
During the quarter, JK benefitted from the robust tyre demand led by buoyant
economic growth and increased off-take in OE volumes. As a result, utilisation
levels for truck and nylon radials stood at ~100% and that for car radials
between 90–92%. Overall, the company’s utilisation level came in the range
of ~93% during 2QFY2011.
During the quarter, of the total sales revenue, ~68-70% was derived from the
truck and bus radial (TBR) segment and ~30-32% from the car (radial and
bias) segment. Within TBR, ~20% revenue came from OE and the rest from
the replacement segment, whereas in the car segment, ~50% revenue came
from the OEM’s and the rest from the replacement segment. Volumes grew
~14% in tonnage terms and net sales realisation increased ~6% during
2QFY2011.
The company has hiked its product prices by ~20% since 2QFY2010. Average
rubber prices for the company stood at `177/kg during 2QFY2011,
compared to `158/kg in 1QFY2011 and `101/kg in 2QFY2010. Rubber
prices are currently trading at ~`195/kg. Rubber, NTC fabric and carbon
black prices have increased by ~75%, ~6% and ~25% yoy, respectively. The
company was not able to pass on the entire raw material price hike (13-14%
was absorbed by the company); and if prices remain at current levels, the
company would increase its product prices again going forward.
Capacity expansion: JK has plans of incurring capex of around `2,400cr over
the next 4-5 years to expand capacity. The company proposes to incur
`2,000cr capex towards a green-field facility in Chennai over the next 4-5
years (has signed an MoU with the Tamil Nadu Government), which is broadly
divided into two phases:
1) Phase I (by end 2011): The company’s existing domestic capacity of 97
lakh tyres would be increased to 126 lakh tyres.
4.2
6.3
4.5
2.6
1.7 1.8
0
1
2
3
4
5
6
7
0
10
20
30
40
50
60
70
1QFY10 2QFY10 3QFY10 4QFY10 1QFY11 2QFY11
(%)(` cr) Net profit (LHS) Net profit margin (RHS)
JK Tyre | 2QFY2011 Result Update
November 2, 2010 5
2) Phase II (18 months from completion of Phase I): Additional capacity of
30 lakh tyres; this would result in combined domestic capacity at 156 lakh
tyres per annum on completion of the expansion programme.
Thus, additional capacity of 4 lakh TBR tyres (~68tpd) and 25 lakh PCR tyres
(~64tpd) would be available at the Chennai facility by end of FY2012.
For FY2011, JK has planned capex of `930cr, of which `775cr would be
incurred at the Chennai facility and `155cr at the existing plants. We note
that, out of `930cr capex for FY2011, ~`200-250cr may spill over to the next
fiscal depending on the availability of machinery from the vendors. The capex
of `930cr would be funded through a combination of debt and internal
accruals. The company already has sanctioned loans of ~`630cr, the balance
~`300cr would be funded through internal accruals.
The company plans to increase capacity of its Mysore plant from 8 lakh TBR to
10 lakh TBR. Overall capacity (including Tornel) will increase to ~162 lakh
tyres by the end of Phase I and to ~196 lakh tyres by the end of Phase II.
Investment Arguments
Margins to increase on account of high investment on radials: Currently,
manufacturing radial tyres is far more capital-intensive than manufacturing
cross-ply tyres. Investment per TPD is 3.2x of cross-ply at `6.1cr per TPD. On
the other hand, selling prices of radial tyres are about 20% higher than cross-
ply tyres. Considering the difference in capital requirements and the
consequent impact on asset turnover, interest cost and depreciation cost, to
generate similar RoCE and RoE, tyre companies would need to earn EBITDA
margin of around 21% compared to around 9% being earned on cross-ply
tyres. Thus, higher capital requirements will help protect margins from upward
bound input costs, as the business model evolves bearing in mind final RoEs
rather than margins. We believe the expected structural shift and apparent
pricing flexibility in the sector will result in improved RoCE and RoE of tyre
manufacturers going forward.
Favourable product mix: Commissioning of the new T&B radial capacity in
October 2009 (up from 0.4mn to 0.8mn tyres), expansion of the PCR capacity
by 10% to 5mn tyres in FY2011 and the increase in the OTR segment in
FY2010 is working in favour of JK. Given the shortage of radial tyres in the
T&B segment, the company is in pole position to fully utilise its enhanced
capacity at higher realisations (~65-60% of India's total truck/bus radial tyre
production).
Tornel turns profitable: The Tornel acquisition could act as an upside trigger
for the JK Tyre’s stock. The acquisition turned profitable in FY2010, reporting
net profit of `60cr from net loss of `39.9cr in FY2009, aided by the
company’s ongoing restructuring exercise.
JK Tyre | 2QFY2011 Result Update
November 2, 2010 6
Outlook and Valuation
We are revising downwards our earnings estimate owing to the rubber prices sustaining at high levels going ahead and the substantial impact on OPM thereof. Further, JK’s plans of incurring higher capex would leverage the balance sheet and poses downside risk to our earnings estimates. We estimate EPS of `31.1 for FY2011 and `40.4 for FY2012.
At the CMP of `160, the stock is available at attractive valuations of 5.2x and 4x FY2011E and FY2012E EPS, respectively. We maintain a Buy on the stock, with a Target Price of `202, based on 5x, 4.2x and 0.8x FY2012E EPS, EV/EBITDA and P/BV, respectively.
Key Risk: Volatility in rubber prices dampening industry performance
With the Rubber Board scaling down the projections for natural rubber growth in the country, the tyre industry has expressed dismay over the impending rubber crisis. As per Automotive Tyre Manufacturers Association (ATMA), the scaling down of natural rubber growth projections will deepen the rubber availability crisis in the country as the gap between availability and its off-take has been widening. ATMA pointed out that India has scaled down the supply anticipated for this year to 844,000 tonnes from the earlier forecast of 879,000 tonnes largely on account of unseasonal heavy rains during October. The supply is anticipated to grow at a much slower rate of 2.9% as against 7.2% anticipated earlier.
Consumption of natural rubber is rising at a faster pace than its production. Rubber imports are, therefore, inevitable. However, rubber prices have been ruling at all-time high levels and the hefty 20% import duty is hurting bottom-lines of the tyre companies. At current prices, the import duty component alone amounts to around Rs38/kg. ATMA has, therefore, asked for easing the import duty on natural rubber to meet the shortfall. Under the currently applicable ad-valorem rate of duty when the rubber prices move up, consumers not only have to pay more to import natural rubber, but have to also bear the burden of the customs duty that goes up proportionately. For instance, when the rubber prices were at Rs80/kg last year, the 20% customs duty stood at Rs16/kg. When the price increased to above Rs190/kg the duty stood at Rs38/kg. ATMA has alluded to the import duty scenario in China where the import duty on sheet rubber is 20% or Yuan 1,600/tonne, whichever is less. Thus, at current international rubber prices of Yuan 30,500/tonne, the customs duty works out to just 5.2%.
JK Tyre | 2QFY2011 Result Update
November 2, 2010 7
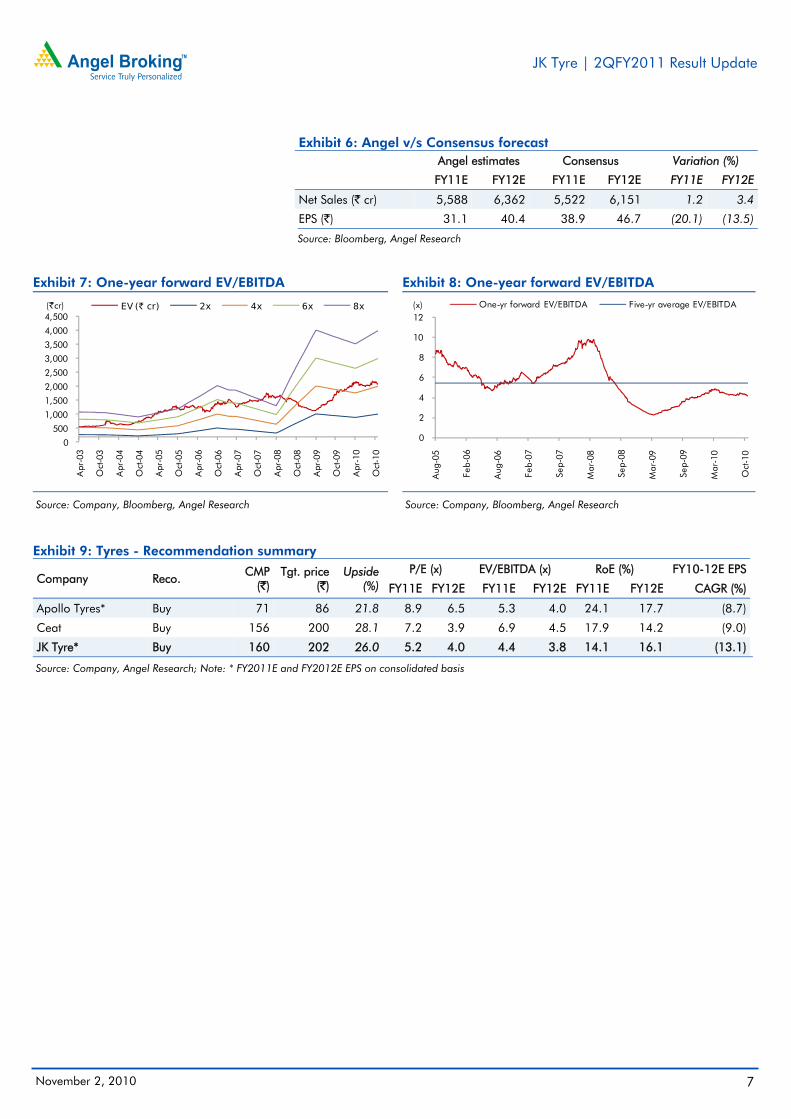
Exhibit 6: Angel v/s Consensus forecast
Angel estimates Consensus Variation (%)
FY11E FY12E FY11E FY12E FY11E FY12E
Net Sales (` cr) 5,588 6,362 5,522 6,151 1.2 3.4
EPS (`) 31.1 40.4 38.9 46.7 (20.1) (13.5)
Source: Bloomberg, Angel Research
Exhibit 7: One-year forward EV/EBITDA
Source: Company, Bloomberg, Angel Research
Exhibit 8: One-year forward EV/EBITDA
Source: Company, Bloomberg, Angel Research
Exhibit 9: Tyres - Recommendation summary
Company Reco. CMP
(`) Tgt. price
(`) Upside
(%) P/E (x) EV/EBITDA (x) RoE (%) FY10-12E EPS
FY11E FY12E FY11E FY12E FY11E FY12E CAGR (%)
Apollo Tyres* Buy 71 86 21.8 8.9 6.5 5.3 4.0 24.1 17.7 (8.7)
Ceat Buy 156 200 28.1 7.2 3.9 6.9 4.5 17.9 14.2 (9.0)
JK Tyre* Buy 160 202 26.0 5.2 4.0 4.4 3.8 14.1 16.1 (13.1)
Source: Company, Angel Research; Note: * FY2011E and FY2012E EPS on consolidated basis
0
500
1,000
1,500
2,000
2,500
3,000
3,500
4,000
4,500
Apr
-03
Oct
-03
Apr
-04
Oct
-04
Apr
-05
Oct
-05
Apr
-06
Oct
-06
Apr
-07
Oct
-07
Apr
-08
Oct
-08
Apr
-09
Oct
-09
Apr
-10
Oct
-10
(`cr) EV (` cr) 2x 4x 6x 8x
0
2
4
6
8
10
12
Aug
-05
Feb-
06
Aug
-06
Feb-
07
Sep-
07
Mar
-08
Sep-
08
Mar
-09
Sep-
09
Mar
-10
Oct
-10
(x) One-yr forward EV/EBITDA Five-yr average EV/EBITDA
JK Tyre | 2QFY2011 Result Update
November 2, 2010 8
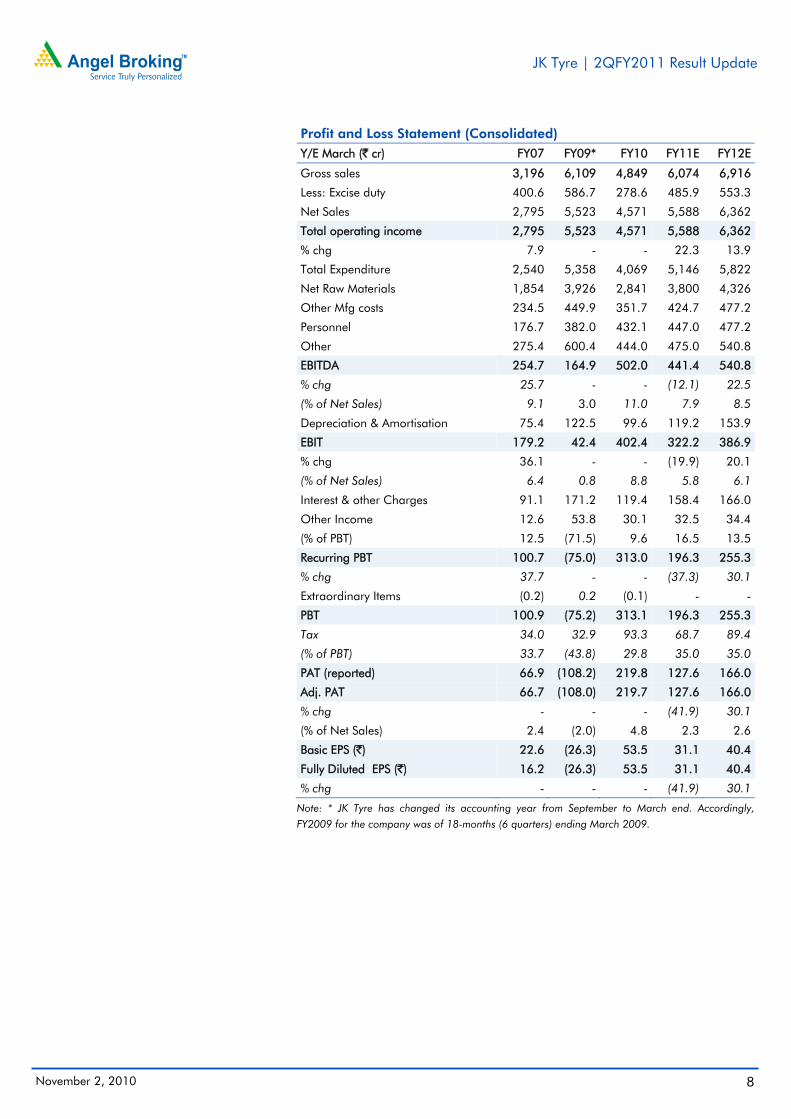
Profit and Loss Statement (Consolidated) Y/E March (` cr) FY07 FY09* FY10 FY11E FY12E
Gross sales 3,196 6,109 4,849 6,074 6,916
Less: Excise duty 400.6 586.7 278.6 485.9 553.3
Net Sales 2,795 5,523 4,571 5,588 6,362
Total operating income 2,795 5,523 4,571 5,588 6,362
% chg 7.9 - - 22.3 13.9
Total Expenditure 2,540 5,358 4,069 5,146 5,822
Net Raw Materials 1,854 3,926 2,841 3,800 4,326
Other Mfg costs 234.5 449.9 351.7 424.7 477.2
Personnel 176.7 382.0 432.1 447.0 477.2
Other 275.4 600.4 444.0 475.0 540.8
EBITDA 254.7 164.9 502.0 441.4 540.8
% chg 25.7 - - (12.1) 22.5
(% of Net Sales) 9.1 3.0 11.0 7.9 8.5
Depreciation & Amortisation 75.4 122.5 99.6 119.2 153.9
EBIT 179.2 42.4 402.4 322.2 386.9
% chg 36.1 - - (19.9) 20.1
(% of Net Sales) 6.4 0.8 8.8 5.8 6.1
Interest & other Charges 91.1 171.2 119.4 158.4 166.0
Other Income 12.6 53.8 30.1 32.5 34.4
(% of PBT) 12.5 (71.5) 9.6 16.5 13.5
Recurring PBT 100.7 (75.0) 313.0 196.3 255.3
% chg 37.7 - - (37.3) 30.1
Extraordinary Items (0.2) 0.2 (0.1) - -
PBT 100.9 (75.2) 313.1 196.3 255.3
Tax 34.0 32.9 93.3 68.7 89.4
(% of PBT) 33.7 (43.8) 29.8 35.0 35.0
PAT (reported) 66.9 (108.2) 219.8 127.6 166.0
Adj. PAT 66.7 (108.0) 219.7 127.6 166.0
% chg - - - (41.9) 30.1
(% of Net Sales) 2.4 (2.0) 4.8 2.3 2.6
Basic EPS (`) 22.6 (26.3) 53.5 31.1 40.4
Fully Diluted EPS (`) 16.2 (26.3) 53.5 31.1 40.4
% chg - - - (41.9) 30.1
Note: * JK Tyre has changed its accounting year from September to March end. Accordingly,
FY2009 for the company was of 18-months (6 quarters) ending March 2009.
JK Tyre | 2QFY2011 Result Update
November 2, 2010 9
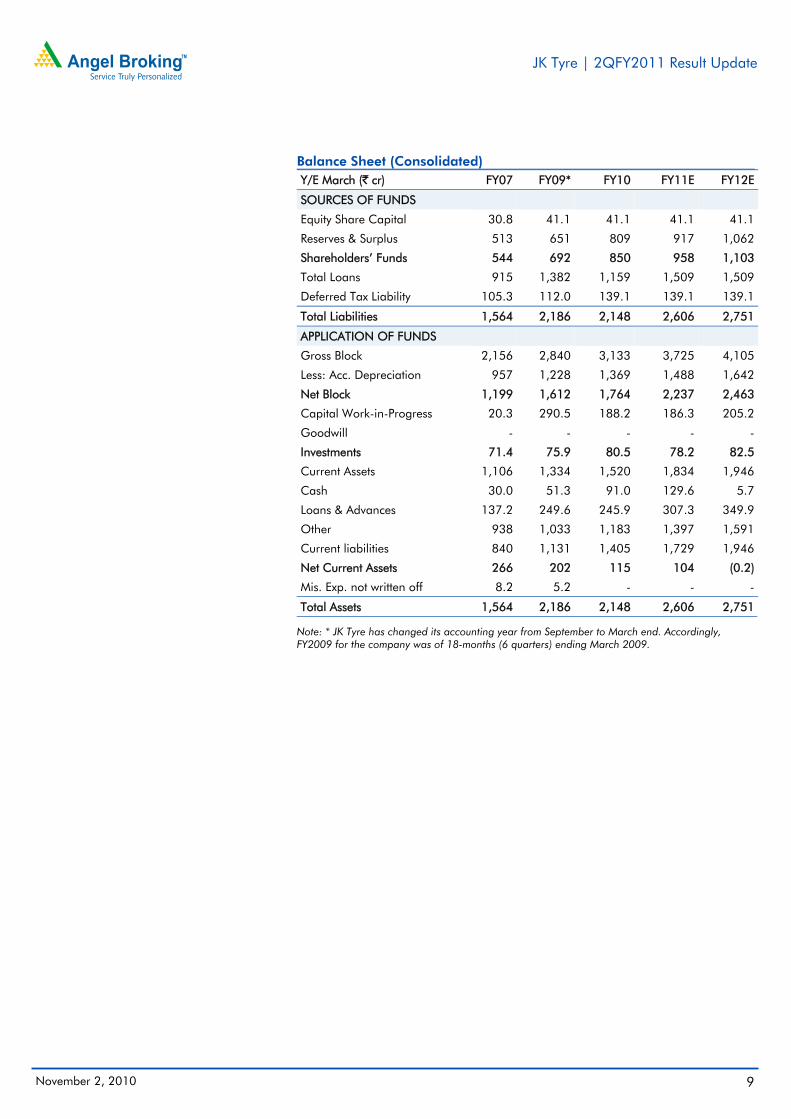
Balance Sheet (Consolidated) Y/E March (` cr) FY07 FY09* FY10 FY11E FY12E
SOURCES OF FUNDS
Equity Share Capital 30.8 41.1 41.1 41.1 41.1
Reserves & Surplus 513 651 809 917 1,062
Shareholders’ Funds 544 692 850 958 1,103
Total Loans 915 1,382 1,159 1,509 1,509
Deferred Tax Liability 105.3 112.0 139.1 139.1 139.1
Total Liabilities 1,564 2,186 2,148 2,606 2,751
APPLICATION OF FUNDS
Gross Block 2,156 2,840 3,133 3,725 4,105
Less: Acc. Depreciation 957 1,228 1,369 1,488 1,642
Net Block 1,199 1,612 1,764 2,237 2,463
Capital Work-in-Progress 20.3 290.5 188.2 186.3 205.2
Goodwill - - - - -
Investments 71.4 75.9 80.5 78.2 82.5
Current Assets 1,106 1,334 1,520 1,834 1,946
Cash 30.0 51.3 91.0 129.6 5.7
Loans & Advances 137.2 249.6 245.9 307.3 349.9
Other 938 1,033 1,183 1,397 1,591
Current liabilities 840 1,131 1,405 1,729 1,946
Net Current Assets 266 202 115 104 (0.2)
Mis. Exp. not written off 8.2 5.2 - - -
Total Assets 1,564 2,186 2,148 2,606 2,751
Note: * JK Tyre has changed its accounting year from September to March end. Accordingly, FY2009 for the company was of 18-months (6 quarters) ending March 2009.
JK Tyre | 2QFY2011 Result Update
November 2, 2010 10
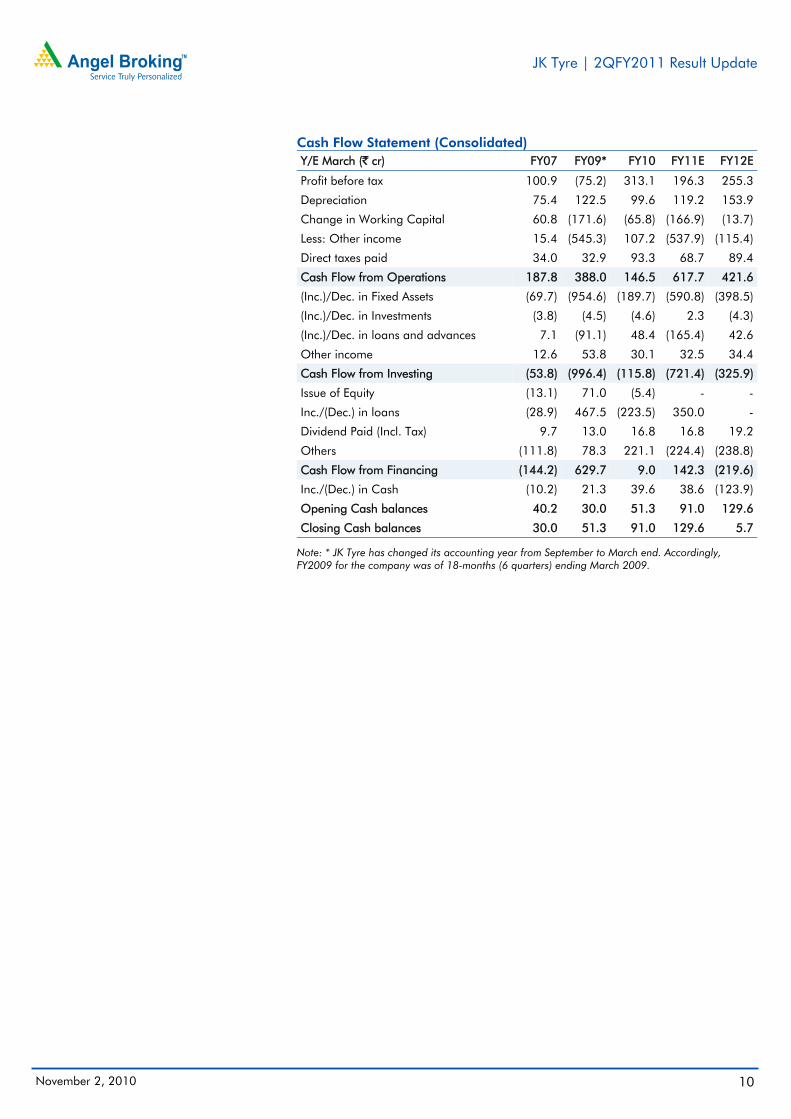
Cash Flow Statement (Consolidated) Y/E March (` cr) FY07 FY09* FY10 FY11E FY12E
Profit before tax 100.9 (75.2) 313.1 196.3 255.3
Depreciation 75.4 122.5 99.6 119.2 153.9
Change in Working Capital 60.8 (171.6) (65.8) (166.9) (13.7)
Less: Other income 15.4 (545.3) 107.2 (537.9) (115.4)
Direct taxes paid 34.0 32.9 93.3 68.7 89.4
Cash Flow from Operations 187.8 388.0 146.5 617.7 421.6
(Inc.)/Dec. in Fixed Assets (69.7) (954.6) (189.7) (590.8) (398.5)
(Inc.)/Dec. in Investments (3.8) (4.5) (4.6) 2.3 (4.3)
(Inc.)/Dec. in loans and advances 7.1 (91.1) 48.4 (165.4) 42.6
Other income 12.6 53.8 30.1 32.5 34.4
Cash Flow from Investing (53.8) (996.4) (115.8) (721.4) (325.9)
Issue of Equity (13.1) 71.0 (5.4) - -
Inc./(Dec.) in loans (28.9) 467.5 (223.5) 350.0 -
Dividend Paid (Incl. Tax) 9.7 13.0 16.8 16.8 19.2
Others (111.8) 78.3 221.1 (224.4) (238.8)
Cash Flow from Financing (144.2) 629.7 9.0 142.3 (219.6)
Inc./(Dec.) in Cash (10.2) 21.3 39.6 38.6 (123.9)
Opening Cash balances 40.2 30.0 51.3 91.0 129.6
Closing Cash balances 30.0 51.3 91.0 129.6 5.7
Note: * JK Tyre has changed its accounting year from September to March end. Accordingly, FY2009 for the company was of 18-months (6 quarters) ending March 2009.
JK Tyre | 2QFY2011 Result Update
November 2, 2010 11
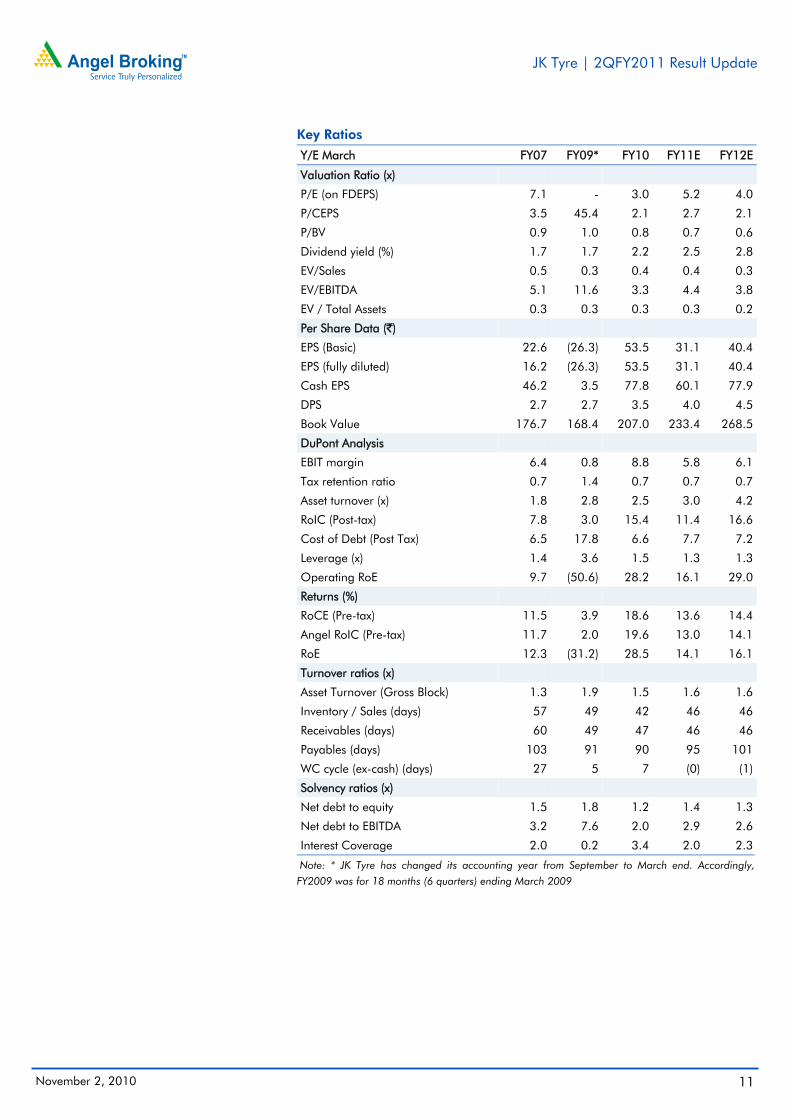
Key Ratios
Y/E March FY07 FY09* FY10 FY11E FY12E
Valuation Ratio (x)
P/E (on FDEPS) 7.1 - 3.0 5.2 4.0
P/CEPS 3.5 45.4 2.1 2.7 2.1
P/BV 0.9 1.0 0.8 0.7 0.6
Dividend yield (%) 1.7 1.7 2.2 2.5 2.8
EV/Sales 0.5 0.3 0.4 0.4 0.3
EV/EBITDA 5.1 11.6 3.3 4.4 3.8
EV / Total Assets 0.3 0.3 0.3 0.3 0.2
Per Share Data (`)
EPS (Basic) 22.6 (26.3) 53.5 31.1 40.4
EPS (fully diluted) 16.2 (26.3) 53.5 31.1 40.4
Cash EPS 46.2 3.5 77.8 60.1 77.9
DPS 2.7 2.7 3.5 4.0 4.5
Book Value 176.7 168.4 207.0 233.4 268.5
DuPont Analysis
EBIT margin 6.4 0.8 8.8 5.8 6.1
Tax retention ratio 0.7 1.4 0.7 0.7 0.7
Asset turnover (x) 1.8 2.8 2.5 3.0 4.2
RoIC (Post-tax) 7.8 3.0 15.4 11.4 16.6
Cost of Debt (Post Tax) 6.5 17.8 6.6 7.7 7.2
Leverage (x) 1.4 3.6 1.5 1.3 1.3
Operating RoE 9.7 (50.6) 28.2 16.1 29.0
Returns (%)
RoCE (Pre-tax) 11.5 3.9 18.6 13.6 14.4
Angel RoIC (Pre-tax) 11.7 2.0 19.6 13.0 14.1
RoE 12.3 (31.2) 28.5 14.1 16.1
Turnover ratios (x)
Asset Turnover (Gross Block) 1.3 1.9 1.5 1.6 1.6
Inventory / Sales (days) 57 49 42 46 46
Receivables (days) 60 49 47 46 46
Payables (days) 103 91 90 95 101
WC cycle (ex-cash) (days) 27 5 7 (0) (1)
Solvency ratios (x)
Net debt to equity 1.5 1.8 1.2 1.4 1.3
Net debt to EBITDA 3.2 7.6 2.0 2.9 2.6
Interest Coverage 2.0 0.2 3.4 2.0 2.3
Note: * JK Tyre has changed its accounting year from September to March end. Accordingly,
FY2009 was for 18 months (6 quarters) ending March 2009
JK Tyre | 2QFY2011 Result Update
November 2, 2010 12
Disclosure of Interest Statement JK Tyre 1. Analyst ownership of the stock No 2. Angel and its Group companies ownership of the stock No 3. Angel and its Group companies' Directors ownership of the stock No 4. Broking relationship with company covered No Note: We have not considered any Exposure below ` 1 lakh for Angel, its Group companies and Directors.
Ratings (Returns) : Buy (> 15%) Accumulate (5% to 15%) Neutral (-5 to 5%) Reduce (-5% to 15%) Sell (< -15%)
Research Team Tel: 022 - 4040 3800 E-mail: [email protected] Website: www.angeltrade.com DISCLAIMER This document is solely for the personal information of the recipient, and must not be singularly used as the basis of any investment decision. Nothing in this document should be construed as investment or financial advice. Each recipient of this document should make such investigations as they deem necessary to arrive at an independent evaluation of an investment in the securities of the companies referred to in this document (including the merits and risks involved), and should consult their own advisors to determine the merits and risks of such an investment.
Angel Broking Limited, its affiliates, directors, its proprietary trading and investment businesses may, from time to time, make investment decisions that are inconsistent with or contradictory to the recommendations expressed herein. The views contained in this document are those of the analyst, and the company may or may not subscribe to all the views expressed within.
Reports based on technical and derivative analysis center on studying charts of a stock's price movement, outstanding positions and trading volume, as opposed to focusing on a company's fundamentals and, as such, may not match with a report on a company's fundamentals.
The information in this document has been printed on the basis of publicly available information, internal data and other reliable sources believed to be true, but we do not represent that it is accurate or complete and it should not be relied on as such, as this document is for general guidance only. Angel Broking Limited or any of its affiliates/ group companies shall not be in any way responsible for any loss or damage that may arise to any person from any inadvertent error in the information contained in this report. Angel Broking Limited has not independently verified all the information contained within this document. Accordingly, we cannot testify, nor make any representation or warranty, express or implied, to the accuracy, contents or data contained within this document. While Angel Broking Limited endeavours to update on a reasonable basis the information discussed in this material, there may be regulatory, compliance, or other reasons that prevent us from doing so. This document is being supplied to you solely for your information, and its contents, information or data may not be reproduced, redistributed or passed on, directly or indirectly.
Angel Broking Limited and its affiliates may seek to provide or have engaged in providing corporate finance, investment banking or other advisory services in a merger or specific transaction to the companies referred to in this report, as on the date of this report or in the past.
Neither Angel Broking Limited, nor its directors, employees or affiliates shall be liable for any loss or damage that may arise from or in connection with the use of this information.
Note: Please refer to the important `Stock Holding Disclosure' report on the Angel website (Research Section). Also, please refer to the latest update on respective stocks for the disclosure status in respect of those stocks. Angel Broking Limited and its affiliates may have investment positions in the stocks recommended in this report.