Embed Size (px)
Citation preview
FOOD SECURITY WITH REFERENCE TO
PDS IN INDIA
BY NAMAMI GOHAIN
L-2012-BS-66-D
Food Security is “access by all people at all times to enough food for an active, healthy life.” (World Development Report, 1986)
“The ability to assure, on a long term basis, that the food system provides the total population access to timely, reliable and nutritionally adequate supply of food.” (Staatz, 1990)
When all people, at all times, have physical, social and economic access to sufficient, safe and nutritious food that meets their dietary needs and food preferences for an active and healthy life (FAO 2009).
DEFINING FOOD SECURITY

DIMENSIONS OF FOOD SECURITY
Food
Security
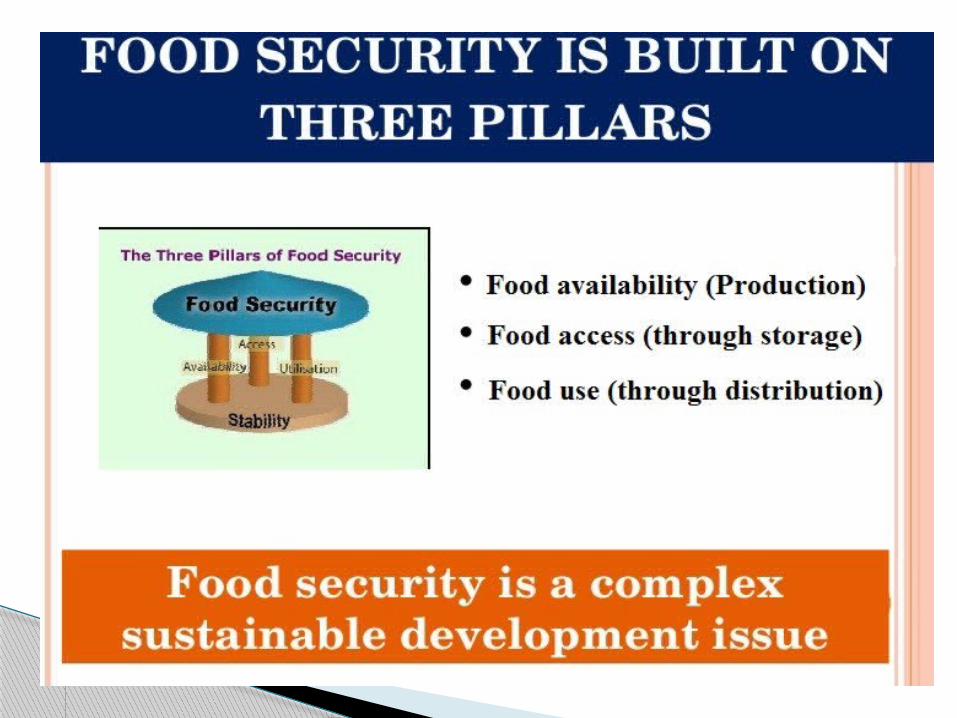
Physical Availability of Food
The supply side, determined by the levelOf food production, stock level & net trade.
Economic & Physical access to Food
Adequate supply of food does not guarantee household level food security. Food access depends on incomes,
expenditure, markets & prices in achieving food security objectives
Food UtilizationThe way the body makes the most of various nutrients in
the food. Involves care & feeding practices, food preparation, diversity of diet & intra-household distribution
of food.
Stability of the other 3 dimensions over time
Access on a periodic basis. Weather, political conditions or economic factors have an impact on food security status.
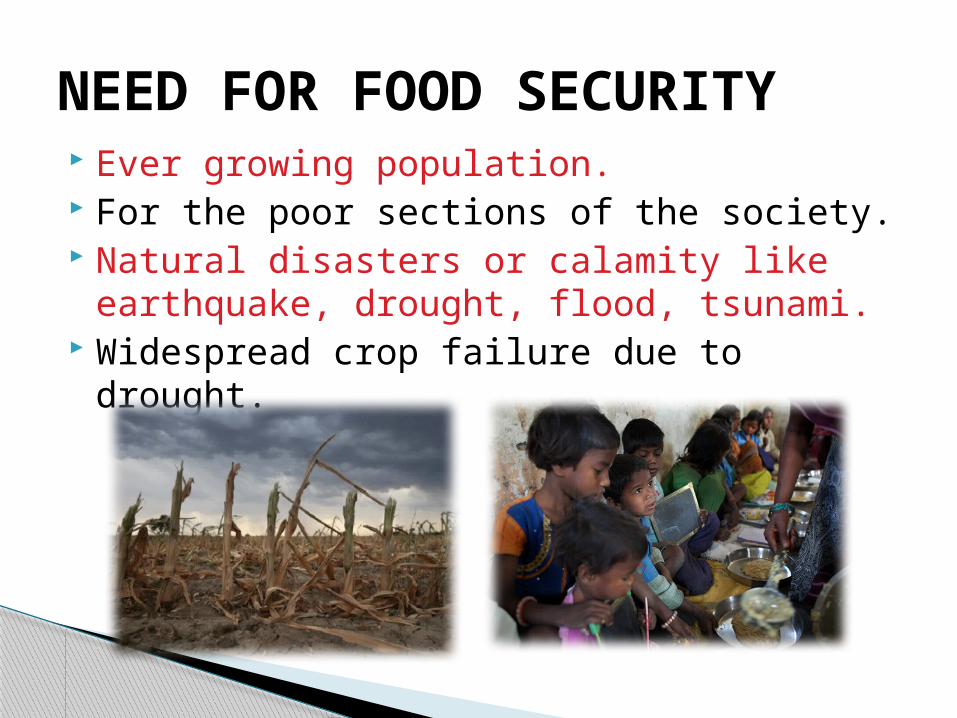
Ever growing population. For the poor sections of the society. Natural disasters or calamity like
earthquake, drought, flood, tsunami. Widespread crop failure due to drought.
NEED FOR FOOD SECURITY

A situation that exists when people lack secure access to sufficient amounts of safe and nutritious food for normal growth and development and an active and healthy life (FAO).
Food insecurity is a household situation, not an individual situation. While food insecurity affects everyone in a household, it may affect them differently.
Refers to lack of food access based on financial and other material resources.
FOOD INSECURITY
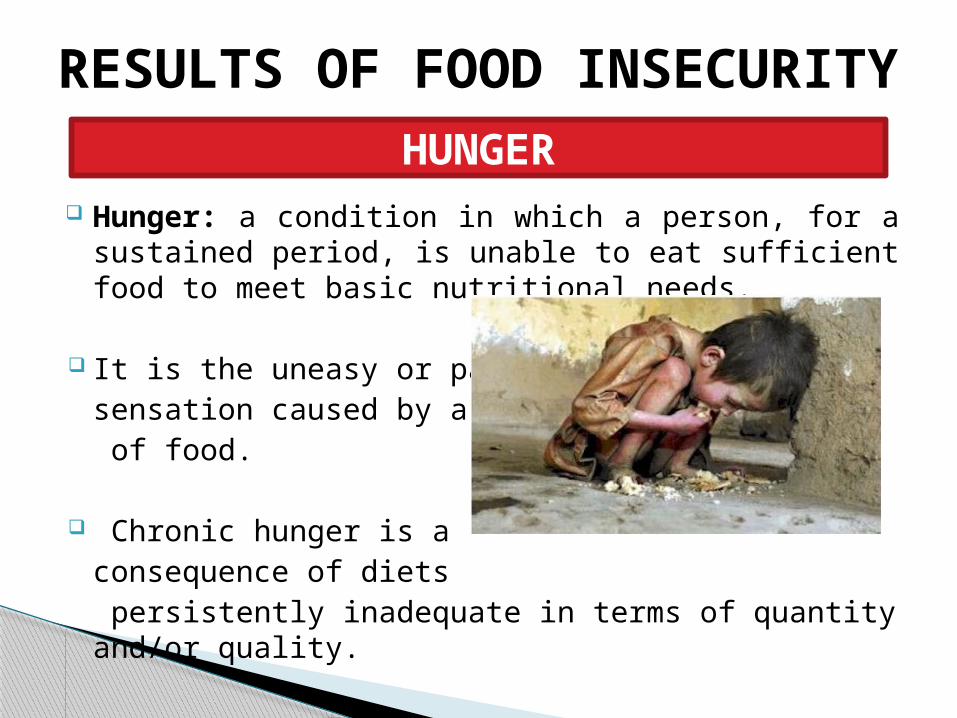
Hunger: a condition in which a person, for a sustained period, is unable to eat sufficient food to meet basic nutritional needs.
It is the uneasy or painful sensation caused by a lack of food.
Chronic hunger is a consequence of diets persistently inadequate in terms of quantity and/or quality.
RESULTS OF FOOD INSECURITY
HUNGER
A state of extreme hunger resulting from a lack of essential nutrients over a prolonged period.
It is the most extreme form of malnutrition. In humans prolonged starvation can cause permanent organ damage and eventually, death.
Malnutrition is a general term that indicates a lack of some or all nutritional elements necessary for human health.
Malnutrition is estimated to contribute to more than one third of all child deaths.
Lack of access to highly nutritious foods, especially in the present context of rising food prices, is a common cause of malnutrition
STARVATION
MALNUTRITION
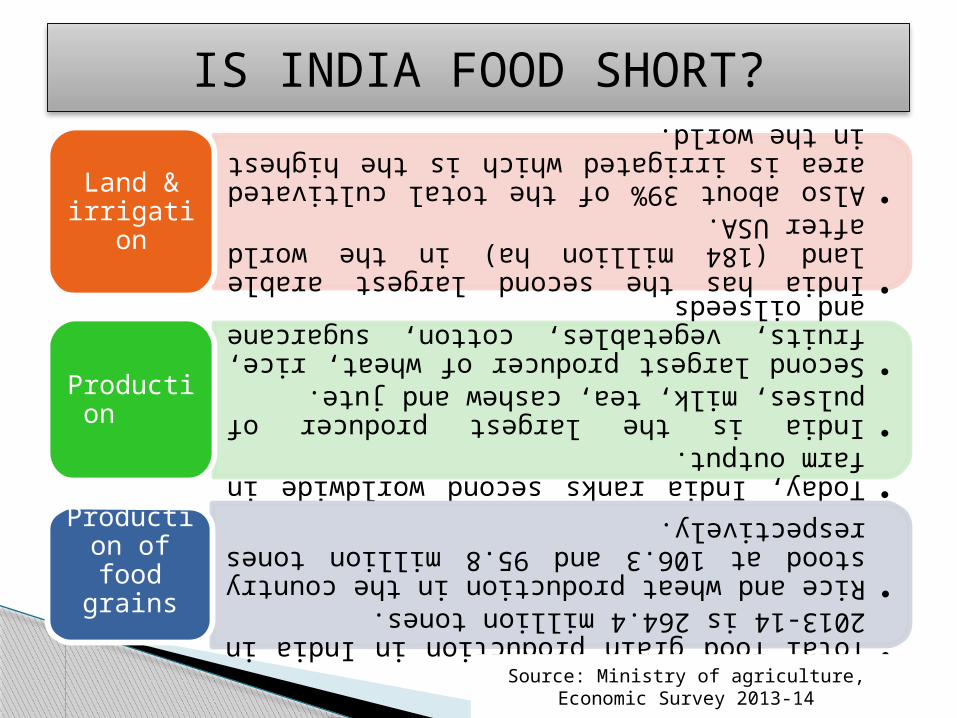
•India has the second largest arable land (184 million ha) in the world after USA.
•Also about 39% of the total cultivated area is irrigated which is the highest in the world.
Land & irrigation
•Today, India ranks second worldwide in farm output.
•India is the largest producer of pulses, milk, tea, cashew and jute.
•Second largest producer of wheat, rice, fruits, vegetables, cotton, sugarcane and oilseeds
Production
•Total food grain production in India in 2013-14 is 264.4 million tones.
•Rice and wheat production in the country stood at 106.3 and 95.8 million tones respectively.
Production of food grains
IS INDIA FOOD SHORT?
Source: Ministry of agriculture, Economic Survey 2013-14

India has 190.7 (15.2% of its population) million undernourished people
(FAO, 2014) 43% of the world's underweight children (WHO) 58% of the world's stunted children (WHO) over 46% undernourished children (WHO). According to latest Global Hunger Index report released on
October 13, 2014 by the International Food Policy Research Institute (IFPRI), India ranks 55 among 76 emerging economies, but is still trailing behind countries like Thailand, China, Ghana, Iraq, Sri Lanka and Nepal.
WHY ARE WE FOOD INSECURE
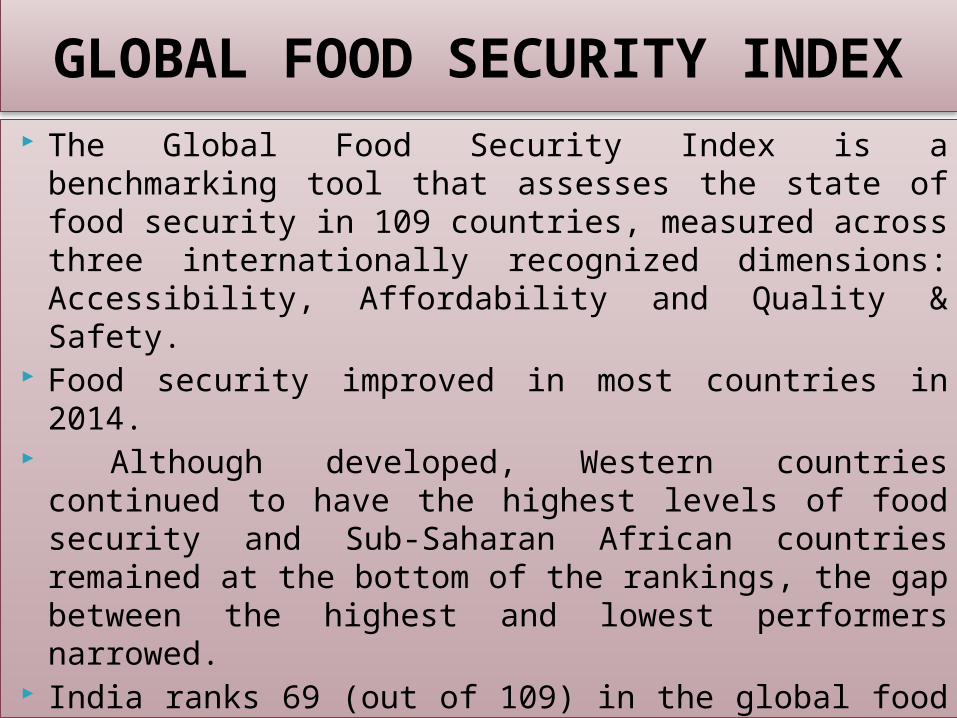
The Global Food Security Index is a benchmarking tool that assesses the state of food security in 109 countries, measured across three internationally recognized dimensions: Accessibility, Affordability and Quality & Safety.
Food security improved in most countries in 2014. Although developed, Western countries continued to have the highest
levels of food security and Sub-Saharan African countries remained at the bottom of the rankings, the gap between the highest and lowest performers narrowed.
India ranks 69 (out of 109) in the global food security index with a score of 48.3 (out of 100).
GLOBAL FOOD SECURITY INDEX

The issue of food security is very much related to:Increased agricultural productivityManagement of natural resources like land, water etc.Environmental protection
Through Green Revolution, India achieved self sufficiency in food grains by the year 1976 and since then Indian imports of cereals have remained negligible (except in 2006-07).
Between 1950-51 and 2013-14 food grains production has increased from 51 million tones to 264.4 million tones- a five fold increase in the production of food grains.
FOOD PRODUCTION IN INDIA (1st PILLAR)

YEAR FOOD GRAIN PRODUCTION (MILLION TONNES)
2000-01 196.8
2001-02 212.85
2002-03 174.77
2003-04 213.19
2004-05 198.36
2005-06 208.60
2006-07 217.28
2007-08 230.78
2008-09 234.47
2009-10 218.11
2010-11 244.49
2011-12 259.29
2012-13 257.13
2013-14 264.4
Source : Directorate of economics and statistics
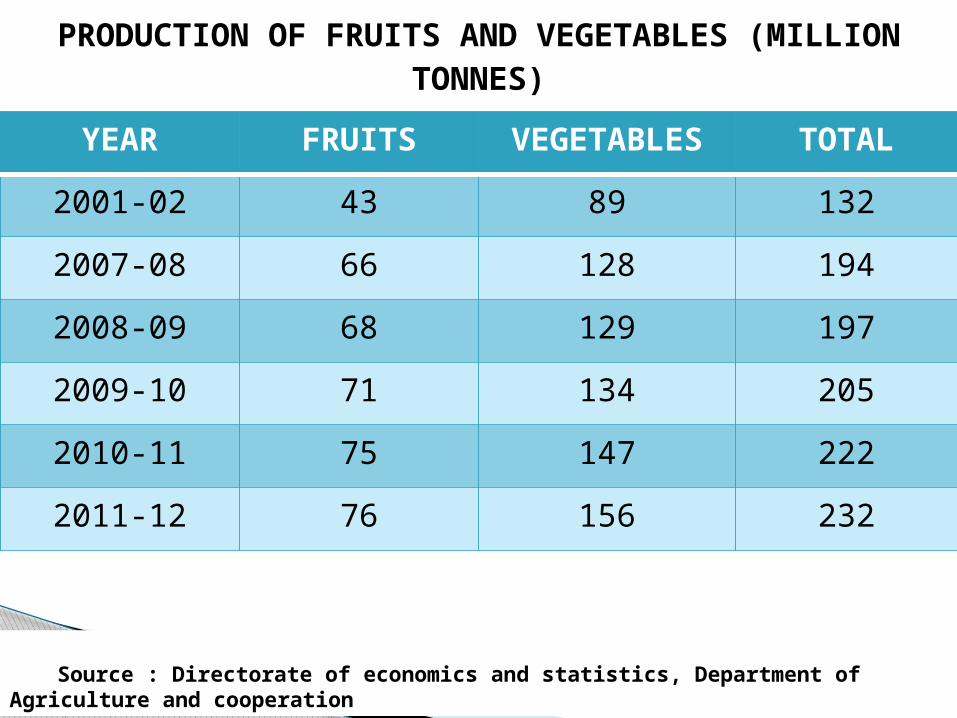
YEAR FRUITS VEGETABLES TOTAL
2001-02 43 89 132
2007-08 66 128 194
2008-09 68 129 197
2009-10 71 134 205
2010-11 75 147 222
2011-12 76 156 232
PRODUCTION OF FRUITS AND VEGETABLES (MILLION TONNES)
Source : Directorate of economics and statistics, Department of Agriculture and cooperation
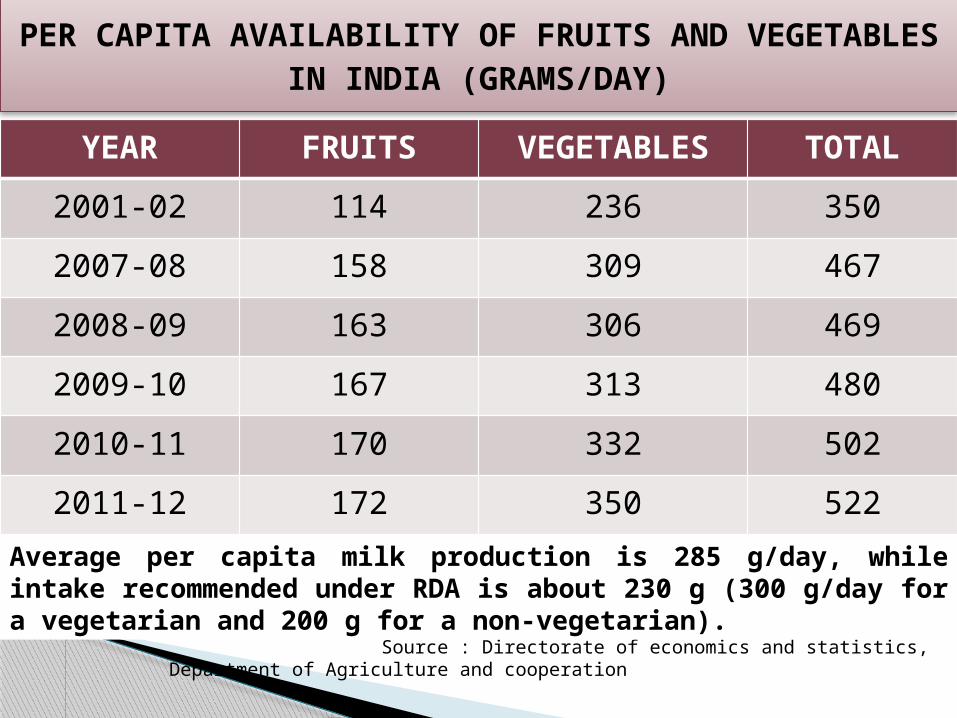
YEAR FRUITS VEGETABLES TOTAL
2001-02 114 236 350
2007-08 158 309 467
2008-09 163 306 469
2009-10 167 313 480
2010-11 170 332 502
2011-12 172 350 522
PER CAPITA AVAILABILITY OF FRUITS AND VEGETABLES IN INDIA (GRAMS/DAY)
Source : Directorate of economics and statistics, Department of Agriculture and cooperation
Average per capita milk production is 285 g/day, while intake recommended under RDA is about 230 g (300 g/day for a vegetarian and 200 g for a non-vegetarian).

The growth in food grain production has stagnated during recent past while the consumption need of the growing population is increasing.
To meet the growing food grain demand, National Development Council (NDC) in its 53rd meeting adopted a resolution to enhance the production of rice, wheat and pulses by 10, 8 and 2 million tonnes respectively by 2011.
The proposed Centrally Sponsored Scheme ‘National Food Security Mission (NFSM) launched from 2007-08 is to operationalize the resolution of NDC and enhance the production of rice, wheat and pulses.
The NFSM has three components (i) National Food Security Mission - Rice (NFSM-Rice); (ii) National Food Security Mission - Wheat (NFSM-Wheat); and National Food Security Mission - Pulses (NFSM Pulses).
NATIONAL FOOD SECURITY MISSION

Increasing production of rice, wheat and pulses through area expansion and productivity enhancement in a sustainable manner in the identified districts of the country;
Restoring soil fertility and productivity at the individual farm level;
Creation of employment opportunities; and
Enhancing farm level economy (i.e. farm profits) to restore confidence amongst the farmers.
MISSION OBJECTIVES

NFSM – Rice: Total States:12 Andhra Pradesh, Assam, Bihar, Chhattisgarh, Jharkhand, Karnataka,
Madhya Pradesh, Maharashtra, Orissa, Tamil Nadu, Uttar Pradesh and West Bengal.
Total identified districts: 133
NFSM – Wheat: Total States: 9 Bihar, Gujarat, Haryana, Madhya Pradesh, Maharashtra, Punjab, Rajasthan, Uttar Pradesh and West Bengal. Total identified districts: 138
NFSM – Pulses: Total States:14 Andhra Pradesh, Bihar, Chhattisgarh, Gujarat, Haryana, Karnataka, Madhya
Pradesh, Maharashtra, Orissa, Punjab, Rajasthan, Tamil Nadu, Uttar Pradesh and West Bengal
Total identified districts:168 Total States under NFSM: 16 Total identified districts under NFSM: 305
AREA OF OPERATION
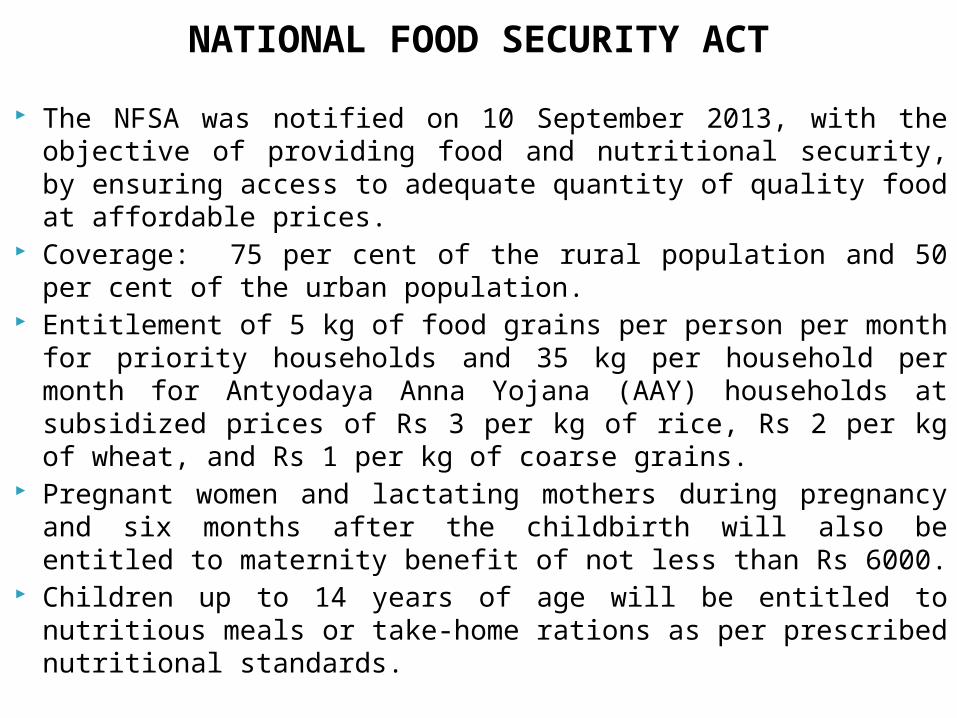
The NFSA was notified on 10 September 2013, with the objective of providing food and nutritional security, by ensuring access to adequate quantity of quality food at affordable prices.
Coverage: 75 per cent of the rural population and 50 per cent of the urban population.
Entitlement of 5 kg of food grains per person per month for priority households and 35 kg per household per month for Antyodaya Anna Yojana (AAY) households at subsidized prices of Rs 3 per kg of rice, Rs 2 per kg of wheat, and Rs 1 per kg of coarse grains.
Pregnant women and lactating mothers during pregnancy and six months after the childbirth will also be entitled to maternity benefit of not less than Rs 6000.
Children up to 14 years of age will be entitled to nutritious meals or take-home rations as per prescribed nutritional standards.
NATIONAL FOOD SECURITY ACT
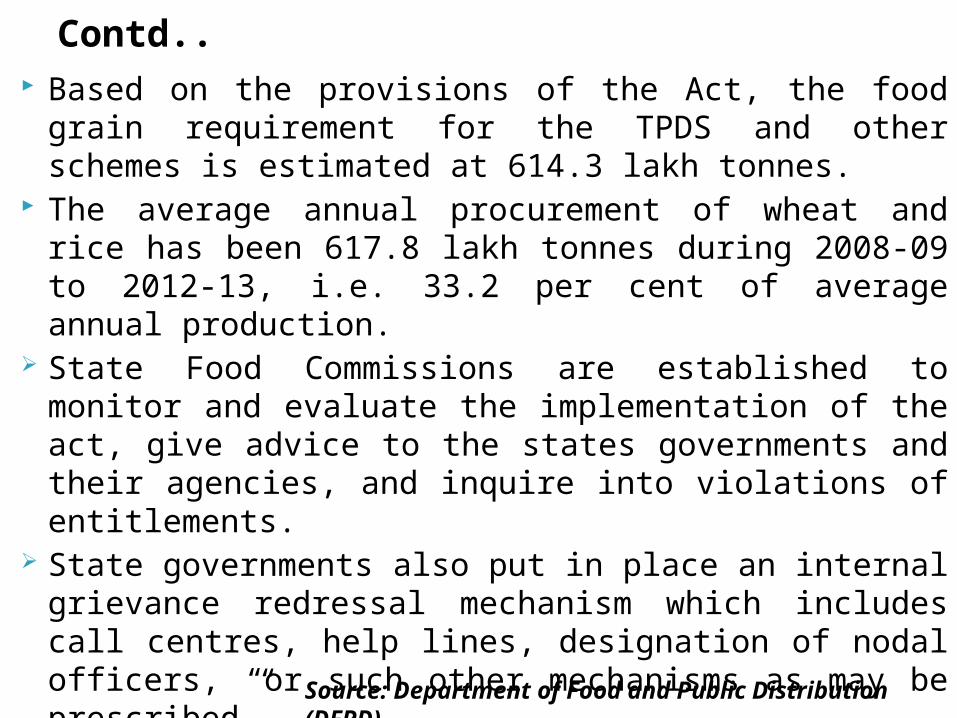
Based on the provisions of the Act, the food grain requirement for the TPDS and other schemes is estimated at 614.3 lakh tonnes.
The average annual procurement of wheat and rice has been 617.8 lakh tonnes during 2008-09 to 2012-13, i.e. 33.2 per cent of average annual production.
State Food Commissions are established to monitor and evaluate the implementation of the act, give advice to the states governments and their agencies, and inquire into violations of entitlements.
State governments also put in place an internal grievance redressal mechanism which includes call centres, help lines, designation of nodal officers, “or such other mechanisms as may be prescribed”.
The State Government appoints or designate the District Grievance Redressal Officer who shall hear complaints regarding non distribution of entitled food grains or meals and take necessary action for their redressal
Contd..
Source: Department of Food and Public Distribution (DFPD)

FCI is the main government agency entrusted with the storage of food grains in the central pool.
Total storage capacity of the FCI and state agencies is 74.35 million tonnes.
Food grains are normally stored in covered godowns, silos, and in the open, referred to as Covered and Plinth (CAP).
However, FCI’s own storage capacity has been insufficient to accommodate the central pool stock of food grains.
FCI hires space from various agencies such as the central and state warehousing corporations, state government agencies and private parties.
Average annual rate of increase in storage capacity of FCI is 4.5% Growth of rice and wheat stocks in central pool is more than 18%
STORAGE (2nd pillar)
More than 64% of country’s storage capacity in Punjab, Haryana, AP, MP and UP
Fourteen states/UTs account for more than 95 per cent of the country’s storage capacity
The remaining 21 states survive and manage on 5 per cent of the country’s storage capacity.
The dearth of storage capacity in these states implies a huge strain on the transport and distribution machinery of states.
Source: Evolution and Critique of Buffer Stocking Policy of India, Shweta Saini & Marta Kozicka
Contd..

State/UT Per cent of totalstorage capacity
Per cent of totalCWC warehouses
Per cent of totalSWC warehouses
Punjab 25.1 5 7
Uttar Pradesh 12.2 10 9
Haryana 9.8 6 6
Madhya Pradesh
8.9 6 16
Andhra Pradesh 8.4 10 8
Maharashtra 6.6 9 11
State-wise grain storage capacity (2014)
Source: Evolution and Critique of Buffer Stocking Policy of India, Shweta Saini & Marta Kozicka

Food GrainsFCI- nodal agency that undertakes open-ended procurement, distribution, and storage of food grains.
Coarse grains are procured by state governments and their agencies. Oilseeds & Pulses The National Agricultural Cooperative
Marketing Federation of India Limited (NAFED), National Cooperative Consumers’
Federation of India Limited (NCCF), CWC The Small Farmers’ Agribusiness
Consortium (SFAC)
PROCUREMENT
procurement of oilseeds and pulses under the Price Support Scheme (PSS)

Currently procurement is carried out in two ways: Centralised procurement : FCI buys crops directly from farmers. Decentralised procurement: central scheme under which 10 states/
(UTs) procure food grains for the central pool at MSP on behalf of FCI.
To encourage local procurement of food grains and minimise expenditure incurred when transporting grains from surplus to deficit states over long distances.
These states directly store and distribute the grains to beneficiaries in the state.
Any surplus stock over the state’s requirement must be handed over to FCI.
In case of a shortfall in procurement against an allocation made by the centre, FCI meets the deficit out of the central pool.
contd..

Procurement operations successful ◦ for rice and wheat ◦ in Punjab, Haryana, Andhra Pradesh, and Madhya Pradesh.
STATE -WISE PROCUREMENT OF RICE & WHEAT FOR THE CENTRAL POOL (2013-14) (fig in lakh MT)
STATE WHEAT RICE
Andhra Pradesh - 35.75 (13.67)
Chhatisgarh - 53.37 (20.41)
Haryana 58.73 (23.40) 23.97 (9.17)
MP 63.55 (25.32) 10.40 (3.97)
Odisha - 18.92 (7.23)
Punjab 108.97 (43.42) 81.06 (31.01)
Rajasthan 12.68 (5.05) 0.00
UP 6.83 (2.72) 10.70 (4.09)
Total 250.92 261.37
Source: Deptt. of Food and Public Distribution (Figures in parentheses indicate percentage)
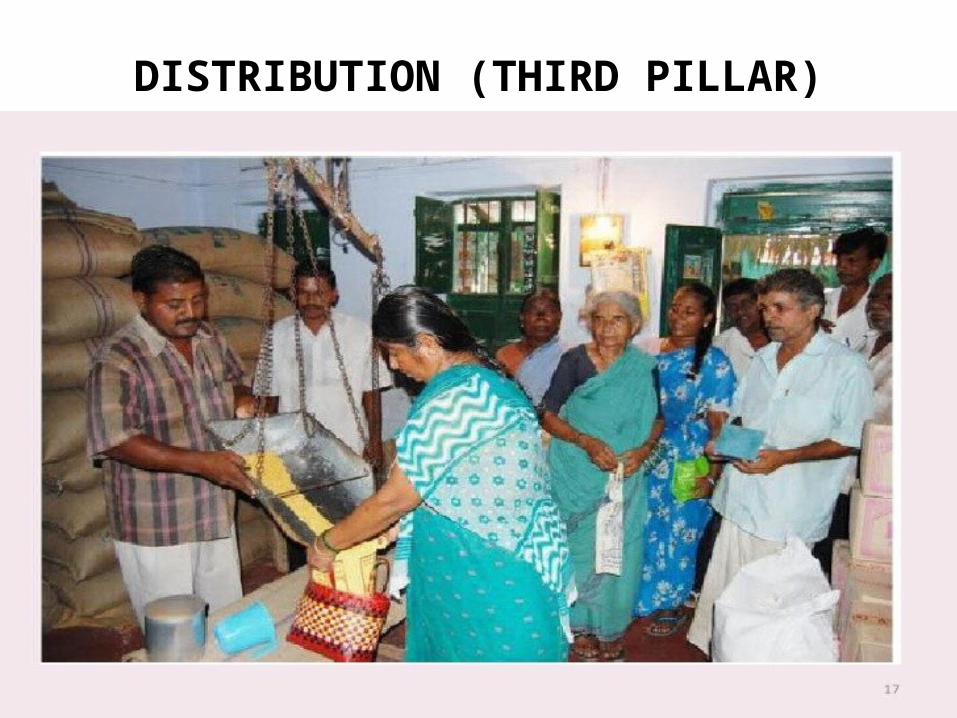
DISTRIBUTION (THIRD PILLAR)
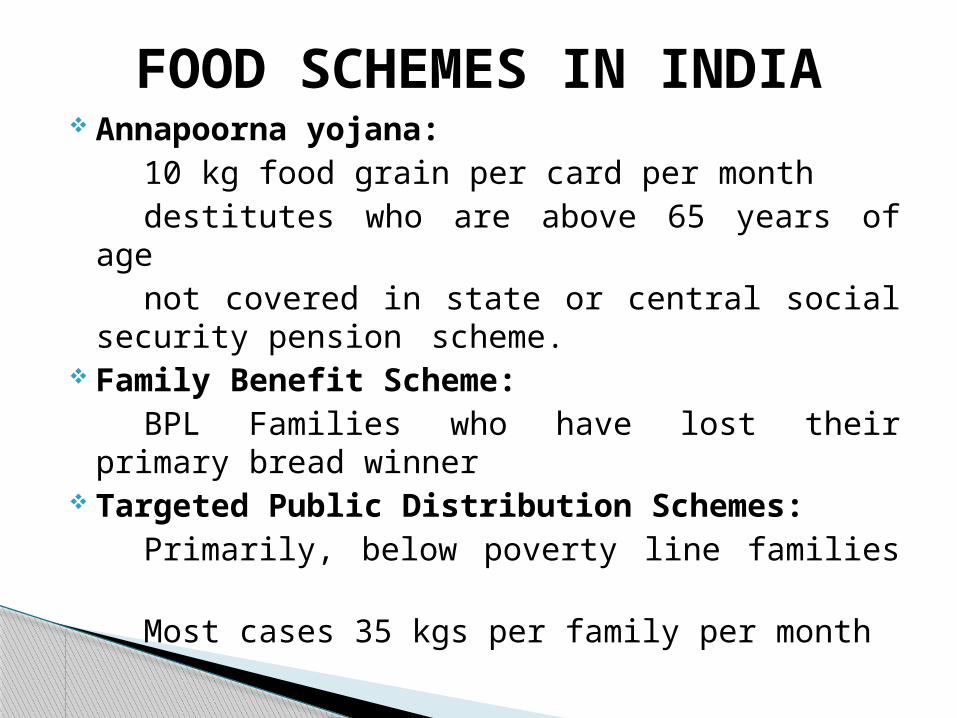
Annapoorna yojana: 10 kg food grain per card per month destitutes who are above 65 years of agenot covered in state or central social security pension scheme.
Family Benefit Scheme: BPL Families who have lost their primary bread
winner Targeted Public Distribution Schemes:
Primarily, below poverty line families Most cases 35 kgs per family per month
FOOD SCHEMES IN INDIA

Antyodaya Anna Yojana: Poorest of the poor in rural and urban areasThey are issued special yellow ration cards 35 kg food grain per family per month
Integrated Child Development Services: Pre-school children, adolescent girls, pregnant and lactating women
Mid-day Meal Scheme: All children in government and primary schools A fresh cooked meal each day, for at least 200 days a year.
Sampoorna Grameen Rozgar Yojana:Funds and food grains allocated to the States/UTs on the basis of proportion of the rural poor in a State to the total rural poor in the country.
Contd..

Definition: Public distribution system is a government-sponsored chain of shops (Fair price shops) entrusted with the work of distributing basic food and non-food commodities to the needy sections of the society at very cheap prices.
PDS is a national food security system that distributes subsidized food to India’s poor.
It means distribution of essential commodities to a large number of people through a network of Fair Price Shops (FPS) on recurring basis.
The commodities distributed are as follows:WheatRice SugarKerosene
PUBLIC DISTRIBUTION SYSTEM IN INDIA

PDS with a network of about 4.99 lakh Fair Price Shops (FPS) is perhaps the largest distribution network of its type in the world.
PDS is operated under the cooperative responsibility of the Central and the State Governments.
The Central Government has taken the responsibility for procurement, storage, transportation and bulk allocation of food grains, etc.
The responsibility for distributing essential commodities to the consumers through the network of Fair Price Shops (FPSs) rests with the State Governments.
The operational responsibilities including allotment within the State, recognition of families below poverty line, issue of ration cards, supervision and monitoring the functioning of FPS’s rest with the State Governments.
Contd..
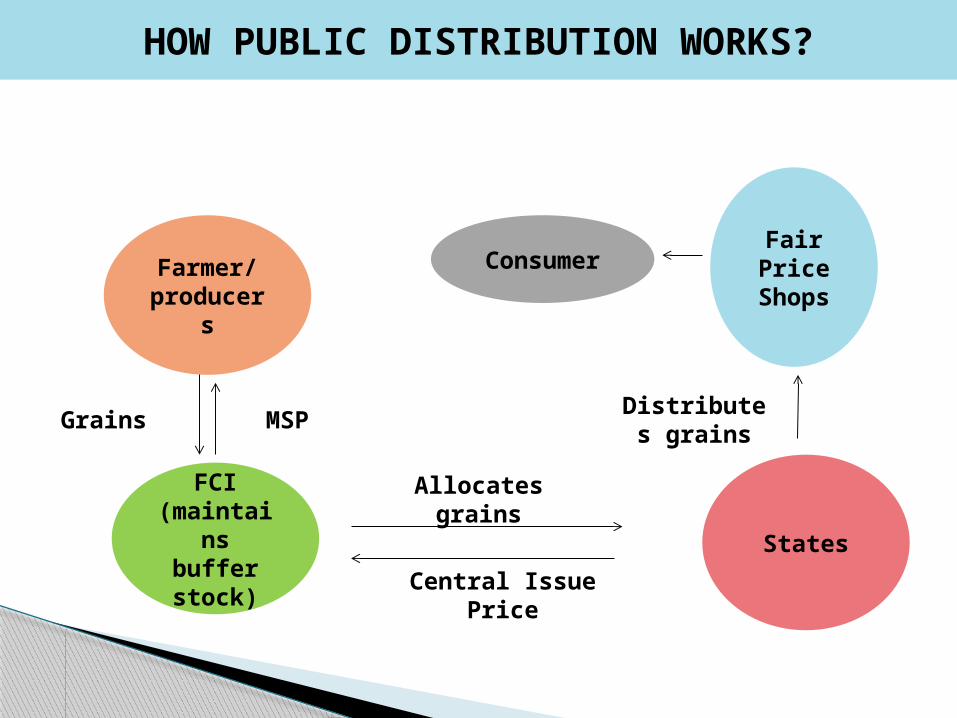
HOW PUBLIC DISTRIBUTION WORKS?
Farmer/producer
s
FCI (maintains buffer
stock)
ConsumerFair
Price Shops
States
Grains MSP
Allocates grains
Central Issue Price
Distributes grains

PDS said to have existed from before independence in India, and was initially intended to protect consumers from food shortages and producers from price fluctuations (Tarozzi 2002).
Originally started at a few urban centres, but extended in the 1980s as a measure for food security and poverty alleviation (DFPD 2010).
World war II, British government introduced the first structured public distribution of cereals in India through the rationing system in Bombay and Calcutta.
By the end of 1943, 13 cities had been brought under the coverage of rationing
EVOLUTION OF PDS

When the War ended in 1943, India abolished the rationing system.
In 1950 India reintroduced rationing owing to inflationary pressure in the economy .
Due to the ineffectiveness of Rationing System to reach the poorRevamped Public distribution System (RPDS) was launched on Jan
1, 1992 and made effective from June 1, 1992, in selected blocks (1775 blocks).
In June, 1997, Targeted Public distribution system (TPDS) was launched. To target the needy people and provide them an assured supply of food grains.
It aims to reach a target of 60 million families below poverty line.
Contd..
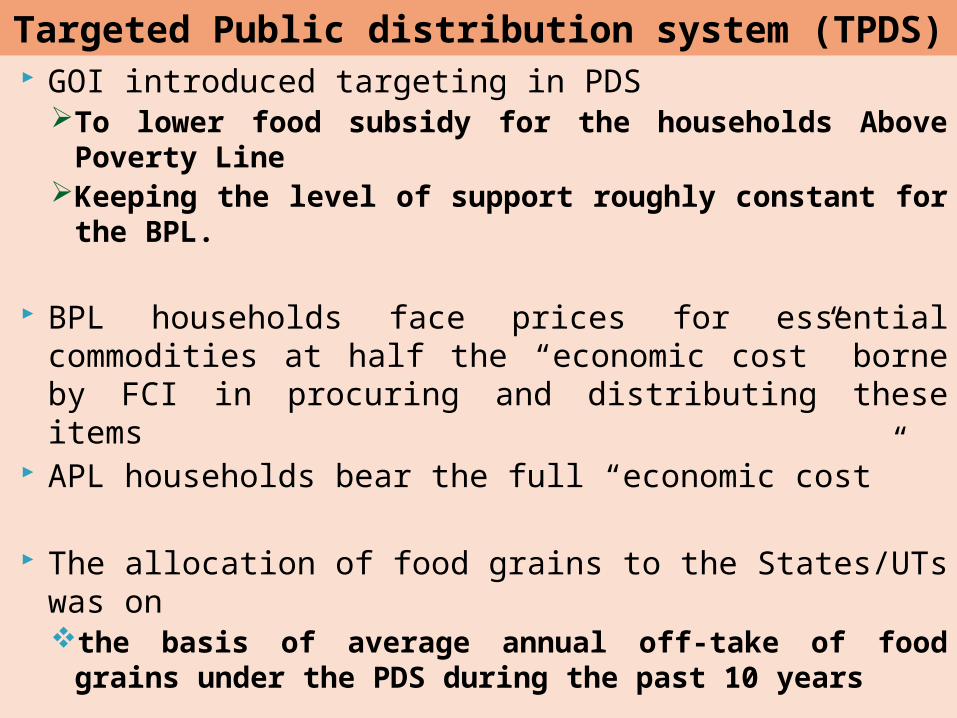
GOI introduced targeting in PDSTo lower food subsidy for the households Above Poverty LineKeeping the level of support roughly constant for the BPL.
BPL households face prices for essential commodities at half the “economic cost” borne by FCI in procuring and distributing these items
APL households bear the full “economic cost”
The allocation of food grains to the States/UTs was onthe basis of average annual off-take of food grains under the PDS
during the past 10 years
Targeted Public distribution system (TPDS)
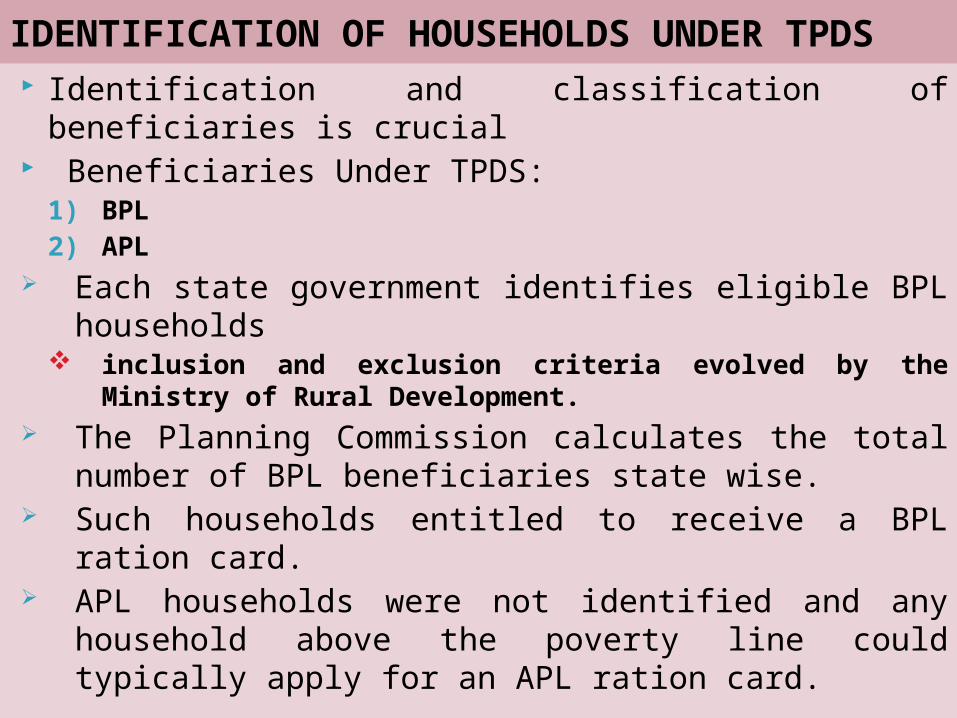
Identification and classification of beneficiaries is crucial Beneficiaries Under TPDS:
1) BPL 2) APL
Each state government identifies eligible BPL households inclusion and exclusion criteria evolved by the Ministry of Rural
Development. The Planning Commission calculates the total number of BPL
beneficiaries state wise. Such households entitled to receive a BPL ration card. APL households were not identified and any household above the
poverty line could typically apply for an APL ration card.
IDENTIFICATION OF HOUSEHOLDS UNDER TPDS
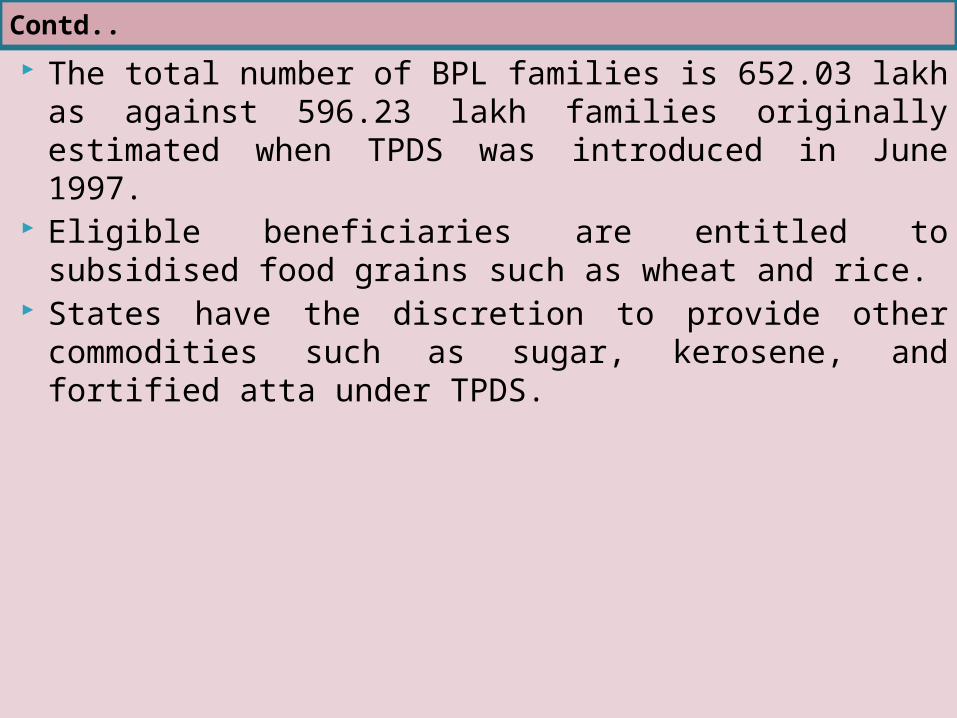
The total number of BPL families is 652.03 lakh as against 596.23 lakh families originally estimated when TPDS was introduced in June 1997.
Eligible beneficiaries are entitled to subsidised food grains such as wheat and rice.
States have the discretion to provide other commodities such as sugar, kerosene, and fortified atta under TPDS.
Contd..

AAY: launched in December 2000 for the poorest among the BPL families providing them food grains at a
highly subsidized rate of Rs 2 per kg. for wheat and Rs 3 per kg for rice. Allocation of food grains made - issue of distinctive AAY Ration Cards
to the identified Antyodaya families. Priority groups: (i) landless agricultural labourers, marginal farmers, rural artisans
/craftsmen such as potters and tanners, slum dwellers(ii) persons earning their livelihood on a daily basis in the informal sector
such as porters, rickshaw pullers, cobblers(iii) destitute(iv) households headed by widows or terminally ill persons, disabled
persons, persons aged 60 years or more with no assured means of subsistence, and (v) all primitive tribal households.
The above guidelines have been amended dated 3rd June, 2009 to include all eligible BPL families of HIV positive persons in the AAY list
Antyodaya Anna Yojana (AAY)
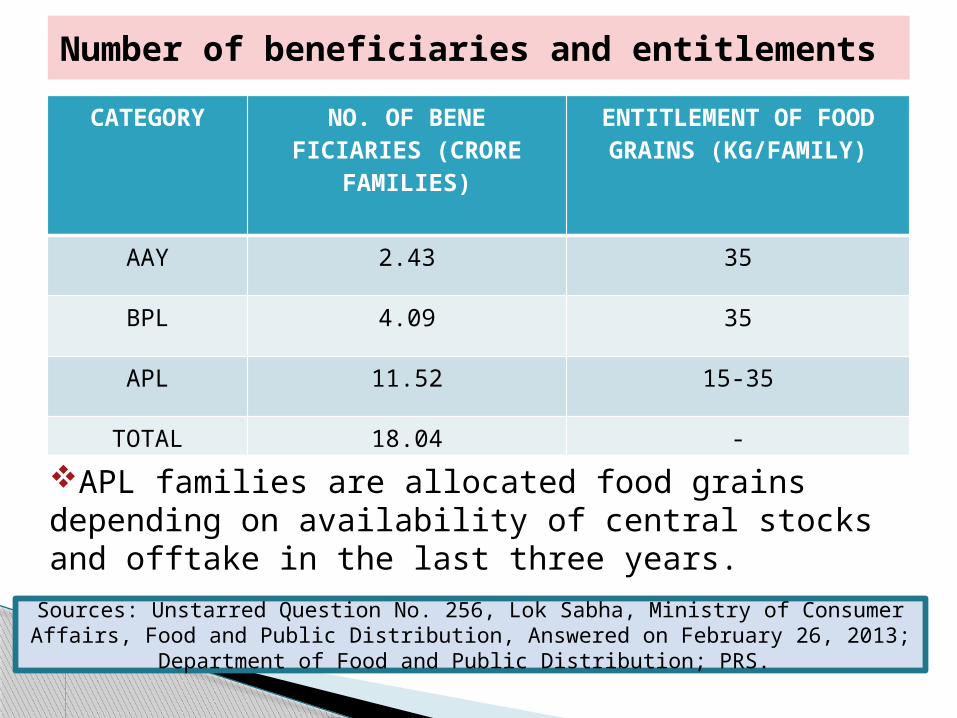
CATEGORY NO. OF BENE FICIARIES (CRORE
FAMILIES)
ENTITLEMENT OF FOOD GRAINS (KG/FAMILY)
AAY 2.43 35
BPL 4.09 35
APL 11.52 15-35
TOTAL 18.04 -
Number of beneficiaries and entitlements
APL families are allocated food grains depending on availability of central stocks and offtake in the last three years.
Sources: Unstarred Question No. 256, Lok Sabha, Ministry of Consumer Affairs, Food and Public Distribution, Answered on February 26, 2013; Department of Food and Public Distribution; PRS.

As On
Wheat Rice Total
Actual stock
Minimum Buffer norms
Actual stock
Minimum Buffer norms
Actual stock
Minimum Buffer norms
1.1.2009 182.12 112.00 175.76 138.00 357.88 250.00
1.1.2010 230.92 112.00 243.53 138.00 474.45 250.00
1.1.2011 215.40 112.00 255.80 138.00 471.20 250.00
1.1.2012 256.76 112.00 297.18 138.00 553.94 250.00
1.1.2013 343.83 112.00 322.21 138.00 666.04 250.00
1.1.2014 280.47 112.00 146.98 138.00 427.45 250.00
Source: Food, Civil supplies and consumer affairs
Stock position of food grains in the central pool vis-à-vis minimum buffer norms (lakh MT)
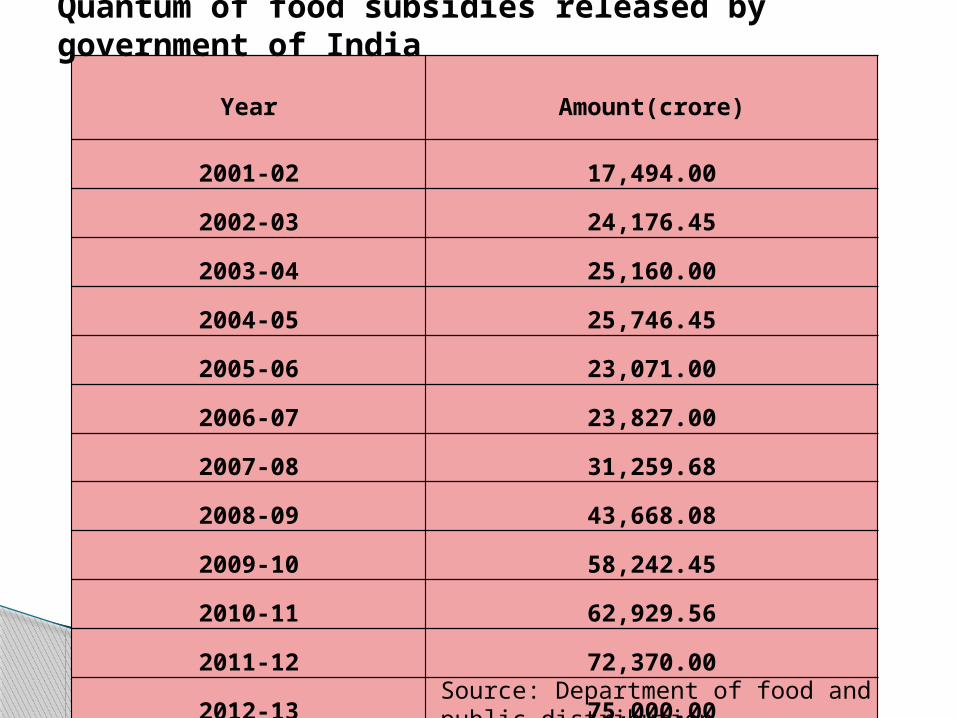
Year Amount(crore)
2001-02 17,494.00
2002-03 24,176.45
2003-04 25,160.00
2004-05 25,746.45
2005-06 23,071.00
2006-07 23,827.00
2007-08 31,259.68
2008-09 43,668.08
2009-10 58,242.45
2010-11 62,929.56
2011-12 72,370.00
2012-13 75,000.00
Quantum of food subsidies released by government of India
Source: Department of food and public distribution.
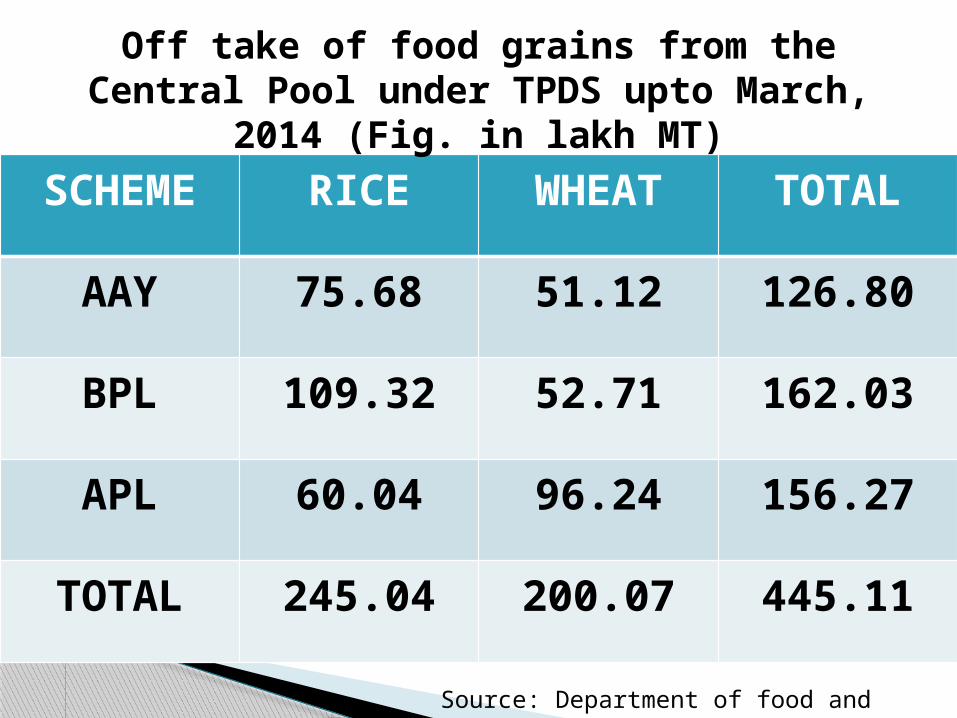
SCHEME RICE WHEAT TOTAL
AAY 75.68 51.12 126.80
BPL 109.32 52.71 162.03
APL 60.04 96.24 156.27
TOTAL 245.04 200.07 445.11
Off take of food grains from the Central Pool under TPDS upto March, 2014 (Fig. in lakh MT)
Source: Department of food and public distribution

State/UT Total Allocation Total Offtake % offtake to allocation
Assam 436.97 434.59 99.45
Bihar 1515.4 1268.05 83.67
Gujarat 1483.05 1001.83 67.55
Haryana 464.27 341.53 73.56
MP 2015.67 1903.74 94.44
Maharashtra 2098.47 1901.91 90.63
Odisha 386.72 288.39 74.57
Punjab 636.02 365.58 57.47
Rajasthan 2020.27 1939.22 95.98
WB 2021.72 1863.26 92.16
Total 19318.58 16789.52 86.90
STATE-WISE ALLOCATION & OFFTAKE OF WHEAT UNDER TPDS (2013-14) (IN THOUSAND TONNES)
Source: Department of food and public distribution
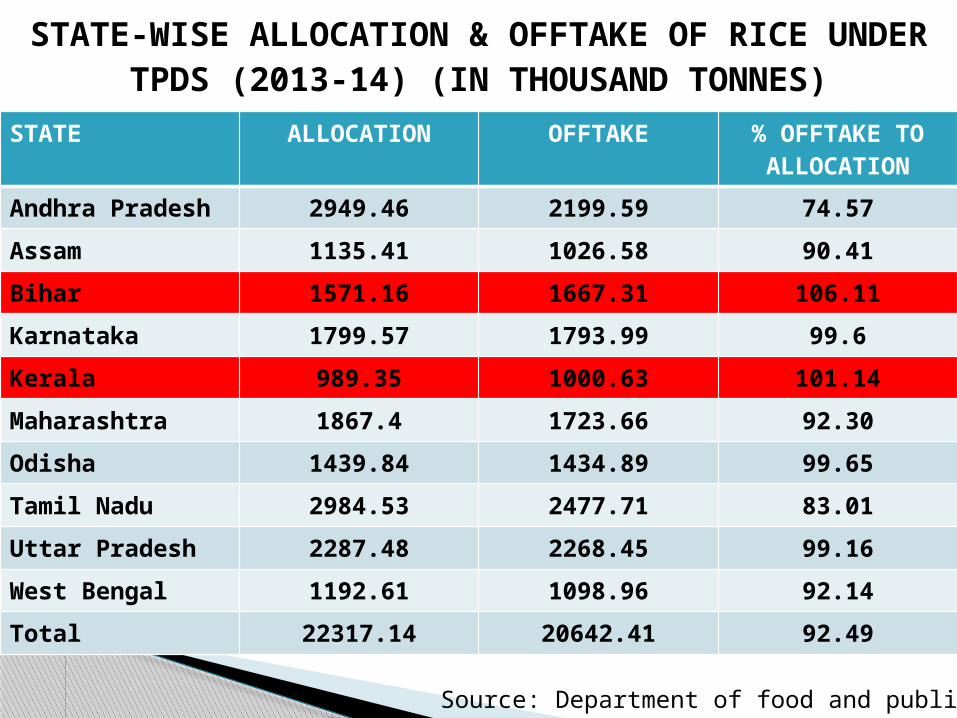
STATE ALLOCATION OFFTAKE % OFFTAKE TO ALLOCATION
Andhra Pradesh 2949.46 2199.59 74.57
Assam 1135.41 1026.58 90.41
Bihar 1571.16 1667.31 106.11
Karnataka 1799.57 1793.99 99.6
Kerala 989.35 1000.63 101.14
Maharashtra 1867.4 1723.66 92.30
Odisha 1439.84 1434.89 99.65
Tamil Nadu 2984.53 2477.71 83.01
Uttar Pradesh 2287.48 2268.45 99.16
West Bengal 1192.61 1098.96 92.14
Total 22317.14 20642.41 92.49
STATE-WISE ALLOCATION & OFFTAKE OF RICE UNDER TPDS (2013-14) (IN THOUSAND TONNES)
Source: Department of food and public distribution

The implementation of TPDS is accompanied by large◦ Errors of Exclusion (of BPL families) ◦ Inclusion (of APL)◦ Prevalence of ghost BPL cards.
High exclusion errors imply low coverage of the target group (BPL households).
TPDS also suffers from diversions of subsidized grains to unintended beneficiaries (APL households) because of Error of Inclusion.
In Andhra Pradesh, Himachal Pradesh, Karnataka, Kerala and Tamil Nadu, the proportion of subsidized grains received by APL households is unacceptably large
Source: Performance Evaluation of Targeted Public
Distribution System (TPDS)- 2005
TARGETING ERRORS AND LEAKAGES
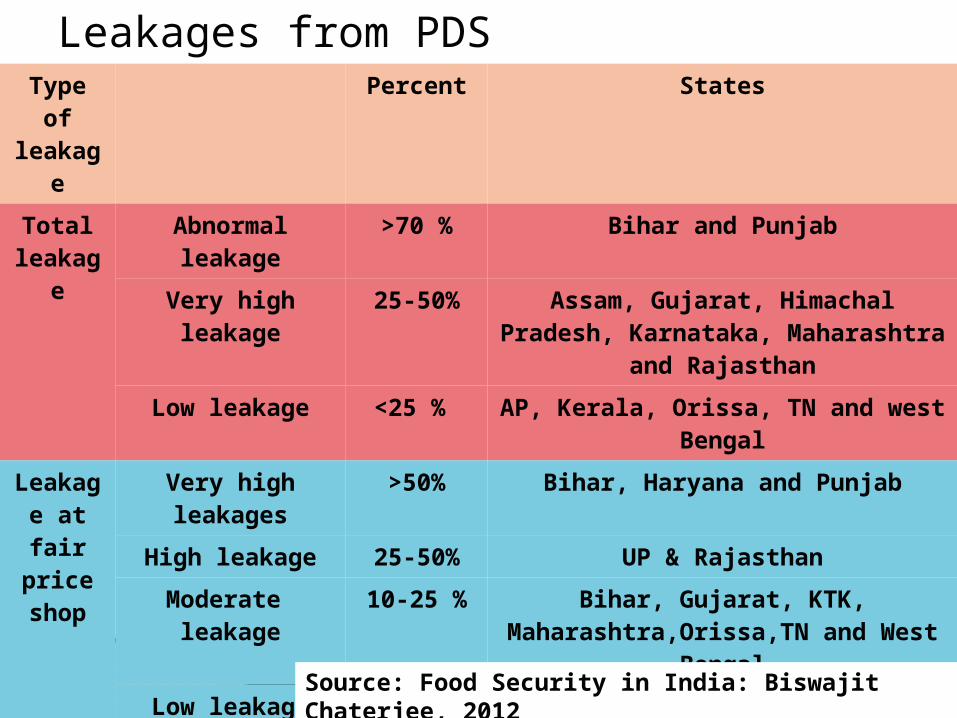
Type of leakage
Percent States
Total leakage
Abnormal leakage >70 % Bihar and Punjab
Very high leakage 25-50% Assam, Gujarat, Himachal Pradesh, Karnataka, Maharashtra and Rajasthan
Low leakage <25 % AP, Kerala, Orissa, TN and west Bengal
Leakage at fair price shop
Very high leakages >50% Bihar, Haryana and Punjab
High leakage 25-50% UP & Rajasthan
Moderate leakage
10-25 % Bihar, Gujarat, KTK, Maharashtra,Orissa,TN and West Bengal
Low leakage <10% Assam,HP,MP, Orissa,TN & West Bengal.
Leakage through
ghost card
Very high Leakage >50% Assam, HP &MP.
High leakage 10-50% Bihar, Gujarat,Ktk,Maharashtra, Orissa, Uttarpradesh and west Bengal
Moderate leakage <10% AP,Haryana,Kerala,Punjab, Rajasthan and TN
Leakages from PDS
Source: Food Security in India: Biswajit Chaterjee, 2012
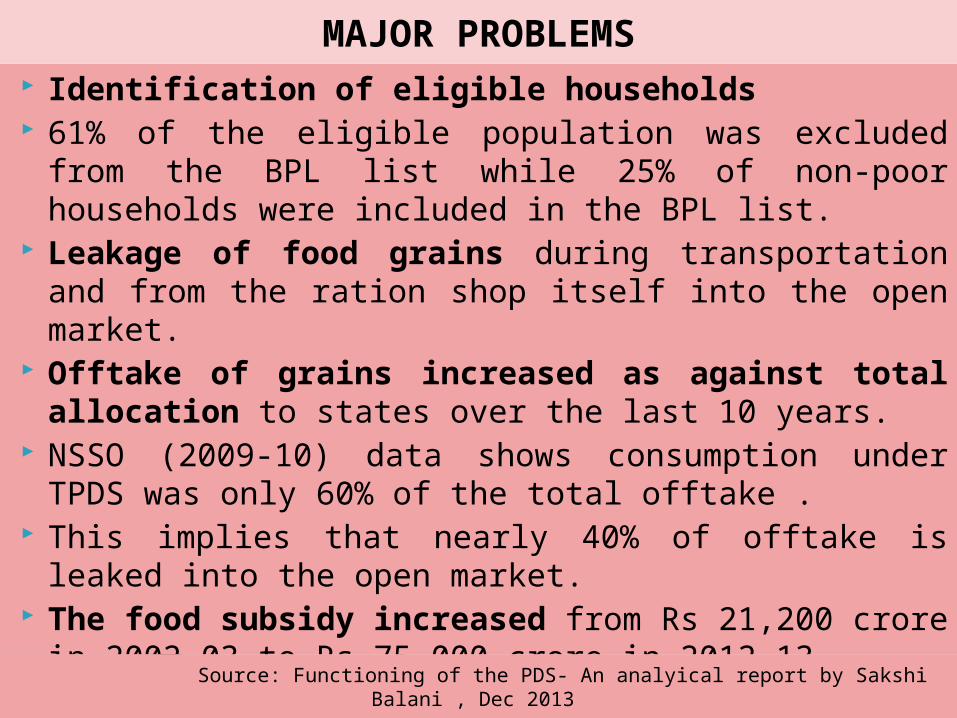
Identification of eligible households 61% of the eligible population was excluded from the BPL list while
25% of non-poor households were included in the BPL list. Leakage of food grains during transportation and from the ration
shop itself into the open market. Offtake of grains increased as against total allocation to states over
the last 10 years. NSSO (2009-10) data shows consumption under TPDS was only 60%
of the total offtake . This implies that nearly 40% of offtake is leaked into the open
market. The food subsidy increased from Rs 21,200 crore in 2002-03 to Rs
75,000 crore in 2012-13. Holding of stocks above the minimum buffer norms adversely
impacts prices of grains in the open market.
MAJOR PROBLEMS
Source: Functioning of the PDS- An analyical report by Sakshi Balani , Dec 2013
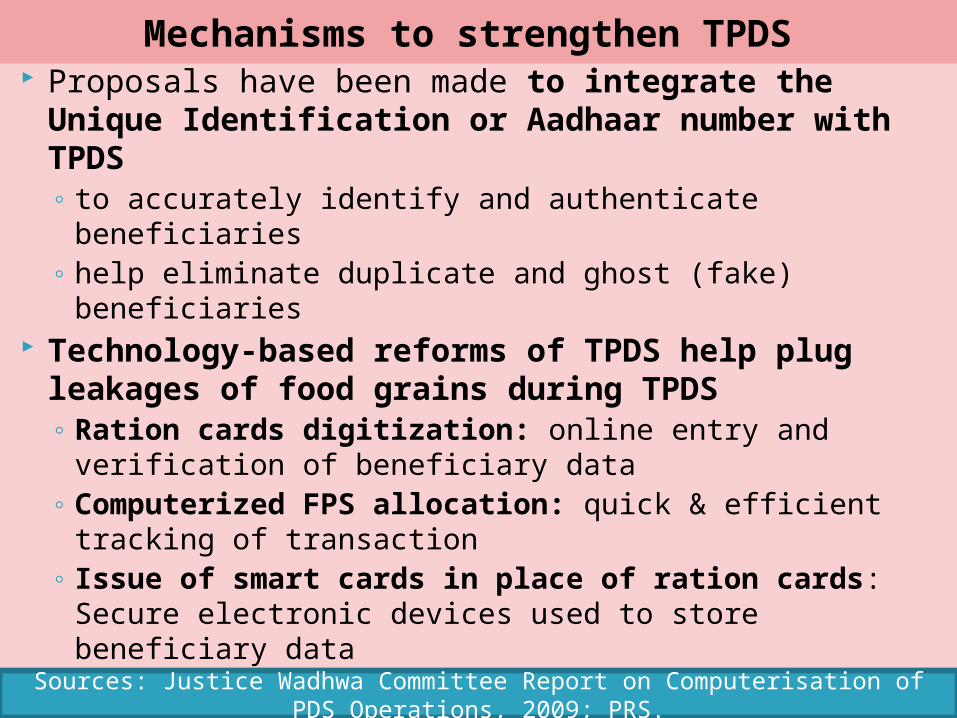
Proposals have been made to integrate the Unique Identification or Aadhaar number with TPDS◦ to accurately identify and authenticate beneficiaries◦ help eliminate duplicate and ghost (fake) beneficiaries
Technology-based reforms of TPDS help plug leakages of food grains during TPDS ◦ Ration cards digitization: online entry and verification of beneficiary
data ◦ Computerized FPS allocation: quick & efficient tracking of transaction◦ Issue of smart cards in place of ration cards: Secure electronic devices
used to store beneficiary data ◦ Use of Global Positioning System (GPS) technology to track movement
of trucks carrying food grains from state depots to FPS ◦ SMS based monitoring: citizens can register their mobile numbers and
send/receive SMS alerts during dispatch and arrival of TPDS commodities
Mechanisms to strengthen TPDS
Sources: Justice Wadhwa Committee Report on Computerisation of PDS Operations, 2009; PRS.
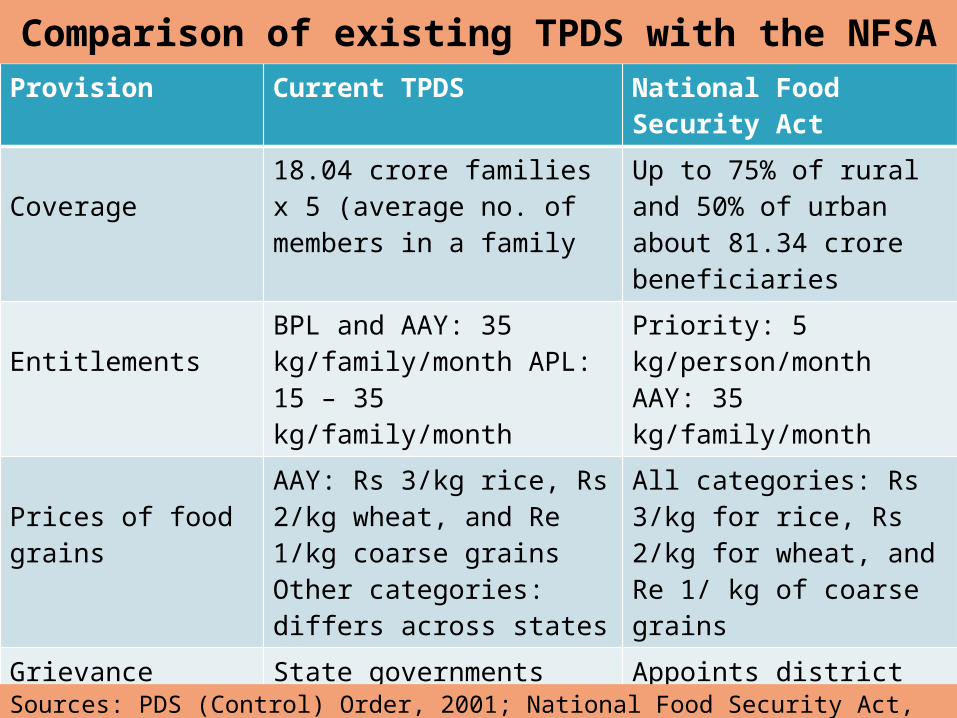
Provision Current TPDS National Food Security Act
Coverage18.04 crore families x 5 (average no. of members in a family
Up to 75% of rural and 50% of urban about 81.34 crore beneficiaries
EntitlementsBPL and AAY: 35 kg/family/month APL: 15 – 35 kg/family/month
Priority: 5 kg/person/month AAY: 35 kg/family/month
Prices of food grainsAAY: Rs 3/kg rice, Rs 2/kg wheat, and Re 1/kg coarse grains Other categories: differs across states
All categories: Rs 3/kg for rice, Rs 2/kg for wheat, and Re 1/ kg of coarse grains
Grievance redressal mechanism
State governments ensures monitoring; vigilance committees to be set up at state, district, block and ration shop levels
Appoints district grievance redressal officers; establishes State Food Commissions; and vigilance committees at state, district, block and ration shop levels
Comparison of existing TPDS with the NFSA
Sources: PDS (Control) Order, 2001; National Food Security Act, 2013; PRS.
The quantum of food subsidy has increased due to constant CIP and increasing MSP.
The margin of stocks above the minimum buffer stocks has been increasing over the years – impacts prices of grains in the open market.
A leakage of about 40 per cent of the food grains from the TPDS network was observed in 2009-10.
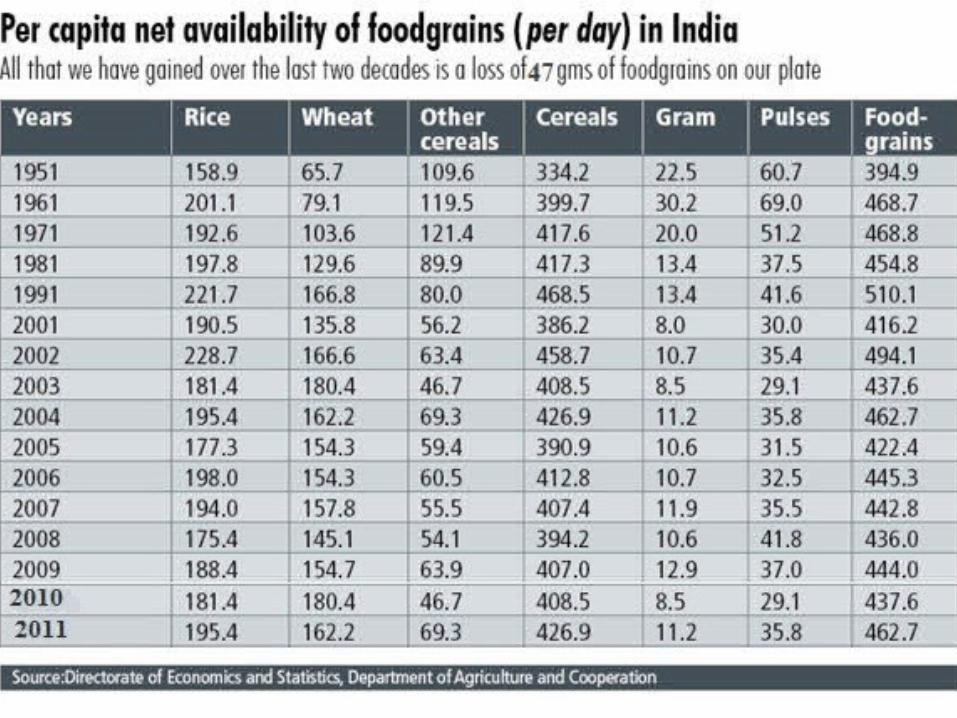
There has been a decline in the per capita availability of pulses over time which is a major source of protein.
Conclusions