Embed Size (px)
Citation preview
TITLE
2
SOLIDITY: MANAGEMENT FOCUS
Banca IFIS FY 14 FY15
CET 1 13.9% 14.7%
Total Own Fund Capital ratio 14,2% 15.4%
Tier 1 Ratio 14.0% 15.0%
BCE request
CET 1 7%
Total Own Fund Capital ratio 10.5%
Tier 1 Ratio 8.5%
3
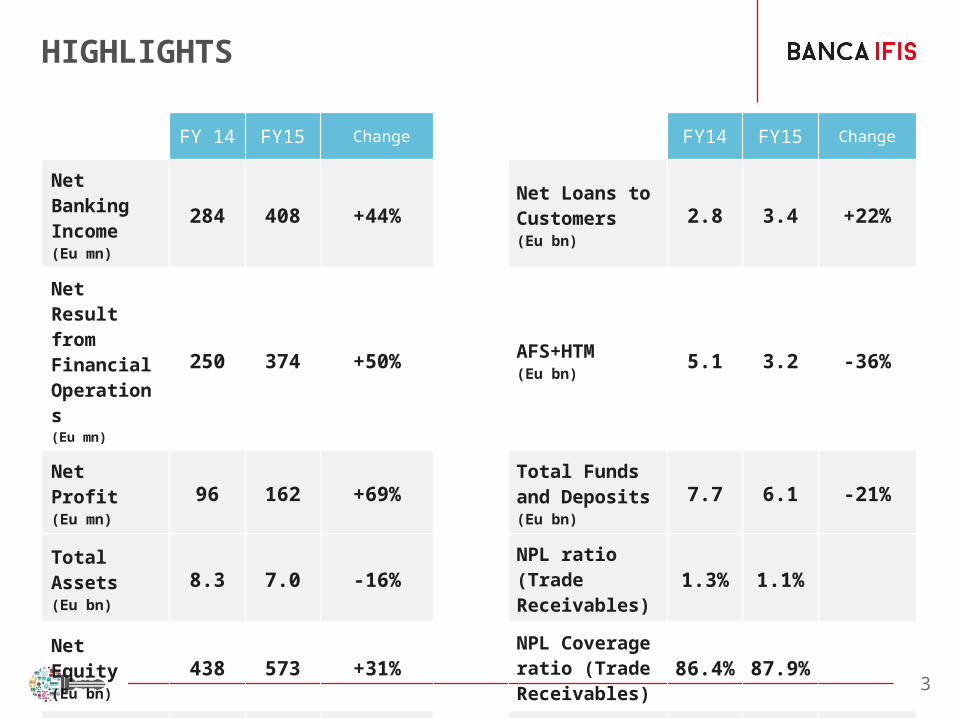
HIGHLIGHTS
FY 14 FY15 Change FY14 FY15 Change
Net Banking Income(Eu mn)
284 408 +44%Net Loans to Customers(Eu bn)
2.8 3.4 +22%
Net Result from Financial Operations(Eu mn)
250 374 +50% AFS+HTM(Eu bn) 5.1 3.2 -36%
Net Profit(Eu mn) 96 162 +69%
Total Funds and Deposits(Eu bn)
7.7 6.1 -21%
Total Assets(Eu bn) 8.3 7.0 -16% NPL ratio (Trade
Receivables) 1.3% 1.1%
Net Equity(Eu bn) 438 573 +31%
NPL Coverage ratio (Trade Receivables)
86.4% 87.9%
CET 1 13.9% 14.7% RWA (Eu bn) 2.8 3.3 +17%

4
HIGH QUALITY BALANCE SHEET
NPL COVERAGE ratio 87,9%
2011 2012 2013 2014 20150.0%
2.0%
4.0%
6.0%
8.0%
10.0%
12.0%
14.0%
16.0%
18.0%
20.0%
0.00%
2.00%
4.00%
6.00%
8.00%
10.00%
12.00%
14.00%
16.00%
NPL/Loans Deteriorated Assets/ LoansTier 1 Capital ratio Total Own Fund Capital Ratio
Fiscal year end Euro FY14 FY15
Net NP Exposures Mn 113 129
NPE/Equity 25,7% 22.4%
Net NPL 33 31
NPL/Loans 1.3% 1.1%
Net Unlikely to Pay 44 40
Net NP Past Due Loans 36 58
Deteriorated assets in Trade Receivables segment
Over the last years Banca IFIS improved significantlyits Capital Ratios and credit quality
Sol
idity
Det
erio
tate
d as
sets
/ Loa
ns
5
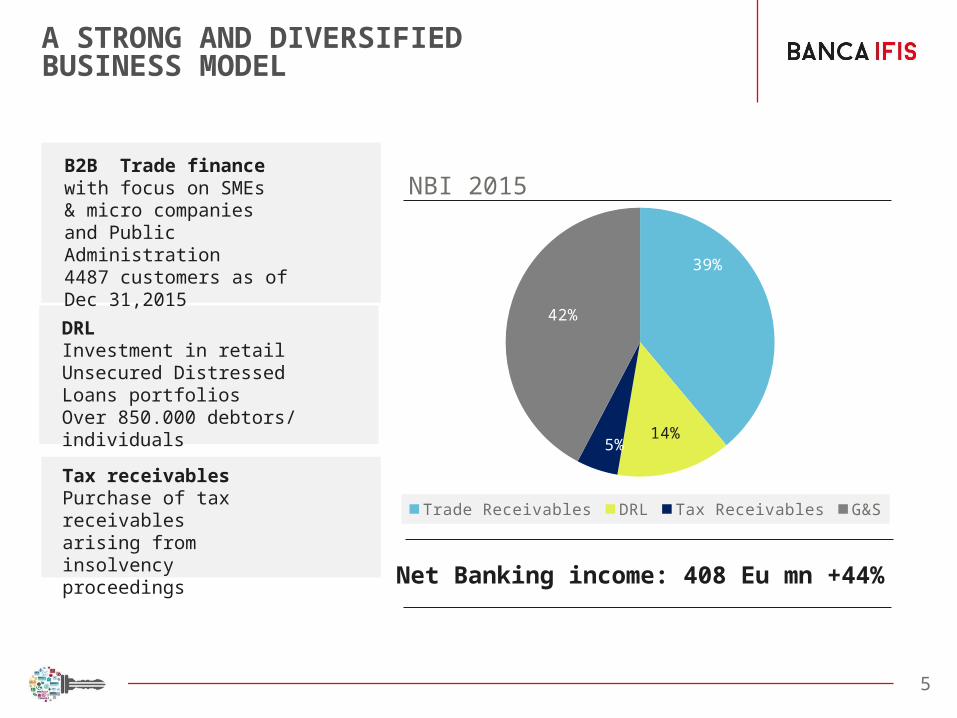
A STRONG AND DIVERSIFIEDBUSINESS MODEL
39%
14%5%
42%
NBI 2015
Trade Receivables DRL Tax Receivables G&S
B2B Trade financewith focus on SMEs & micro companiesand Public Administration4487 customers as of Dec 31,2015
DRLInvestment in retail Unsecured Distressed Loans portfoliosOver 850.000 debtors/ individuals
Tax receivablesPurchase of tax receivables arising from insolvency proceedings
Net Banking income: 408 Eu mn +44%
6
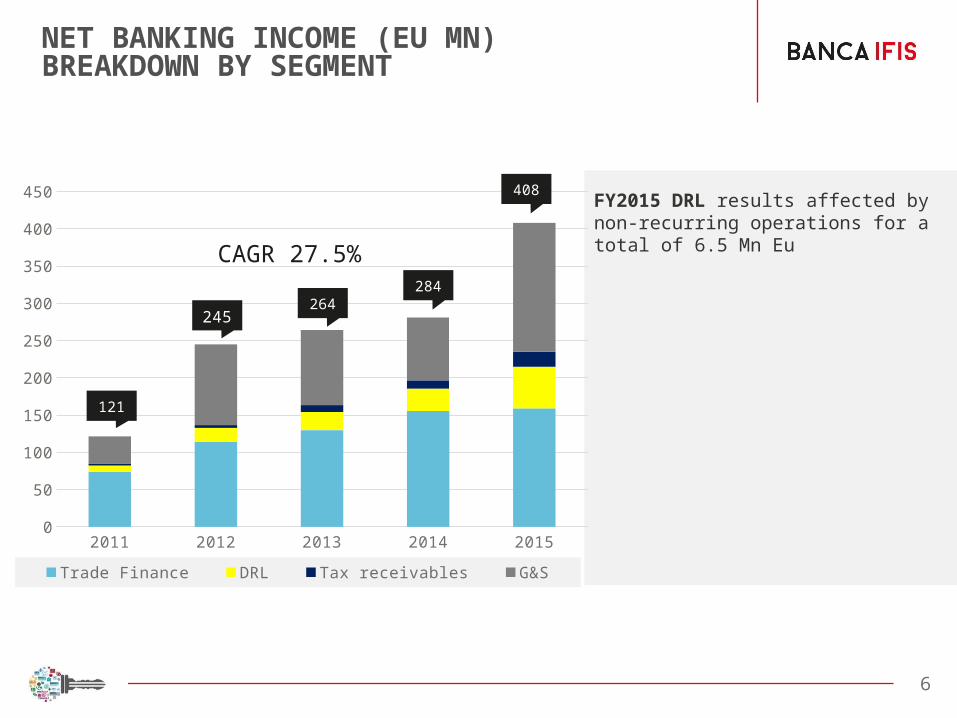
NET BANKING INCOME (EU MN) BREAKDOWN BY SEGMENT
2011 2012 2013 2014 20150
50
100
150
200
250
300
350
400
450
Trade Finance DRL Tax receivables G&S
245
121
264284
408FY2015 DRL results affected by non-recurring operations for a total of 6.5 Mn EuCAGR 27.5%
8
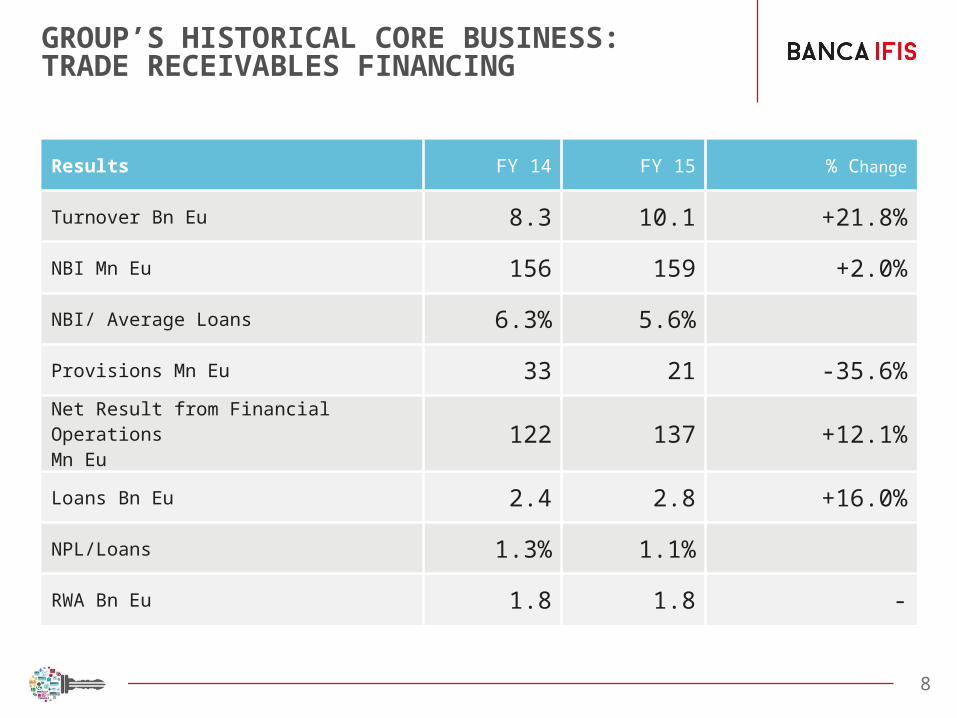
GROUP’S HISTORICAL CORE BUSINESS:TRADE RECEIVABLES FINANCING
Results FY 14 FY 15 % Change
Turnover Bn Eu 8.3 10.1 +21.8%
NBI Mn Eu 156 159 +2.0%
NBI/ Average Loans 6.3% 5.6%
Provisions Mn Eu 33 21 -35.6%
Net Result from Financial Operations Mn Eu 122 137 +12.1%
Loans Bn Eu 2.4 2.8 +16.0%
NPL/Loans 1.3% 1.1%
RWA Bn Eu 1.8 1.8 -
9
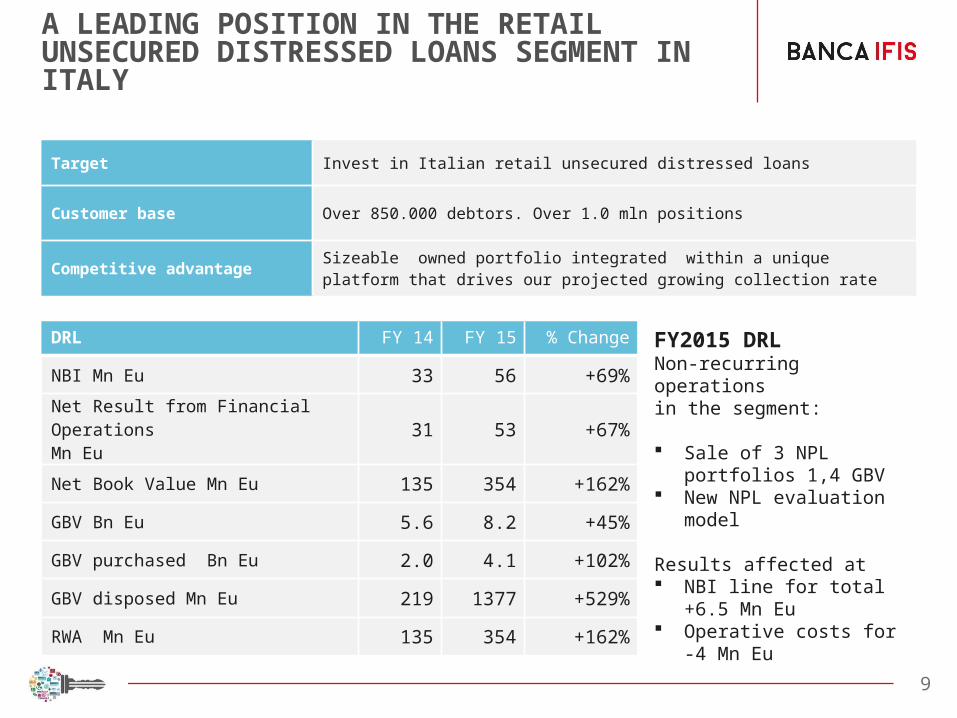
A LEADING POSITION IN THE RETAIL UNSECURED DISTRESSED LOANS SEGMENT IN ITALY
Target Invest in Italian retail unsecured distressed loans
Customer base Over 850.000 debtors. Over 1.0 mln positions
Competitive advantage Sizeable owned portfolio integrated within a unique platform that drives our projected growing collection rate
DRL FY 14 FY 15 % Change
NBI Mn Eu 33 56 +69%Net Result from Financial Operations Mn Eu 31 53 +67%
Net Book Value Mn Eu 135 354 +162%
GBV Bn Eu 5.6 8.2 +45%
GBV purchased Bn Eu 2.0 4.1 +102%
GBV disposed Mn Eu 219 1377 +529%
RWA Mn Eu 135 354 +162%
FY2015 DRLNon-recurring operationsin the segment:
Sale of 3 NPL portfolios 1,4 GBV
New NPL evaluation model
Results affected at NBI line for total +6.5 Mn
Eu Operative costs for -4 Mn
Eu
10
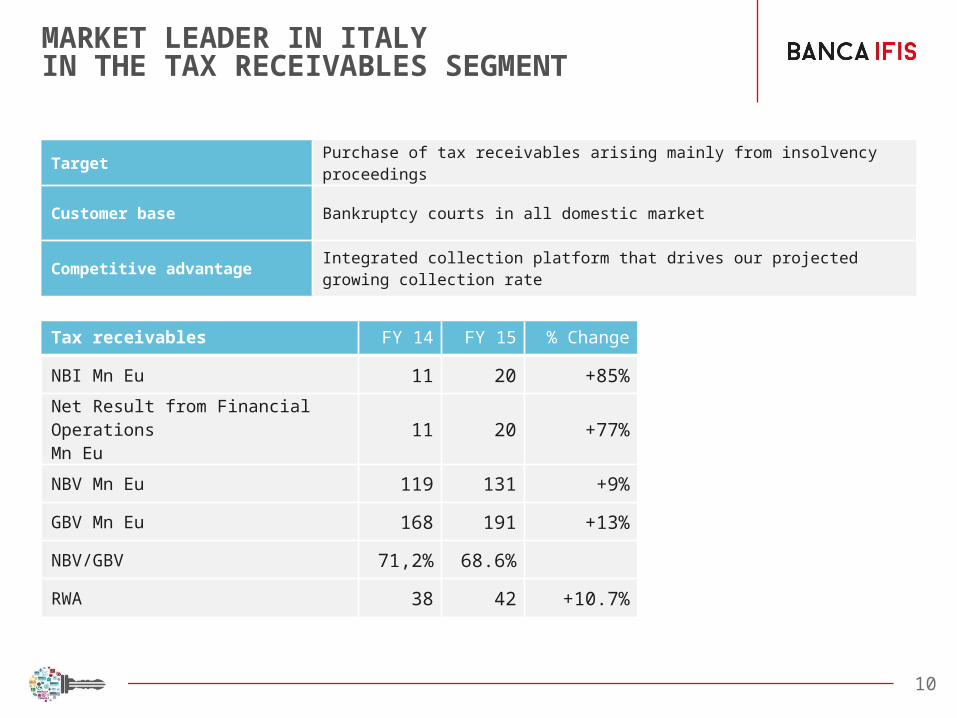
MARKET LEADER IN ITALYIN THE TAX RECEIVABLES SEGMENT
Target Purchase of tax receivables arising mainly from insolvency proceedings
Customer base Bankruptcy courts in all domestic market
Competitive advantage Integrated collection platform that drives our projected growing collection rate
Tax receivables FY 14 FY 15 % Change
NBI Mn Eu 11 20 +85%Net Result from Financial OperationsMn Eu 11 20 +77%
NBV Mn Eu 119 131 +9%
GBV Mn Eu 168 191 +13%
NBV/GBV 71,2% 68.6%
RWA 38 42 +10.7%
11
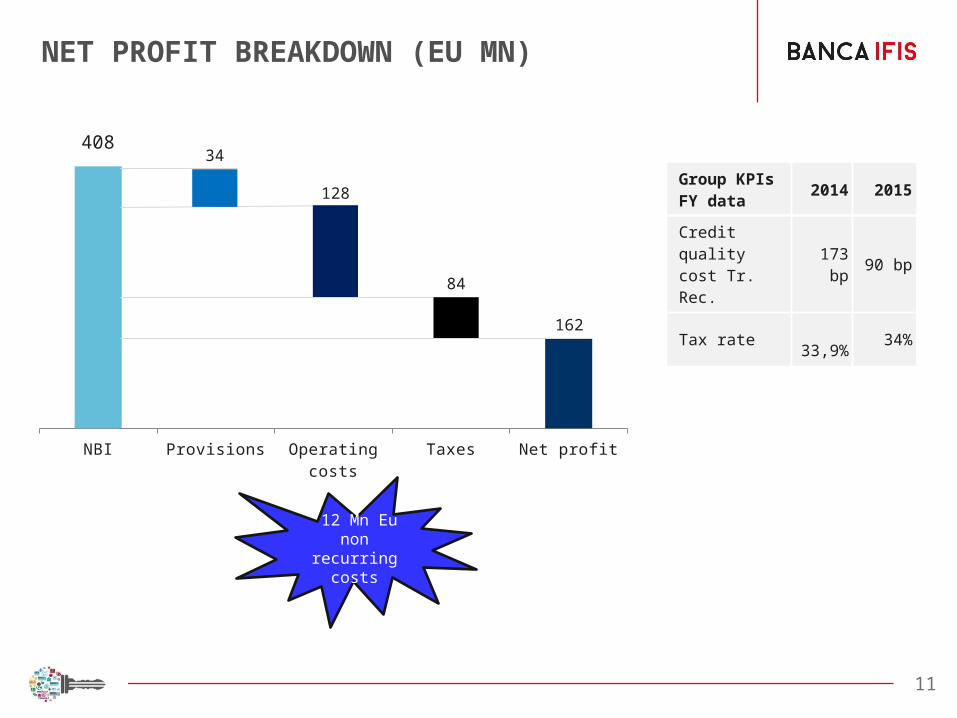
NET PROFIT BREAKDOWN (EU MN)
Group KPIsFY data 2014 2015
Credit quality cost Tr. Rec. 173 bp 90 bp
Tax rate 33,9% 34%
NBI Provisions Operating costs Taxes Net profit
40834
128
84
162
12 Mn Eu non recurring costs
13
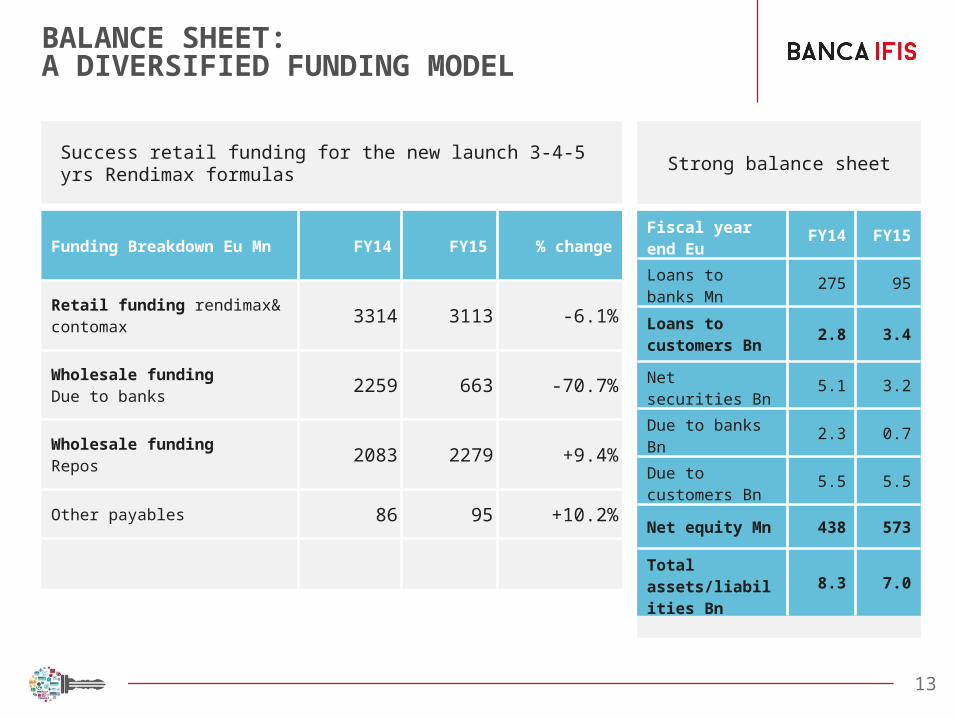
BALANCE SHEET:A DIVERSIFIED FUNDING MODEL
Strong balance sheetSuccess retail funding for the new launch 3-4-5 yrs Rendimax formulas
Funding Breakdown Eu Mn FY14 FY15 % change
Retail funding rendimax& contomax 3314 3113 -6.1%
Wholesale fundingDue to banks 2259 663 -70.7%
Wholesale fundingRepos 2083 2279 +9.4%
Other payables 86 95 +10.2%
Fiscal year end Eu FY14 FY15
Loans to banks Mn 275 95
Loans to customers Bn 2.8 3.4
Net securities Bn 5.1 3.2
Due to banks Bn 2.3 0.7
Due to customers Bn 5.5 5.5
Net equity Mn 438 573
Total assets/liabilities Bn
8.3 7.0
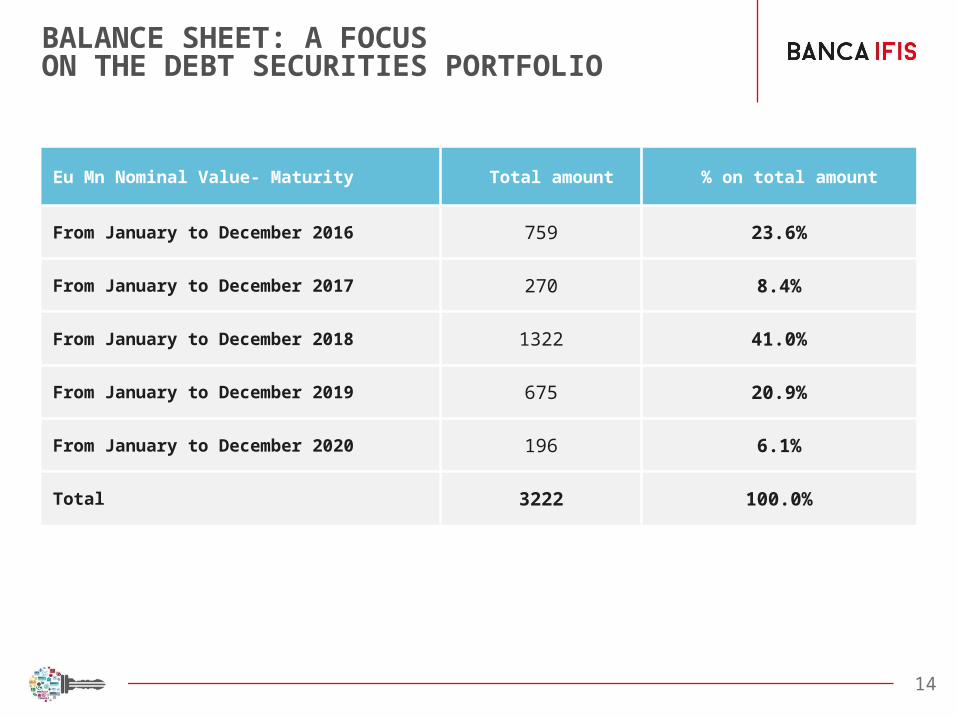
14
BALANCE SHEET: A FOCUSON THE DEBT SECURITIES PORTFOLIO
Eu Mn Nominal Value- Maturity Total amount % on total amount
From January to December 2016 759 23.6%
From January to December 2017 270 8.4%
From January to December 2018 1322 41.0%
From January to December 2019 675 20.9%
From January to December 2020 196 6.1%
Total 3222 100.0%
15
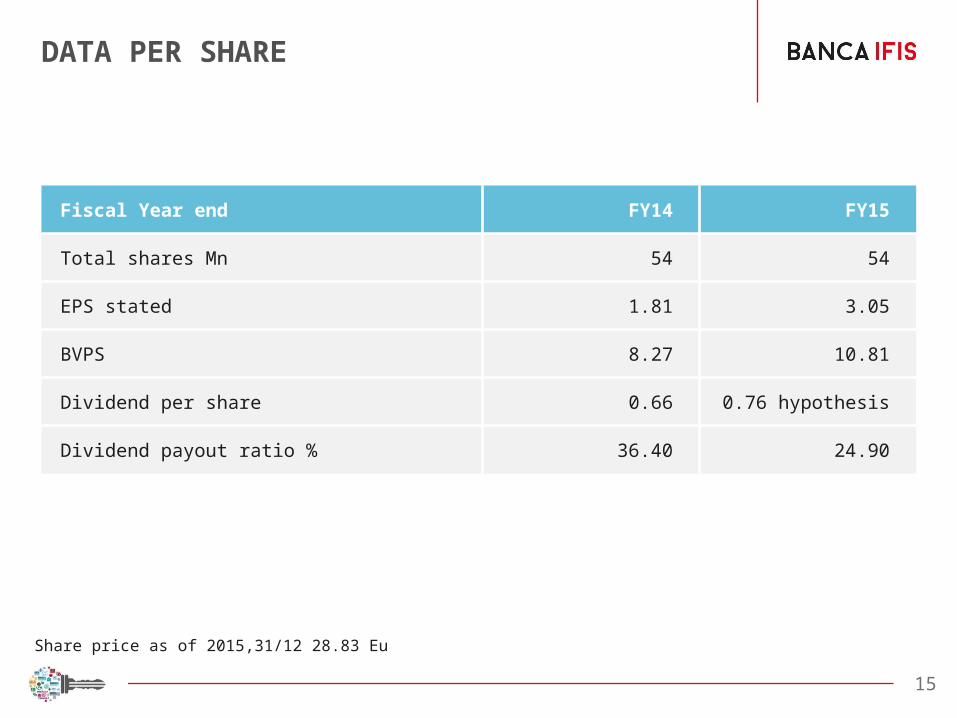
DATA PER SHARE
Fiscal Year end FY14 FY15
Total shares Mn 54 54
EPS stated 1.81 3.05
BVPS 8.27 10.81
Dividend per share 0.66 0.76 hypothesis
Dividend payout ratio % 36.40 24.90
Share price as of 2015,31/12 28.83 Eu
This Presentation may contain written and oral “forward-looking statements”, which includes all statements that do not relate solely to historical or current facts and which are therefore inherently uncertain. All forward-looking statements rely on a number of assumptions, expectations, projections and provisional data concerning future events and are subject to a number of uncertainties and other factors, many of which are outside the control of Banca IFIS. (the “Company”). There are a variety of factors that may cause actual results and performance to be materially different from the explicit or implicit contents of any forward-looking statements and thus, such forward-looking statements are not a reliable indicator of future performance. The Company undertakes no obligation to publicly update or revise any forward-looking statements, whether as a result of new information, future events or otherwise, except as may be required by applicable law. The information and opinions contained in this Presentation are provided as at the date hereof and are subject to change without notice. Neither this Presentation nor any part of it nor the fact of its distribution may form the basis of, or be relied on or in connection with, any contract or investment decision. The information, statements and opinions contained in this Presentation are for information purposes only and do not constitute a public offer under any applicable legislation or an offer to sell or solicitation of an offer to purchase or subscribe for securities or financial instruments or any advice or recommendation with respect to such securities or other financial instruments. None of the securities referred to herein have been, or will be, registered under the U.S. Securities Act of 1933, as amended, or the securities laws of any state or other jurisdiction of the United States or in Australia, Canada or Japan or any other jurisdiction where such an offer or solicitation would be unlawful (the “Other Countries”), and there will be no public offer of any such securities in the United States. This Presentation does not constitute or form a part of any offer or solicitation to purchase or subscribe for securities in the United States or the Other Countries. Pursuant the consolidated law on financial intermediation of 24 February 1998 (article 154-bis, paragraph 2) Emanuel Nalli, in his capacity as manager responsible for the preparation of the Company’s financial reports declares that the accounting information contained in this Presentation reflects the Banca IFIS’s documented results, financial accounts and accounting records. Neither the Company nor any member of Banca IFIS nor any of its or their respective representatives, directors or employees accept any liability whatsoever in connection with this Presentation or any of its contents or in relation to any loss arising from its use or from any reliance placed upon it.