Embed Size (px)
Citation preview
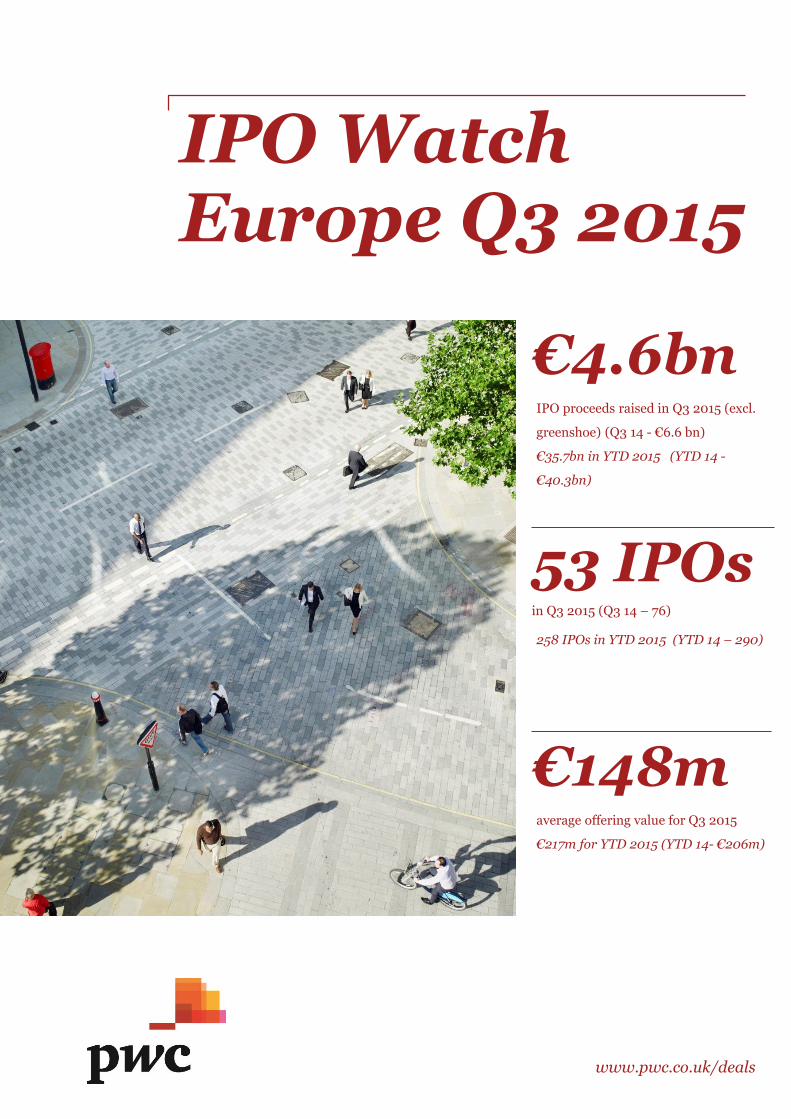
IPO Watch Europe Q3 2015
www.pwc.co.uk/deals
€4.6bnIPO proceeds raised in Q3 2015 (excl.
greenshoe) (Q3 14 - €6.6 bn)
€35.7bn in YTD 2015 (YTD 14 -
€40.3bn)
53 IPOsin Q3 2015 (Q3 14 – 76)
258 IPOs in YTD 2015 (YTD 14 – 290)
€148maverage offering value for Q3 2015
€217m for YTD 2015 (YTD 14- €206m)

2 | IPO Watch Europe Survey Q3 2015
European IPO trends 3
Market volatility and performance 5
Pricing and performance of top 5 European IPOs 6
Top 10 IPOs in Europe 7
Exchange activity by value 8
Exchange activity by volume 9
IPOs by sector 10
UK focus
Overview 11
Relative performance of London IPOs 12
Private equity and industry trends 13
US and Hong Kong domestic activity 14
Appendix – IPOs by market 15
Contacts / About IPO Watch Europe 16
ContentsOutlook for next few months:
• There is a strong pipeline of interesting and diverse assets waiting in the sidelines, after a summer of preparation and riding out the eerily quiet IPO market.
• The pipeline includes a number of blockbuster European deals tipped to launch their IPO.
• The main question is whether this pipeline will provide Q4 IPOs or whether next year will provide a more enthusiastic audience for their offerings.
• We are seeing a challenging if not difficult market place with wary investors spooked by China’s immediate growth prospects and tumbling equities across European exchanges.
• We expect M&A to continue to dominate headlines, as we have a seen already this year a number of good IPO candidates being thwarted at the last minute.
• Even if the market jitters remain, 2015 has been a solid year for IPOs due to a strong first half. As market volatility has increased it will be interesting to see how difficult this makes the IPO market.
3IPO Watch Europe Survey Q3 2015 |
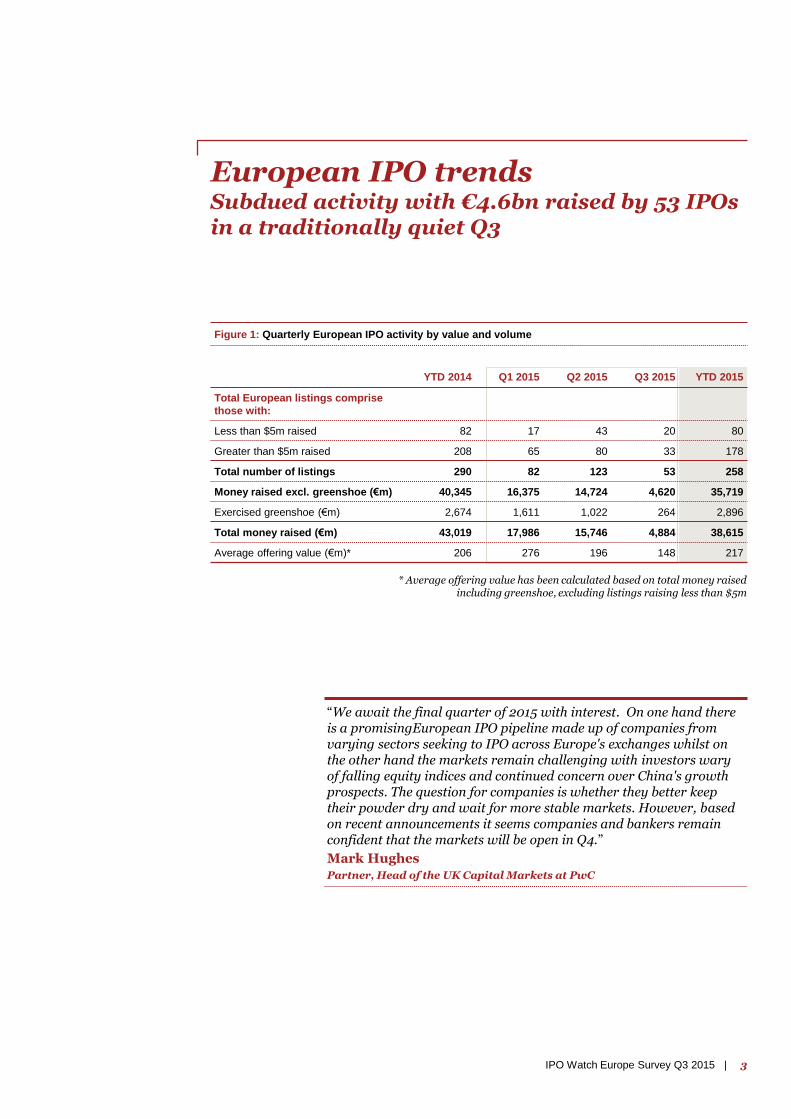
European IPO trendsSubdued activity with €4.6bn raised by 53 IPOs in a traditionally quiet Q3
Figure 1: Quarterly European IPO activity by value and volume
YTD 2014 Q1 2015 Q2 2015 Q3 2015 YTD 2015
Total European listings comprise
those with:
Less than $5m raised 82 17 43 20 80
Greater than $5m raised 208 65 80 33 178
Total number of listings 290 82 123 53 258
Money raised excl. greenshoe (€m) 40,345 16,375 14,724 4,620 35,719
Exercised greenshoe (€m) 2,674 1,611 1,022 264 2,896
Total money raised (€m) 43,019 17,986 15,746 4,884 38,615
Average offering value (€m)* 206 276 196 148 217
* Average offering value has been calculated based on total money raised including greenshoe, excluding listings raising less than $5m
“We await the final quarter of 2015 with interest. On one hand there is a promisingEuropean IPO pipeline made up of companies from varying sectors seeking to IPO across Europe's exchanges whilst on the other hand the markets remain challenging with investors wary of falling equity indices and continued concern over China's growth prospects. The question for companies is whether they better keep their powder dry and wait for more stable markets. However, basedon recent announcements it seems companies and bankers remain confident that the markets will be open in Q4.”
Mark Hughes
Partner, Head of the UK Capital Markets at PwC
4 | IPO Watch Europe Survey Q3 2015
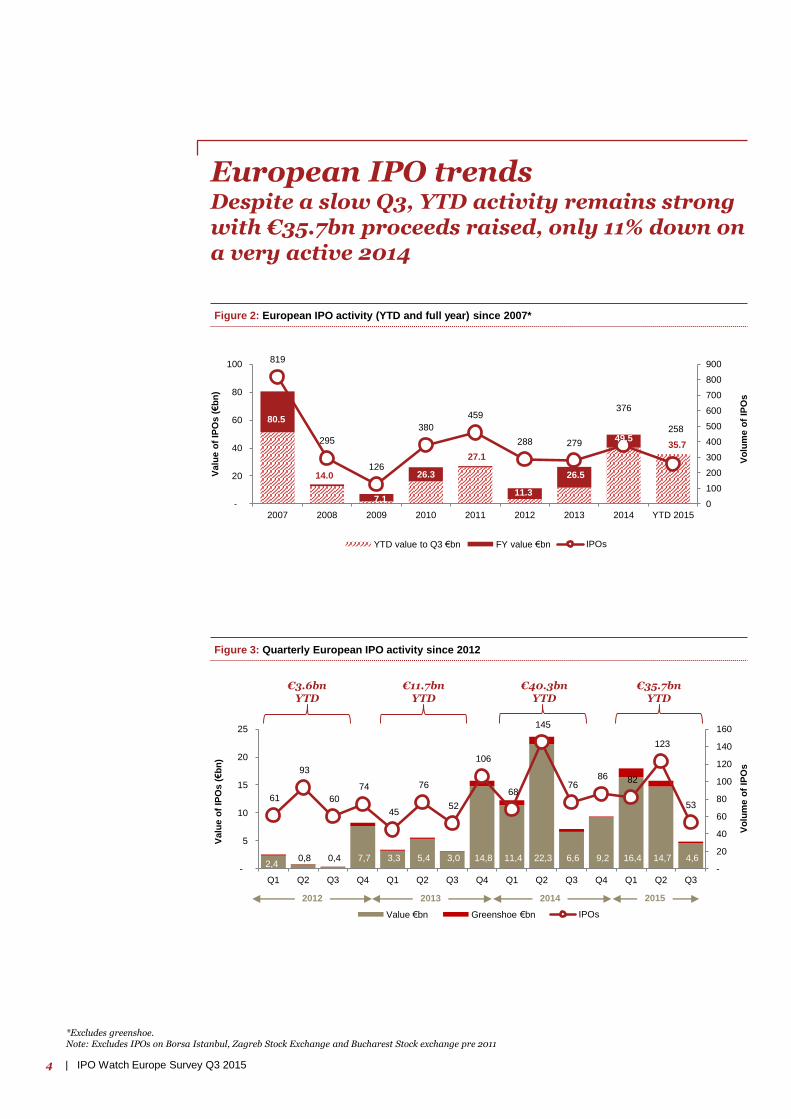
European IPO trendsDespite a slow Q3, YTD activity remains strong with €35.7bn proceeds raised, only 11% down on a very active 2014
Figure 2: European IPO activity (YTD and full year) since 2007*
Figure 3: Quarterly European IPO activity since 2012
Vo
lum
e o
f IP
Os
Vo
lum
e o
f IP
Os
2,4 0,8 0,4 7,7 3,3 5,4 3,0 14,8 11,4 22,3 6,6 9,2 16,4 14,7 4,6
61
93
60
74
45
76
52
106
68
145
76 86 82
123
53
-
20
40
60
80
100
120
140
160
-
5
10
15
20
25
Q1 Q2 Q3 Q4 Q1 Q2 Q3 Q4 Q1 Q2 Q3 Q4 Q1 Q2 Q3
Valu
e o
f IP
Os (€b
n)
Value €bn Greenshoe €bn IPOs
*Excludes greenshoe. Note: Excludes IPOs on Borsa Istanbul, Zagreb Stock Exchange and Bucharest Stock exchange pre 2011
80.5
14.0
7.1
26.3
27.1
11.3
26.5
49.535.7
819
295
126
380
459
288 279
376
258
0
100
200
300
400
500
600
700
800
900
-
20
40
60
80
100
2007 2008 2009 2010 2011 2012 2013 2014 YTD 2015
Valu
e o
f IP
Os (€b
n)
YTD value to Q3 €bn FY value €bn IPOs
2012 2013 2014 2015
€3.6bnYTD
€11.7bnYTD
€40.3bnYTD
€35.7bnYTD
5IPO Watch Europe Survey Q3 2015 |
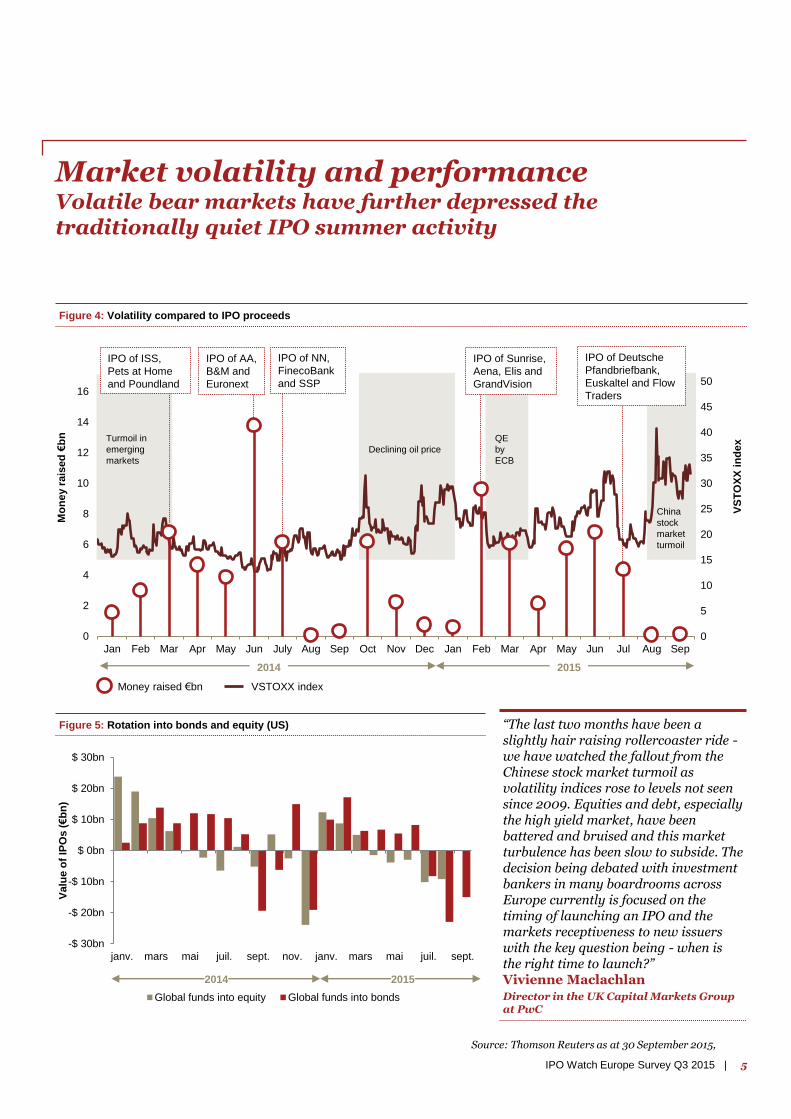
Market volatility and performanceVolatile bear markets have further depressed the traditionally quiet IPO summer activity
Figure 4: Volatility compared to IPO proceeds
Figure 5: Rotation into bonds and equity (US)
Turmoil in
emerging
markets
Mo
ne
y r
ais
ed
€b
n
VS
TO
XX
in
de
x
Money raised €bn VSTOXX index
Source: Thomson Reuters as at 30 September 2015,
IPO of ISS,
Pets at Home
and Poundland
IPO of AA,
B&M and
Euronext
IPO of NN,
FinecoBank
and SSP
Declining oil price
2014 2015
QE
by
ECB
IPO of Sunrise,
Aena, Elis and
GrandVision
China
stock
market
turmoil
IPO of Deutsche
Pfandbriefbank,
Euskaltel and Flow
Traders
0
5
10
15
20
25
30
35
40
45
50
0
2
4
6
8
10
12
14
16
Jan Feb Mar Apr May Jun July Aug Sep Oct Nov Dec Jan Feb Mar Apr May Jun Jul Aug Sep
“The last two months have been a slightly hair raising rollercoaster ride -we have watched the fallout from the Chinese stock market turmoil as volatility indices rose to levels not seen since 2009. Equities and debt, especially the high yield market, have been battered and bruised and this market turbulence has been slow to subside. The decision being debated with investment bankers in many boardrooms across Europe currently is focused on the timing of launching an IPO and the markets receptiveness to new issuers with the key question being - when is the right time to launch?”Vivienne MaclachlanDirector in the UK Capital Markets Group at PwC
-$ 30bn
-$ 20bn
-$ 10bn
$ 0bn
$ 10bn
$ 20bn
$ 30bn
janv. mars mai juil. sept. nov. janv. mars mai juil. sept.
Valu
e o
f IP
Os (€b
n)
Global funds into equity Global funds into bonds
2014 2015
6 | IPO Watch Europe Survey Q3 2015
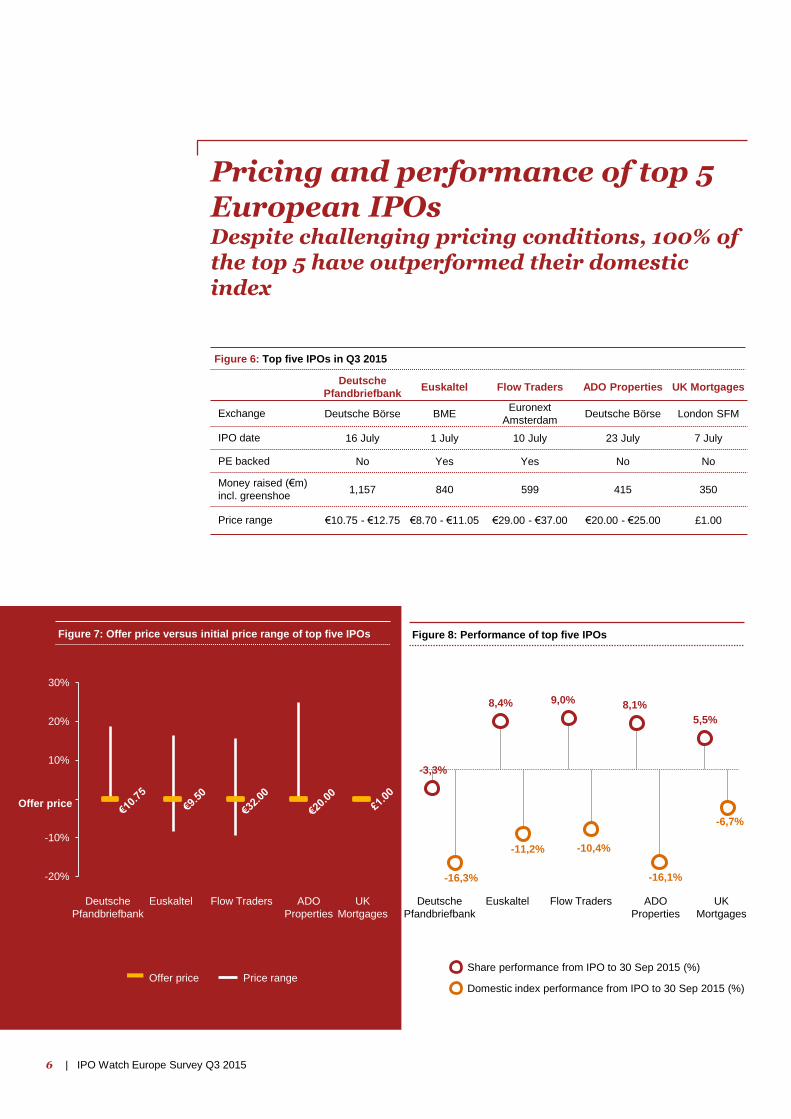
Pricing and performance of top 5 European IPOsDespite challenging pricing conditions, 100% of the top 5 have outperformed their domestic index
Figure 6: Top five IPOs in Q3 2015
Figure 7: Offer price versus initial price range of top five IPOs
Deutsche
PfandbriefbankEuskaltel Flow Traders ADO Properties UK Mortgages
Exchange Deutsche Börse BMEEuronext
AmsterdamDeutsche Börse London SFM
IPO date 16 July 1 July 10 July 23 July 7 July
PE backed No Yes Yes No No
Money raised (€m)
incl. greenshoe1,157 840 599 415 350
Price range €10.75 - €12.75 €8.70 - €11.05 €29.00 - €37.00 €20.00 - €25.00 £1.00
-20%
-10%
0%
10%
20%
30%
Offer price Price range
Figure 8: Performance of top five IPOs
Share performance from IPO to 30 Sep 2015 (%)
-3,3%
-16,3%
8,4%
-11,2%
9,0%
-10,4%
8,1%
-16,1%
5,5%
-6,7%
Domestic index performance from IPO to 30 Sep 2015 (%)
Deutsche
Pfandbriefbank
Euskaltel Flow Traders ADO
Properties
UK
Mortgages
Deutsche
Pfandbriefbank
Euskaltel Flow Traders ADO
Properties
UK
Mortgages
Offer price
7IPO Watch Europe Survey Q3 2015 |
Ten largest IPOs in Q3 2015€m (excl.
greenshoe)
€m (incl.
greenshoe)Sector Market Country of origin
PE
backed
Deutsche Pfandbriefbank 1,086 1,157 Financials Deutsche Börse Germany No
Euskaltel 764 840 Telecommunications BME Spain Yes
Flow Traders 521 599 Financials Euronext Netherlands Yes
ADO Properties 415 415 Financials Deutsche Börse Germany No
UK Mortgages 350 350 Financials London United Kingdom No
Space2 300 300 Financials Borsa Italiana Italy No
Cassiopea 157 169 Health Care SIX Swiss Italy No
Banca Sistema 146 161 Financials Borsa Italiana Italy Yes
On The Beach Group 132 132 Consumer Services London United Kingdom Yes
Menhaden Capital 112 112 Financials London United Kingdom No
Total 3,983 4,235
Ten largest IPOs in H1 2015€m (excl.
greenshoe)
€m (incl.
greenshoe)Sector Market Country of origin
PE
backed
Aena 3,875 4,263 Industrials BME Spain No
Auto Trader 1,937 2,228 Consumer Services London United Kingdom Yes
Sunrise Communications 1,882 2,148 Telecommunications SIX Swiss Switzerland Yes
Cellnex Telecom 1,946 2,141 Telecommunications BME Spain No
GrandVision 1,020 1,116 Health Care Euronext Netherlands Yes
Woodford Patient Capital Trust 1,108 1,108 Financials London United Kingdom No
SPIE 939 1,033 Industrials Euronext France Yes
Europcar Groupe 879 898 Consumer Services Euronext France Yes
INWIT 796 875 Telecommunications Borsa Italiana Italy No
Elis 750 854 Industrials Euronext France Yes
Total 15,132 16,664
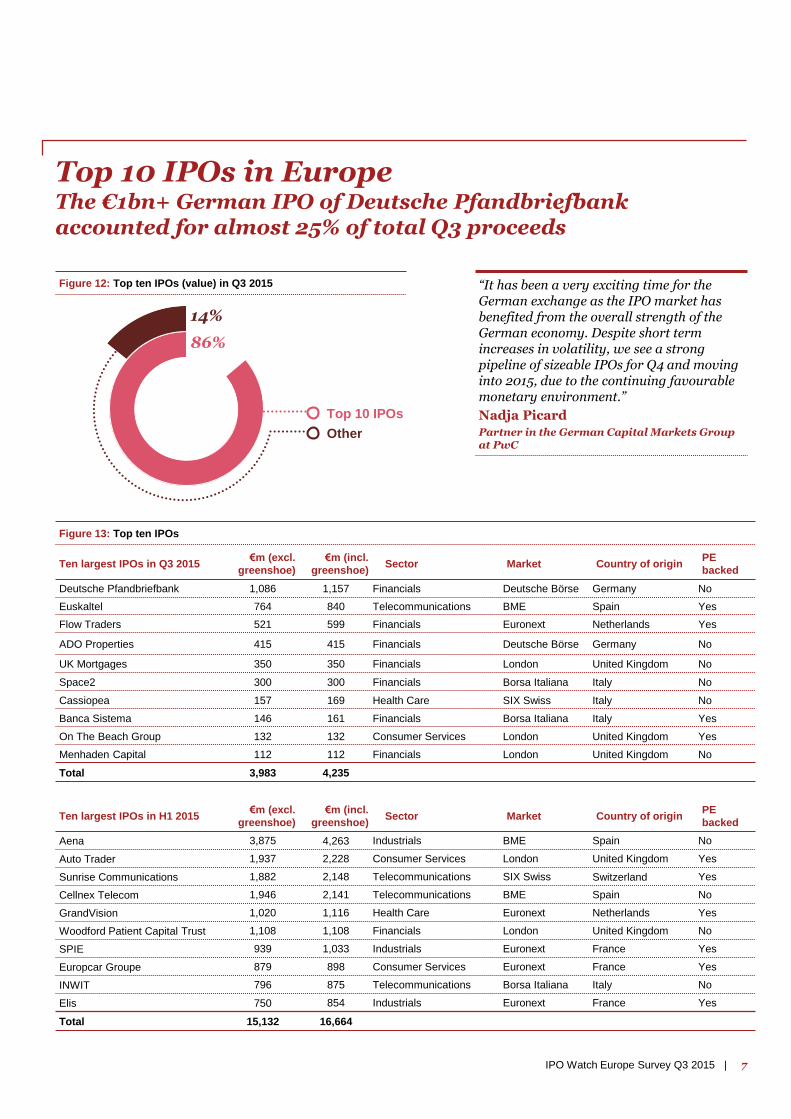
Top 10 IPOs in EuropeThe €1bn+ German IPO of Deutsche Pfandbriefbankaccounted for almost 25% of total Q3 proceeds
Figure 13: Top ten IPOs
Other
Top 10 IPOs
14%
86%
Figure 12: Top ten IPOs (value) in Q3 2015 “It has been a very exciting time for the German exchange as the IPO market has benefited from the overall strength of the German economy. Despite short term increases in volatility, we see a strongpipeline of sizeable IPOs for Q4 and moving into 2015, due to the continuing favourable monetary environment.”
Nadja Picard
Partner in the German Capital Markets Group at PwC
8 | IPO Watch Europe Survey Q3 2015
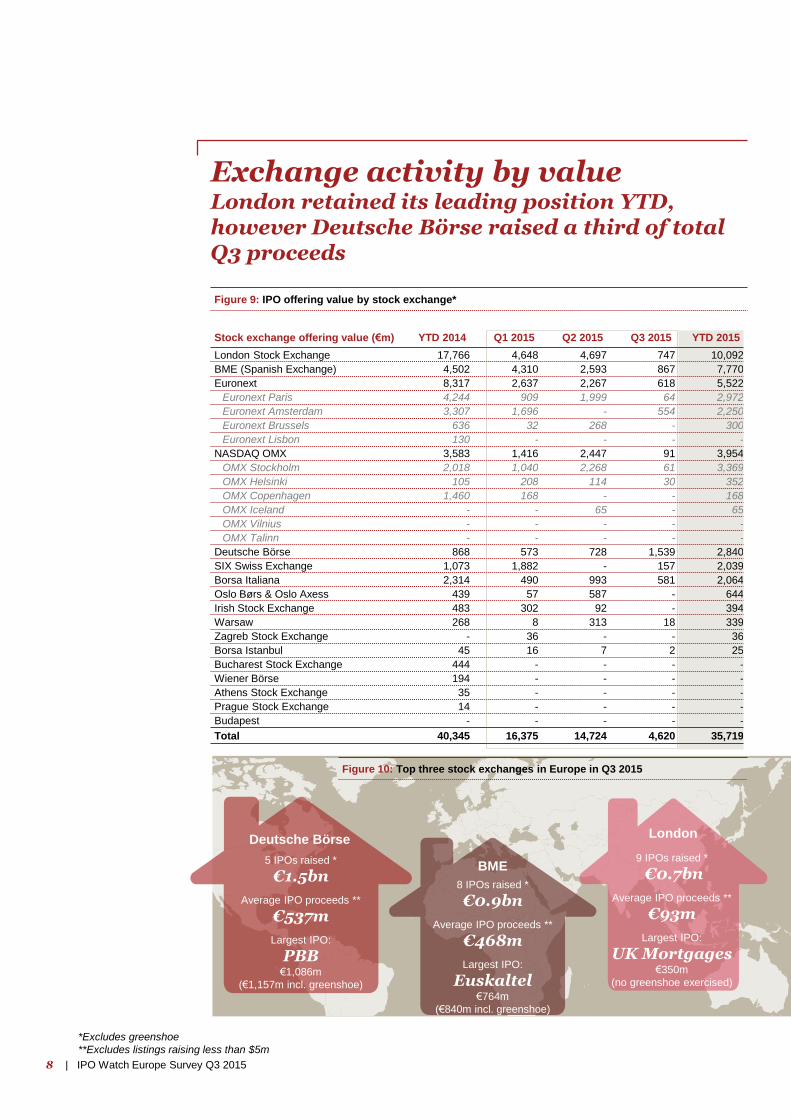
Stock exchange offering value (€m) YTD 2014 Q1 2015 Q2 2015 Q3 2015 YTD 2015
London Stock Exchange 17,766 4,648 4,697 747 10,092
BME (Spanish Exchange) 4,502 4,310 2,593 867 7,770
Euronext 8,317 2,637 2,267 618 5,522
Euronext Paris 4,244 909 1,999 64 2,972
Euronext Amsterdam 3,307 1,696 - 554 2,250
Euronext Brussels 636 32 268 - 300
Euronext Lisbon 130 - - - -
NASDAQ OMX 3,583 1,416 2,447 91 3,954
OMX Stockholm 2,018 1,040 2,268 61 3,369
OMX Helsinki 105 208 114 30 352
OMX Copenhagen 1,460 168 - - 168
OMX Iceland - - 65 - 65
OMX Vilnius - - - - -
OMX Talinn - - - - -
Deutsche Börse 868 573 728 1,539 2,840
SIX Swiss Exchange 1,073 1,882 - 157 2,039
Borsa Italiana 2,314 490 993 581 2,064
Oslo Børs & Oslo Axess 439 57 587 - 644
Irish Stock Exchange 483 302 92 - 394
Warsaw 268 8 313 18 339
Zagreb Stock Exchange - 36 - - 36
Borsa Istanbul 45 16 7 2 25
Bucharest Stock Exchange 444 - - - -
Wiener Börse 194 - - - -
Athens Stock Exchange 35 - - - -
Prague Stock Exchange 14 - - - -
Budapest - - - - -
Total 40,345 16,375 14,724 4,620 35,719
Figure 10: Top three stock exchanges in Europe in Q3 2015
Figure 9: IPO offering value by stock exchange*
*Excludes greenshoe
**Excludes listings raising less than $5m
BME
8 IPOs raised *
€0.9bn
Average IPO proceeds **
€468m
Largest IPO:
Euskaltel€764m
(€840m incl. greenshoe)
London
9 IPOs raised *
€0.7bn
Average IPO proceeds **
€93m
Largest IPO:
UK Mortgages€350m
(no greenshoe exercised)
Exchange activity by valueLondon retained its leading position YTD, however Deutsche Börse raised a third of total Q3 proceeds
Deutsche Börse
5 IPOs raised *
€1.5bn
Average IPO proceeds **
€537m
Largest IPO:
PBB€1,086m
(€1,157m incl. greenshoe)
9IPO Watch Europe Survey Q3 2015 |
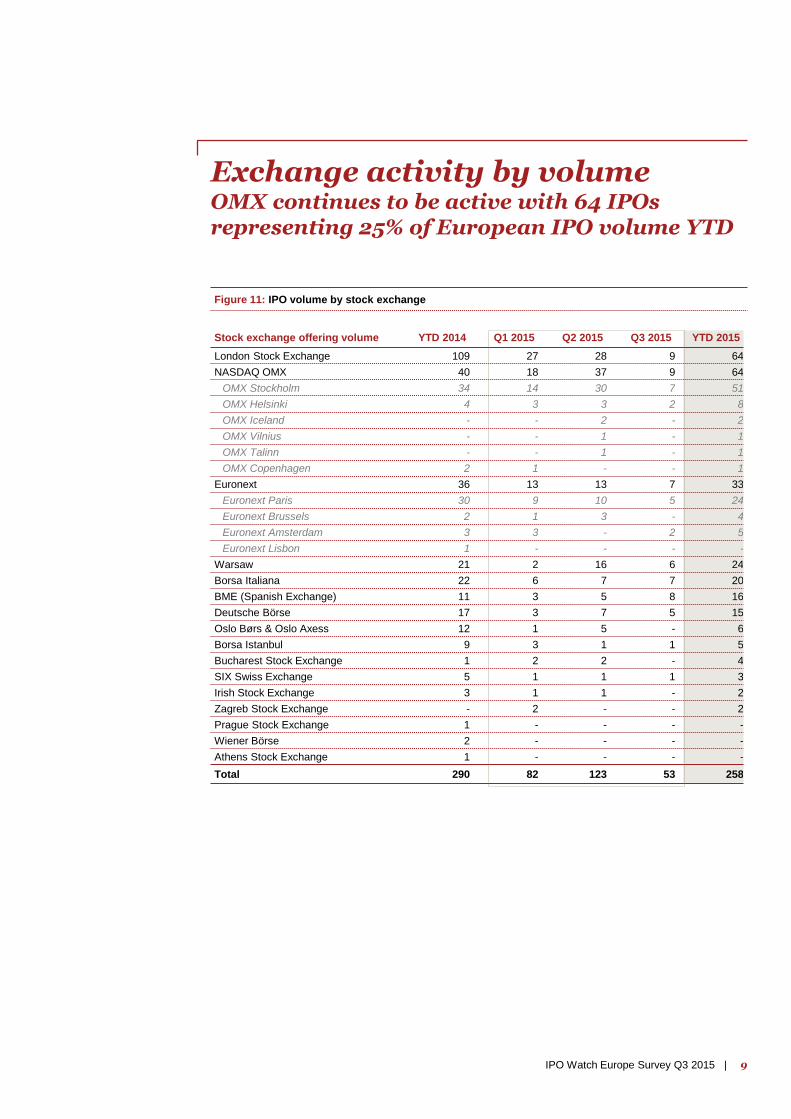
Exchange activity by volume OMX continues to be active with 64 IPOs representing 25% of European IPO volume YTD
Figure 11: IPO volume by stock exchange
Stock exchange offering volume YTD 2014 Q1 2015 Q2 2015 Q3 2015 YTD 2015
London Stock Exchange 109 27 28 9 64
NASDAQ OMX 40 18 37 9 64
OMX Stockholm 34 14 30 7 51
OMX Helsinki 4 3 3 2 8
OMX Iceland - - 2 - 2
OMX Vilnius - - 1 - 1
OMX Talinn - - 1 - 1
OMX Copenhagen 2 1 - - 1
Euronext 36 13 13 7 33
Euronext Paris 30 9 10 5 24
Euronext Brussels 2 1 3 - 4
Euronext Amsterdam 3 3 - 2 5
Euronext Lisbon 1 - - - -
Warsaw 21 2 16 6 24
Borsa Italiana 22 6 7 7 20
BME (Spanish Exchange) 11 3 5 8 16
Deutsche Börse 17 3 7 5 15
Oslo Børs & Oslo Axess 12 1 5 - 6
Borsa Istanbul 9 3 1 1 5
Bucharest Stock Exchange 1 2 2 - 4
SIX Swiss Exchange 5 1 1 1 3
Irish Stock Exchange 3 1 1 - 2
Zagreb Stock Exchange - 2 - - 2
Prague Stock Exchange 1 - - - -
Wiener Börse 2 - - - -
Athens Stock Exchange 1 - - - -
Total 290 82 123 53 258
10 | IPO Watch Europe Survey Q3 2015
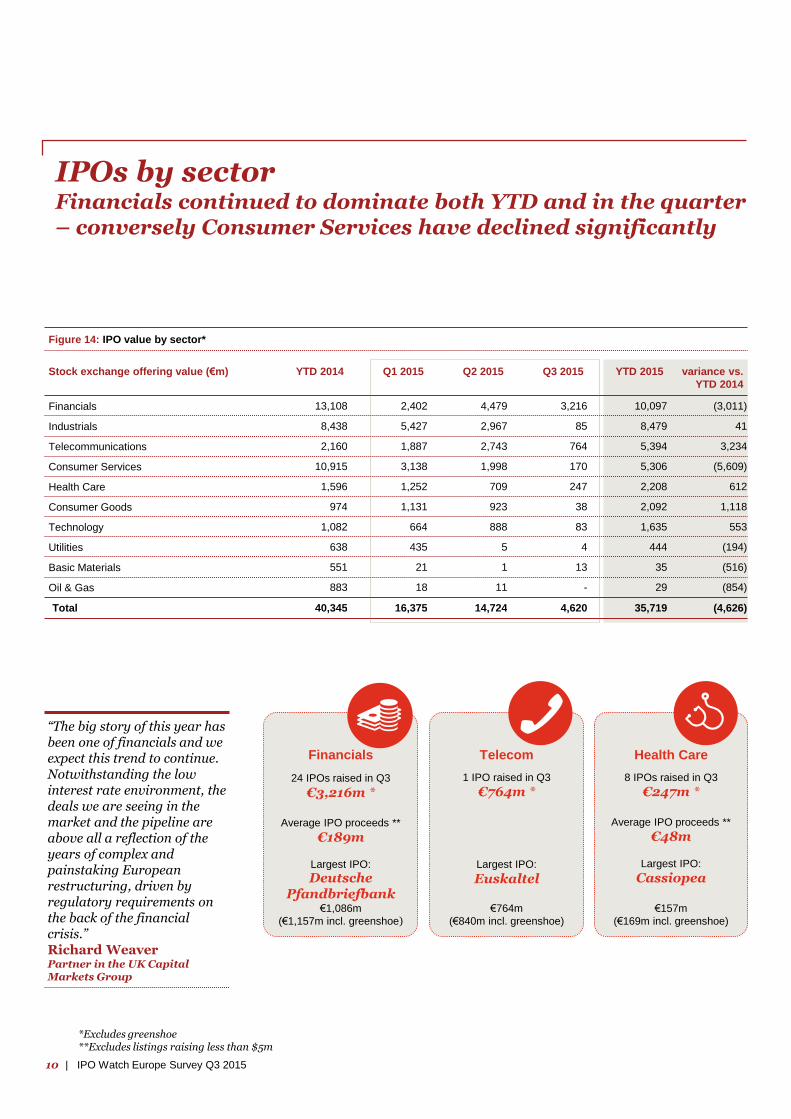
IPOs by sectorFinancials continued to dominate both YTD and in the quarter – conversely Consumer Services have declined significantly
*Excludes greenshoe**Excludes listings raising less than $5m
Stock exchange offering value (€m) YTD 2014 Q1 2015 Q2 2015 Q3 2015 YTD 2015 variance vs.
YTD 2014
Financials 13,108 2,402 4,479 3,216 10,097 (3,011)
Industrials 8,438 5,427 2,967 85 8,479 41
Telecommunications 2,160 1,887 2,743 764 5,394 3,234
Consumer Services 10,915 3,138 1,998 170 5,306 (5,609)
Health Care 1,596 1,252 709 247 2,208 612
Consumer Goods 974 1,131 923 38 2,092 1,118
Technology 1,082 664 888 83 1,635 553
Utilities 638 435 5 4 444 (194)
Basic Materials 551 21 1 13 35 (516)
Oil & Gas 883 18 11 - 29 (854)
Total 40,345 16,375 14,724 4,620 35,719 (4,626)
Figure 14: IPO value by sector*
Health Care
8 IPOs raised in Q3
€247m *
Average IPO proceeds **
€48m
Largest IPO:
Cassiopea
€157m
(€169m incl. greenshoe)
Telecom
1 IPO raised in Q3
€764m *
Largest IPO:
Euskaltel
€764m
(€840m incl. greenshoe)
Financials
24 IPOs raised in Q3
€3,216m *
Average IPO proceeds **
€189m
Largest IPO:
Deutsche Pfandbriefbank
€1,086m
(€1,157m incl. greenshoe)
“The big story of this year has been one of financials and we expect this trend to continue.Notwithstanding the low interest rate environment, the deals we are seeing in the market and the pipeline are above all a reflection of the years of complex and painstaking European restructuring, driven by regulatory requirements on the back of the financial crisis.”Richard WeaverPartner in the UK Capital Markets Group
11IPO Watch Europe Survey Q3 2015 |
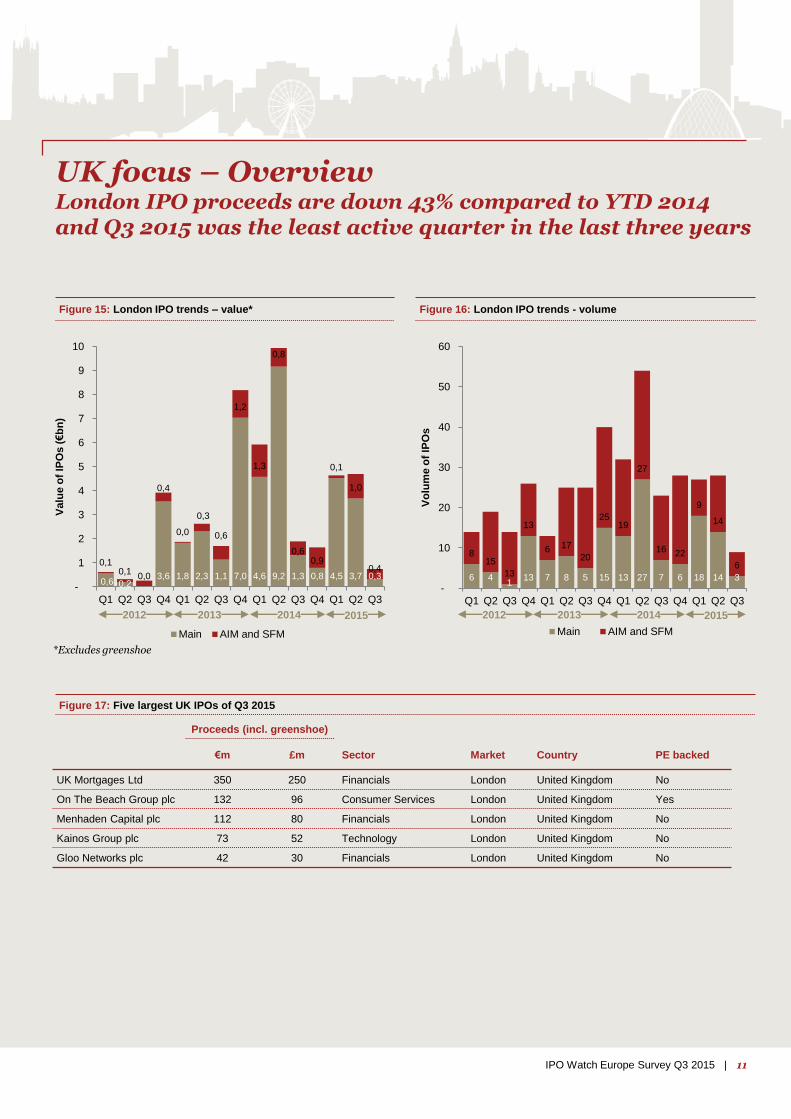
UK focus – OverviewLondon IPO proceeds are down 43% compared to YTD 2014 and Q3 2015 was the least active quarter in the last three years
Figure 15: London IPO trends – value* Figure 16: London IPO trends - volume
Proceeds (incl. greenshoe)
€m £m Sector Market Country PE backed
UK Mortgages Ltd 350 250 Financials London United Kingdom No
On The Beach Group plc 132 96 Consumer Services London United Kingdom Yes
Menhaden Capital plc 112 80 Financials London United Kingdom No
Kainos Group plc 73 52 Technology London United Kingdom No
Gloo Networks plc 42 30 Financials London United Kingdom No
Figure 17: Five largest UK IPOs of Q3 2015
6 41
13 7 8 5 15 13 27 7 6 18 14 3
815
13
13
6 17
20
2519
27
16 22
9
14
6
-
10
20
30
40
50
60
Q1 Q2 Q3 Q4 Q1 Q2 Q3 Q4 Q1 Q2 Q3 Q4 Q1 Q2 Q3
Vo
lum
e o
f IP
Os
Main AIM and SFM
0,6 0,20,0 3,6 1,8 2,3 1,1 7,0 4,6 9,2 1,3 0,8 4,5 3,7 0,3
0,10,1
0,4
0,0
0,3
0,6
1,2
1,3
0,8
0,60,9
0,1
1,0
0,4
-
1
2
3
4
5
6
7
8
9
10
Q1 Q2 Q3 Q4 Q1 Q2 Q3 Q4 Q1 Q2 Q3 Q4 Q1 Q2 Q3
Valu
e o
f IP
Os (€b
n)
Main AIM and SFM
2012 2013 2014 2015
*Excludes greenshoe
2012 2013 2014 2015
12 | IPO Watch Europe Survey Q3 2015
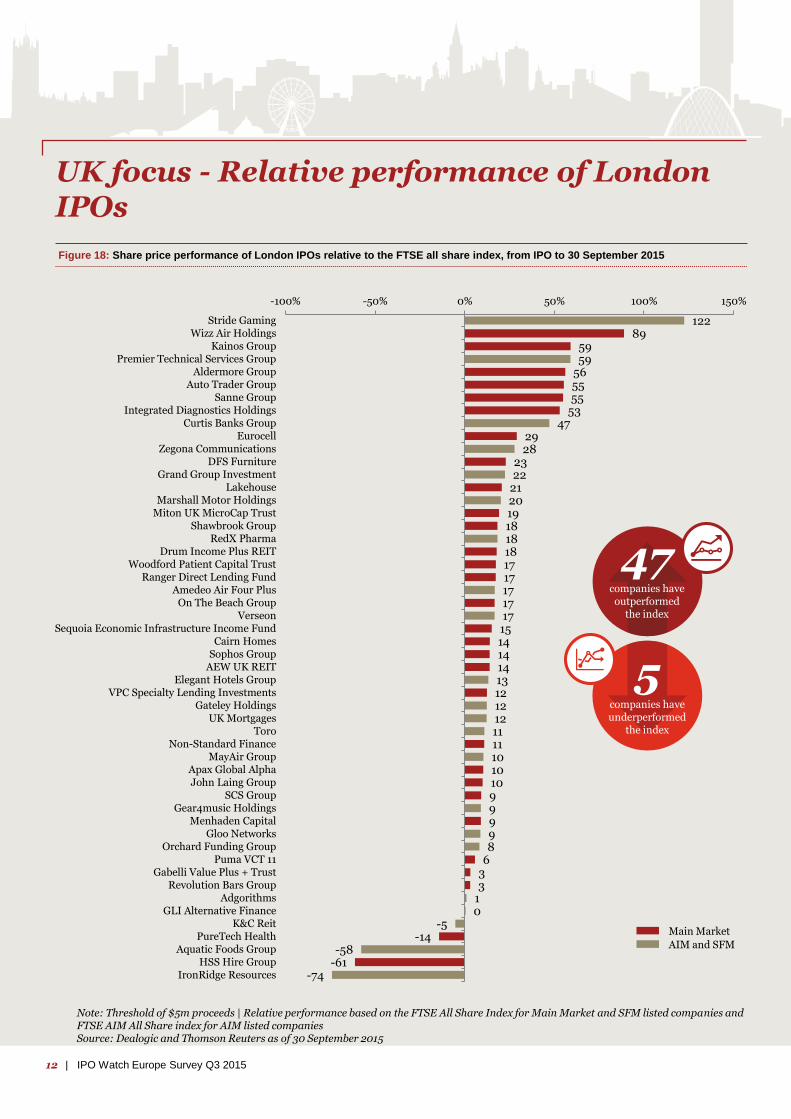
UK focus - Relative performance of London IPOs
Figure 18: Share price performance of London IPOs relative to the FTSE all share index, from IPO to 30 September 2015
Note: Threshold of $5m proceeds | Relative performance based on the FTSE All Share Index for Main Market and SFM listed companies and FTSE AIM All Share index for AIM listed companiesSource: Dealogic and Thomson Reuters as of 30 September 2015
12289
5959
565555
5347
2928
2322
21201918181817171717171514141413121212111110101099998
633
10
-5-14
-58-61
-74
-100% -50% 0% 50% 100% 150%
Stride GamingWizz Air Holdings
Kainos GroupPremier Technical Services Group
Aldermore GroupAuto Trader Group
Sanne GroupIntegrated Diagnostics Holdings
Curtis Banks GroupEurocell
Zegona CommunicationsDFS Furniture
Grand Group InvestmentLakehouse
Marshall Motor HoldingsMiton UK MicroCap Trust
Shawbrook GroupRedX Pharma
Drum Income Plus REITWoodford Patient Capital Trust
Ranger Direct Lending FundAmedeo Air Four Plus
On The Beach GroupVerseon
Sequoia Economic Infrastructure Income FundCairn Homes
Sophos GroupAEW UK REIT
Elegant Hotels GroupVPC Specialty Lending Investments
Gateley HoldingsUK Mortgages
ToroNon-Standard Finance
MayAir GroupApax Global AlphaJohn Laing Group
SCS GroupGear4music Holdings
Menhaden CapitalGloo Networks
Orchard Funding GroupPuma VCT 11
Gabelli Value Plus + TrustRevolution Bars Group
AdgorithmsGLI Alternative Finance
K&C ReitPureTech Health
Aquatic Foods GroupHSS Hire Group
IronRidge Resources
5companies have underperformed
the index
47companies have outperformed
the index
Main Market
AIM and SFM
13IPO Watch Europe Survey Q3 2015 |
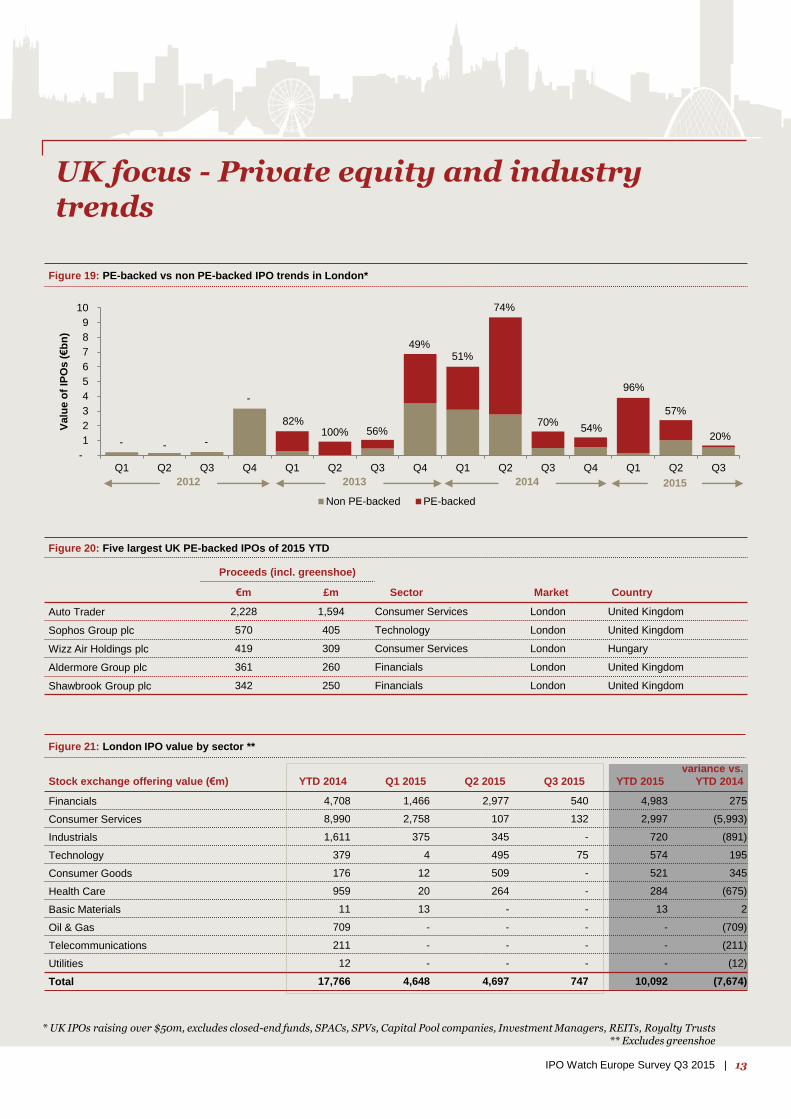
UK focus - Private equity and industry trends
* UK IPOs raising over $50m, excludes closed-end funds, SPACs, SPVs, Capital Pool companies, Investment Managers, REITs, Royalty Trusts** Excludes greenshoe
Figure 19: PE-backed vs non PE-backed IPO trends in London*
Figure 20: Five largest UK PE-backed IPOs of 2015 YTD
Figure 21: London IPO value by sector **
-
1
2
3
4
5
6
7
8
9
10
Q1 Q2 Q3 Q4 Q1 Q2 Q3 Q4 Q1 Q2 Q3 Q4 Q1 Q2 Q3
Valu
e o
f IP
Os (€b
n)
Non PE-backed PE-backed
2012 2013 2014 2015
Proceeds (incl. greenshoe)
€m £m Sector Market Country
Auto Trader 2,228 1,594 Consumer Services London United Kingdom
Sophos Group plc 570 405 Technology London United Kingdom
Wizz Air Holdings plc 419 309 Consumer Services London Hungary
Aldermore Group plc 361 260 Financials London United Kingdom
Shawbrook Group plc 342 250 Financials London United Kingdom
- - -
-
82%100% 56%
49%51%
74%
70%54%
96%
57%
Stock exchange offering value (€m) YTD 2014 Q1 2015 Q2 2015 Q3 2015 YTD 2015
variance vs.
YTD 2014
Financials 4,708 1,466 2,977 540 4,983 275
Consumer Services 8,990 2,758 107 132 2,997 (5,993)
Industrials 1,611 375 345 - 720 (891)
Technology 379 4 495 75 574 195
Consumer Goods 176 12 509 - 521 345
Health Care 959 20 264 - 284 (675)
Basic Materials 11 13 - - 13 2
Oil & Gas 709 - - - - (709)
Telecommunications 211 - - - - (211)
Utilities 12 - - - - (12)
Total 17,766 4,648 4,697 747 10,092 (7,674)
20%
14 | IPO Watch Europe Survey Q3 2015
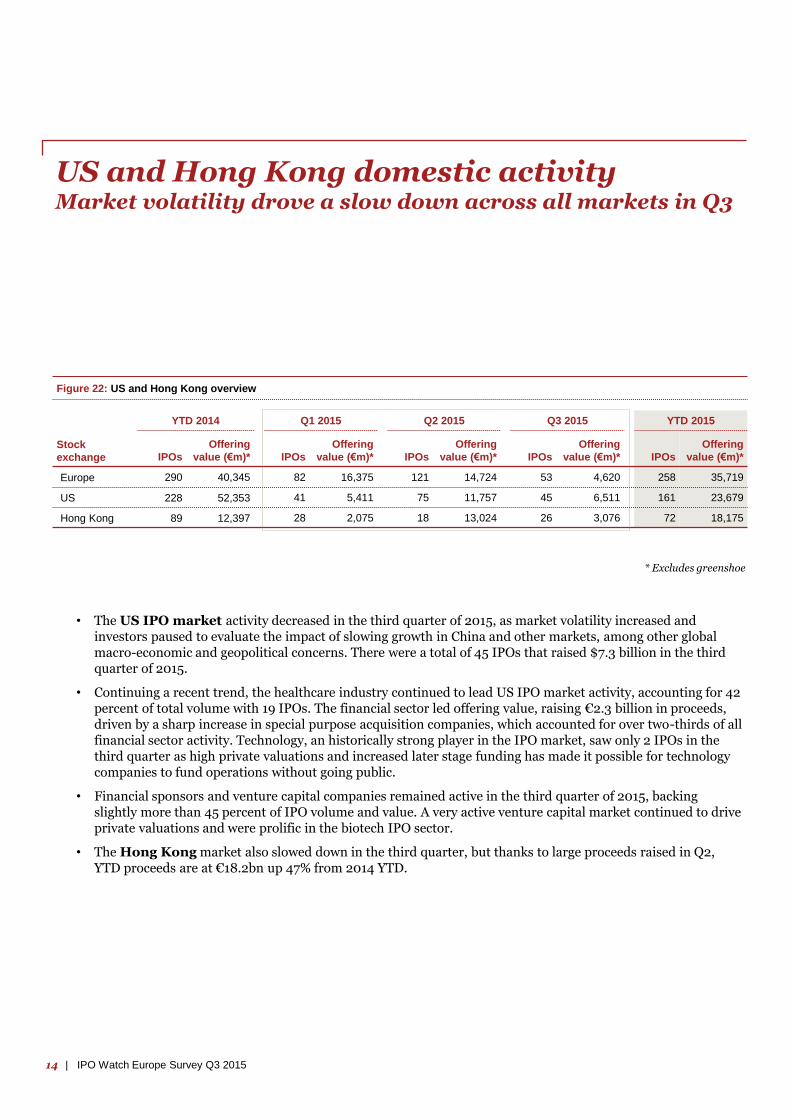
US and Hong Kong domestic activityMarket volatility drove a slow down across all markets in Q3
* Excludes greenshoe
YTD 2014 Q1 2015 Q2 2015 Q3 2015 YTD 2015
Stock
exchange IPOs
Offering
value (€m)* IPOs
Offering
value (€m)* IPOs
Offering
value (€m)* IPOs
Offering
value (€m)* IPOs
Offering
value (€m)*
Europe 290 40,345 82 16,375 121 14,724 53 4,620 258 35,719
US 228 52,353 41 5,411 75 11,757 45 6,511 161 23,679
Hong Kong 89 12,397 28 2,075 18 13,024 26 3,076 72 18,175
Figure 22: US and Hong Kong overview
• The US IPO market activity decreased in the third quarter of 2015, as market volatility increased and investors paused to evaluate the impact of slowing growth in China and other markets, among other global macro-economic and geopolitical concerns. There were a total of 45 IPOs that raised $7.3 billion in the third quarter of 2015.
• Continuing a recent trend, the healthcare industry continued to lead US IPO market activity, accounting for 42 percent of total volume with 19 IPOs. The financial sector led offering value, raising €2.3 billion in proceeds, driven by a sharp increase in special purpose acquisition companies, which accounted for over two-thirds of all financial sector activity. Technology, an historically strong player in the IPO market, saw only 2 IPOs in the third quarter as high private valuations and increased later stage funding has made it possible for technology companies to fund operations without going public.
• Financial sponsors and venture capital companies remained active in the third quarter of 2015, backing slightly more than 45 percent of IPO volume and value. A very active venture capital market continued to drive private valuations and were prolific in the biotech IPO sector.
• The Hong Kong market also slowed down in the third quarter, but thanks to large proceeds raised in Q2, YTD proceeds are at €18.2bn up 47% from 2014 YTD.
15IPO Watch Europe Survey Q3 2015 |
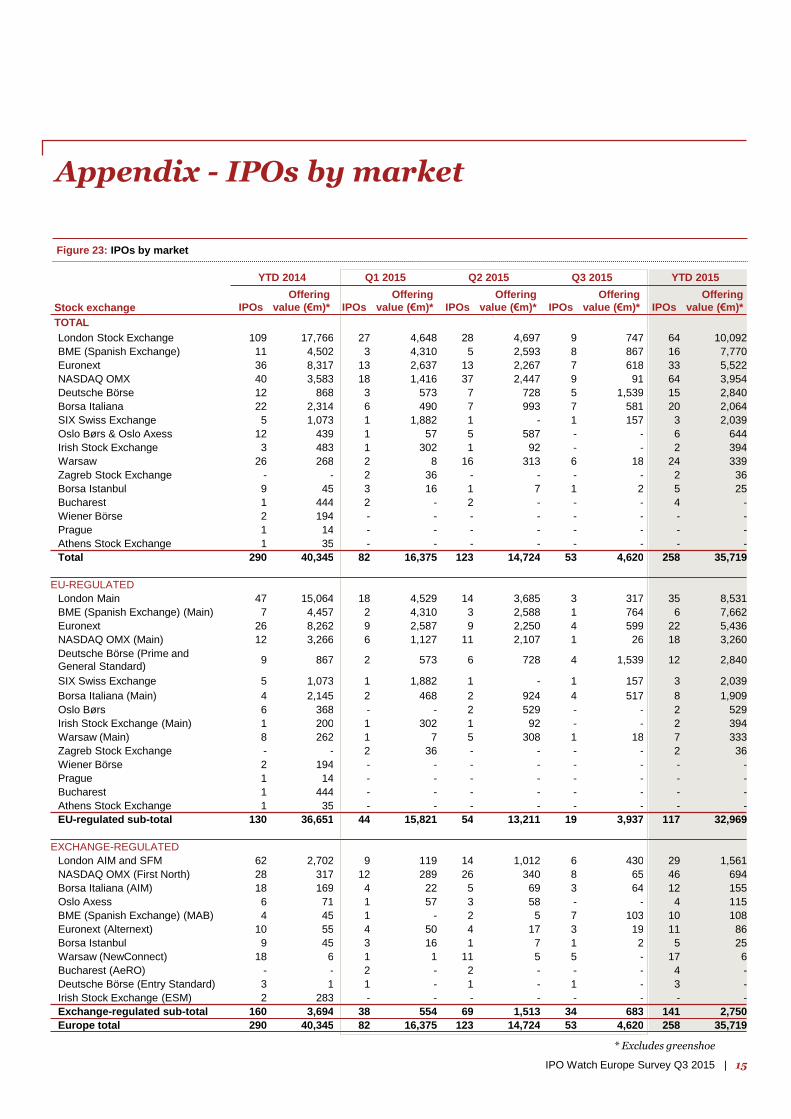
Appendix - IPOs by market
* Excludes greenshoe
Figure 23: IPOs by market
YTD 2014 Q1 2015 Q2 2015 Q3 2015 YTD 2015
Stock exchange IPOs
Offering
value (€m)* IPOs
Offering
value (€m)* IPOs
Offering
value (€m)* IPOs
Offering
value (€m)* IPOs
Offering
value (€m)*
TOTAL
London Stock Exchange 109 17,766 27 4,648 28 4,697 9 747 64 10,092
BME (Spanish Exchange) 11 4,502 3 4,310 5 2,593 8 867 16 7,770
Euronext 36 8,317 13 2,637 13 2,267 7 618 33 5,522
NASDAQ OMX 40 3,583 18 1,416 37 2,447 9 91 64 3,954
Deutsche Börse 12 868 3 573 7 728 5 1,539 15 2,840
Borsa Italiana 22 2,314 6 490 7 993 7 581 20 2,064
SIX Swiss Exchange 5 1,073 1 1,882 1 - 1 157 3 2,039
Oslo Børs & Oslo Axess 12 439 1 57 5 587 - - 6 644
Irish Stock Exchange 3 483 1 302 1 92 - - 2 394
Warsaw 26 268 2 8 16 313 6 18 24 339
Zagreb Stock Exchange - - 2 36 - - - - 2 36
Borsa Istanbul 9 45 3 16 1 7 1 2 5 25
Bucharest 1 444 2 - 2 - - - 4 -
Wiener Börse 2 194 - - - - - - - -
Prague 1 14 - - - - - - - -
Athens Stock Exchange 1 35 - - - - - - - -
Total 290 40,345 82 16,375 123 14,724 53 4,620 258 35,719
EU-REGULATED
London Main 47 15,064 18 4,529 14 3,685 3 317 35 8,531
BME (Spanish Exchange) (Main) 7 4,457 2 4,310 3 2,588 1 764 6 7,662
Euronext 26 8,262 9 2,587 9 2,250 4 599 22 5,436
NASDAQ OMX (Main) 12 3,266 6 1,127 11 2,107 1 26 18 3,260
Deutsche Börse (Prime and
General Standard) 9 867 2 573 6 728 4 1,539 12 2,840
SIX Swiss Exchange 5 1,073 1 1,882 1 - 1 157 3 2,039
Borsa Italiana (Main) 4 2,145 2 468 2 924 4 517 8 1,909
Oslo Børs 6 368 - - 2 529 - - 2 529
Irish Stock Exchange (Main) 1 200 1 302 1 92 - - 2 394
Warsaw (Main) 8 262 1 7 5 308 1 18 7 333
Zagreb Stock Exchange - - 2 36 - - - - 2 36
Wiener Börse 2 194 - - - - - - - -
Prague 1 14 - - - - - - - -
Bucharest 1 444 - - - - - - - -
Athens Stock Exchange 1 35 - - - - - - - -
EU-regulated sub-total 130 36,651 44 15,821 54 13,211 19 3,937 117 32,969
EXCHANGE-REGULATED
London AIM and SFM 62 2,702 9 119 14 1,012 6 430 29 1,561
NASDAQ OMX (First North) 28 317 12 289 26 340 8 65 46 694
Borsa Italiana (AIM) 18 169 4 22 5 69 3 64 12 155
Oslo Axess 6 71 1 57 3 58 - - 4 115
BME (Spanish Exchange) (MAB) 4 45 1 - 2 5 7 103 10 108
Euronext (Alternext) 10 55 4 50 4 17 3 19 11 86
Borsa Istanbul 9 45 3 16 1 7 1 2 5 25
Warsaw (NewConnect) 18 6 1 1 11 5 5 - 17 6
Bucharest (AeRO) - - 2 - 2 - - - 4 -
Deutsche Börse (Entry Standard) 3 1 1 - 1 - 1 - 3 -
Irish Stock Exchange (ESM) 2 283 - - - - - - - -
Exchange-regulated sub-total 160 3,694 38 554 69 1,513 34 683 141 2,750
Europe total 290 40,345 82 16,375 123 14,724 53 4,620 258 35,719
This publication has been prepared for general guidance on matters of interest only, and does not constitute professional
advice. You should not act upon the information contained in this publication without obtaining specific professional
advice. No representation or warranty (express or implied) is given as to the accuracy or completeness of the information
contained in this publication, and, to the extent permitted by law, PricewaterhouseCoopers LLP, its members, employees
and agents do not accept or assume any liability, responsibility or duty of care for any consequences of you or anyone
else acting, or refraining to act, in reliance on the information contained in this publication or for any decision based on it.
© 2015 PricewaterhouseCoopers LLP. All rights reserved. In this document, “PwC” refers to PricewaterhouseCoopers LLP
which is a member firm of PricewaterhouseCoopers International Limited, each member firm of which is a separate legal
entity.
Contacts
IPO Watch Europe surveys all new primary market equity IPOs on Europe’s principal stock markets and market segments (including exchanges in Austria, Belgium, Croatia, Denmark, France, Germany, Greece, the Netherlands, Ireland, Italy, Luxembourg, Norway, Poland, Portugal, Romania, Spain, Sweden, Switzerland, Turkey and the UK) on a quarterly basis. Movements between markets on the same exchange are excluded.
This survey was conducted between 1 July and 30 September 2015 and captures IPOs based on their first trading date. All market data is sourced from the stock markets themselves and has not been independently verified by PricewaterhouseCoopers LLP.
About IPO Watch Europe
David Jetuah (Press office)+44 (0) 20 7212 [email protected]
Mark Hughes+44 (0) 20 7804 [email protected]
Richard Weaver+44 (0) 20 7804 [email protected]
Vivienne Maclachlan+44 (0) 20 7804 [email protected]
16 | IPO Watch Europe Survey Q3 2015