Embed Size (px)
Citation preview
IOSR Journal of Economics and Finance (IOSR-JEF)
e-ISSN: 2321-5933, p-ISSN: 2321-5925.Volume 6, Issue 1. Ver. I (Jan.-Feb. 2015), PP 61-73 www.iosrjournals.org
DOI: 10.9790/5933-06116173 www.iosrjournals.org 61 | Page
Environmental Pollution and responsible factors in the
Mediterranean area
Lahoucine Assellam 1
Center for doctoral studies in Law and Economics (CEDoc)
Faculty of Law, Economics and Social Sciences Doctoral College, University Mohammed V-Agdal Rabat (UM5A), MOROCCO.
Abstract: Since 1995, there is a downward trend of CO2 emissions in the Euro-Mediterranean countries. It
seeks to identify the political and economic factors of this performance; in particular, the role played by the
severity of the environmental policy. This article is the result of a parametric search, in which we developed two
structural equation of pollution, one for the demand and the other for the supply. We used the technique of
MMG-system to estimate appropriate model for our sample countries euro-Mediterranean (also called
Barcelona Process), divided into three groups of countries: European, Arab Mediterranean, MEDA group. The
period of our study spans between 1995 and 2009. Our results show that, all things being equal, the effect of scale alone would explain an increase of 35.39% of
industrial CO2 emissions in countries of Euro-Mediterranean . The composition effect contributed 1.5% to a
reduction in greenhouse gas emissions, and the technical effect was the largest marginal impact, corresponding to a reduction of 37.15 % of emissions industrial
Keywords: Euro-Mediterranean countries; environmental policy index, scale effect, composition effect,
technique effect.
I. Introduction From an economic vantage point, the relation between economic growth and the quality of
environment has triggered a heated debate and a greater amount of literature has been produced on the issue.
Researchers usually enlist three major influences that may determine the global economic impacts of growth or
commerce on environment. Firstly, scale effect, more production means more pollution. secondly, the
composition effect, based on the conventional Heckscher-samwelson-Ohlin approach in which a free trade enables each Nations state to specialize in sectors that it deems comparatively beneficial. Trade therefore affects
the composition of production. Thirdly, technique effect allows taking into consideration the fact that output
need not be produced by the same technologies, involving a variety of different techniques some of which are
cleaner than others. By using more or less environment friendly techniques, pollution in the GDP unit might
decrease or increase.
This calls into attention to the fact that the structural and technical changes might be perceived
differently on Mediterranean coasts. The question that needs to be raised is: can the composition and technique
effects compensate for the scale effect? What are the gains that can hopefully be derived from the composition
effects and technique effect? Will the scale effect be substituted by technique effect?
The paper would be presented and discussed in two steps. Firstly, we will expose the Stylized Facts.
Secondly, we will present the model with a description of the variables and the used economic techniques; thirdly, we will interpret the results according to our estimation.
My research problematic germinates therefore from the need to identify and analyze the key factors
determining the changes in air quality country of the two shores of the Mediterranean Sea(Euro-Mediterranean ,
also known as the Barcelona Process, was established in Barcelona in 1995 at the initiative of the European
Union (EU) and ten other countries bordering the Mediterranean Sea States ( Algeria , Palestinian Authority,
Egypt, Israel, Jordan, Lebanon, Morocco , Syria, Tunisia and Turkey) Libya has observer status since 1999,
Austria, Belgium, Cyprus, Denmark, Finland, France, Greece, Ireland, Italy, Malta, Netherlands, Portugal,
United Kingdom and Sweden). This study proposes to analyze the determinants of the reduction of the CO2
emissions in the country of the two shores of the Mediterranean Sea, comparing the results to the group of the
Europeans countries, the group of Arab-Mediterranean Countries and MEDA group Algeria, Egypt, Jordan,
Morocco, Syria, Tunisia and Turkey). Particular attention will be linked to the political and institutional efforts.
In order to do this, we estimate a very simple model that bears out the interaction of evolution factors of economic context (GDP per capita, net income per capita, manufacturing sub-sectors, trade liberalization)
with quality of institutions in determining environmental performances in Mediterranean countries. Besides
being simple, our approach is novel in two ways. First, by exploiting the panel structure of our database, it is
possible to practically distinguish between negative environmental consequences of scale effect due to the surge
Environmental Pollution and responsible factors in the Mediterranean area
DOI: 10.9790/5933-06116173 www.iosrjournals.org 62 | Page
in economic activity and the positive consequences that ensue from a halt in the growth of polluting economic
activity knowing that the first effects are due to the increase in economic activity and second engendered by the
severity in environmental politics and a change in industrial production structure. Then, using the methodology of a system of simultaneous equations, we can simultaneously analyze the effects of economic factors and those
of political factors on industrial air pollution.
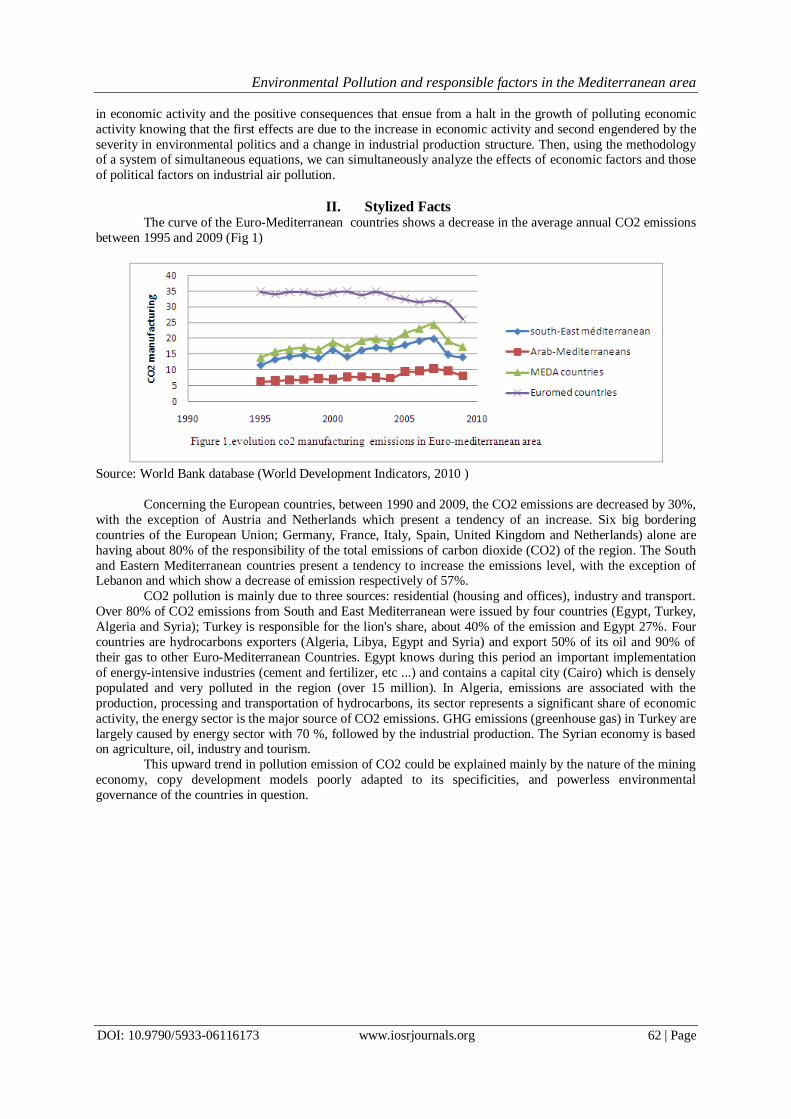
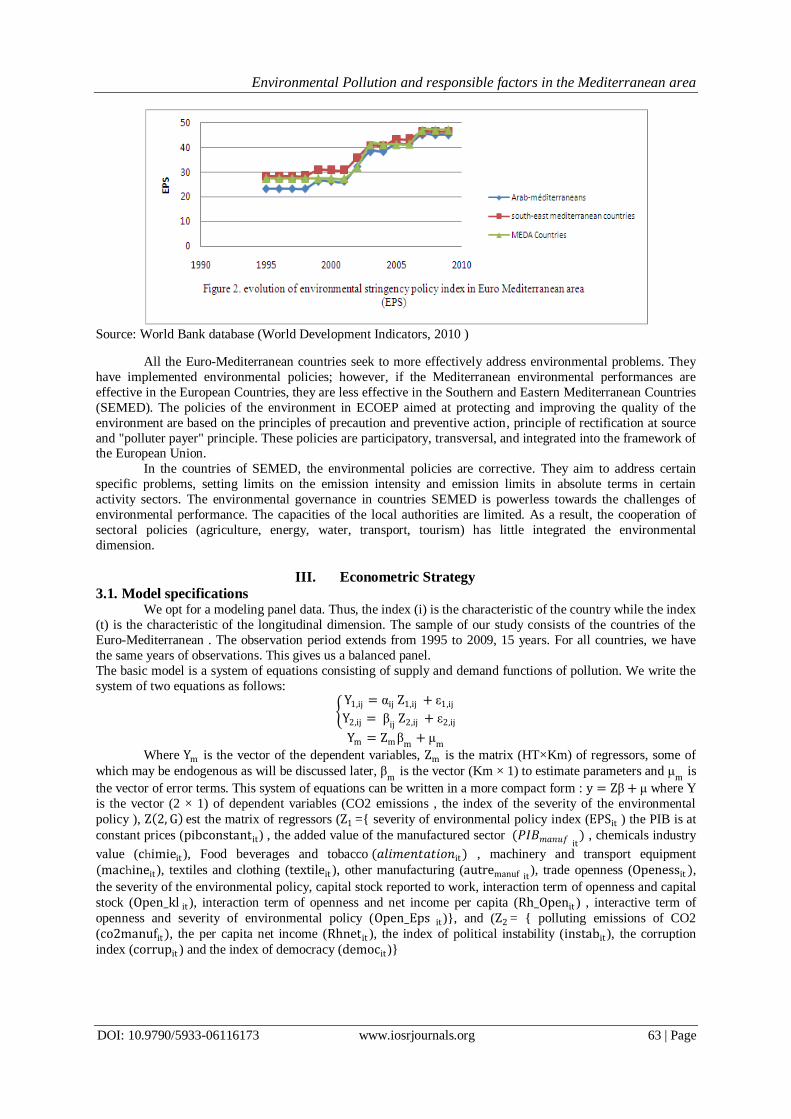
II. Stylized Facts The curve of the Euro-Mediterranean countries shows a decrease in the average annual CO2 emissions
between 1995 and 2009 (Fig 1)
Source: World Bank database (World Development Indicators, 2010 )
Concerning the European countries, between 1990 and 2009, the CO2 emissions are decreased by 30%,
with the exception of Austria and Netherlands which present a tendency of an increase. Six big bordering
countries of the European Union; Germany, France, Italy, Spain, United Kingdom and Netherlands) alone are
having about 80% of the responsibility of the total emissions of carbon dioxide (CO2) of the region. The South
and Eastern Mediterranean countries present a tendency to increase the emissions level, with the exception of Lebanon and which show a decrease of emission respectively of 57%.
CO2 pollution is mainly due to three sources: residential (housing and offices), industry and transport.
Over 80% of CO2 emissions from South and East Mediterranean were issued by four countries (Egypt, Turkey,
Algeria and Syria); Turkey is responsible for the lion's share, about 40% of the emission and Egypt 27%. Four
countries are hydrocarbons exporters (Algeria, Libya, Egypt and Syria) and export 50% of its oil and 90% of
their gas to other Euro-Mediterranean Countries. Egypt knows during this period an important implementation
of energy-intensive industries (cement and fertilizer, etc ...) and contains a capital city (Cairo) which is densely
populated and very polluted in the region (over 15 million). In Algeria, emissions are associated with the
production, processing and transportation of hydrocarbons, its sector represents a significant share of economic
activity, the energy sector is the major source of CO2 emissions. GHG emissions (greenhouse gas) in Turkey are
largely caused by energy sector with 70 %, followed by the industrial production. The Syrian economy is based on agriculture, oil, industry and tourism.
This upward trend in pollution emission of CO2 could be explained mainly by the nature of the mining
economy, copy development models poorly adapted to its specificities, and powerless environmental
governance of the countries in question.
Environmental Pollution and responsible factors in the Mediterranean area
DOI: 10.9790/5933-06116173 www.iosrjournals.org 63 | Page
Source: World Bank database (World Development Indicators, 2010 )
All the Euro-Mediterranean countries seek to more effectively address environmental problems. They
have implemented environmental policies; however, if the Mediterranean environmental performances are
effective in the European Countries, they are less effective in the Southern and Eastern Mediterranean Countries
(SEMED). The policies of the environment in ECOEP aimed at protecting and improving the quality of the
environment are based on the principles of precaution and preventive action, principle of rectification at source
and "polluter payer" principle. These policies are participatory, transversal, and integrated into the framework of the European Union.
In the countries of SEMED, the environmental policies are corrective. They aim to address certain
specific problems, setting limits on the emission intensity and emission limits in absolute terms in certain
activity sectors. The environmental governance in countries SEMED is powerless towards the challenges of
environmental performance. The capacities of the local authorities are limited. As a result, the cooperation of
sectoral policies (agriculture, energy, water, transport, tourism) has little integrated the environmental
dimension.
III. Econometric Strategy
3.1. Model specifications We opt for a modeling panel data. Thus, the index (i) is the characteristic of the country while the index
(t) is the characteristic of the longitudinal dimension. The sample of our study consists of the countries of the
Euro-Mediterranean . The observation period extends from 1995 to 2009, 15 years. For all countries, we have
the same years of observations. This gives us a balanced panel.
The basic model is a system of equations consisting of supply and demand functions of pollution. We write the
system of two equations as follows:
Y1,ij = αij Z1,ij + ε1,ij
Y2,ij = βij
Z2,ij + ε2,ij
Ym = Zm βm
+ μm
Where Ym is the vector of the dependent variables, Zm is the matrix (HT×Km) of regressors, some of
which may be endogenous as will be discussed later, βm
is the vector (Km × 1) to estimate parameters and μm
is
the vector of error terms. This system of equations can be written in a more compact form : y = Zβ + μ where Y
is the vector (2 × 1) of dependent variables (CO2 emissions , the index of the severity of the environmental
policy ), Z 2, G est the matrix of regressors (Z1 ={ severity of environmental policy index (EPSit ) the PIB is at
constant prices (pibconstantit) , the added value of the manufactured sector (𝑃𝐼𝐵𝑚𝑎𝑛𝑢𝑓 it) , chemicals industry
value (chimieit ), Food beverages and tobacco (𝑎𝑙𝑖𝑚𝑒𝑛𝑡𝑎𝑡𝑖𝑜𝑛it ) , machinery and transport equipment
(machineit ), textiles and clothing (textileit ), other manufacturing (autremanuf it), trade openness (Openessit ),
the severity of the environmental policy, capital stock reported to work, interaction term of openness and capital
stock (Open_kl it ), interaction term of openness and net income per capita (Rh_Openit ) , interactive term of
openness and severity of environmental policy (Open_Eps it )}, and (Z2 = { polluting emissions of CO2
(co2manufit ), the per capita net income (Rhnetit ), the index of political instability (instabit ), the corruption
index (corrupit ) and the index of democracy (democit )}

Environmental Pollution and responsible factors in the Mediterranean area
DOI: 10.9790/5933-06116173 www.iosrjournals.org 64 | Page
EPSit = α1 + α2co2manufit + α3instabit + α4corrupit + α5Rhnetit + α6democit + εit
CO2manufit = β1
+ β2
EPSit + β3
pibconstantit + β4
alimentationit + β5
chimieit + β6
machineit
β8
textileit + β7
PIBmanuf it+ β
8autremanuf it
+ β9Openessit + β
10
K
L it+ β
11Rh_Openit
+β12
Open_Eps it + Open_kl it + εit
3.2. Data description
3.2.1. Dependent variables
3.2.1.1. CO2 emission
In the absence of a single measure of environmental quality. In our study, the choice of carbon dioxide (CO2)
is explained by several factors:
1. The pollutant is a byproduct of the production of goods that is emitted in large quantities in polluting
industries;
2. Statistics of carbon dioxide emission for all the countries in time series are available, which is not the case
for all other pollutants; 3. It is associated with the reduction technologies of pollution;
4. CO2 is a proximate cause of greenhouse gas emissions that cause global warming by infrared radiation
from the earth absorbent;
5. It is subject to regulation because of its harmful effect on the population;
3.2.1.2. The index of the severity of environmental policy (EPS)
Walter and Ugelow (1979) [1] are among the first who attempted to measure the severity of the
environmental policy of the country. Dasgupta et al. (1995) [2]developed comparative indices, are to identify
the performance of environmental policy for 31 countries. Several indices to measure the severity of
environmental regulations are constructed by the following authors. In another study, developed comparative
indices, are to identify the performance of environmental as; Van Beers and Van den Bergh (1997) [3], Birdsall and Wheeler (1992) [4], Eliste and Fredriksson (2002) [5], Ederington and Al. (2003) [6], Dasgupta and Al.
(1995) [2], Cagatay and Mihci (2003) [7], Zugravu, N., Millock, K. and G., Duchene, (2007) [8].
We calculate a composite index based on a set of variables:
1. Multilateral Environmental Agreements (MEAs): signed by a country: it is considered that MEAs expresses
the willingness of government to harmonize its environmental policy with international standards. The more
agreement signed by the government, the greater the domestic legal arsenal environmental improves and
becomes more efficient. Thus, the State adopts more laws and regulations to prevent, reduce and control
pollution.
2. Density of Non-governmental Organizations (NGOs) per capita : represented by the number of members of
international NGOs to one million inhabitants . As mentioned by Dasgupta, Laplante and Mamingi (2001)
[9], Smarzynska and Wei (2004) [10], international NGOs sensitize local people to environmental issues,
and also put pressure on governments to encourage them to respect the laws. A relatively larger presence of NGOs in a country involves more stringent environmental regulations.
3. Number of ISO 14001 certified companies (ISO14001) weighted by GDP: We identified for each country
the number of ISO 14001 certifications, normalized by the GDP of this country.
4. Program membership Responsible Care®, a voluntary global initiative of the chemical industry under
which companies, represented by national associations, work together to improve safety and environmental
performance and to communicate with stake holders concerned about their products.
Taking into account the legislative and economic and social dimensions. The average, maximum and
minimum values are respectively one, four and seven (table1 in Annex). The assumption of the index is that the
government is forced to pursue an effective policy under the pressure of the influential groups (NGO). The civil
societies (lobbyists) are able to counteract the natural tendency of the collusion between public authorities and territorial groups by requiring law enforcement and sanctioning patronage abuses. We propose to calculate the
Environmental Pollution and responsible factors in the Mediterranean area
DOI: 10.9790/5933-06116173 www.iosrjournals.org 65 | Page
index of severity of environmental Policy (EPS) from all previous variables. Using the technique of multiple
factor analysis (MFA) that allows the aggregation of heterogeneous variables in a single measurement.
3.2.2. The independent variables
The following section deals with different independent variables of our model (table1 in Annex).
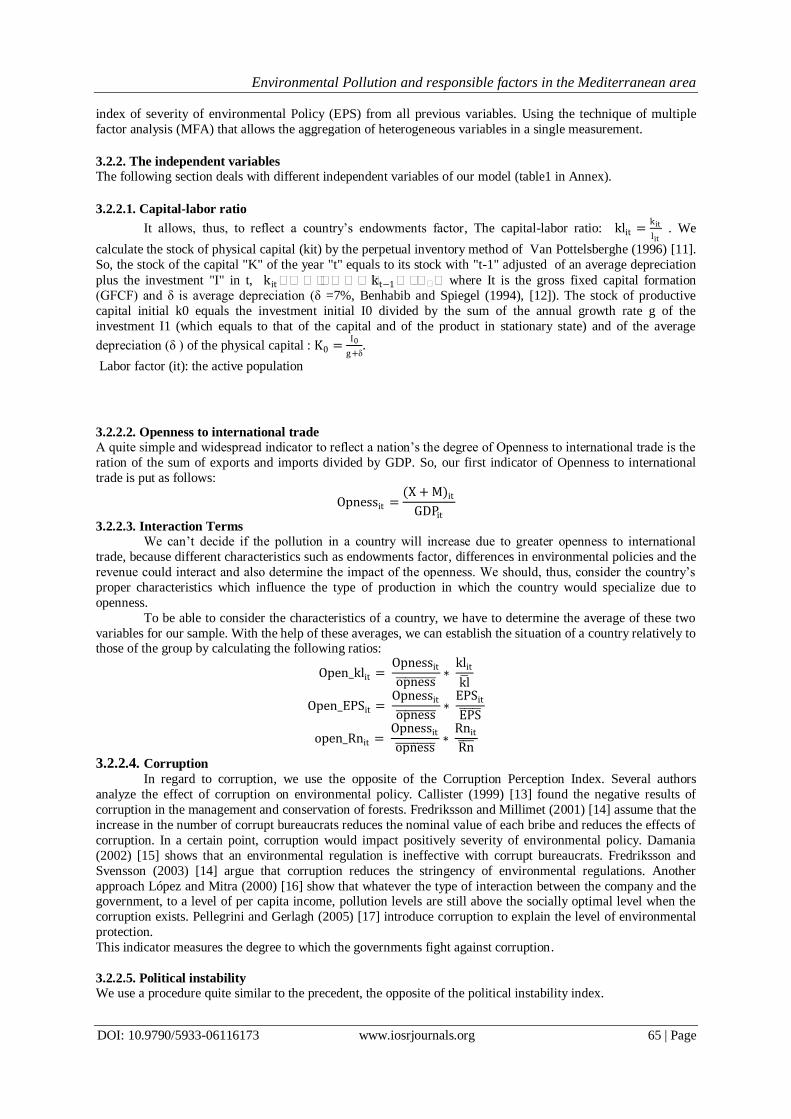
3.2.2.1. Capital-labor ratio
It allows, thus, to reflect a country’s endowments factor, The capital-labor ratio: klit =kit
lit . We
calculate the stock of physical capital (kit) by the perpetual inventory method of Van Pottelsberghe (1996) [11].
So, the stock of the capital "K" of the year "t" equals to its stock with "t-1" adjusted of an average depreciation
plus the investment "I" in t, kitkt−1 where It is the gross fixed capital formation
(GFCF) and δ is average depreciation (δ =7%, Benhabib and Spiegel (1994), [12]). The stock of productive
capital initial k0 equals the investment initial I0 divided by the sum of the annual growth rate g of the
investment I1 (which equals to that of the capital and of the product in stationary state) and of the average
depreciation (δ ) of the physical capital : K0 =I0
g+δ.
Labor factor (it): the active population
3.2.2.2. Openness to international trade A quite simple and widespread indicator to reflect a nation’s the degree of Openness to international trade is the
ration of the sum of exports and imports divided by GDP. So, our first indicator of Openness to international
trade is put as follows:
Opnessit =(X + M)it
GDPit
3.2.2.3. Interaction Terms We can’t decide if the pollution in a country will increase due to greater openness to international
trade, because different characteristics such as endowments factor, differences in environmental policies and the
revenue could interact and also determine the impact of the openness. We should, thus, consider the country’s
proper characteristics which influence the type of production in which the country would specialize due to
openness.
To be able to consider the characteristics of a country, we have to determine the average of these two
variables for our sample. With the help of these averages, we can establish the situation of a country relatively to those of the group by calculating the following ratios:
Open_klit = Opnessit
opness ∗
klit
kl
Open_EPSit = Opnessit
opness ∗
EPSit
EPS
open_Rnit = Opnessit
opness ∗
Rnit
Rn
3.2.2.4. Corruption In regard to corruption, we use the opposite of the Corruption Perception Index. Several authors
analyze the effect of corruption on environmental policy. Callister (1999) [13] found the negative results of
corruption in the management and conservation of forests. Fredriksson and Millimet (2001) [14] assume that the
increase in the number of corrupt bureaucrats reduces the nominal value of each bribe and reduces the effects of
corruption. In a certain point, corruption would impact positively severity of environmental policy. Damania
(2002) [15] shows that an environmental regulation is ineffective with corrupt bureaucrats. Fredriksson and
Svensson (2003) [14] argue that corruption reduces the stringency of environmental regulations. Another
approach López and Mitra (2000) [16] show that whatever the type of interaction between the company and the government, to a level of per capita income, pollution levels are still above the socially optimal level when the
corruption exists. Pellegrini and Gerlagh (2005) [17] introduce corruption to explain the level of environmental
protection.
This indicator measures the degree to which the governments fight against corruption.
3.2.2.5. Political instability
We use a procedure quite similar to the precedent, the opposite of the political instability index.
Environmental Pollution and responsible factors in the Mediterranean area
DOI: 10.9790/5933-06116173 www.iosrjournals.org 66 | Page
3.2.2.6. Democracy
Several theoretical studies maintain that democracy is a determiner of environmental policy.
McCloskey (1983) [18], Payne (1995) [19]. Olson (1993) [20] emphasize that political liberties have an effect in favor of environment protection. Li & Reuveny (2006) [21] show that democracy reduces the degradation of the
environment. Deacon (1999) [22], who estimated the model of McGuire and Olson(1996) [23] maintain that the
size of leading walk of life would have a positive effect on supplying public goods as environment quality.
Torras and Boyce (1998) [24], Harbaugh and al. (2002) [25] find proof the positive effect of democracy on
environment. Democracy defined as citizen’s liberty (media liberty), availability of information about
environment degradation and capacity of manifesting against it (liberty of association and creation of pressure
groups). The indexes of Freedom house of liberties are measured on scale from 1 to 7, as 7 is the lowest degree
of liberty. We convert these indexes into a scale from 0 to 1, as 0 correspond to the lowest point of liberty. As
the sorting of liberties given by Freedom House is ordinal, it may appear normal to represent each of these seven
index numbers by nulls.
3.2.2.7. Net Income per Capital
The relation between the net income per capita and the environment quality has been the subject of
many studies. Revenue acts as an indicator economic activity. The increase of pollution is generated by the scale
and the structure of the economic activity. However, an increase in revenue provokes a rise in demand and
represents an influence on supply. The factors of supply and demand bring about pollution reduction. At weak
levels of revenues, households are more preoccupied with sustenance and other material needs rather than with
the environment quality. At higher levels of revenue, the households express preferences for environment
quality. Shafik (1994) [26], Holtz-Ekin and Solden (1995) [27] find a degrading monotone relation between the
pollutant emission and the revenue levels, Stern and Al (1996) [28] showed a non-monotone relation. Selden
and Song (1995) [29] maintain that the relation between the revenue and the demand of environment quality is
translated by a curve on J inversed.
3.2.2.8. The constant gross domestic product (GDP-2000)
We use the variable constant GDP to capture the scale effect. Many recent studies are drooping on the
lines between the economic prosperity and the carbonic footprint. as if it is logical to presume that an increase in
the production will lead to a rise of the emissions of pollutant, if we believe in the hypothesis that the inputs in
the composition of the basket of goods remain constant, we should find a positive relationship between the GDP
and the level of pollution.
3.2.2.9. Manufacturing sectors
Industry, additive value (% of GDP), the manufacturing sub-sectors: nutritious products, needs and
tobacco (% of the additive value in the manufacturing sectors), machines and material of transportation (% of
the additive value in the manufacturing sectors), textile and clothing (% of the additive value in the manufacturing sectors), other manufacturing industries (% of the additive value in the manufacturing sectors).
3.3. Economic strategies
The estimation by ordinary least-squares « OLS » of all stacked data presupposes the homogeneity of
countries, which can lead to biased estimation. The test of exogeneity of Fisher (table.3 in annex) rejects the
exogenous character of the variables EPS and CO2. There is a presence of endogeneity of the explained
variables. Thus, it is necessary to call for the technique of estimation of simultaneous equations model. The
condition of identification is satisfied and the system as a whole is over-identified. The hypothesis of different
error variance seemed the best adapted. For systems of equations with heteroscedastic errors, the generalized
methods of moments in system (GMM system) can be used to obtain efficient estimates of the parameters. The
technique of triple least squares with a fixed effect (3SLS/FE) doesn’t allow us, however, to consider the
problems of heteroscedasticity and autocorrelation that we often find in the model with the data of the panel type. So, we proceed the evaluation of the presence of these two types of problems. Consequently, the results
confirm us to a threshold of 95% the presence of heteroscedasticity and autocorrelation at the end of correcting
this problem that violates certain hypothesis, we would use the developed method of the generalized moment
with the system in two steps (GMM-system). This method allows the correction of heteroscedasticity and
autocorrelation
IV. Analysis Of The Results The impacts of the variables of the quality of the public and institutional performance are measured
through four different variables (AEM, DONGI, ISO, APR@care), since a strong correlation is given between

Environmental Pollution and responsible factors in the Mediterranean area
DOI: 10.9790/5933-06116173 www.iosrjournals.org 67 | Page
different indicators, our strategy consists of introducing them, at the end of determining the global impact of the
institutional orientations on the reducing CO2 emission. Finally, we have a synthetic sign of all indicators.
The results of the table in annex suggest that a best regulation of industrial activities reduces the CO2 emissions. And with the same logic, a good bureaucratic quality would contribute to reduce the CO2 emissions.
Thus, the effectiveness of environmental policies exercises a reducing effect on the emissions of CO2 for the
whole groups of Euro-Mediterranean countries under study (European developed countries, and Southern
Mediterranean developing countries).
We notice that our variables reflect the scale effect, the GDP have a positive sign as the anticipated
one, for three groups (group MEDA, groups of Arab-Mediterranean countries and European countries). This
variable is very significant, which, undoubtedly, confirm us the idea any increase in productions enlarge an
increase of emissions, all things are otherwise equal. The scale effect that is becoming higher in Arab countries
and less in the developed European countries. The combination of the two factors might be responsible for this
phenomenon:
1. The fact that industrial countries are engaged to ration out their emissions in a way that is more or less intensive, the developing countries are not engaged in the same way.
2. The industrial countries have, however, a historical responsibility in the material of emissions of CO2,
similarly, they have some of the best available technologies to reduce the emissions of CO2. Whereas, the
developing countries are the most principal responsible for the increase of emissions of CO2. As a result,
their energetic needs are strongly increasing, with the economic development and demographic dynamism.
This difference of the weight of sectors strongly pollutant, and this quality of production that we will
discuss.
The contribution of our study is to test these effects reported above, approaching the technique effect
through the index EPS (Environmental Stringency Policy). Regarding the result associated to the variable (EPS)
of the performance of environmental policy, it is very significant. It is very interesting to us that the coefficients
of « EPS » are negative, which can be explained by the planetary awareness of the damages caused by
pollution, the same as by the technological progress that allow to lower the costs of the reduction of pollution, and partly with the favorable change in the industrial structure. CO2 is a pollutant that its harmful effects are of
a universal order. Thus, with the intervention of supranational authorities and the multilateral deals, the state has
an incentive to lessen its emissions. Our results are the same as the ones found by Antweiler and al (2001) [30].
In respect of what concerns the sign associated to the proxy of effect, Antweiler and al Advanced that the sign of
coefficient of this ratio would be negative. The technique effect acts negatively and very strongly on pollution,
and largely dominates the scale effect and composition effect. To explain the relationship between pollution and
severity of the political environment, our study takes into consideration these three effects. We have tested for
different groups of countries.
In what concerns the institutional variables, we have taken into consideration corruption, political
instability and the democracy index. We note that corruption is a significantly negative determinant of the level
of requirement in the material of environment and in a similar way to Pelligrini and Gerlagh (2005) [17], Lopez
and Mitra (2000) [16]. According to Fredriksson and Millimet (2001) [14], the correlation is not monotone; the
shape of the curve is convex. After certain threshold of corruption, a new increase of corruption would give an
increase of the severity of the environmental policy. This result of hypotheses depends on the bureaucrats and
their constant number, which implies that the increase in the number of the corrupted bureaucrats decreases the
nominal value of every bribe, and consequently, reduces the effects of corruption. The negative impact of
corruption that we find in our study confirms the results of other authors Makdissi and Wodon (2003) [31],
Welsch (2004) [32], Fredrickson and Sevensson (2003) [33].
Political instability has a negative influence on the severity of the environmental policy as the
theoretical model predicated. Political instability and corruption reduce greatly the severity of the environmental
policy in the Southern Mediterranean countries. Pelligrini and Gerlagh (2005) [17] obtain also the same impact
by concluding that institutional disorder prevents the countries from having an effective implementation of their
environmental policy combined with increasing revenues.
In regard to democracy, it is positively related to the severity of the environmental policy. Democracy
relates citizens’ liberty, availability of information about environment degradation with the capacity of
protesting against it.
Concerning equation of the demand of emissions, given that the three effects of the growth can also be
as a result of trade, we test the robustness of our results by introducing the variable Openness (model 5 in table4
in annex). By comparing the models (3) and (5), we notice that the coefficient representing the scale effect increases slightly. Certain coefficients of sub-sectors manufacturers change of scope and even of significance,
only the coefficient of chemical industry stays the most robust. It is interesting that the addition of indicator
trade openness reduces, on one hand, significantly the impact of manufacturing sector upon the emissions of
CO2. We could explain this effect by the correlation between the trade openness and the industrial specialization

Environmental Pollution and responsible factors in the Mediterranean area
DOI: 10.9790/5933-06116173 www.iosrjournals.org 68 | Page
of the country. And increase, on the other hand, the scope of the indicator of the environmental policy severity.
Trade openness is supposed to affect the technology of production; the open countries are more effective in
terms of CO2 emissions reduction compared to closed countries. According to the estimation results, trade openness reduces the pollution of air in the European
countries (the columns; A to D) and increases air pollution in Arab-Mediterranean countries and group
(MEDA).
To explain better this, we test the hypothesis that the open rich countries are specialized in products
that can be fabricated properly, letting the open poor countries produce and sell products which necessitate
pollution. This hypothesis can be easily tested by adding the interaction between the openness and the revenue
per capita in our equation. If the rich countries profit of the trade by transferring the place of the pollution
creating activities towards the poor countries, interaction between openness and the revenue must have a
negative effect on pollution (model4). The results support moderately the pollution haven hypothesis, the
coefficient of the interactive term has been important for the developed countries. Interaction of the openness
with the revenue has a negative effect on pollution for developed countries and positive effect for Arab countries and for countries of group MEDA.
Again, if some Arab-Mediterranean countries have a comparative advantage in the sectors of Powerful
Intensity capital such as mining exploitation or heavy manufacturing, and that these sectors produce relatively
more pollution, then, trade liberalization can lead to increased pollution to countries Endowed with capital (have
much capital relative to labor) and reduced pollution to countries Endowed with labor.
We tested this version by including the interactive term opness-kl, the coefficient associated with this is
statistically significant and positive for developed countries abundant in capital (European), as expected they
lead to an increase in CO2 emissions And negative for the Arab-Mediterranean countries, which conforms the
results of Antweiler and al (2001) [30]. These justified that capital-intensive industries are generally polluting
and thus, capital accumulation is associated with an increase in pollution.
The estimated coefficient of the environmental policy rigor interacted with trade openness has a
significantly negative value for the European countries: the most strict environmental regulations lead to a reduction in polluting emissions when the countries trade more, environmental policy can also affect
comparative advantage. In other words, a country that implemented relatively strict environmental policy is
likely to have less of a comparative advantage in capital-intensive goods. In the case of Arab-Mediterranean
countries and MEDA group, the most stringent environmental regulations don’t lead to a reducing emission
when countries trade more.
We finish our empirical work using an alternative measure of comparative advantage. It is revealed
comparative advantage in five sectors of manufacturing production described in Table4 not surprisingly, the
results show that for european countries, the comparative advantages of the five sub-sectors of manufacturing
have an adverse environmental impact, In Table4 we reproduce the second and third column for each group
country separately. For european countries, with the exception of sub-sector machinery and transport
equipments and food industry which have shown a beneficial effect, all coefficients associated with the manufacturing sub-sector are significantly positive, indicating that specialization in its manufacturing sectors
leads to environmental degradation. For countries Arab-Mediterranean; the specialization in all manufacturing
sub-sectors has a negative environmental impact.
To conclude the test of our theoretical model, we find that the results similar results to those of de
Antweiler and Al (2001) [30].
In what concerns the existence of three effects (that we calculate, taking into account the change in
GDP in 2004 compared to 1995, the index of SPE and all coefficients sectors, and the multiplication of their
marginal effects, the model of elasticity, Table4 appended), the result of Scale effect and composition effect
increase the CO2 emissions, whereas the technique effect has a beneficial effect on the CO2 emissions, with an
important marginal impact. The results also show that the scale effect and the composition effect in
Mediterranean countries increase the industrial pollution of CO2 respectively of 105% and 62% (table5). While
the technique effect decreases it with a percentage of 196%, which signifies that the technical effect represented by the reaction of the industry at the severity of the environmental policy recompenses the two effects (scale
effect and composition effect). For the Arab- Mediterranean countries, we find that air pollution increase,
because of the rapid economic expansion. And that the scale effect is less rewarded by technique effect in the
Arab-Mediterranean countries comparing to developed countries. The projections are showing a kind of
aggravation of the air pollution, due to a composition effect negative (increase pollution to 99%) and the fact of
that the scale effect is not completely counterbalanced by the technique effect (the projected of the atmospheric
pollution of CO2 is imputable to the scale effect and the composition effect that is respectively estimated to
125% and 99%. while technical effects contributed to reducing CO2 emissions to 106%). So before anything, a
question of political will is obligatory to be raised in order to alleviate the impact of these emissions on the
environment. The scenario of the base corresponds to the unilateral elimination of obstacles related to commerce
Environmental Pollution and responsible factors in the Mediterranean area
DOI: 10.9790/5933-06116173 www.iosrjournals.org 69 | Page
in the Arab-Mediterranean countries; this would bring a profound structural change in the industry composition.
The polluted sectors and manufacturing industries would develop if the freeing of commerce is accompanied to
the hardening of the environmental regulation. The degradation of the environment could be avoided.
V. Conclusion It seems clear that the policy variable, with the exception of the democracy degree, contributes to the
environmental degradation, the results presented in this paper show that:
Firstly, the relationship between the political instability degree and the corruption degree and air
quality, as measured by the CO2 emission, is negative and very robust.
Secondly, we find evidence to support the specialization of the European countries in the sub-sector
machinery, transport equipment and food industry that lead to environmental degradation. On the contrary,
industrial specialization of Arab-Mediterranean countries in some manufacturing sectors has no significant effect and is accompanied by an environmental burden.
Thirdly, we test the effects. The results showed that the technique effect as approached by the index of
the strictness of environmental regulation dominates the scale effect and the composition effect in the
Mediterranean Region (1.96% against 1.67%). simulations indicate that the effects associated with several
economic variables (GDP, industrial sub-sectors in the economy, Textiles, chemicals, and machinery)
negatively affect the environment. The scale effect is greater than the substitution effect because the southern
countries don’t implement effective environmental policies. Thus, the scale effect in countries of South (125%)
is highly superior to the one in the countries of the Northern-Med (35%). The analysis also reveals that the
environmental performance due to the structure effect in the country Nord-Mediterranean might be explained by
the technological modernisation of its industries, the industrial structure change that took a form of an increase
in proper sector.
References [1]. I. Walter and J. Ugelow, Environmental Policies in Developing Countries, Ambio, 8, 1979,102-109.
[2]. P. Dasgupta, Optimal Development and the Idea of Net National Product, 1995, in Goldin I., Winters L. A., The Economics of
Sustainable Development, Cambridge University Press.
[3]. C. Van Beers and J. Van Den Bergh, An Empirical Multi-Country Analysis of the impact of Environmental Regulations on Foreign
Trade Flows, Kyklos, 50(1), 1997, 29-46.
[4]. N. Birdsall and D. Wheeler, Trade policy and industrial pollution in Latin America: Where are the pollution havens? In P, Low,
(ed.), International Trade and the Environment, World Bank Discussion Papers 159, The World Bank, 1992, Washington, D.C.
[5]. P. Eliste and P.G. Fredriksson, Environmental Regulations, Transfers, and Trade: Theory and Evidence, Journal of Environmental
Economics and Management, 43(2), 2002, 234–250.
[6]. J. Ederington, A. Levinson, J. Minier, Footloose and Pollution-Free, Working Paper, 9718, 2003.
[7]. S. Cagatay and H. Mihci, Industrial Pollution, Environmental Suffering and Policy Measures: An Index of Environmental
Sensitivity Performance (IESP), Journal of Environmental Assessment Policy and Management, 5(2), 2003, 245-205.
[8]. N. Zugravu, K. Millock and G. Duchene, La dépollution dans les Pays en Transition est-elle volontaire? Le cas des émissions
industrielles de carbone, CES Working Papers, 0143448, 2007.
[9]. S. Dasgupta, B. Laplante and N. Mamingi, Pollution and capital markets in developing countries. Journal of Environmental
Economics and Management. 42, 2001, 310- 335, (consulted 01 June 2013). URL:
http://digilib.itb.ac.id/files/JBPTITBCHE/disk1/49/jbptitbche-gdl-jou-2004-susmitadas-2434-pollutio-s.pdf.
[10]. B. K. Smarzynska and S-J Wei, Pollution havens and foreign direct investment: Dirty secret or popular myth? National Bureau of
Economic Research. Working paper series 8465, 2004, (consulted 15 april 2012), URL: http://www.nber.org/papers/w8465.pdf
[11]. B. Van Pottelsberghe de la Potterie, Issues in Assessing the Effect of Interindustry R&D Spillovers, Economic Systems Research,
Taylor and Francis Journals, vol 9(4), 1997, 331-356.
[12]. J. Benhabib and M. Spiegel, The role of human capital in economic development evidence from aggregate cross-country data.
Journal of Monetary Economics, vol 34(2), 1994, 143-173, (consulted 05 June 2013). URL:
http://econ.as.nyu.edu/docs/IO/9391/RR92-46.pdf .
[13]. D. Callister, Corrupt and Illegal Activities in the Forestry Sector: Current Understandings and Implications for World Bank Forest
Policy,1999, (consulted 13 June 2013), URL: http://siteresources.worldbank.org/EXTFORESTS/Resources/985784-
1217874560960/Callister.pdf
[14]. P.G. Fredriksson and D.L. Millimet, Bureaucratic corruption and environmental policy: Theory and evidence from the United
States, 2001, (consulted 13 January 2012) http://faculty.smu.edu/Millimet/pdf/uscorrupt.pdf.
[15]. R. Damania, P.G. frediriksson and M. mania, The persistence of corruption and regulatory compliance failures: theory and evidence
international monetary fund working paper,(03),172, 2002 (consulted 06 July 2013). URL:
http://www.imf.org/external/pubs/ft/wp/2003/wp03172.pdf
[16]. L. Pelligrini and R. Gerlagh, An Empirical Contribution to the Debate on Corruption, Democracy and Environmental Policy, FEEM
Working, 8, 2005,
[17]. D.N. McCloskey, Rhetoric of economics, Journal of economic literature, vol, XXI, 1983, 481-517.
[18]. R.A. Payne, Freedom and the Environment, Journal of Democracy, 6(3), 1995, 41-55.
[19]. M. Olson, Dictatorship, Democracy, and Development, The American Political Science Review, 87(3), 1993, 567-576.
[20]. Q. Li and R. Reuveny, Democracy and environmental degradation, International Studies Quarterly, 50, 2006, 935-956.
[21]. R.T. Deacon, Dictatorship, Democracy, and the Provision of Public Goods. 1999, (consulted 13 March 2013),
http://www.econ.ucsb.edu/papers/wp20-03.pdf.
[22]. M. McGuire and M. Olson, The Economics of Autocracy and Majority Rule: The Invisible Hand and the Use of Force, Journal of
Economic Literature, 34, 1996, 72-96.
Environmental Pollution and responsible factors in the Mediterranean area
DOI: 10.9790/5933-06116173 www.iosrjournals.org 70 | Page
[23]. M. Torras and J. K. Boyce, Income, inequality, and pollution: A reassessment of the environmental Kuznets curve, Ecological
Economics, 25, 1998, 147–160.
[24]. W. Harbaugh, A. Levinson and D.M. Wilson, Re-examining the empirical evidence for an environmental Kuznets Curve. The
Review of Economics and Statistics 84(3), 2002, 541-551, (consulted 05 March 2011),
http://faculty.georgetown.edu/aml6/pdfs&zips/EKC%20paper.pdf.
[25]. N. Shafik, Economic Development and Environmental Quality: An Econometric Analysis, Oxford Economic Papers, New Series,
Vol, 46, Special Issue on Environmental Economics, 1994, 757-773.
[26]. D. Holtz-Eakin and T.M. Selden, Stoking the fires? CO2 emissions and economic growth. Journal of Public Economics, vol, 57,
1992, 85-101, (consulted 11 September 2010) , URL : http://www.nber.org/papers/w4248.pdf
[27]. D. I. Stern, M.S. Common and E.B. Barbier, Economic growth and environmental degradation: The environmental Kuznets curve
and sustainable development, World Dev, 24, 1996, 1151–1160.
[28]. T. Selden and D. Song, Neoclassical Growth, the J Curve for Abatement, and the Inverted U Curve for Pollution, Journal of
Environmental Economics and Management, 29, 1995, 162-168.
[29]. W. Antweiler, B.R. Copeland and M.S. Taylor, Is Free Trade Good for the Environment? , American Economic Review, 91(4),
877-908, 2001, (consulted 09 July 2013), URL:
http://www.cer.ethz.ch/resec/teaching/seminar_aussenwirtschaft_wt_04_05/antweiler_copeland_taylor_AER.pdf.
[30]. R. López and S. Mitra, Corruption, Pollution, and the Kuznets Environment Curve, Journal of Environmental Economics and
Management, 40(2), 2000 , 137-150.
[31]. P. Makdissi and Q. Wodon, Corruption, Inequality and Environmental Regulation, Université de Sherbrooke Working Papers, 2003,
03-04.
[32]. H. Welsch, Corruption, Growth, and the Environment: A Cross-Country Analysis, Environment and Development Economics, 9,
2004, 663-693.
[33]. P.G. Fredriksson and J. Svensson, Political Instability, Corruption and Policy Formation: The Case of Environmental Policy,
Journal of Public Economics, 87, 2003, 1383-1405.
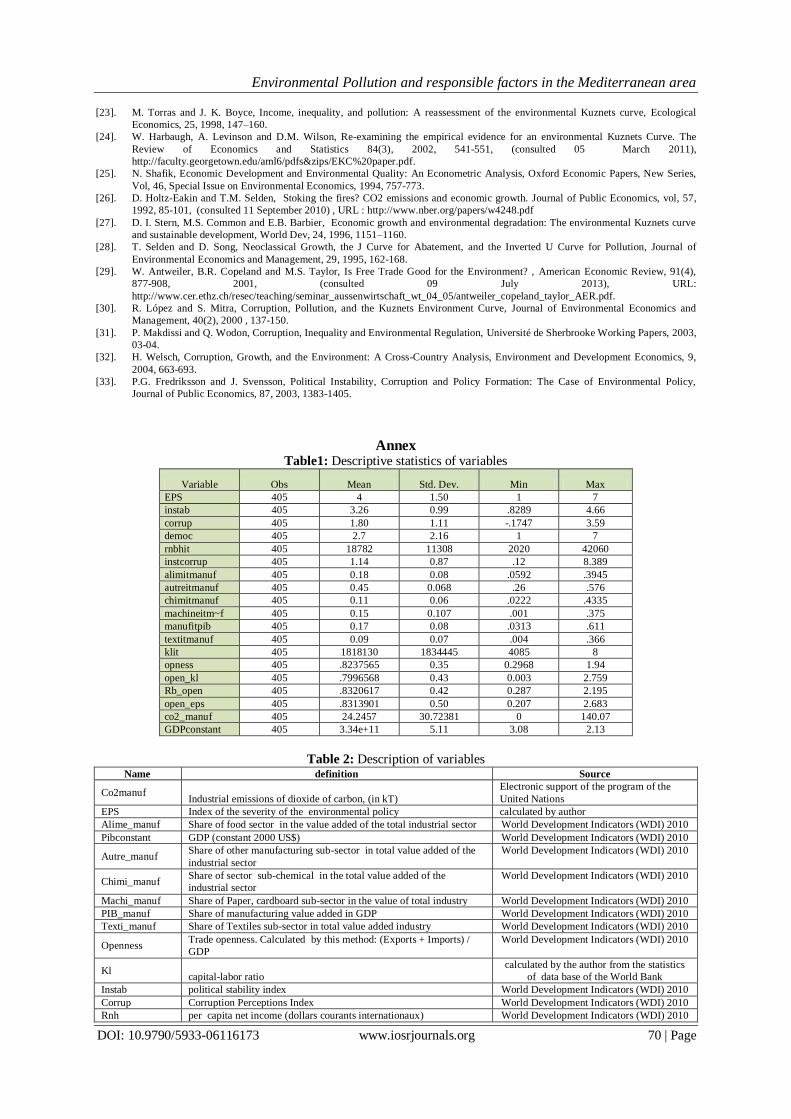
Annex Table1: Descriptive statistics of variables
Variable Obs Mean Std. Dev. Min Max
EPS 405 4 1.50 1 7
instab 405 3.26 0.99 .8289 4.66
corrup 405 1.80 1.11 -.1747 3.59
democ 405 2.7 2.16 1 7
rnbhit 405 18782 11308 2020 42060
instcorrup 405 1.14 0.87 .12 8.389
alimitmanuf 405 0.18 0.08 .0592 .3945
autreitmanuf 405 0.45 0.068 .26 .576
chimitmanuf 405 0.11 0.06 .0222 .4335
machineitm~f 405 0.15 0.107 .001 .375
manufitpib 405 0.17 0.08 .0313 .611
textitmanuf 405 0.09 0.07 .004 .366
klit 405 1818130 1834445 4085 8
opness 405 .8237565 0.35 0.2968 1.94
open_kl 405 .7996568 0.43 0.003 2.759
Rb_open 405 .8320617 0.42 0.287 2.195
open_eps 405 .8313901 0.50 0.207 2.683
co2_manuf 405 24.2457 30.72381 0 140.07
GDPconstant 405 3.34e+11 5.11 3.08 2.13
Table 2: Description of variables Name definition Source
Co2manuf
Industrial emissions of dioxide of carbon, (in kT)
Electronic support of the program of the
United Nations
EPS Index of the severity of the environmental policy calculated by author
Alime_manuf Share of food sector in the value added of the total industrial sector World Development Indicators (WDI) 2010
Pibconstant GDP (constant 2000 US$) World Development Indicators (WDI) 2010
Autre_manuf Share of other manufacturing sub-sector in total value added of the
industrial sector
World Development Indicators (WDI) 2010
Chimi_manuf Share of sector sub-chemical in the total value added of the
industrial sector
World Development Indicators (WDI) 2010
Machi_manuf Share of Paper, cardboard sub-sector in the value of total industry World Development Indicators (WDI) 2010
PIB_manuf Share of manufacturing value added in GDP World Development Indicators (WDI) 2010
Texti_manuf Share of Textiles sub-sector in total value added industry World Development Indicators (WDI) 2010
Openness Trade openness. Calculated by this method: (Exports + Imports) /
GDP
World Development Indicators (WDI) 2010
Kl
capital-labor ratio
calculated by the author from the statistics
of data base of the World Bank
Instab political stability index World Development Indicators (WDI) 2010
Corrup Corruption Perceptions Index World Development Indicators (WDI) 2010
Rnh per capita net income (dollars courants internationaux) World Development Indicators (WDI) 2010

Environmental Pollution and responsible factors in the Mediterranean area
DOI: 10.9790/5933-06116173 www.iosrjournals.org 71 | Page
Democ
In fact, it is the average of two variables Freedom House "political
rights" and "civil liberties", it was converted to a dummy variable
taking the value 1 if the country is considered democratic and 0 if
not.
Base of Freedom House
Kl_open Interaction term between trade openness and the capital stock / labor
ratio
Calculated by the author
Rh_open Interaction term between trade openness and per capita net income Calculated by the author
Open_eps Interaction term between trade openness and the index of the severity
of the environmental policy
Calculated by the author
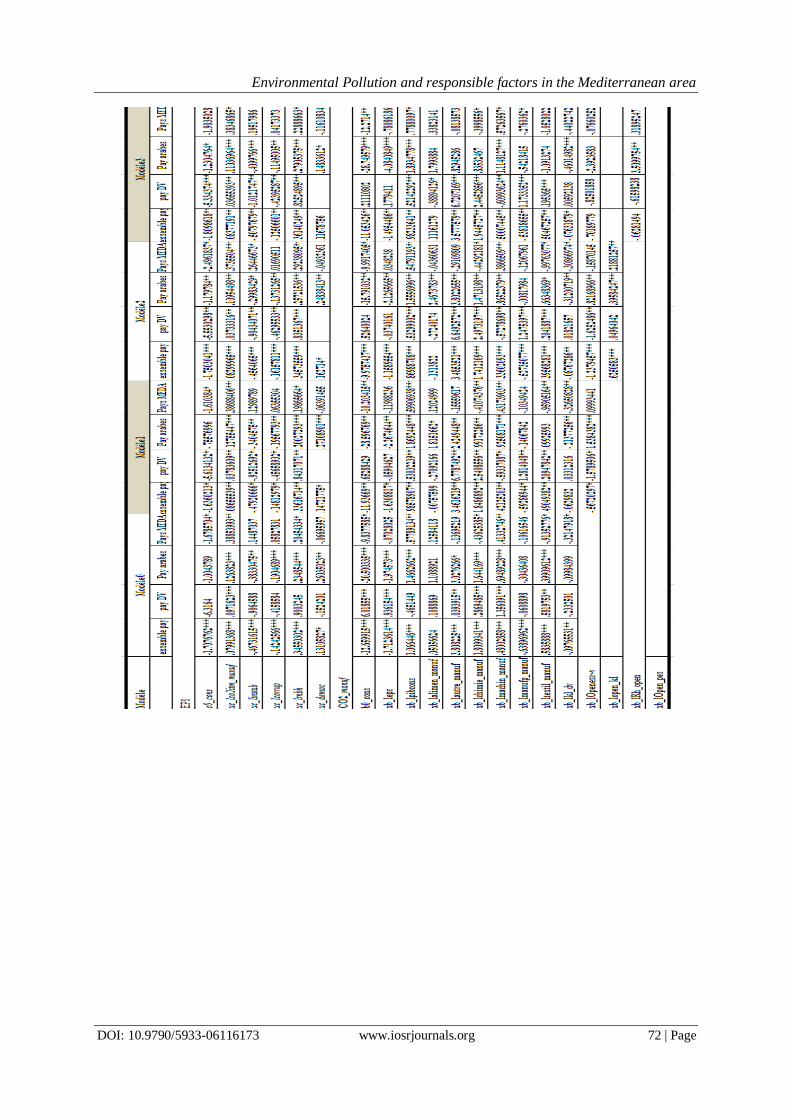
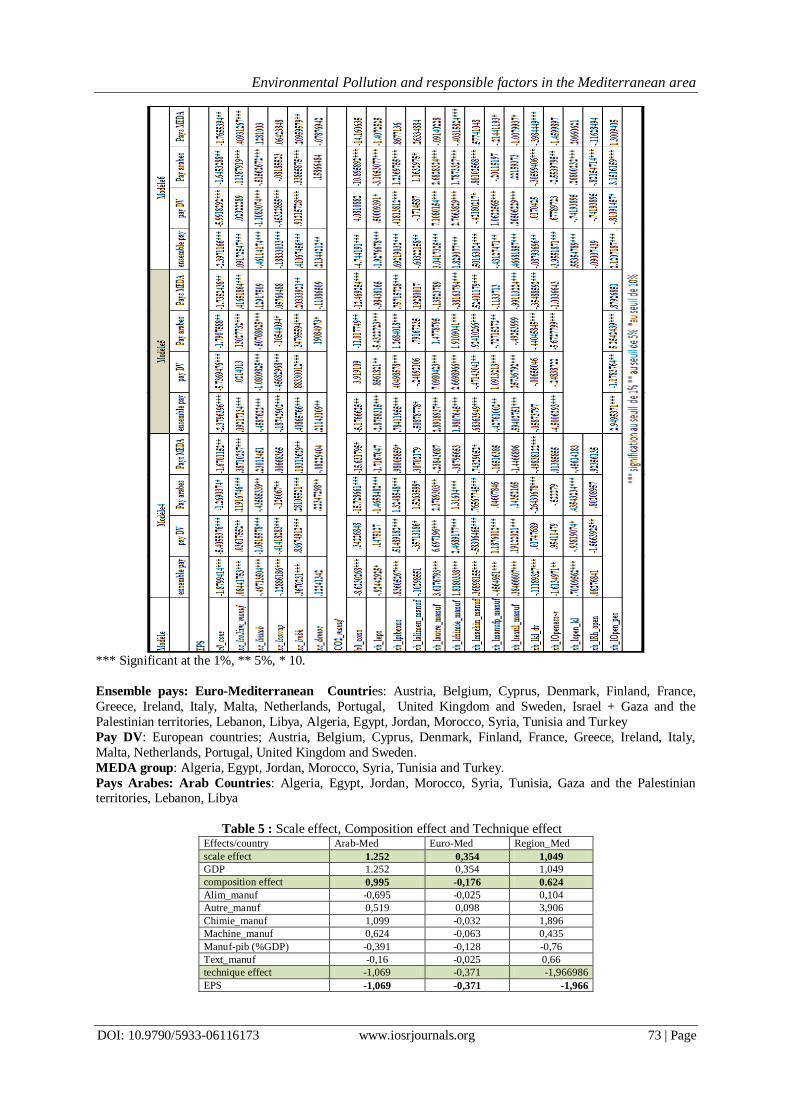
Table 4: Model estimation by GMM-system of the group; Mediterranean countries, European
Countries, Arab-Mediterranean, MEDA group
Environmental Pollution and responsible factors in the Mediterranean area
DOI: 10.9790/5933-06116173 www.iosrjournals.org 72 | Page
Environmental Pollution and responsible factors in the Mediterranean area
DOI: 10.9790/5933-06116173 www.iosrjournals.org 73 | Page
*** Significant at the 1%, ** 5%, * 10.
Ensemble pays: Euro-Mediterranean Countries: Austria, Belgium, Cyprus, Denmark, Finland, France,
Greece, Ireland, Italy, Malta, Netherlands, Portugal, United Kingdom and Sweden, Israel + Gaza and the
Palestinian territories, Lebanon, Libya, Algeria, Egypt, Jordan, Morocco, Syria, Tunisia and Turkey
Pay DV: European countries; Austria, Belgium, Cyprus, Denmark, Finland, France, Greece, Ireland, Italy,
Malta, Netherlands, Portugal, United Kingdom and Sweden.
MEDA group: Algeria, Egypt, Jordan, Morocco, Syria, Tunisia and Turkey.
Pays Arabes: Arab Countries: Algeria, Egypt, Jordan, Morocco, Syria, Tunisia, Gaza and the Palestinian territories, Lebanon, Libya
Table 5 : Scale effect, Composition effect and Technique effect Effects/country Arab-Med Euro-Med Region_Med
scale effect 1.252 0,354 1,049
GDP 1.252 0,354 1,049
composition effect 0,995 -0,176 0.624
Alim_manuf -0,695 -0,025 0,104
Autre_manuf 0,519 0,098 3,906
Chimie_manuf 1,099 -0,032 1,896
Machine_manuf 0,624 -0,063 0,435
Manuf-pib (%GDP) -0,391 -0,128 -0,76
Text_manuf -0,16 -0,025 0,66
technique effect -1,069 -0,371 -1,966986
EPS -1,069 -0,371 -1,966
Environmental Pollution and responsible factors in the Mediterranean area
DOI: 10.9790/5933-06116173 www.iosrjournals.org 74 | Page
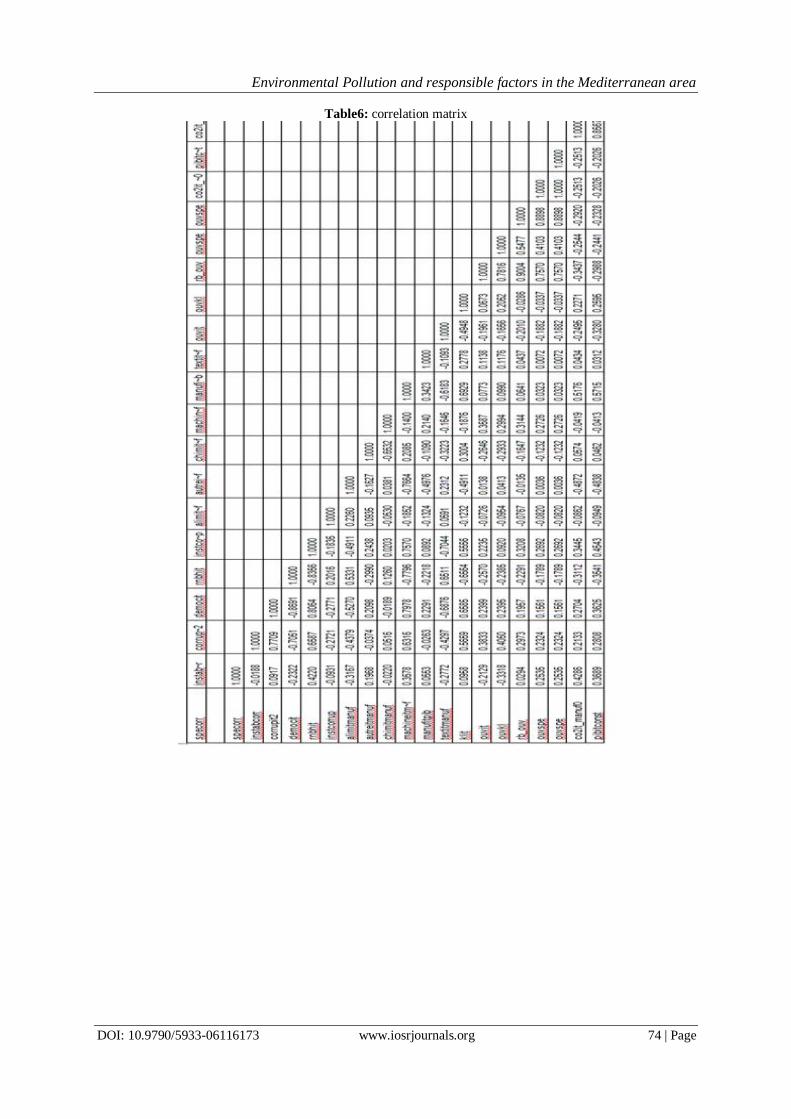
Table6: correlation matrix